Article

Complete Chloroplast Genome Sequence of Endangered Species in the Genus Opisthopappus C. Shih: Characterization, Species Identification, and Phylogenetic Relationships

Key Laboratory of Chinese Medicine Resources Conservation, State Administration of Traditional Chinese Medicine of the People’s Republic of China, Institute of Medicinal Plant Development, Chinese Academy of Medical Sciences. Peking Union Medical College, Beijing 100193, China
*
Author to whom correspondence should be addressed.
Genes 2022, 13(12), 2410; https://doi.org/10.3390/genes13122410
Submission received: 15 November 2022 / Revised: 6 December 2022 / Accepted: 12 December 2022 / Published: 19 December 2022
(This article belongs to the Section Cytogenomics)

Abstract

:
Opisthopappus C. Shih is a rare genus of the Asteraceae family native to the Taihang Mountains in China. Due to the narrow distribution area, poor reproduction ability and human harvesting, Opisthopappus is threatened by extinction. However, the limited genetic information within Opisthopappus impede understanding of the conservation efforts and bioprospecting. Therefore, in this study, we reported the complete chloroplast (cp) genome sequences of two Opisthopappus species, including Opisthopappus taihangensis and Opisthopappus longilobus. The cp genomes of O. taihangensis and O. longilobus were 151,117 and 151,123 bp, which contained 88 protein-coding genes, 37 tRNA genes, and 8 rRNA genes. The repeat sequences, codon usage, RNA-editing sites, and comparative analyses revealed a high degree of conservation between the two species. The ycf1 gene was identified as a potential molecular marker. The phylogenetic tree demonstrated that O. longilobus was a separate species and not a synonym or variety of O. taihangensis. The molecular clock showed that two species diverge over a large time span, O. longilobus diverged at 15.24 Mya (Million years ago), whereas O. taihangensis diverged at 5.40 Mya We found that Opisthopappus and Ajania are closely related, which provides new ideas for the development of Opisthopappus. These results provide biological information and an essential basis to understand the evolutionary history of the Opisthopappus species, which will aid in the future the bioprospecting and conservation of endangered species.

1. Introduction

Opisthopappus C. Shih belonging to the family Asteraceae was generally considered as including two species O. taihangensis and O. longilobus [1], and it is native to the Taihang Mountains in China, growing on the cliffs at an altitude of 1000 m [2,3]. The species of this genus are rich in phenolic compounds and flavonoids and have been consumed as medicine and food in the origin areas [4]. Based on the narrow distribution area, poor reproduction ability and human harvesting, Opisthopappus is now in an endangered state and has been listed as a rare and endangered species [5]. Furthermore, the species classification within Opisthopappus is not clear. According to the morphological and molecular evidence, O. taihangensis and O. longilobus were previously classified as the same species [6]. The phylogenetic relationships between these two species were unclear due to limited resolving power of morphological methods and detection capacity of unique nuclear gene sequences [7].
In green plants, cp plays an important role in photosynthesis [8]. The cp genomes show high conservatism regarding genome size, structure, gene content, and organization [9,10]. Therefore, the cp genome has been used as an ideal technology for the investigation of phylogenetic analyses, plant molecular identification, and genetic diversity evaluation. Recently, the whole cp genome sequences can be used as a plant super-barcode for discriminating closely related species in some taxa [11,12]. However, there are few available on the cp genome of Opisthopappus, only the cp of O. taihangensis has been sequenced [13], and the cp genome information is still missing in O. longilobus. In addition, the comparative genomics within the genus Opisthopappus have not been studied, which limits the phylogenetic and genetic diversity studies in this genus.
In this study, the complete cp genomes of two Opisthopappus species were sequenced and annotated for the first time. We analyzed the general characteristics and compared the structural characteristics to determine the origin and phylogenetic relationships. These results provide abundant genetic information of the genus Opisthopappus and formulate effective conservation and molecular identification approaches for the crucial and endangered medicinal plants.
In this study, the complete cp genomes of two Opisthopappus species were sequenced and annotated. We analyzed the general characteristics and compared the structural characteristics to determine the origin and phylogenetic relationships. The results of this study will provide abundant genetic information on the genus Opisthopappus and formulate effective conservation and molecular identification approaches for the crucial and endangered medicinal plants.

2. Materials and Methods

2.1. Plant Materials, DNA Extraction, and Sequencing

The fresh leaves of O. taihangensis and O. longilobus were collected from Xinxiang City (Henan, China, 35°43′ N, 113°36′ E) on 20 August 2020, which were identified by Professor Linfang Huang. Specimen of the two Opisthopappus species were stored at the Herbarium of the Chinese Academy of Medical Science & Peking Union Medicinal College, accession numbers: 20200820A1 and 20200820A2. Total DNA was extracted using the CTAB (cetyltrimethyl ammonium bromide) method [14]. The DNA sequencing was performed using the Illumina NovaSeq system (Illumina, San Diego, CA, USA).

2.2. Cp genome Assembly and Annotation

The cp genomes were assembled from clean reads using NOVOPlasty v.3.8.3 [15], and then, the assembled file was annotated by CpGAVAS2 web service (accessed on 20 May 2022) [16]. The tRNA genes were identified using tRNAscan-SE program v.1.3.1 [17]. The annotated whole genome sequences were submitted to GenBank (accession numbers: MZ779049, MZ779050). Finally, circular maps of cp genomes were drawn by the OGDRAW program [18].

2.3. Repeat Element Analysis

The repeat sequences were performed using CPGAVAS2 web service. Tandem repeats were identified by Tandem Repeats Finder v.4.09 [19], with specific screening parameters of 2 for matches and 7 for mismatches and indels. The similarity cutoff value among the repeat units was set at 70%. The simple sequence repeat (SSR) was predicted using MISA (https://webblast.ipkgatersleben.de/misa/) (accessed on 25 May 2022) [20]. The scattered repetitive sequences were identified by Vmatch (http://www.vmatch.de) (accessed on 31 May 2022). The location and size of repeat sequences were recognized using REPuter (https://bibiserv.cebitec.uni-bielefeld.de/reputer) (accessed on 25 May 2022) [21].

2.4. Codon Usage and RNA-Editing Sites Analysis

Phylosuite v.1.2.2 was used to extract the protein-coding genes, and then, CodonW v.1.4.2 was used to calculate codon usage and relative synonymous codon usage (RSCU) values [22,23]. Lastly, the RSCU values were displayed in the form of a heatmap by TBtools software v.1.6 [24].
In addition, the predictive RNA Editor for Plants (PREP) suite was used at the cutoff value of 0.8 to analyze the potential RNA editing sites in the protein-coding genes of the cp genomes [25,26].

2.5. Phylogenetic and Divergence Time Analysis

In total, 20 complete cp genomes of subtribe Chrysantheminae were downloaded from the NCBI for phylogenetic analysis. In addition, Xanthium spinosum (NC_054222) was used as the outgroup. These cp genome sequences were aligned by MAFFT v. 7.307 [27]. Subsequently, the alignment was conducted with the maximum likelihood (ML) method using RAxML v. 8.2.4 [28]. The detailed parameters were set to “raxmlHPC-PTHREADS-SSE3 -fa -N 1000 -m GTRGAMMA -x 551314260 -p 551314260 -o Xanthium_spinosum_NC_054222 -T 20”. The reliability of the phylogenetic tree was assessed using bootstrap method with 1000 replications.
The molecular clock tree was constructed using MEGA based on an ML method to estimate the origin and divergence times of Opisthopappus and related genus [29]. The relevant divergence times can be found in the TimeTree Resource database (http://www.timetree.org/) (accessed on 25 May 2022) [30]. Furthermore, X. spinosum was selected as outgroup of the phylogeny. The temporal constraints were derived from the TimeTree Resource. NODE TIME found the divergence time between two genera.

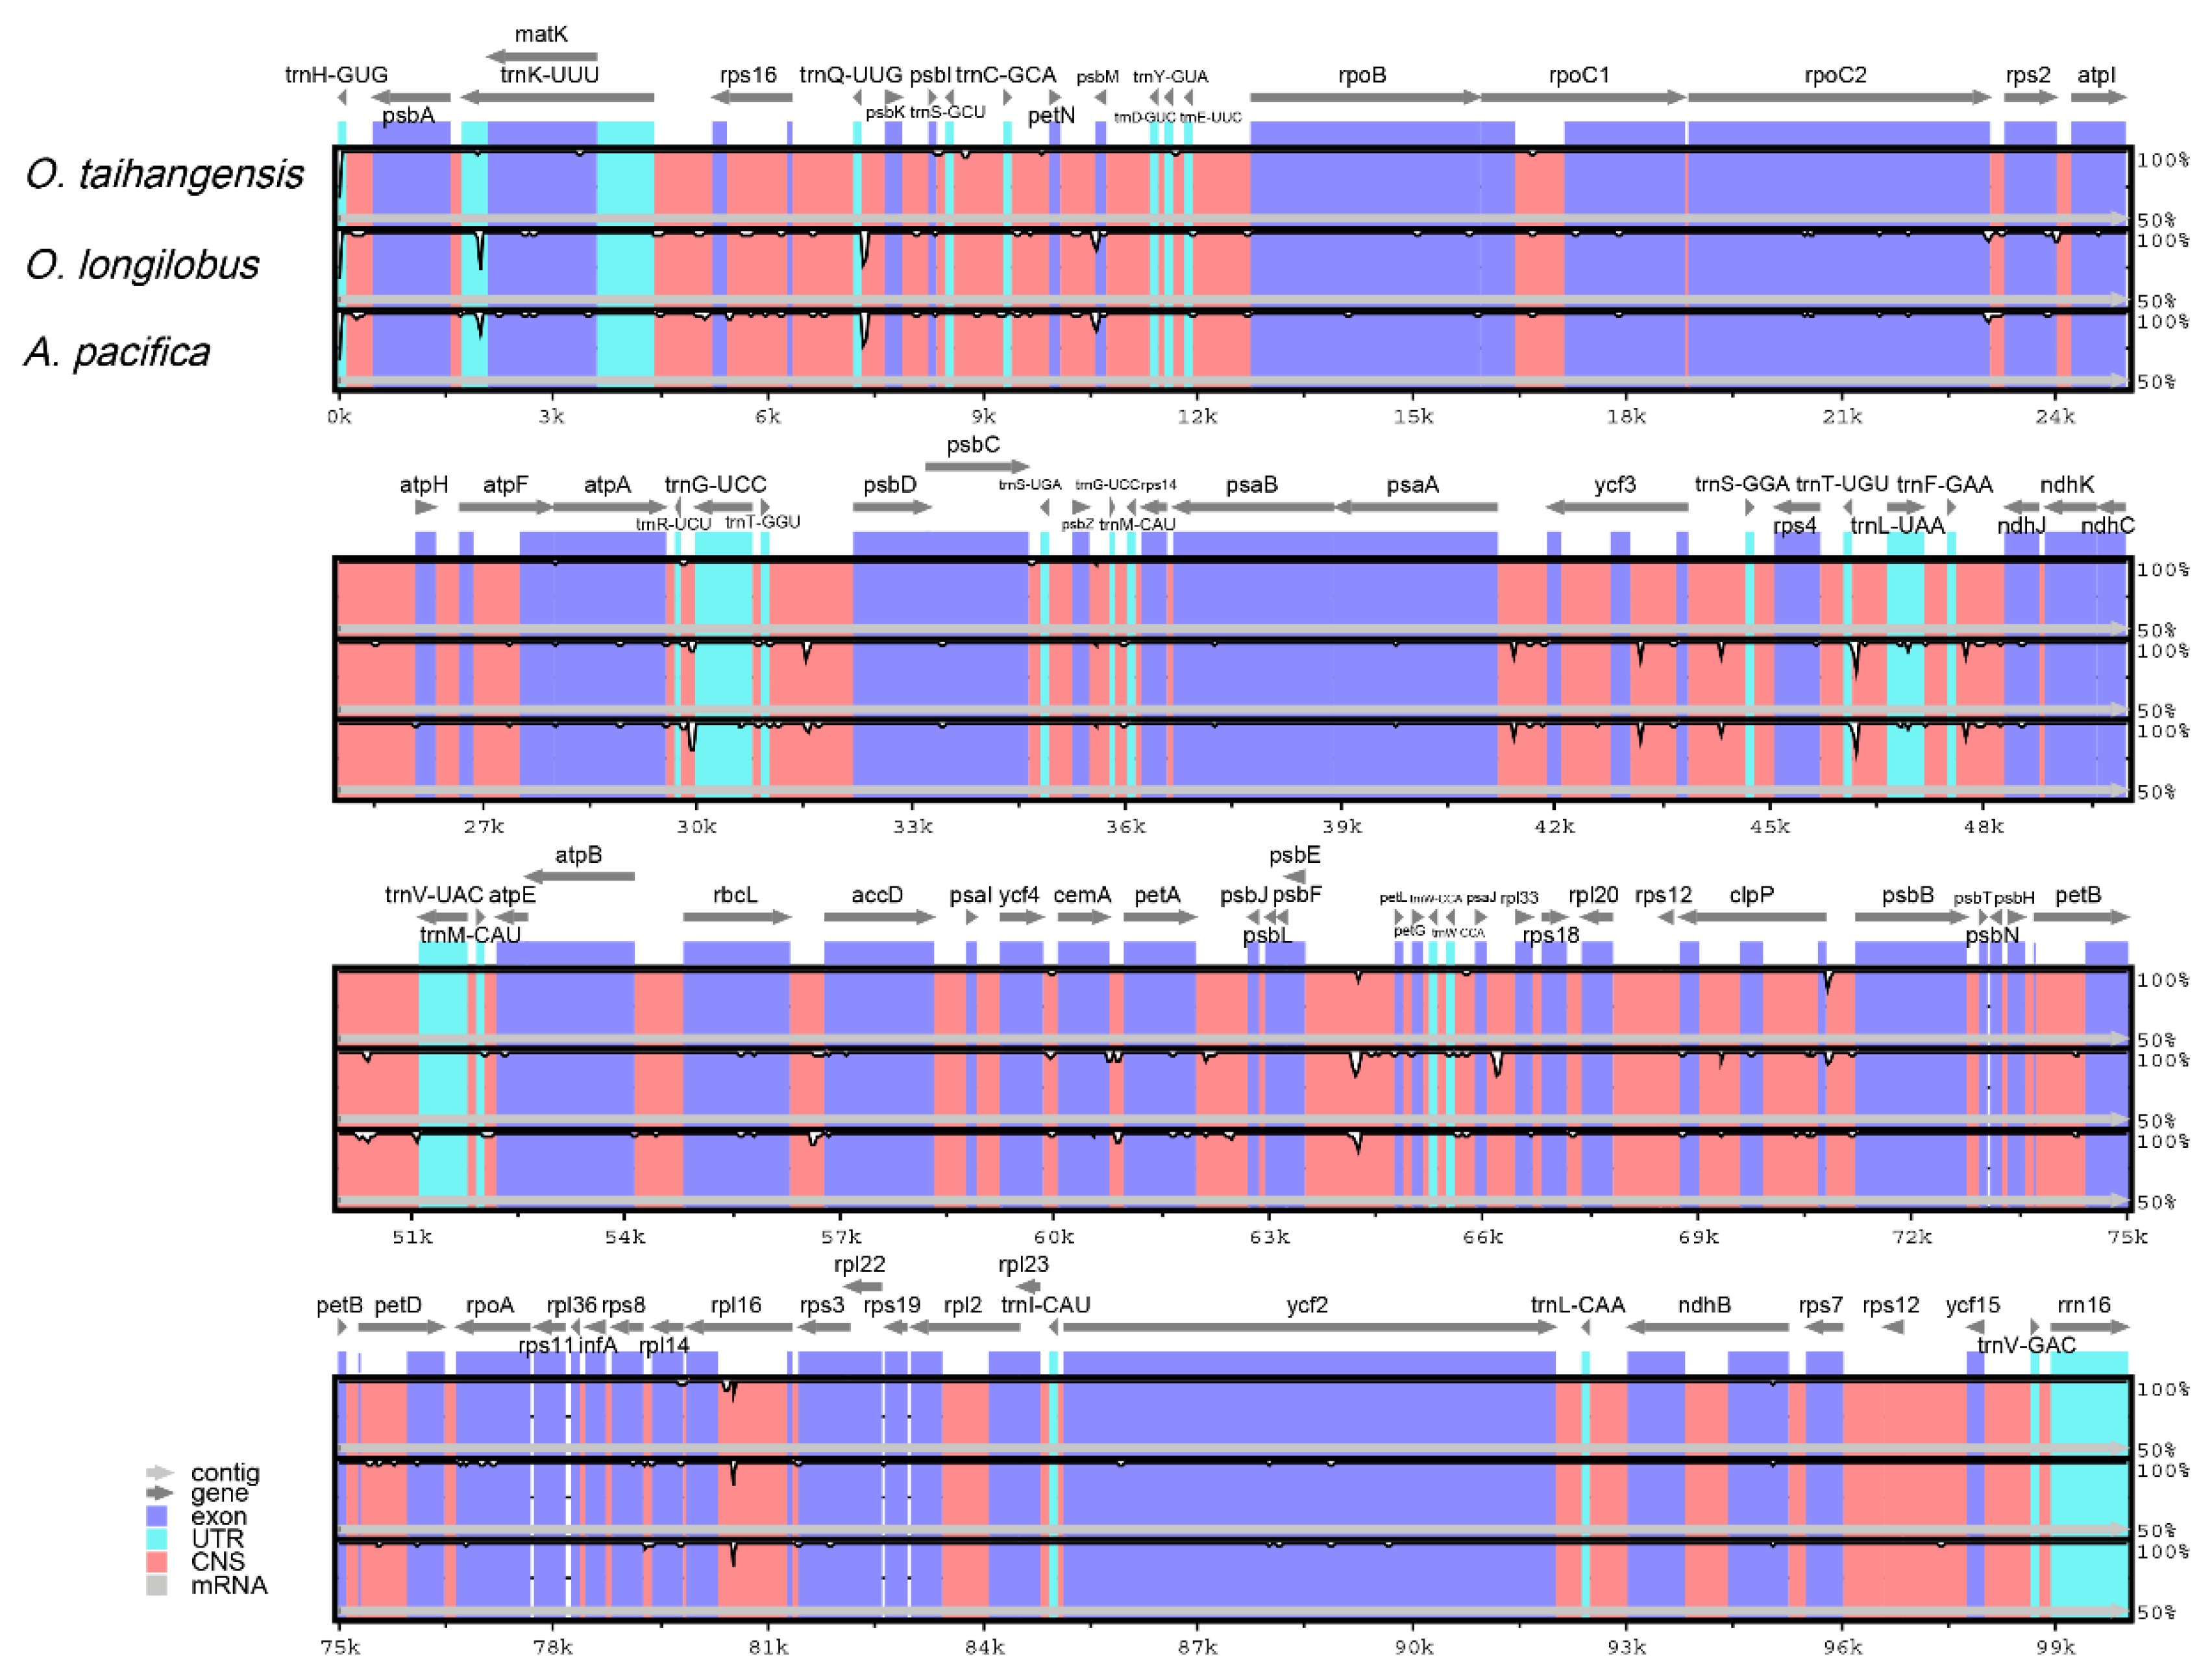
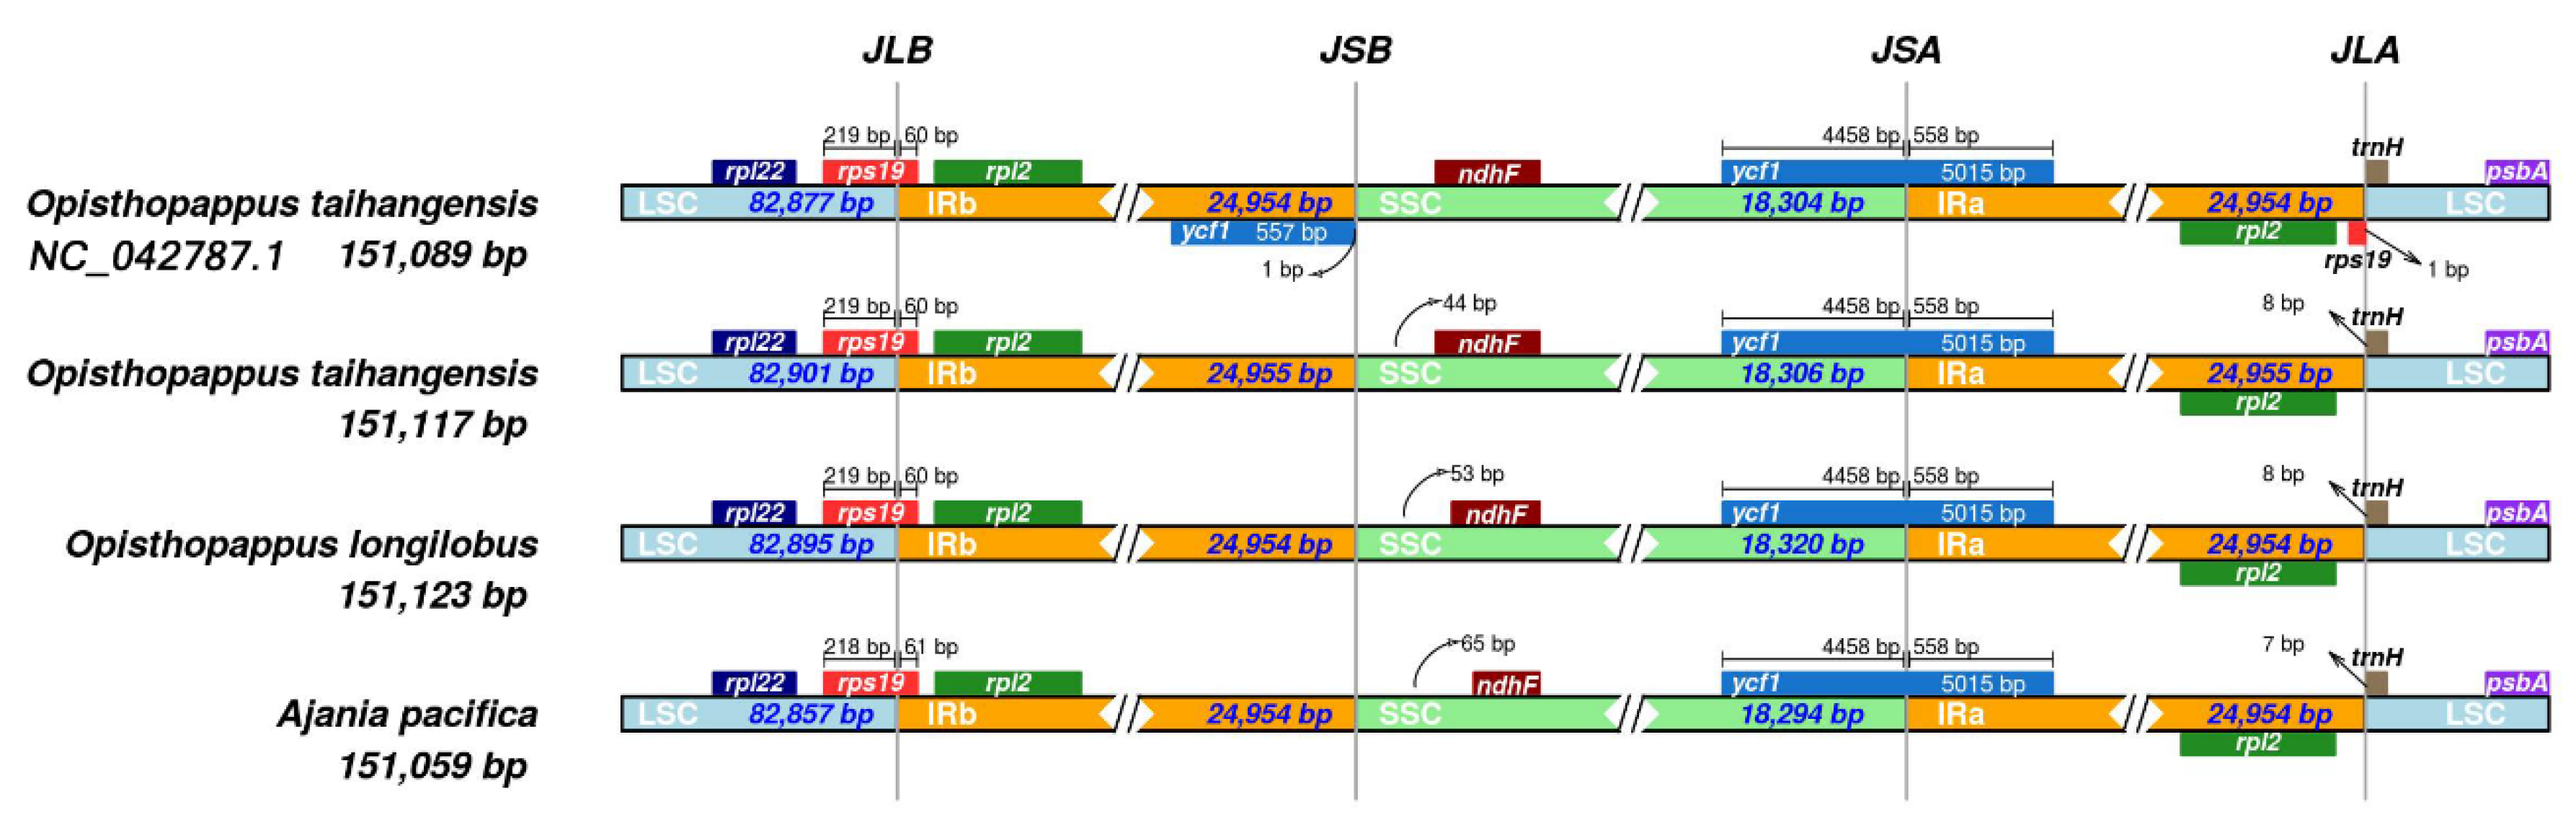
2.6. Genome Comparison

Sliding window analysis was conducted to assess the nucleotide diversity (Pi) values of the cp genomes by DnaSP v6 (window length = 1000 bp, step size = 300 bp). The four complete cp genome sequences (O. taihangensis (NC_042787), O. taihangensis, O. longilobus, and Ajania pacifica (Nakai) K. Bremer et Humphries (NC_050690)) were compared by mVISTA (http://genome.lbl.gov/vista/mvista/) (accessed on 28 May 2022) [31]. The cp genome sequence of O. taihangensis (NC_042787) was downloaded from NCBI and used as a reference sequence for annotation [13]. Furthermore, the cp genetic architecture in LSC/IRs and SSC/IRs borders of four species were identified and compared using IRscope (http://genocat.tools/tools/irscope.html) (accessed on 28 May 2022) [32].

3. Results and Discussion

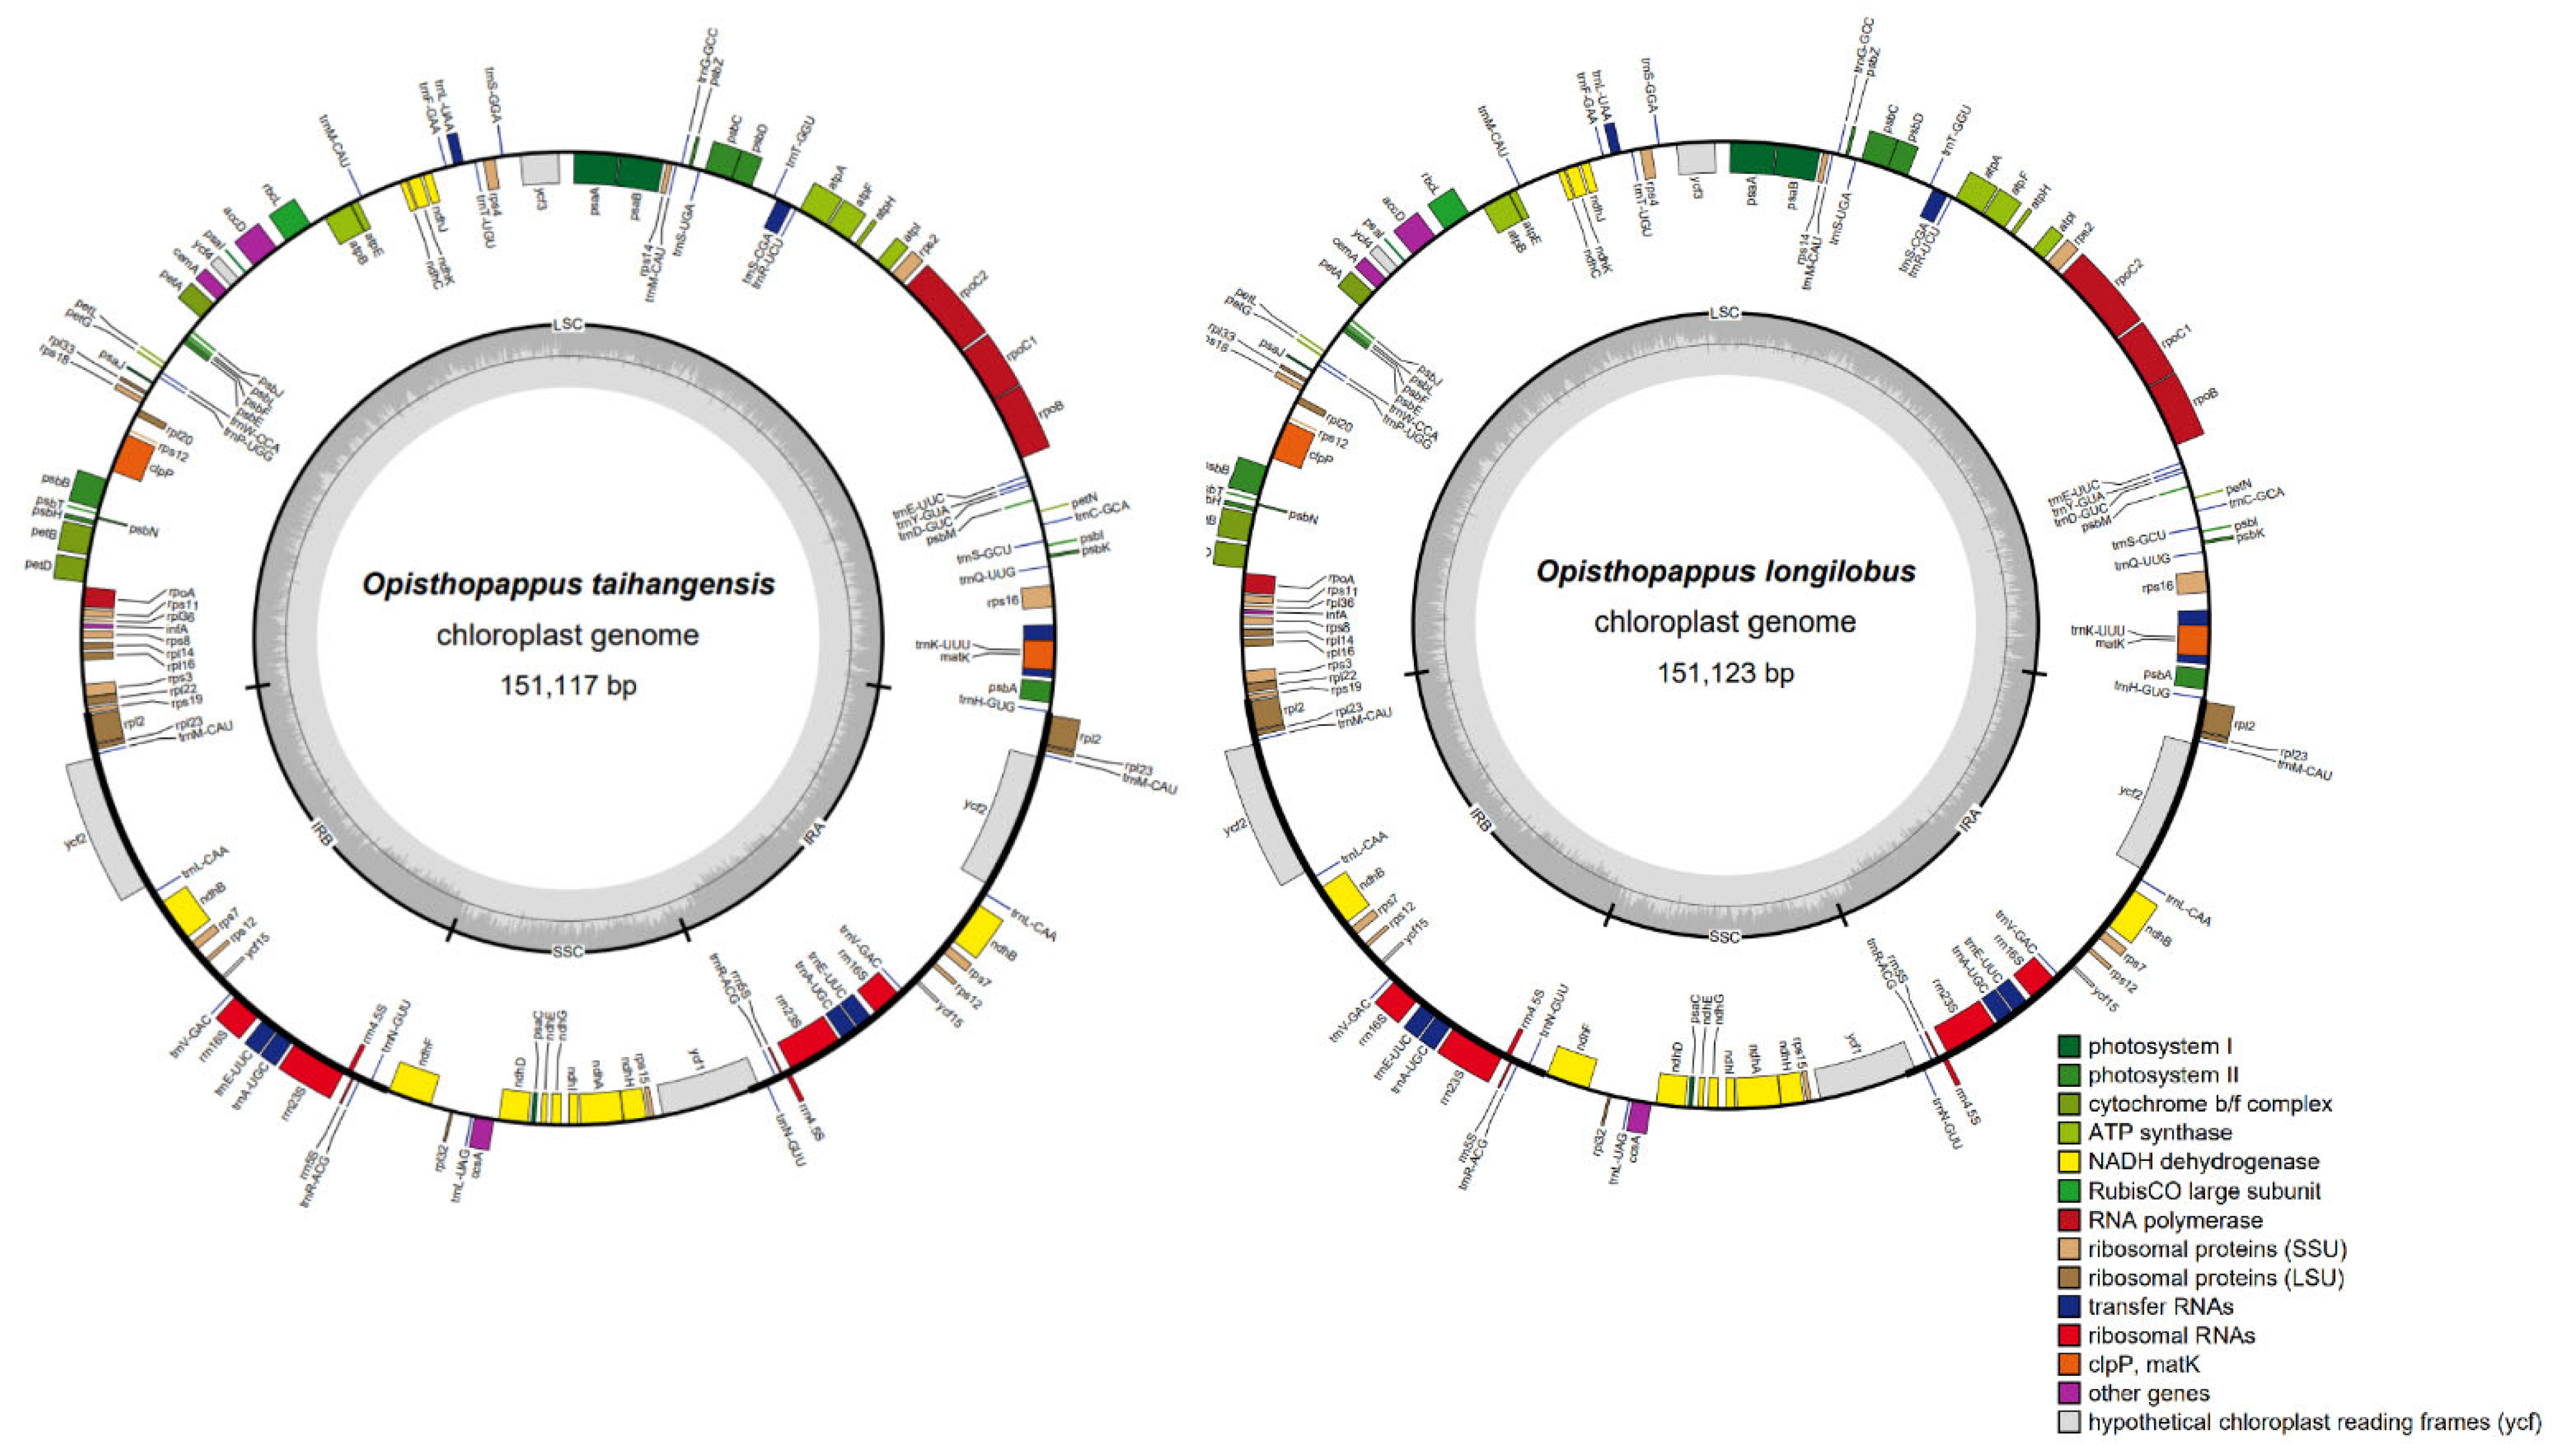
3.1. Characteristics of O. taihangensis and O. longilobus cp Genomes

The total length of the cp genomes of O. taihangensis and O. longilobus were 151,117 and 151,123 bp (Figure 1). The two species cp genomes showed the commonplace quadripartite construction comprising an LSC area (82,901 and 82,895 bp), an SSC locale (18,306 and 18,320 bp), and a pair of IRs districts (24,955 and 24,954 bp). In addition, the overall GC contents were 37.46% and 37.44%, which were unevenly distributed across the complete cp genome (Table 1). The IRs were the highest (43.07% and 43.08%), followed by the LSC (35.54% and 35.52%), whereas the SSC region showed the lowest GC content (30.82% and 30.8%). The overall G + C contents in both species were lower than A + T contents, which is a general feature exhibited in many angiosperm species cp genomes sequences.
The cp genomes of O. taihangensis and O. longilobus were highly conservative, with nearly identical gene content, gene order, and no structural reconfigurations. In total, 133 genes were predicted in two species, consisting of 88 protein-coding genes, 37 tRNA genes, and 8 rRNA genes. Most of the genes of two cp genomes were generally classified into three categories (Table 2), including self-replication, photosynthesis-related, and other function genes, respectively. Opisthopappus had lost some genes during evolution, like most angiosperms, such as chIB, chIL, and ycf68. [33,34]. The complete cp genomes of the two species were highly conserved intron number and type. In total, 19 genes contained introns. Among those genes, eight genes (rpl2 (×2), ndhB (×2), trnA-UGC (×2), and trnE-UUC (×2)) were located in the IR region, and the remaining ten genes (rps16, atpF, rpoC1, ycf3, clpP, petB, trnK-UUU, trnS-CGA, trnL-UAA, and petD) were located in the LSC region. However, ndhA was the only gene found in the SSC region. Among them, the clpP and ycf3 had two introns (Table S1).
To investigate the genomic differences, we compared the cp genome features of NC_042787 and MZ779049. As shown in Table 3, the gene content and organization of MZ779049 were similar to NC_042787. However, the cp genome of MZ779049 had the longer genome length and higher number of genes, which indicated that MZ779049 showed more complete cp genome.

3.2. Repetitive Sequence

SSRs consist of tandem short repeat units and distribute widely throughout the cp genome. In this study, the total number of SSRs detected in the cp genome sequences of O. taihangensis and O. longilobus were 42 and 44 (Figure 2a). Among them, mononucleotide SSRs were the most abundant, followed by both dinucleotides and tetranucleotides. Other types of SSRs were not detected. Moreover, intergenic regions had more abundant SSRs than the protein-coding regions, which is similar to those in most angiosperms’ cp genome [35].
In addition, the long repeat sequences of the cp genomes in the two species were similar. O. taihangensis showed 20 forward and 22 palindromic repeats, while O. longilobus displayed 20 forward and 21 palindromic repeats (Figure 2b). These repetitive sequences provide meaningful clues for the studies of genetic diversity and the development of molecular markers.

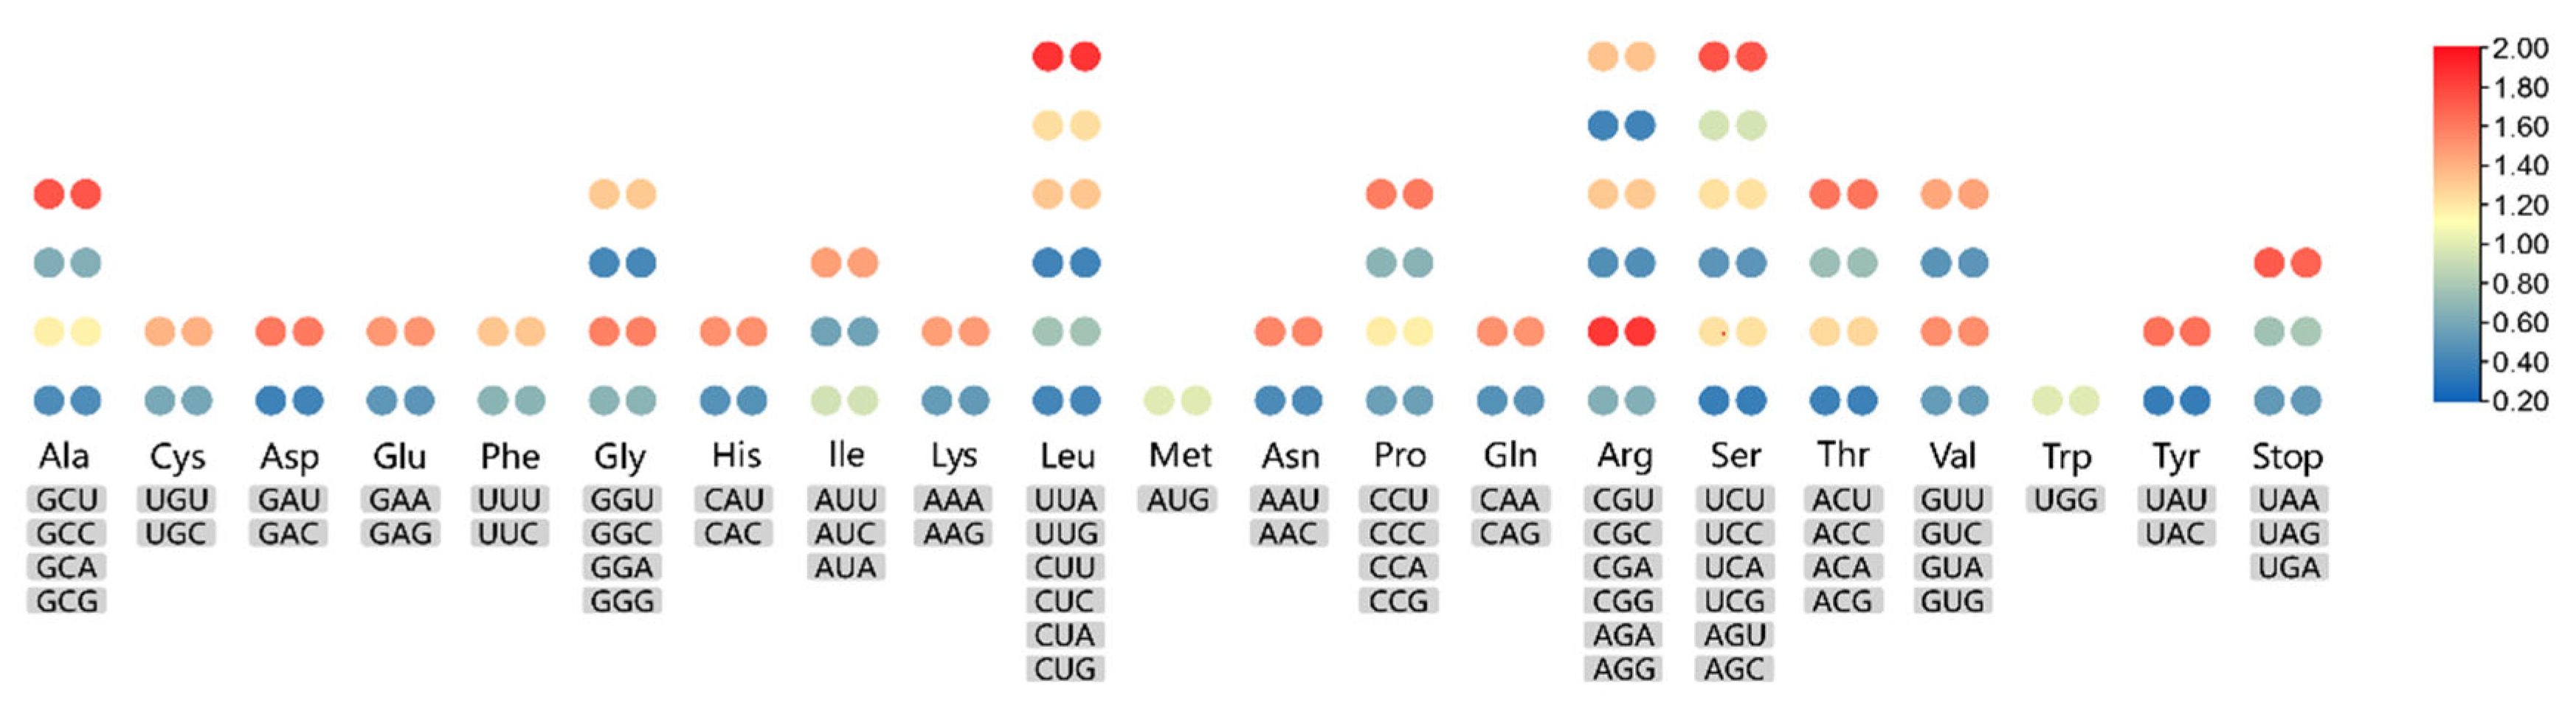
3.3. Codon Usage Analysis and RNA-Editing Sites

The length of the protein-coding genes regions in O. taihangensis and O. longilobus were 78,636 and 78,624 bp, which were used to calculate RSCU values. An RSCU value greater than 1 indicates high frequency usage. As shown in Figure 3, these encoded protein sequences consisted of 21 amino acids. High RSCU values are represented by red, and low RSCU values are indicated by blue. The heatmap shows that 30 codons were used frequently in the two species. With the exception of UUG, all preference codons finish in purines (A/U) because of the nature of the A/T-rich cp genome.
Additionally, in the cp genomes of O. taihangensis and O. longilobus, latent RNA editing sites were discovered for 18 genes. In total, 47 RNA editing sites were identified in the two species. Among the two species cp genomes, the gene with the most RNA editing sites was ndhB. The majority of the detected RNA-editing sites were at the second codon position and included cytosine to uracil (C-U) conversions. Serine to leucine (S-L) conversions were the most frequent amino acid conversions. In addition, a large number of RNA-editing sites resulted in modifications to amino acids in hydrophobic products such as phenylalanine (F), tyrosine (Y), leucine (L), and valine (V) (Table S2).

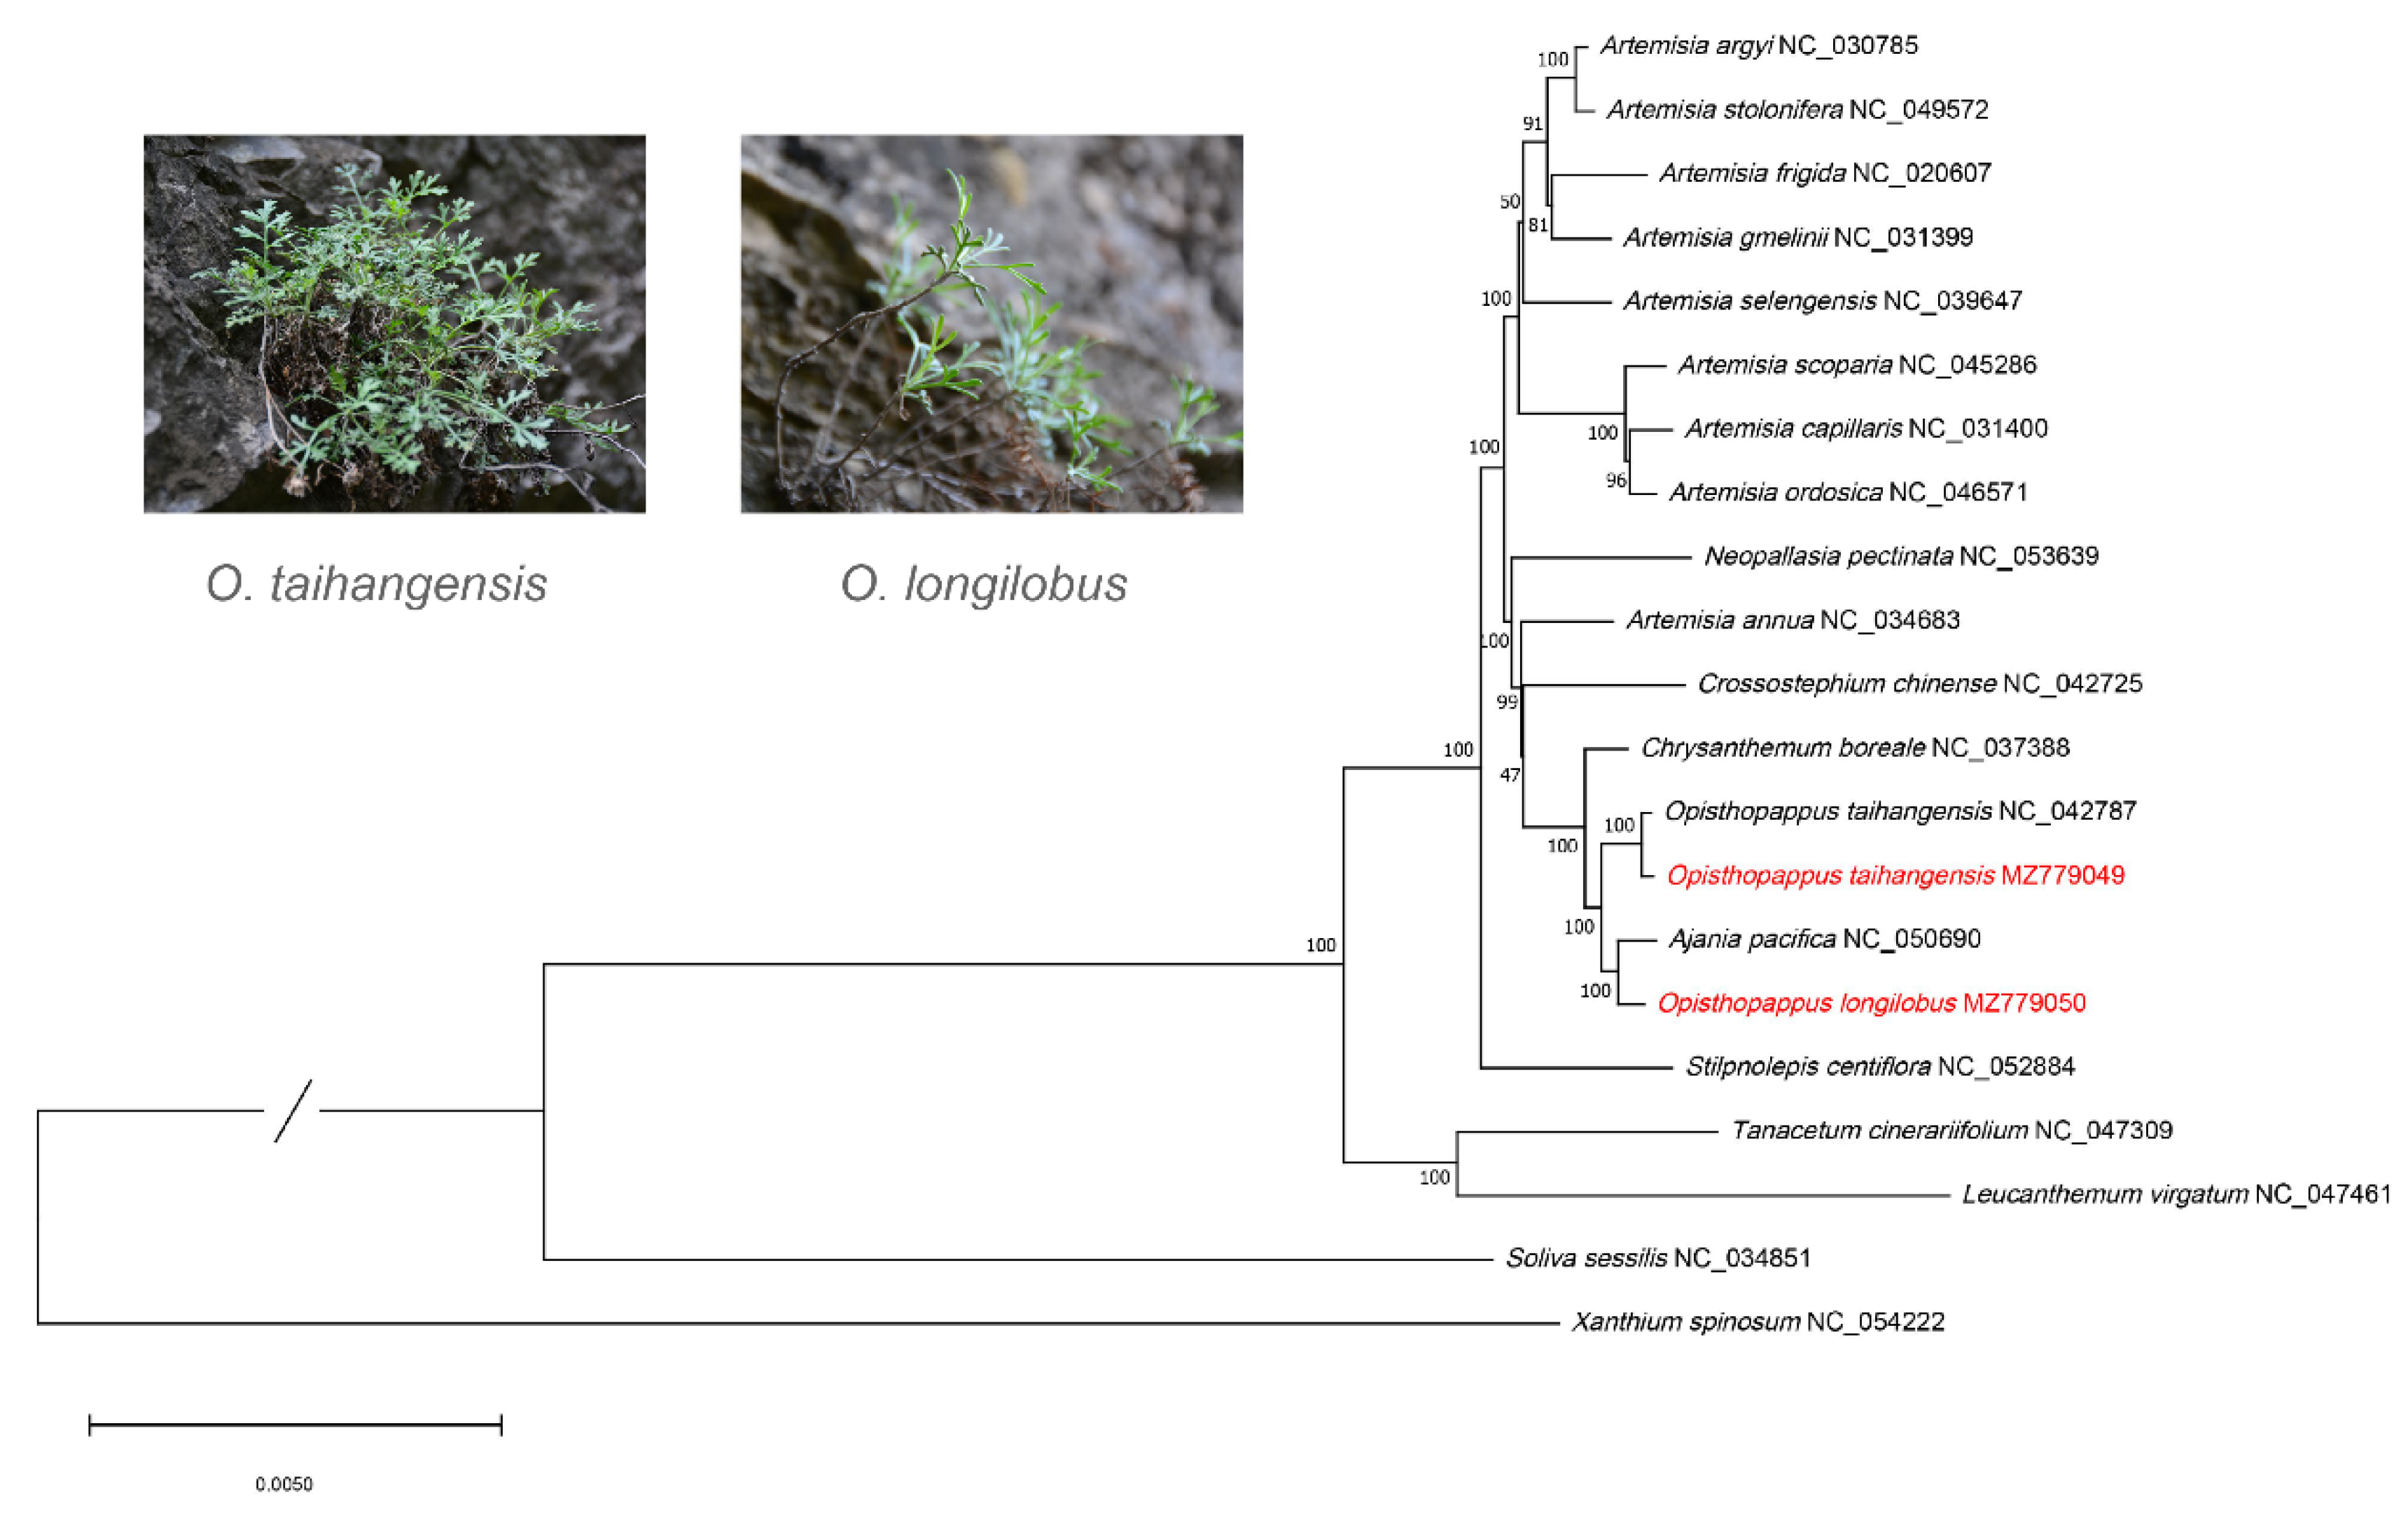
3.4. Phylogenetic Analysis and Divergence Time Analysis

The ML phylogenetic tree (Figure 4) reveals that Opisthopappus was more closely related to Chrysanthemum and Ajania in the subtribe Chrysantheminae. They formed a strongly supported sister relationship with Artemisia. Furthermore, O. taihangensis sequenced in this study was clustered with the published O. taihangensis (NC_042787). O. longilobus was more closely related to A. pacifica than to O. taihangensis. This indicated that O. longilobus was a separate species and was not a synonym or variety of O. taihangensis. Closely related plants are chemically similar and may have the same pharmacological properties. Moreover, plants are phylogenetically related to each other. Therefore, ethnobotanists have used a range of phylogenetic methods for bioprospecting [36]. From a previous study, Ajania has anti-inflammatory, anthelmintic and malaria treatment properties [37]. These results provide new ideas for the exploitation of Opisthopappus. The cp genomes seemed to provide more solid support for the reconstruction of phylogenetic relationships among these sections.
A time-divergent phylogenetic tree (Figure 5) was constructed based on an ML tree. Chrysantheminae was inferred to diverge at 28.27 Mya and divided into various genera at 22.9–23 Mya. Furthermore, O. longilobus and Ajania diverged at 15.24 Mya. However, O. taihangensis diverged at 5.40 Mya. The differentiation time span differs by nearly 10 Mya, and the results also support O. longilobus as a separate species.

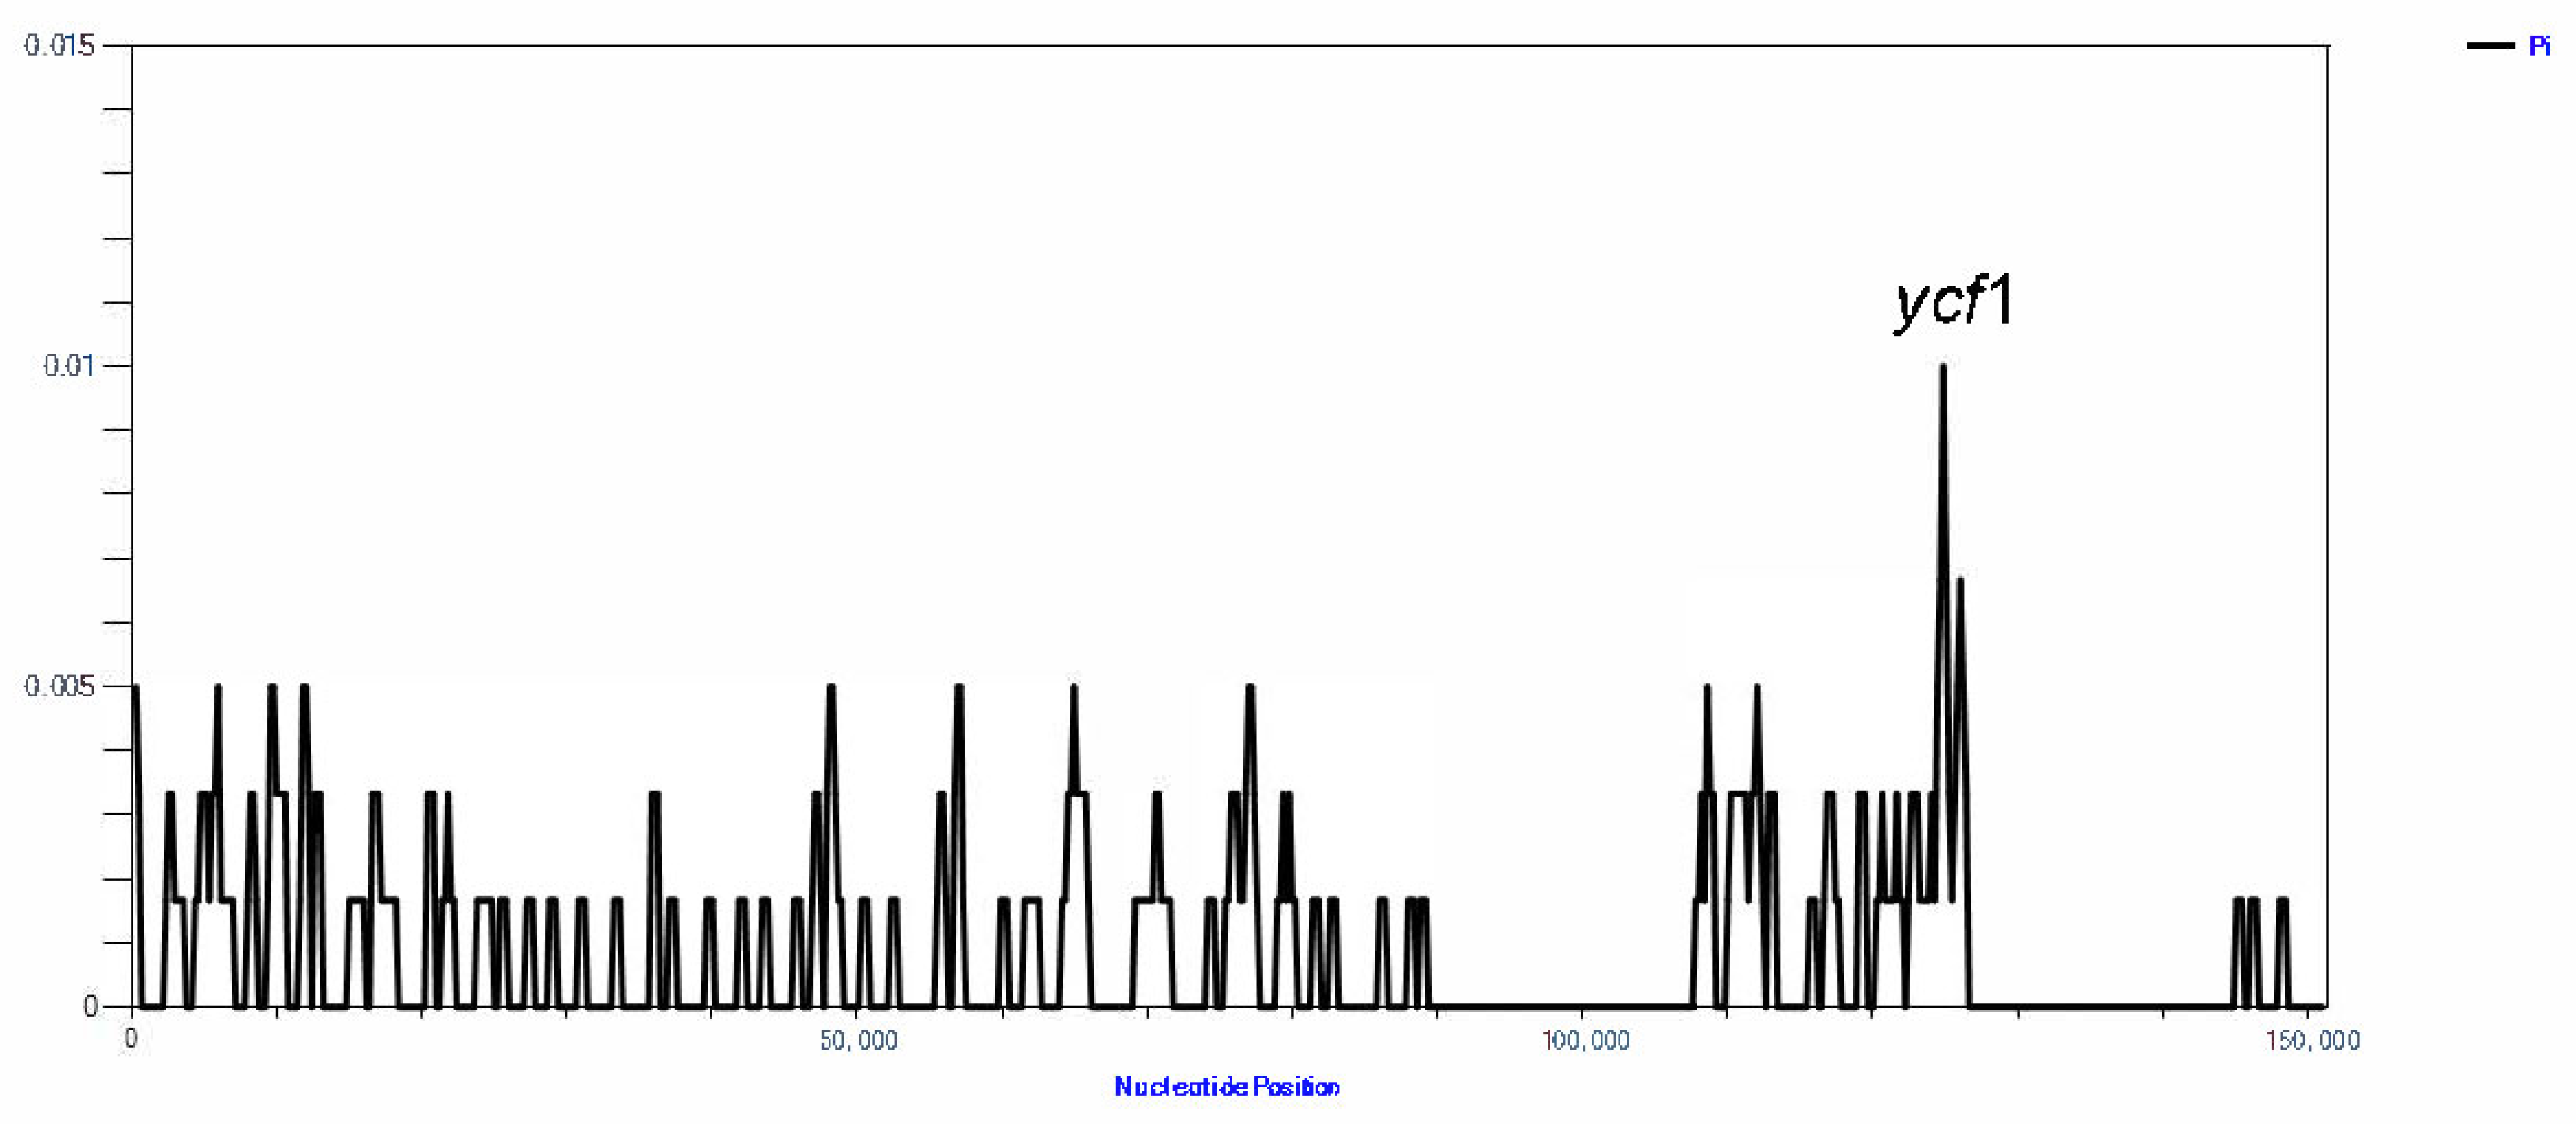
3.5. Comparative cp Genomic Analysis

In order to explore the sequence divergence between the two species of Opisthopappus, nucleotide diversity (Pi) was estimated to indicate the variability of potential plastid regions. The values of Pi ranged from 0 to 0.01. Among them, 124,370–126,369 bp resign showed high nucleotide diversity (Pi: 0.0067–0.01). This region was identified as the protein-coding region ycf1 (Figure 6).
The phylogenetic tree revealed a tight relationship between Opisthopappus and A. pacifica. The cp genome sequences of the three species were compared using O. taihangensis (NC_042787) as a reference sequence to examine the differences in the cp genome sequences. As shown in Figure 7, the three cp genomes had the lowest variability in the IR region and was relatively high in the LSC and SSC regions, which may be attributable to the presence of highly conserved rRNA sequences in IR regions. In the cp genomes of the three species, the majority of the protein-coding genes were conserved. However, the rpl16 gene had a large mutation. In addition, O. longilobus and Ajania had greater variation compared to O. taihangensis. The variations were predominantly localized in intergenic regions, such as petN-psbM, psbE-petL, psbA-matk, trnT-UGU-trnL-UAA, and trnR-UCU-trnG-UCC, which could be considered as possible molecular genetic markers.
Changes in the length of the cp genome are frequently caused by contraction and extension at the boundaries of IR regions [38]. Figure 8 shows the results of IR regions contraction and expansion of the two cp genomes. The rps19 gene was located at the LSC/IRb borders, which was mainly located in the LSC at 60–61 bp of the IRb. The gene on the IRb/SSC borders of Opisthopappus was ycf1; however, there is no gene change on IRb of A. pacifica. The ycf1 gene, which was primarily found in the SSC at 558 bp of the IRa, served as the SSC/IRa borders for all species. The trnH was found in the LSC/IRa borders. However, the rps19 was in IRa and was close to the IRa/LSC boundary in O. taihangensis (NC_042787). Overall, A. pacifica had the highest variability.

4. Conclusions

In this study, the cp genome of O. longilobus was firstly reported and we resequenced O. taihangensis. A comparative analysis with other genomes was also performed. Opisthopappus is an endemic cave plant in China, and its harsh growing environment leads it to drought and other stresses. The study of the cp genome can provide more biological information for the sustainability of Opisthopappus. Overall, Opisthopappus cp genomes had similar structure and gene composition. However, the sliding window results showed that O. taihangensis and O. longilobus had great variation in ycf1, which could be used as a potential barcode to distinguish the two species. Furthermore, we reconstructed a phylogenetic tree by complete cp genomes. The results indicated that O. longilobus was a separate species and not a synonym or variety of O. taihangensis. We found that Opisthopappus and Ajania are closely related. The results provide new ideas for the exploitation of Opisthopappus. Overall, these results can provide biological information and essential insights into the evolutionary history of the endangered Opisthopappus that will contribute to the bioprospecting and conservation of Opisthopappus species.
This is the first study to report the cp genome of O. longilobus, and we resequenced O. taihangensis. A comparative analysis with other genomes was also performed. Opisthopappus is an endemic cave plant in China, and its harsh growing environment leads it to drought and other stresses. The study of the cp genome can provide more biological information for the sustainability of Opisthopappus. Overall, Opisthopappus cp genomes had similar structure and gene composition. However, the sliding window results revealed that O. taihangensis and O. longilobus had great variation in ycf1, which could be employed as a potential molecular marker to distinguish the two species. Furthermore, we reconstructed a phylogenetic tree by complete cp genomes. The results indicated that O. longilobus was a separate species and was not a synonym or variety of O. taihangensis. It is interesting that we discovered the closely relationship between Opisthopappus and Ajania. The results provide new ideas for the exploitation of Opisthopappus. Overall, these results provide biological information and an essential basis to understand the evolutionary history of the Opisthopappus species, which will aid in future bioprospecting and conservation of endangered species.

Supplementary Materials

The following supporting information can be downloaded at: https://www.mdpi.com/article/10.3390/genes13122410/s1, Table S1: The lengths of introns and exons for the splitting genes. Table S2: RNA editing sites analyses of the five Paris plastomes.

Author Contributions

X.Z. and Y.J. conceived the ideas; L.H. and G.Z. contributed to the sampling; X.Z. performed the experiments and analyzed the data. The manuscript was written by X.Z. and edited by L.H. All authors have read and agreed to the final version of the manuscript.

Funding

We gratefully acknowledge the National Natural Science Foundation of China (82073960, 82274045 and U1812403-1), the National Science and Technology Fundamental Resources Investigation Program of China (2018FY100701), the Open Fund of State Key Laboratory of Southwestern Chinese Medicine Resources (no. SCMR20210, SKLTCM2022015), Beijing Natural Scientific Foundation (7202135) and the CAMS Innovation Fund for Medical Sciences (CIFMS, 2022-I2M-1-017).

Institutional Review Board Statement

Not applicable.

Informed Consent Statement

Not applicable.

Data Availability Statement

All sequences used in this study are in the form of attachments. We have submitted this part of the data to NCBI but have not yet released it. At present, we have provided it to the journal and reviewers as an attachment and urge NCBI to release it as soon as possible. The dataset generated and or analyzed during the current study is deposited in Genbank with accession numbers: MZ779049 and MZ779050.

Conflicts of Interest

The authors declare no conflict of interest.

Abbreviations

cpchloroplast
NCBINational Center for Biotechnology Information
LSClarge single-copy
SSCsmall single-copy
IRinverse repeat
SSRssimple sequence repeats
MLmaximum likelihood
Myamillion years ago

References

  1. Ye, H.; Wang, Z.; Hou, H.; Wu, J.; Gao, Y.; Han, W.; Ru, W.; Sun, G.; Wang, Y. Localized environmental heterogeneity drives the population differentiation of two endangered and endemic Opisthopappus Shih species. BMC Ecol. Evol. 2021, 21, 1–20. [Google Scholar] [CrossRef] [PubMed]
  2. Zhao, H.-B.; Chen, F.-D.; Chen, S.-M.; Wu, G.-S.; Guo, W.-M. Molecular phylogeny of Chrysanthemum, Ajania and its allies (Anthemideae, Asteraceae) as inferred from nuclear ribosomal ITS and chloroplast trn LF IGS sequences. Plant Syst. Evol. 2010, 284, 153–169. [Google Scholar] [CrossRef]
  3. Wu, C.; Zhang, X.-Q.; Ma, Y.-H. The Taihang and Yan mountains rose mainly in Quaternary. North China Earthq. Sci. 1999, 17, 1–7. [Google Scholar]
  4. Wei, D.; Xu, M.; Sun, W.; Jia, C.; Zhang, X. Antioxidant activity of aqueous extracts from different organs of Opisthopappus Shih. J. Chin. Inst. Food Sci. Technol. 2015, 15, 56–63. [Google Scholar]
  5. Chai, M.; Ye, H.; Wang, Z.; Zhou, Y.; Wu, J.; Gao, Y.; Han, W.; Zang, E.; Zhang, H.; Ru, W. Genetic divergence and relationship among Opisthopappus species identified by development of EST-SSR markers. Front. Genet. 2020, 11, 177. [Google Scholar] [CrossRef] [Green Version]
  6. Flora of China Editorial Committee. Flora of China; Missouri Botanical Garden and Harvard University Herbaria: St. Louis, MO, USA, 2018. [Google Scholar]
  7. Zhang, Z.; Xie, W.; Zhao, Y.; Zhang, J.; Wang, N.; Ntakirutimana, F.; Yan, J.; Wang, Y. EST-SSR marker development based on RNA-sequencing of E. sibiricus and its application for phylogenetic relationships analysis of seventeen Elymus species. BMC Plant Biol. 2019, 19, 1–18. [Google Scholar] [CrossRef] [Green Version]
  8. Brunkard, J.O.; Runkel, A.M.; Zambryski, P.C. Chloroplasts extend stromules independently and in response to internal redox signals. Proc. Natl. Acad. Sci. USA 2015, 32, 10044–10049. [Google Scholar] [CrossRef] [Green Version]
  9. Wicke, S.; Schneeweiss, G.M.; De Pamphilis, C.W.; Kai, F.M.; Quandt, D. The evolution of the plastid chromosome in land plants: Gene content, gene order, gene function. Plant Mol. Biol. 2011, 76, 273–297. [Google Scholar] [CrossRef] [Green Version]
  10. Tonti-Filippini, J.; Nevill, P.G.; Dixon, K.; Small, I. What can we do with 1000 plastid genomes? Plant J. 2017, 90, 808–818. [Google Scholar] [CrossRef] [Green Version]
  11. Zhang, Y.; Du, L.; Ao, L.; Chen, J.; Li, W.; Hu, W.; Zhang, W.; Kyunghee, K.; Sang-Choon, L.; Yang, T.J. The Complete Chloroplast Genome Sequences of Five Epimedium Species: Lights into Phylogenetic and Taxonomic Analyses. Front. Plant Sci. 2016, 7, 1–12. [Google Scholar] [CrossRef] [Green Version]
  12. Guo, L.; Guo, S.; Xu, J.; He, L.; Carlson, J.E.; Hou, X. Phylogenetic analysis based on chloroplast genome uncover evolutionary relationship of all the nine species and six cultivars of tree peony. Ind. Crops Prod. 2020, 153, 112567. [Google Scholar] [CrossRef]
  13. Gu, J.; Wei, Z.; Yue, C.; Xu, X.; Zhang, T.; Zhao, Q.; Fu, S.; Yang, D.; Zhu, S. The complete chloroplast genome of Opisthopappus taihangensis (Ling) Shih. Mitochondrial DNA Part B 2019, 4, 1415–1416. [Google Scholar] [CrossRef]
  14. Allen, G.C.; Flores-Vergara, M.A.; Krasnyanski, S.; Kumar, S.; Thompson, W.F. A modified protocol for rapid DNA isolation from plant tissues using cetyltrimethylammonium bromide. Nat. Protoc. 2006, 1, 2320–2325. [Google Scholar] [CrossRef] [PubMed]
  15. Nicolas, D.; Patrick, M.; Guillaume, S. NOVOPlasty: De novo assembly of organelle genomes from whole genome data. Nucleic Acids Res. 2017, 45, e18. [Google Scholar]
  16. Shi, L.; Chen, H.; Jiang, M.; Wang, L.; Wu, X.; Huang, L.; Liu, C. CPGAVAS2, an integrated plastome sequence annotator and analyzer. Nucleic Acids Res. 2019, 47, W65–W73. [Google Scholar] [CrossRef] [PubMed]
  17. Schattner, P.; Brooks, A.N.; Lowe, T.M. The tRNAscan-SE, snoscan and snoGPS web servers for the detection of tRNAs and snoRNAs. Nucleic Acids Res. 2005, 33, 686–689. [Google Scholar] [CrossRef] [PubMed]
  18. Stephan, G.; Pascal, L.; Ralph, B. OrganellarGenomeDRAW (OGDRAW) version 1.3.1: Expanded toolkit for the graphical visualization of organellar genomes. Nucleic Acids Res. 2019, 47, W59–W64. [Google Scholar]
  19. Benson, G. Tandem repeats finder: A program to analyze DNA sequences. Nucleic Acids Res. 1999, 27, 573–580. [Google Scholar] [CrossRef] [Green Version]
  20. Beier, S.; Thiel, T.; Münch, T.; Scholz, U.; Mascher, M. MISA-web: A web server for microsatellite prediction. Bioinformatics 2017, 33, 2583–2585. [Google Scholar] [CrossRef] [Green Version]
  21. Kurtz, S.; Choudhuri, J.V.; Ohlebusch, E.; Schleiermacher, C.; Stoye, J.; Giegerich, R. REPuter: The manifold applications of repeat analysis on a genomic scale. Nucleic Acids Res. 2001, 29, 4633–4642. [Google Scholar] [CrossRef] [Green Version]
  22. Zhang, D.; Gao, F.; Jakovli, I.; Zou, H.; Wang, G. PhyloSuite: An integrated and scalable desktop platform for streamlined molecular sequence data management and evolutionary phylogenetics studies. Mol. Ecol. Resour. 2020, 20, 348–355. [Google Scholar] [CrossRef] [PubMed]
  23. Sharp, P.M.; Li, W.-H. Codon usage in regulatory genes in Escherichia coli does not reflect selection for ‘rare’codons. Nucleic Acids Res. 1986, 14, 7737–7749. [Google Scholar] [CrossRef] [Green Version]
  24. Chen, C.; Chen, H.; Zhang, Y.; Thomas, H.R.; Frank, M.H.; He, Y.; Xia, R. TBtools: An integrative toolkit developed for interactive analyses of big biological data. Mol. Plant 2020, 13, 1194–1202. [Google Scholar] [CrossRef] [PubMed]
  25. Mower, J.P. PREP-Mt: Predictive RNA editor for plant mitochondrial genes. BMC Bioinform. 2005, 6, 1–15. [Google Scholar] [CrossRef]
  26. Mower, J.P. The PREP suite: Predictive RNA editors for plant mitochondrial genes, chloroplast genes and user-defined alignments. Nucleic Acids Res. 2009, 37 (Suppl. S2), W253–W259. [Google Scholar] [CrossRef]
  27. Katoh, K.; Standley, D.M. MAFFT multiple sequence alignment software version 7: Improvements in performance and usability. Mol. Biol. Evol. 2013, 30, 772–780. [Google Scholar] [CrossRef] [PubMed] [Green Version]
  28. Stamatakis, A. RAxML version 8: A tool for phylogenetic analysis and post-analysis of large phylogenies. Bioinformatics 2014, 30, 1312–1313. [Google Scholar] [CrossRef] [PubMed] [Green Version]
  29. Kumar, S.; Stecher, G.; Li, M.; Knyaz, C.; Tamura, K. MEGA X: Molecular evolutionary genetics analysis across computing platforms. Mol. Biol. Evol. 2018, 35, 1547–1549. [Google Scholar] [CrossRef]
  30. Kumar, S.; Stecher, G.; Suleski, M.; Hedges, S.B. TimeTree: A resource for timelines, timetrees, and divergence times. Mol. Biol. Evol. 2017, 34, 1812–1819. [Google Scholar] [CrossRef]
  31. Frazer, K.A.; Lior, P.; Alexander, P.; Rubin, E.M.; Inna, D. VISTA: Computational tools for comparative genomics. Nucleic Acids Res. 2004, 32, W273. [Google Scholar] [CrossRef] [Green Version]
  32. Amiryousefi, A.; Hyvönen, J.; Poczai, P. IRscope: An online program to visualize the junction sites of chloroplast genomes. Bioinformatics 2018, 34, 3030–3031. [Google Scholar] [CrossRef] [PubMed]
  33. Millen, R.S.; Olmstead, R.G.; Adams, K.L.; Palmer, J.D.; Lao, N.T.; Heggie, L.; Kavanagh, T.A.; Hibberd, J.M.; Gray, J.C.; Morden, C.W. Many Parallel Losses of infA from Chloroplast DNA during Angiosperm Evolution with Multiple Independent Transfers to the Nucleus. Plant Cell 2001, 13, 645–658. [Google Scholar] [CrossRef] [PubMed] [Green Version]
  34. Sheng, J.; Yan, M.; Wang, J.; Zhao, L.; Diao, Y. The complete chloroplast genome sequences of five Miscanthus species, and comparative analyses with other grass plastomes. Ind. Crops Prod. 2021, 162, 113248. [Google Scholar] [CrossRef]
  35. Li, X.; Tan, W.; Sun, J.; Du, J.; Wang, Y. Comparison of Four Complete Chloroplast Genomes of Medicinal and Ornamental Meconopsis Species: Genome Organization and Species Discrimination. Sci. Rep. 2019, 9, 10567. [Google Scholar] [CrossRef]
  36. Irene, T.T.; Jordan, F.M.; Hawkins, J.A. Comparative phylogenetic methods and the cultural evolution of medicinal plant use. Nat. Plants 2018, 4, 754–761. [Google Scholar]
  37. Halim, S.; Prasad, R.S.; Dhobi, M. Quality Control Standardization and Comparative Anthelmintic Activity of Different Extracts from Evolvulus alsinoides L. Indian J. Pharm. Sci. 2020, 82, 356–361. [Google Scholar] [CrossRef]
  38. Wu, M.; Li, Q.; Hu, Z.; Li, X.; Chen, S. The Complete Amomum kravanh Chloroplast Genome Sequence and Phylogenetic Analysis of the Commelinids. Molecules 2017, 22, 1875. [Google Scholar] [CrossRef]
Figure 1. Gene map of O. taihangensis and O. longilobus. Genes lying outside the outer circle are transcribed in a counter-clockwise direction, and genes inside this circle are transcribed in a clockwise direction. The colored bars indicate known protein-coding genes, transfer RNA genes, and ribosomal RNA genes. The dashed, dark grey area in the inner circle denotes GC content, and the light grey area indicates genome AT content. LSC, large single-copy, SSC, small single-copy; IR, inverted repeat.
Genes 13 02410 g001
Figure 2. SSRs and long repeats in O. taihangensis and O. longilobus. (a) Type of SSRs detected in two species. (b) Long repeats classification of two species. The outer circle is O. taihangensis, and the inner circle is O. longilobus.
Genes 13 02410 g002
Figure 3. The RSCU values of all protein-coding genes for O. taihangensis and O. longilobus cp genomes. Color key: the red values indicate higher RSCU values, and the blue values indicate lower RSCU values. The left side represents O. taihangensis, and the right side represents O. longilobus.
Genes 13 02410 g003
Figure 4. Maximum likelihood (ML) phylogenetic tree based on chloroplast genomes of subtribe Chrysantheminae. The top left corner shows a comparison of the habitat maps of the two species.
Genes 13 02410 g004
Figure 5. Divergence time estimation based on subtribe Chrysantheminae.
Genes 13 02410 g005
Figure 6. Sliding window analysis of the entire chloroplast genome of Opisthopappus species (window length: 1000 bp; step size: 300 bp). X-axis: position of the window; Y-axis: nucleotide diversity of each window.
Genes 13 02410 g006
Figure 7. Comparison of four chloroplast genomes using O. taihangensis (NC_042787) annotation as a reference. The vertical scale indicates the percentage of identity, ranging from 50 to 100%. The horizontal axis indicates the coordinates within the chloroplast genome. Genome regions are color-coded as exons, introns, and intergenic spacer (IGS).
Genes 13 02410 g007
Figure 8. Comparative analysis of chloroplast genomic boundaries of four species cp genome.
Genes 13 02410 g008
Table 1. Summary of the plastome features for O. taihangensis and O. longilobus. LSC: large single-copy region; SSC: small single-copy region; IR: inverted repeat.
-FeaturesO. taihangensisO. longilobus
Accession Number-MZ779049 MZ779050
Length/bpTotal151,117151,123
LSC82,90182,895
SSC18,30618,320
IR24,95524,954
GC content/%Total37.4637.44
LSC35.5435.52
SSC30.8230.8
IR43.0743.08
No. of geneTotal133133
Protein coding8888
tRNA3737
rRNA88
Table 2. Gene contents of O. taihangensis and O. longilobus cp genome.
Gene FunctionGroup Of GenesGene NamesAmount
rRNArRNA genesrrn16S (×2), rrn23S (×2), rrn5S (×2), rrn4.5S (×2)8
tRNAtRNA genestrnA-UGC (×2), trnC-GCA, trnD-GUC, trnE-UUC (×3), trnF-GAA, trnM-CAU (×4), trnG-GCC, trnH-GUG, trnK-UUU, trnL-CAA (×2), trnL-UAA, trnL-UAG, trnM-CAU, trnN-GUU (×2), trnP-UGG, trnQ-UUG, trnR-ACG (×2), trnR-UCU, trnS-CGA, trnS-GCU, trnS-GGA (×2), trnT-GGU, trnT-UGU, trnV-GAC(×2), trnW-CCA, trnY-GUA37
Self-replicationSmall subunit of ribosomerps11, rps12 (×2), rps14, rps15 (×2), rps16, rps18, rps19, rps2, rps3, rps4, rps7 (×2), rps815
Large subunit of ribosomerpl14, rpl16, rpl2 (×2), rpl20, rpl22, rpl23 (×2), rpl32, rpl33, rpl3611
DNA dependent RNA polymeraserpoA, rpoB, rpoC1, rpoC24
PhotosynthesisSubunits of NADH-dehydrogenasendhA, ndhB(×2), ndhC, ndhD, ndhE, ndhF, ndhG, ndhH, ndhI, ndhJ, ndhK12
Subunits of photosystem ⅠpsaA, psaB, psaC, psaI, psaJ5
Subunits of photosystem ⅡpsbA, psbB, psbC, psbD, psbE, psbF, psbI, psbJ, psbK, psbL, psbM, psbN, psbT, psbZ, ycf315
Subunits of cytochrome b/f complexpetA, petB, petD, petG, petL, petN6
Subunits of ATP synthaseatpA, atpB, atpE, atpF, atpH, atpI6
Large subunit of rubiscorbcL1
Other genesMaturasematK1
ProteaseclpP1
Envelope membrane proteincemA1
Subunit of Acetyl-CoA-carboxylaseaccD1
c-type cytochrome synthesis geneccsA1
Translational initiation factorinfA1
UnknownConserved open reading framesycf1, ycf15(×2), ycf2 (×2), ycf46
Total 133
Table 3. Comparison of the cp genome features between NC_042787 and MZ779049.
Features NC_042787MZ779049
Length/bp 151089151117
No. of geneTotal132133
Protein coding8788
tRNA3737
rRNA88
Publisher’s Note: MDPI stays neutral with regard to jurisdictional claims in published maps and institutional affiliations.

