
CCL2 rs1024611Gene Polymorphism in Philadelphia-Negative Myeloproliferative Neoplasms

 ,
,
Abstract
:1. Introduction
2. Patients and Methods
2.1. Peripheral Blood Collection
2.1.1. Driver Mutations Detection
Real-Time PCR Assay for the Detection of JAK2 V617F Mutation
Real-Time PCR Assay for the Detection of CALR Type 1/Type 2 Mutations
Real-Time PCR Assay for the Detection of MPL W515L/K Mutations
2.2. DNA Extraction and Genotyping
2.3. Isolation of Mononuclear Cells, RNA Extraction, and cDNA Synthesis
2.4. Real-Time Reverse Transcriptase-Polymerase Chain Reaction (RT-PCR)
2.5. Statistical Analysis
3. Results
4. Discussion
5. Conclusions
6. Limitations of the Study
Author Contributions
Funding
Institutional Review Board Statement
Informed Consent Statement
Acknowledgments
Conflicts of Interest
References
- Arber, D.A.; Orazi, A.; Hasserjian, R.; Thiele, J.; Borowitz, M.J.; Le Beau, M.M.; Bloomfield, C.D.; Cazzola, M.; Vardiman, J.W. The 2016 revision to the World Health Organization classification of myeloid neoplasms and acute leukemia. Blood 2016, 127, 2391–2405. [Google Scholar] [CrossRef] [PubMed]
- Guglielmelli, P.; Pacilli, A.; Rotunno, G.; Rumi, E.; Rosti, V.; Delaini, F.; Maffioli, M.; Fanelli, T.; Pancrazzi, A.; Pietra, D.; et al. Presentation and outcome of patients with 2016 WHO diagnosis of prefibrotic and overt primary myelofibrosis. Blood 2017, 129, 3227–3236. [Google Scholar] [CrossRef] [PubMed] [Green Version]
- Guglielmelli, P.; Vannucchi, A.M.; AGIMM Investigators. The prognostic impact of bone marrow fibrosis in primary myelo-fibrosis. Am. J. Hematol. 2016, 91, E454–E455. [Google Scholar] [CrossRef] [PubMed]
- Barosi, G.; Mesa, R.A.; Thiele, J.; Cervantes, F.; Campbell, P.J.; Verstovsek, S.; Dupriez, B.; Levine, R.L.; Passamonti, F.; Gotlib, J.; et al. Proposed criteria for the diagnosis of post-polycythemia vera and post-essential thrombocythemia myelofibrosis: A consensus statement from the international working group for myelofibrosis research and treatment. Leukemia 2008, 22, 437–438. [Google Scholar] [CrossRef] [PubMed] [Green Version]
- Tefferi, A.; Saeed, L.; Hanson, C.; Ketterling, R.P.; Pardanani, A.; Gangat, N. Application of current prognostic models for primary myelofibrosis in the setting of post-polycythemia vera or post-essential thrombocythemia myelofibrosis. Leukemia 2017, 31, 2851–2852. [Google Scholar] [CrossRef] [PubMed] [Green Version]
- James, C.; Ugo, V.; Le Couédic, J.-P.; Staerk, J.; Delhommeau, F.; Lacout, C.; Garçon, L.; Raslova, H.; Berger, R.; Bennaceur-Griscelli, A.; et al. A unique clonal JAK2 mutation leading to constitutive signalling causes polycythaemia vera. Nature 2005, 434, 1144–1148. [Google Scholar] [CrossRef] [PubMed]
- Kralovics, R.; Passamonti, F.; Buser, A.S.; Teo, S.-S.; Tiedt, R.; Passweg, J.R.; Tichelli, A.; Cazzola, M.; Skoda, R.C. A Gain-of-Function Mutation of JAK2in Myeloproliferative Disorders. N. Engl. J. Med. 2005, 352, 1779–1790. [Google Scholar] [CrossRef] [Green Version]
- Klampfl, T.; Gisslinger, H.; Harutyunyan, A.; Nivarthi, H.; Rumi, E.; Milosevic, J.D.; Them, N.C.; Berg, T.; Gisslinger, B.; Pietra, D.; et al. So-matic Mutations of Calreticulin in Myeloproliferative Neoplasms. N. Engl. J. Med. 2013, 369, 2379–2390. [Google Scholar] [CrossRef] [Green Version]
- Nangalia, J.; Massie, C.E.; Baxter, E.J.; Nice, F.L.; Gundem, G.; Wedge, D.C.; Avezov, E.; Li, J.; Kollmann, K.; Kent, D.G.; et al. Somatic CALR Mutations in Myeloproliferative Neoplasms with Nonmutated JAK2. N. Engl. J. Med. 2013, 369, 2391–2405. [Google Scholar] [CrossRef] [Green Version]
- Greenfield, G.; McMullin, M.F.; Mills, K. Molecular pathogenesis of the myeloproliferative neoplasms. J. Hematol. Oncol. 2021, 14, 103. [Google Scholar] [CrossRef]
- Hasselbalch, H.C. Perspectives on chronic inflammation in essential thrombocythemia, polycythemia vera, and myelofi-brosis: Is chronic inflammation a trigger and driver of clonal evolution and development of accelerated atherosclerosis and second cancer? Blood 2012, 119, 3219–3225. [Google Scholar] [CrossRef] [PubMed] [Green Version]
- Kleppe, M.; Kwak, M.; Koppikar, P.; Riester, M.; Keller, M.; Bastian, L.; Hricik, T.; Bhagwat, N.; McKenney, A.S.; Papalexi, E.; et al. JAK-STAT pathway activation in malignant and nonmalignant cells contributes to MPN pathogenesis and therapeutic response. Cancer Discov. 2015, 5, 316–331. [Google Scholar] [CrossRef] [PubMed] [Green Version]
- Koschmieder, S.; Mughal, T.; Hasselbalch, H.C.; Barosi, G.; Valent, P.; Kiladjian, J.-J.; Jeryczynski, G.; Gisslinger, H.; Jutzi, J.S.; Pahl, H.L.; et al. Myeloproliferative neoplasms and inflammation: Whether to target the malignant clone or the inflammatory process or both. Leukemia 2016, 30, 1018–1024. [Google Scholar] [CrossRef]
- Mondet, J.; Hussein, K.; Mossuz, P. Circulating Cytokine Levels as Markers of Inflammation in Philadelphia Negative Myeloproliferative Neoplasms: Diagnostic and Prognostic Interest. Mediat. Inflamm. 2015, 2015, 670580. [Google Scholar] [CrossRef] [PubMed] [Green Version]
- Tefferi, A.; Vaidya, R.; Caramazza, D.; Finke, C.; Lasho, T.; Pardanani, A. Circulating Interleukin (IL)-8, IL-2R, IL-12, and IL-15 Levels Are Independently Prognostic in Primary Myelofibrosis: A Comprehensive Cytokine Profiling Study. J. Clin. Oncol. 2011, 29, 1356–1363. [Google Scholar] [CrossRef]
- Pardanani, A.; Begna, K.; Finke, C.; Lasho, T.; Tefferi, A. Circulating levels of MCP-1, sIL-2R, IL-15, and IL-8 predict anemia response to pomalidomide therapy in myelofibrosis. Am. J. Hematol. 2011, 86, 343–345. [Google Scholar] [CrossRef] [PubMed]
- Yadav, A.; Saini, V.; Arora, S. MCP-1: Chemoattractant with a role beyond immunity: A review. Clin. Chim. Acta 2010, 411, 1570–1579. [Google Scholar] [CrossRef]
- Deshmane, S.L.; Kremlev, S.; Amini, S.; Sawaya, B.E. Monocyte Chemoattractant Protein-1 (MCP-1): An Overview. J. Interf. Cytokine Res. 2009, 29, 313–326. [Google Scholar] [CrossRef]
- Melgarejo, E.; Medina, M.A.; Sanchez-Jimenez, F.; Urdiales, J.L. Monocyte chemoattractant protein-1: A key mediator in in-flammatory processes. Int. J. Biochem. Cell Biol. 2009, 41, 998–1001. [Google Scholar] [CrossRef]
- Nagarsheth, N.; Wicha, M.S.; Zou, W. Chemokines in the cancer microenvironment and their relevance in cancer immu-notherapy. Nat. Rev. Immunol. 2017, 17, 559–572. [Google Scholar] [CrossRef] [Green Version]
- Iwamoto, H.; Izumi, K.; Mizokami, A. Is the C-C Motif Ligand 2–C-C Chemokine Receptor 2 Axis a Promising Target for Cancer Therapy and Diagnosis? Int. J. Mol. Sci. 2020, 21, 9328. [Google Scholar] [CrossRef] [PubMed]
- Visentainer, J.E.; Sell, A.M.; da Silva, G.C.; Cavichioli, A.D.C.; Franceschi, D.S.A.; Lieber, S.R.; de Souza, C.A. TNF, IFNG, IL6, IL10 and TGFB1 gene polymorphisms in South and Southeast Brazil. Int. J. Immunogenet. 2008, 35, 287–293. [Google Scholar] [CrossRef] [PubMed]
- Colobran, R.; Pujol-Borrell, R.; Armengol, M.P.; Juan, M. The chemokine network. II. On how polymorphisms and alternative splicing increase the number of molecular species and configure intricate patterns of disease susceptibility. Clin. Exp. Immunol. 2007, 150, 1–12. [Google Scholar] [CrossRef] [PubMed]
- Masselli, E.; Carubbi, C.; Cambò, B.; Pozzi, G.; Gobbi, G.; Mirandola, P.; Follini, E.; Pagliaro, L.; Di Marcantonio, D.; Bonatti, F.; et al. The −2518 A/G polymorphism of the monocyte chemoattractant protein-1 as a candidate genetic predisposition factor for secondary myelofibrosis and biomarker of disease severity. Leukemia 2018, 32, 2266–2270. [Google Scholar] [CrossRef] [PubMed] [Green Version]
- Vardiman, J.W.; Thiele, J.; Arber, D.A.; Brunning, R.D.; Borowitz, M.J.; Porwit, A.; Harris, N.L.; Le Beau, M.M.; Hellström-Lindberg, E.; Tefferi, A.; et al. The 2008 revision of the World Health Organization (WHO) classification of myeloid neo-plasms and acute leukemia: Rationale and important changes. Blood 2009, 114, 937–951. [Google Scholar] [CrossRef] [PubMed] [Green Version]
- Bottazzi, B.; Riboli, E.; Mantovani, A. Aging, inflammation and cancer. Semin. Immunol. 2018, 40, 74–82. [Google Scholar] [CrossRef]
- Hasselbalch, H.C. The role of cytokines in the initiation and progression of myelofibrosis. Cytokine Growth Factor Rev. 2013, 24, 133–145. [Google Scholar] [CrossRef]
- Barosi, G. An Immune Dysregulation in MPN. Curr. Hematol. Malig. Rep. 2014, 9, 331–339. [Google Scholar] [CrossRef]
- Hasselbalch, H.C. Chronic inflammation as a promotor of mutagenesis in essential thrombocythemia, polycythemia vera and myelofibrosis. A human inflammation model for cancer development? Leuk. Res. 2013, 37, 214–220. [Google Scholar] [CrossRef]
- Masselli, E.; Carubbi, C.; Pozzi, G.; Percesepe, A.; Campanelli, R.; Villani, L.; Gobbi, G.; Bonomini, S.; Roti, G.; Rosti, V.; et al. Impact of the rs1024611 Polymorphism of CCL2 on the Pathophysiology and Outcome of Primary Myelofibrosis. Cancers 2021, 13, 2552. [Google Scholar] [CrossRef]
- Wong, W.J.; Baltay, M.; Getz, A.; Fuhrman, K.; Aster, J.C.; Hasserjian, R.P.; Pozdnyakova, A. Gene expression profiling distin-guishes prefibrotic from overtly fibrotic myeloproliferative neoplasms and identifies disease subsets with distinct inflam-matory signatures. PLoS ONE 2019, 14, e0216810. [Google Scholar] [CrossRef] [PubMed] [Green Version]
- Eming, S.A.; Wynn, T.A.; Martin, P. Inflammation and metabolism in tissue repair and regeneration. Science 2017, 356, 1026–1030. [Google Scholar] [CrossRef] [PubMed] [Green Version]
- Cacemiro, M.C.; Cominal, J.G.; Tognon, R.; Nunes, N.D.S.; Simões, B.P.; De Figueiredo-Pontes, L.L.; Catto, L.F.B.; Traina, F.; Souto, E.X.; Zambuzi, F.A.; et al. Philadelphia-negative myeloproliferative neoplasms as disorders marked by cy-tokine modulation. Hematol. Transfus. Cell Ther. 2018, 40, 120–131. [Google Scholar]
- Pourcelot, E.; Trocme, C.; Mondet, J.; Bailly, S.; Toussaint, B.; Mossuz, P. Cytokine profiles in polycythemia vera and essential thrombocythemia patients: Clinical implications. Exp. Hematol. 2014, 42, 360–368. [Google Scholar] [CrossRef] [PubMed]
- Albrengues, J.; Bertero, T.; Grasset, E.; Bonan, S.; Maiel, M.; Bourget, I. Epigenetic switch drives the conversion of fibro-blasts into proinvasive cancer-associated fibroblasts. Nat. Commun. 2015, 6, 10204. [Google Scholar] [CrossRef] [Green Version]
- Čokić, V.; Mitrović-Ajtić, O.; Beleslin-Čokić, B.B.; Marković, D.; Buač, M.; Diklic, M.; Kraguljac-Kurtović, N.; Damjanović, S.; Milenković, P.; Gotić, M.; et al. Proinflammatory Cytokine IL-6 and JAK-STAT Signaling Pathway in Myeloproliferative Neoplasms. Mediat. Inflamm. 2015, 2015, 453020. [Google Scholar] [CrossRef] [Green Version]
- Desterke, C.; Martinaud, C.; Ruzehaji, N.; Le Bousse-Kerdilès, M.C. Inflammation as a Keystone of Bone Marrow Stroma Al-terations in Primary Myelofibrosis. Mediat. Inflamm. 2015, 2015, 415024. [Google Scholar] [CrossRef] [Green Version]
- Masselli, E.; Pozzi, G.; Vaccarezza, M.; Mirandola, P.; Galli, D.; Vitale, M.; Carubbi, C.; Gobbi, G. ROS in Platelet Biology: Func-tional Aspects and Methodological Insights. Int. J. Mol. Sci. 2020, 21, 4866. [Google Scholar] [CrossRef]

| PV (n = 44) | ET (n = 38) | PMF (n = 24) | Post-PV/ET-MF (n = 22) | Healthy Subjects (n = 141) | Test of Sig. | p | |
|---|---|---|---|---|---|---|---|
| Age (years) | |||||||
| Mean ± SD. | 63.77 ± 6.02 | 62.03 ± 5.01 | 63.33 ± 4.78 | 65.41 ± 4.46 | 63.26 ± 4.75 | F = 1.691 | 0.152 |
| Median (Min.–Max.) | 65 (52–72) | 62 (50–71) | 64 (55–72) | 66 (58–73) | 64 (53–72) | ||
| Gender | |||||||
| Male | 23 (52.3%) | 18 (47.4%) | 12 (50.0%) | 12 (54.5%) | 73 (51.8%) | χ2 = 0.373 | 0.985 |
| Female | 21 (47.7%) | 20 (52.6%) | 12 (50.0%) | 10 (45.5%) | 68 (48.2%) | ||
| Hb (g/dL) | |||||||
| Mean ± SD. | 17.56 ± 0.54 | 13.95 ± 0.62 | 10.90 ± 1.92 | 10.68 ± 1.64 | 13.56 ± 0.93 | F = 238.881 * | <0.001 * |
| Median | 17.30 | 13.80 | 11.30 | 10.55 | 13.60 | ||
| (Min.–Max.) | (17.0–18.60) | (13.0–15.10) | (7.10–13.40) | (6.90–13.10) | (12.10–15.10) | ||
| WBC count (×109/L) | |||||||
| Mean ± SD. | 12.14 ± 1.62 | 8.40 ± 1.17 | 12.67 ± 6.87 | 13.05 ± 7.31 | 7.24 ± 1.77 | H = 111.406 * | <0.001 * |
| Median | 12.0 | 8.30 | 9.90 | 10.65 | 7.30 | ||
| (Min.–Max.) | (9.60–14.40) | (6.10–10.30) | (4.40–27.30) | (4.40–29.20) | (4.30–9.80) | ||
| Platelet count (×109/L) | |||||||
| Mean ± SD. | 595.6 ± 92.16 | 812.8 ± 111.5 | 456.5 ± 229.1 | 443.5 ± 168.9 | 284.4 ± 55.84 | H = 168.231 * | <0.001 * |
| Median | 591.0 | 822.0 | 493.0 | 477.0 | 283.0 | ||
| (Min.–Max.) | (463–752) | (623–991) | (122–780) | (118–694) | (189.0–392.0) | ||
| JAK2, n (%) | 44 (100%) | 21 (55.3%) | 16 (66.7%) | 19 (86.4%) | NA | χ2 = 26.659 * | <0.001 * |
| CALR, n (%) | NA | 9 (23.7%) | 7 (29.2%) | 0 (0.0%) | NA | χ2 = 20.924 * | MCp < 0.001 * |
| MPL, n (%) | NA | 4 (10.5%) | 3 (12.5%) | 0 (0.0%) | NA | χ2 = 7.435 * | MCp = 0.024 * |
| Triple negative, n (%) | NA | 7 (18.4%) | 2 (8.3%) | 3 (13.6%) | NA | χ2 = 9.833 | MCp = 0.010 * |
| Grading of fibrosis | |||||||
| 0–1, n (%) | 31 (100.0%) | 38 (100.0%) | 8 (33.3%) | 4 (18.2%) | NA | χ2 = 73.673 * | <0.001 * |
| ≥2, n (%) | 0 (0.0%) | 0 (0.0%) | 16 (66.7%) | 18 (81.8%) | NA | ||
| Thrombotic events | 18 (40.9%) | 12 (31.6%) | 8 (33.3%) | 8 (36.4%) | NA | χ2 = 0.858 | 0.835 |
| Bleeding events | 1 (2.3%) | 1 (2.6%) | 3 (12.5%) | 3 (13.6%) | NA | χ2 = 5.388 | MCp= 0.100 |
| Cardiovascular risk factors | 12 (27.3%) | 13 (34.2%) | 5 (20.8%) | 5 (22.7%) | NA | χ2 = 1.650 | 0.648 |
| Time evolution of MNPs (years) | NA | NA | NA | 7.41 ± 2.26 | NA | ||
| Spleen size (cm) | |||||||
| Mean ± SD. | 3.3 ± 4.3 | 1.4 ± 2.2 | 5.7 ± 5.4 | 7.4 ± 7.3 | 0 ± 0 | H = 154.030 * | <0.001 * |
| Median (Min.–Max.) | 1 (0–15) | 1 (0–10) | 4.5 (0–21) | 6 (0–24) | 0 (0–0) | ||
| IPSS | |||||||
| Low/intermediate-1 | NA | NA | 9 (37.5%) | 7 (31.8%) | NA | χ2 = 0.163 | 0.686 |
| Intermediate-2/high | NA | NA | 15 (62.5%) | 15 (68.2%) | NA | ||
| Dacryocytes | 1 (2.3%) | 0 (0%) | 16 (66.7%) | 18 (81.8%) | NA | χ2 = 79.762 * | <0.001 * |
| Erythroblastosis | 3 (6.8%) | 3 (7.9%) | 15 (62.5%) | 16 (72.7%) | NA | χ2 = 52.346 * | <0.001 * |
| LDH (U/L) | |||||||
| Mean ± SD. | 564.2 ± 150.6 | 503.9 ± 138.7 | 614.3 ± 225.7 | 781.4 ± 302.6 | 182.3 ± 22.6 | H = 204.215 * | <0.001 * |
| Median (Min.–Max.) | 517 (371–885) | 488 (290–766) | 644.5 (254–987) | 844 (281–1271) | 186 (137–218) |
| PV (n = 44) | ET (n = 38) | PMF (n = 24) | Post-PV/ET-MF (n = 22) | Healthy Subjects (n = 141) | p | |
|---|---|---|---|---|---|---|
| CCL2 rs1024611 | ||||||
| AA | 23 (52.3%) | 19 (50.0%) | 10 (41.7%) | 9 (40.9%) | 76 (53.9%) | p1 = 0.981 p2 = 0.899 p3 = 0.055 p4 = 0.036 * |
| AG | 19 (43.2%) | 17 (44.7%) | 10 (41.7%) | 9 (40.9%) | 59 (41.8%) | |
| GG | 2 (4.5%) | 2 (5.3%) | 4 (16.7%) | 4 (18.2%) | 6 (4.3%) | |
| HWp0 | 0.432 | 0.465 | 0.586 | 0.520 | 0.189 | |
| Allele | p1 = 0.857 p2 = 0.664 p3 = 0.075 p4 = 0.061 | |||||
| A | 65 (73.9%) | 55 (72.4%) | 30 (62.5%) | 27 (61.4%) | 211 (74.8%) | |
| G | 23 (26.1%) | 21 (27.6%) | 18 (37.5%) | 17 (38.6%) | 71 (25.2%) |
| PV vs. Healthy Subjects | ET vs. Healthy Subjects | PMF vs. Healthy Subject | Post-PV/ET-MF vs. Healthy Subjects | |||||
|---|---|---|---|---|---|---|---|---|
| OR (95% CI) | p | OR (95% CI) | p | OR (95% CI) | p | OR (95% CI) | p | |
| CCL2 rs1024611 | ||||||||
| AA | Ref. | Ref. | Ref. | Ref. | ||||
| AG | 1.064 (0.53–2.14) | 0.861 | 1.153 (0.55–2.41) | 0.706 | 1.288 (0.50–3.30) | 0.598 | 1.288 (0.48–3.45) | 0.614 |
| GG | 1.101 (0.21–5.83) | 0.910 | 1.333 (0.25–7.14) | 0.737 | 5.067 (1.22–21.1) | 0.026 * | 5.630 (1.33–23.80) | 0.019 * |
| GG vs. AA + AG | 1.071 (0.21–5.51) | 0.934 | 1.250 (0.24–6.46) | 0.790 | 4.500 (1.17–17.35) | 0.029 * | 5.0 (1.29–19.43) | 0.020 * |
| Allele | ||||||||
| A | Ref. | Ref. | Ref. | Ref. | ||||
| G | 1.052 (0.61–1.82) | 0.857 | 1.135 (0.64–2.0) | 0.664 | 1.783 (0.94–3.39) | 0.078 | 1.761 (0.90–3.46) | 0.100 |
| CCL2 rs1024611 | Test of Sig. | p | |||
|---|---|---|---|---|---|
| AA (n = 61) | AG (n = 55) | GG (n = 12) | |||
| Age (years) | |||||
| Mean ± SD. | 63.51 ± 5.02 | 63.22 ± 5.70 | 64.25 ± 5.40 | F = 0.189 | 0.828 |
| Median (Min.–Max.) | 64.0 (52.0–72.0) | 64.0 (50.0–73.0) | 65.50 (55.0–72.0) | ||
| Gender | |||||
| Male | 29 (47.5%) | 26 (47.3%) | 10 (83.3%) | χ2 = 5.615 | 0.060 |
| Female | 32 (52.5%) | 29 (52.7%) | 2 (16.7%) | ||
| Hb (g/dL) | |||||
| Mean ± SD. | 14.27 ± 3.0 | 14.11 ± 3.17 | 12.82 ± 2.94 | F = 1.129 | 0.327 |
| Median (Min.–Max.) | 14.60 (7.70–18.50) | 13.80 (6.90–18.60) | 12.20 (9.70–18.40) | ||
| WBC count (×109/L) | |||||
| Mean ± SD. | 11.23 ± 4.33 | 11.25 ± 4.80 | 11.69 ± 6.49 | H = 0.202 | 0.904 |
| Median (Min.–Max.) | 10.30 (4.90–29.20) | 10.20 (4.40–27.30) | 9.65 (5.10–27.30) | ||
| Platelet count (×109/L) | |||||
| Mean ± SD. | 621.7 ± 201.1 | 607.3 ± 203.6 | 539.8 ± 242.4 | H = 1.290 | 0.525 |
| Median (Min.–Max.) | 635 (118–982) | 631 (122–977) | 518 (148–991) | ||
| JAK2, n (%) | 49 (80.3%) | 41 (74.5%) | 10 (83.3%) | χ2 = 0.776 | 0.678 |
| CALR, n (%) | 8 (13.1%) | 6 (10.9%) | 2 (16.7%) | χ2 = 0.339 | 0.844 |
| MPL, n (%) | 4 (6.6%) | 3 (5.5%) | 0 (0.0%) | χ2 = 0.362 | MCp = 1.000 |
| Triple negative, n (%) | 4 (6.6%) | 7 (12.7%) | 1 (8.3%) | χ2 = 1.313 | 0.519 |
| Grading of fibrosis | (n = 49) | (n = 54) | (n = 12) | ||
| 0–1, n (%) | 41 (83.7%) | 36 (66.7%) | 4 (33.3%) | χ2 = 12.424 * | 0.002 * |
| ≥2, n (%) | 8 (16.3%) | 18 (33.3%) | 8 (66.7%) | ||
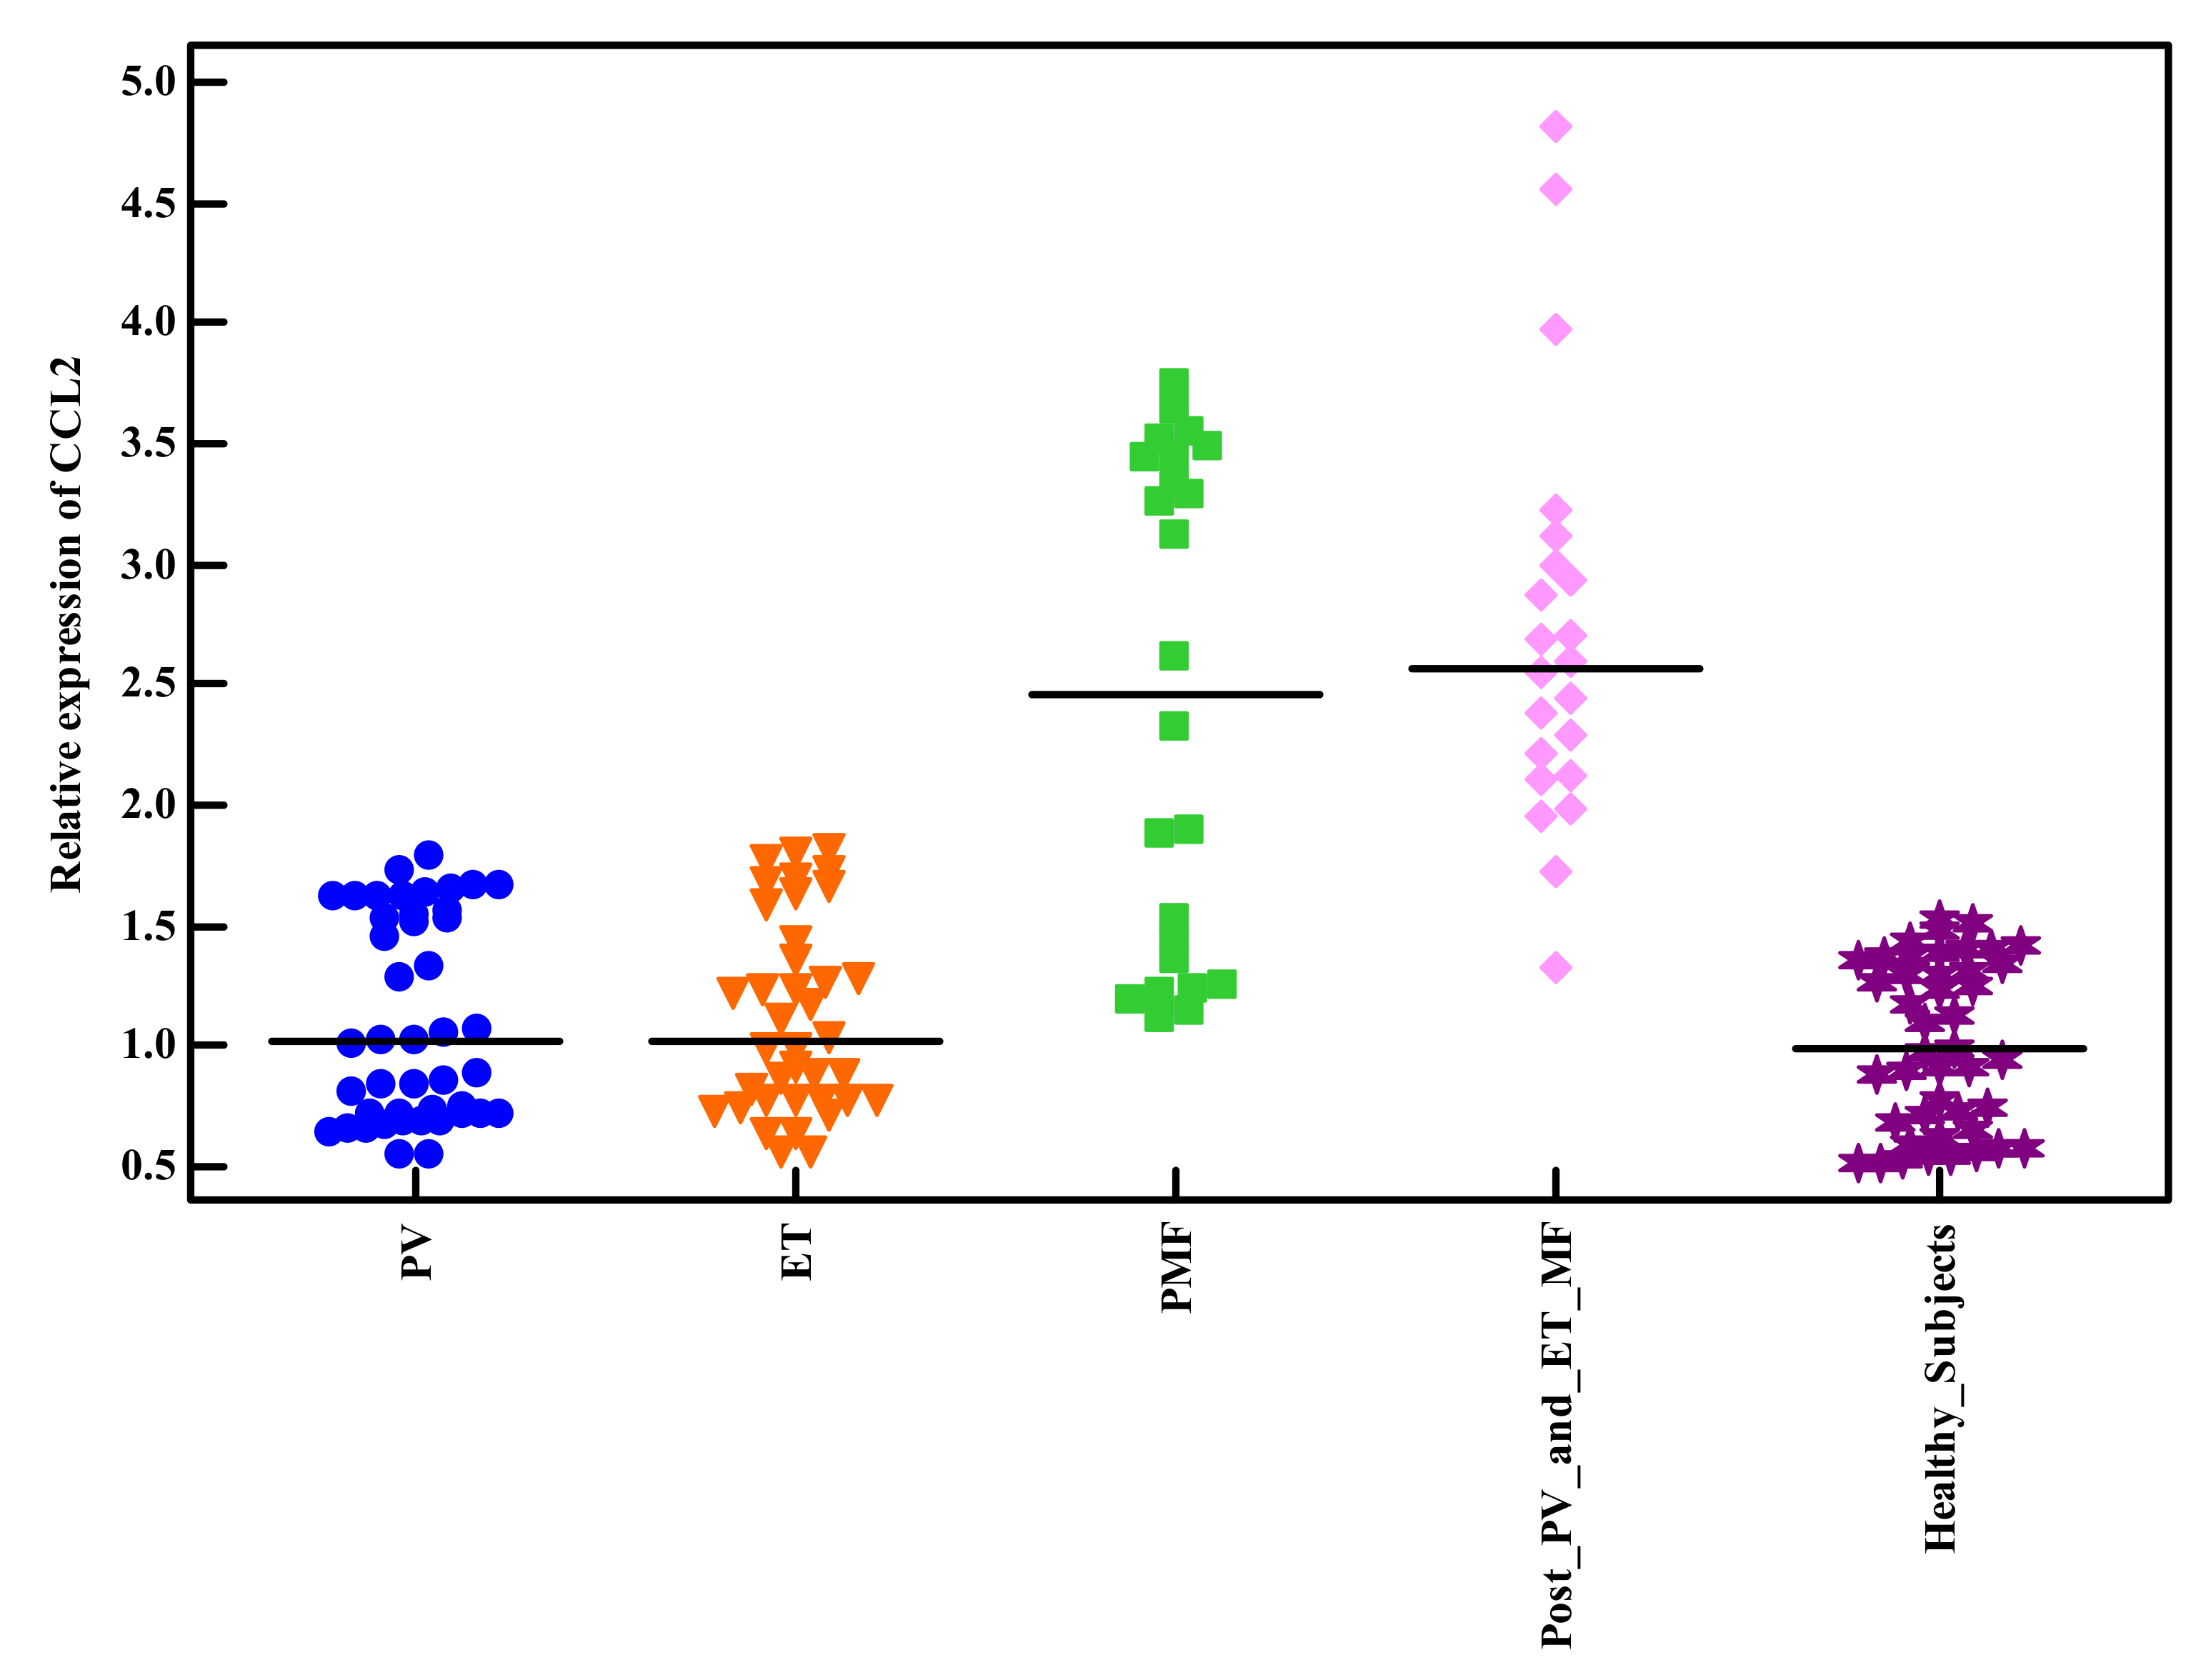
| Relative expression of CCL2 | |||||
| Mean ± SD. | 1.10 ± 0.49 | 1.88 ± 0.84 | 3.16 ± 1.12 | H = 47.665 * | <0.001 * |
| Median (Min.–Max.) | 0.91 (0.55–2.39) | 1.63 (0.56–3.48) | 3.54 (1.72–4.81) | ||
| Thrombotic events | 19 (31.1%) | 21 (38.2%) | 6 (50%) | χ2 = 1.759 | 0.415 |
| Bleeding events | 3 (4.9%) | 3 (5.5%) | 2 (16.7%) | χ2 = 2.513 | MCp = 0.280 |
| Cardiovascular risk factors | 16 (26.2%) | 17 (30.9%) | 2 (16.7%) | χ2 = 1.079 | 0.583 |
| Time evolution of MNPs (years) | |||||
| Mean ± SD. | 8.56 ± 1.51 | 7.33 ± 2.60 | 5 ± 0 | H = 11.166 * | 0.004 * |
| Median (Min.–Max.) | 9 (5–10) | 6 (6–14) | 5 (5–5) | ||
| Spleen size (cm) | |||||
| Mean ± SD. | 3.61 ± 5.45 | 3.95 ± 4.60 | 5.17 ± 6.19 | H = 0.996 | 0.608 |
| Median (Min.–Max.) | 1 (0–24) | 2 (0–21) | 2 (0–18) | ||
| IPSS | |||||
| Low/intermediate-1 | 15 (78.9%) | 1 (5.3%) | 0 (0%) | χ2 = 27.903 * | <0.001 * |
| Intermediate-2/high | 4 (21.1%) | 18 (94.7%) | 8 (100%) | ||
| Dacryocytes | 8 (13.1%) | 18 (32.7%) | 9 (75%) | χ2 = 20.737 * | <0.001 * |
| Erythroblastosis | 5 (8.2%) | 23 (41.8%) | 9 (75%) | χ2 = 29.599 * | <0.001 * |
| LDH (U/L) | |||||
| Mean ± SD. | 585.36 ± 206.41 | 611.13 ± 225.57 | 548.83 ± 226.16 | H = 0.844 | 0.656 |
| Median (Min.–Max.) | 514 (256–1271) | 602 (290–1266) | 555 (254–1010) | ||
Publisher’s Note: MDPI stays neutral with regard to jurisdictional claims in published maps and institutional affiliations. |
© 2022 by the authors. Licensee MDPI, Basel, Switzerland. This article is an open access article distributed under the terms and conditions of the Creative Commons Attribution (CC BY) license (https://creativecommons.org/licenses/by/4.0/).
Share and Cite
Hodeib, H.; Abd EL Hai, D.; Tawfik, M.A.; Allam, A.A.; Selim, A.; Elsawy, A.A.; Youssef, A. CCL2 rs1024611Gene Polymorphism in Philadelphia-Negative Myeloproliferative Neoplasms. Genes 2022, 13, 492. https://doi.org/10.3390/genes13030492
Hodeib H, Abd EL Hai D, Tawfik MA, Allam AA, Selim A, Elsawy AA, Youssef A. CCL2 rs1024611Gene Polymorphism in Philadelphia-Negative Myeloproliferative Neoplasms. Genes. 2022; 13(3):492. https://doi.org/10.3390/genes13030492
Chicago/Turabian StyleHodeib, Hossam, Dina Abd EL Hai, Mohamed A Tawfik, Alzahraa A. Allam, Amal Selim, Abdallah Ahmed Elsawy, and Amira Youssef. 2022. "CCL2 rs1024611Gene Polymorphism in Philadelphia-Negative Myeloproliferative Neoplasms" Genes 13, no. 3: 492. https://doi.org/10.3390/genes13030492
APA StyleHodeib, H., Abd EL Hai, D., Tawfik, M. A., Allam, A. A., Selim, A., Elsawy, A. A., & Youssef, A. (2022). CCL2 rs1024611Gene Polymorphism in Philadelphia-Negative Myeloproliferative Neoplasms. Genes, 13(3), 492. https://doi.org/10.3390/genes13030492