
Understanding Regulatory Mechanisms of Brain Function and Disease through 3D Genome Organization


Abstract
:1. Introduction
2. Human Brain Genome Organization and Its Relevance to Neuropsychiatric Disorders
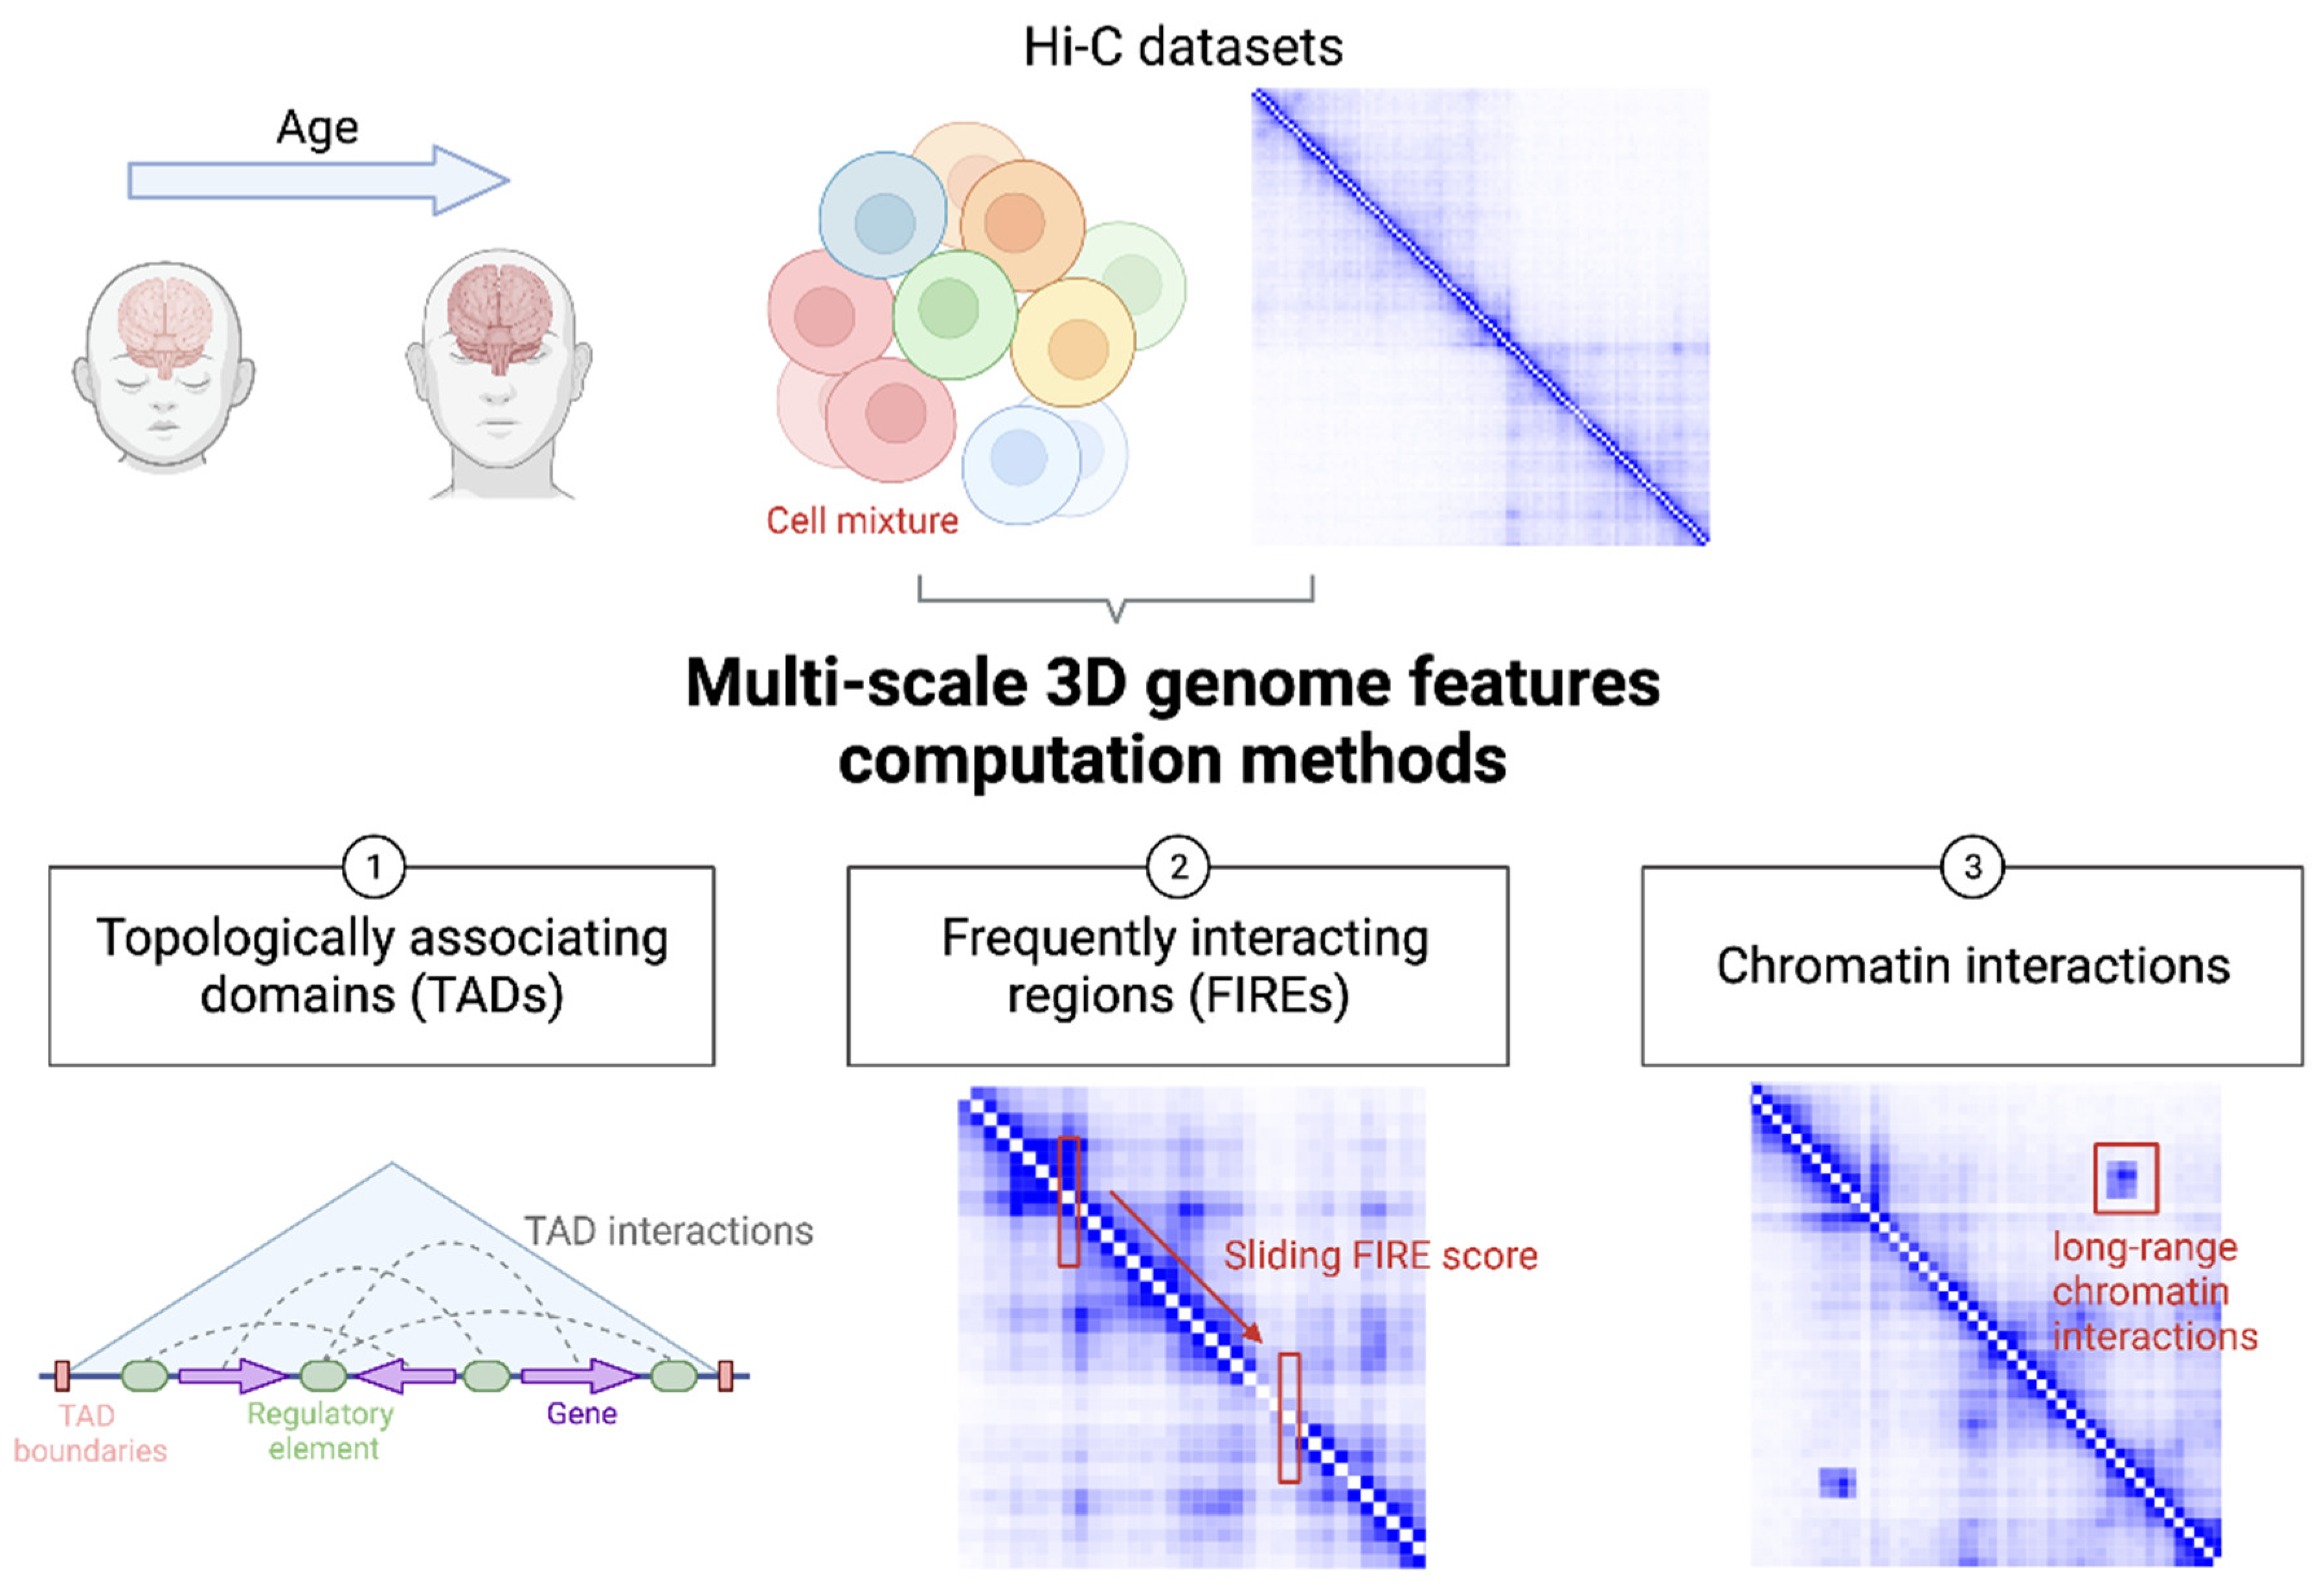
2.1. TAD
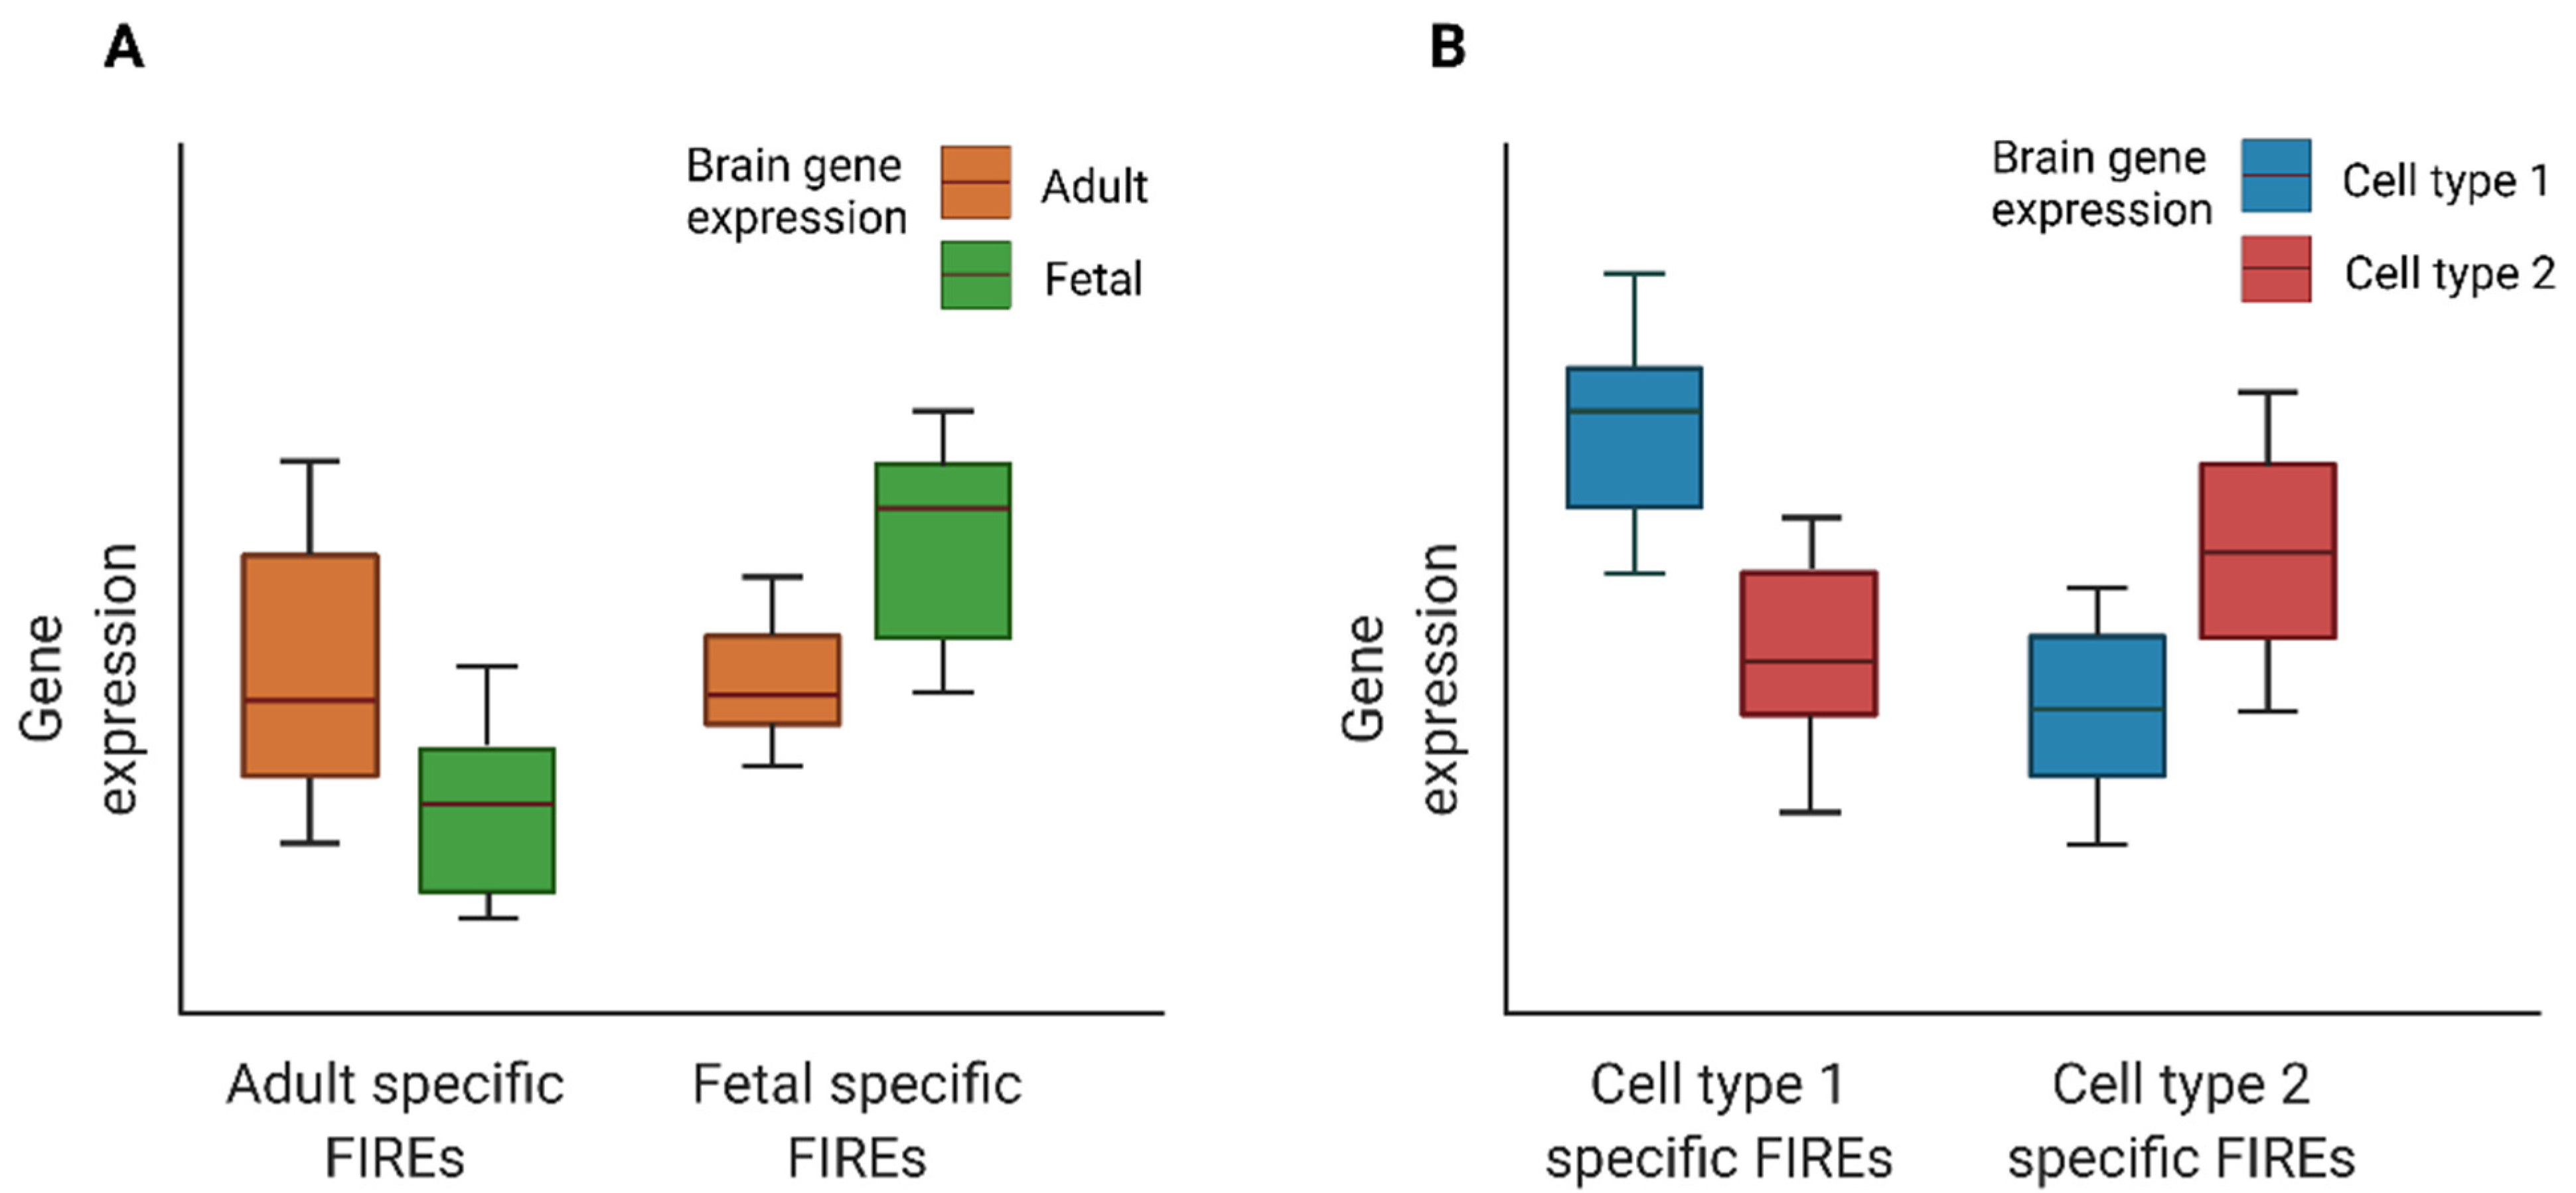
2.2. FIRE
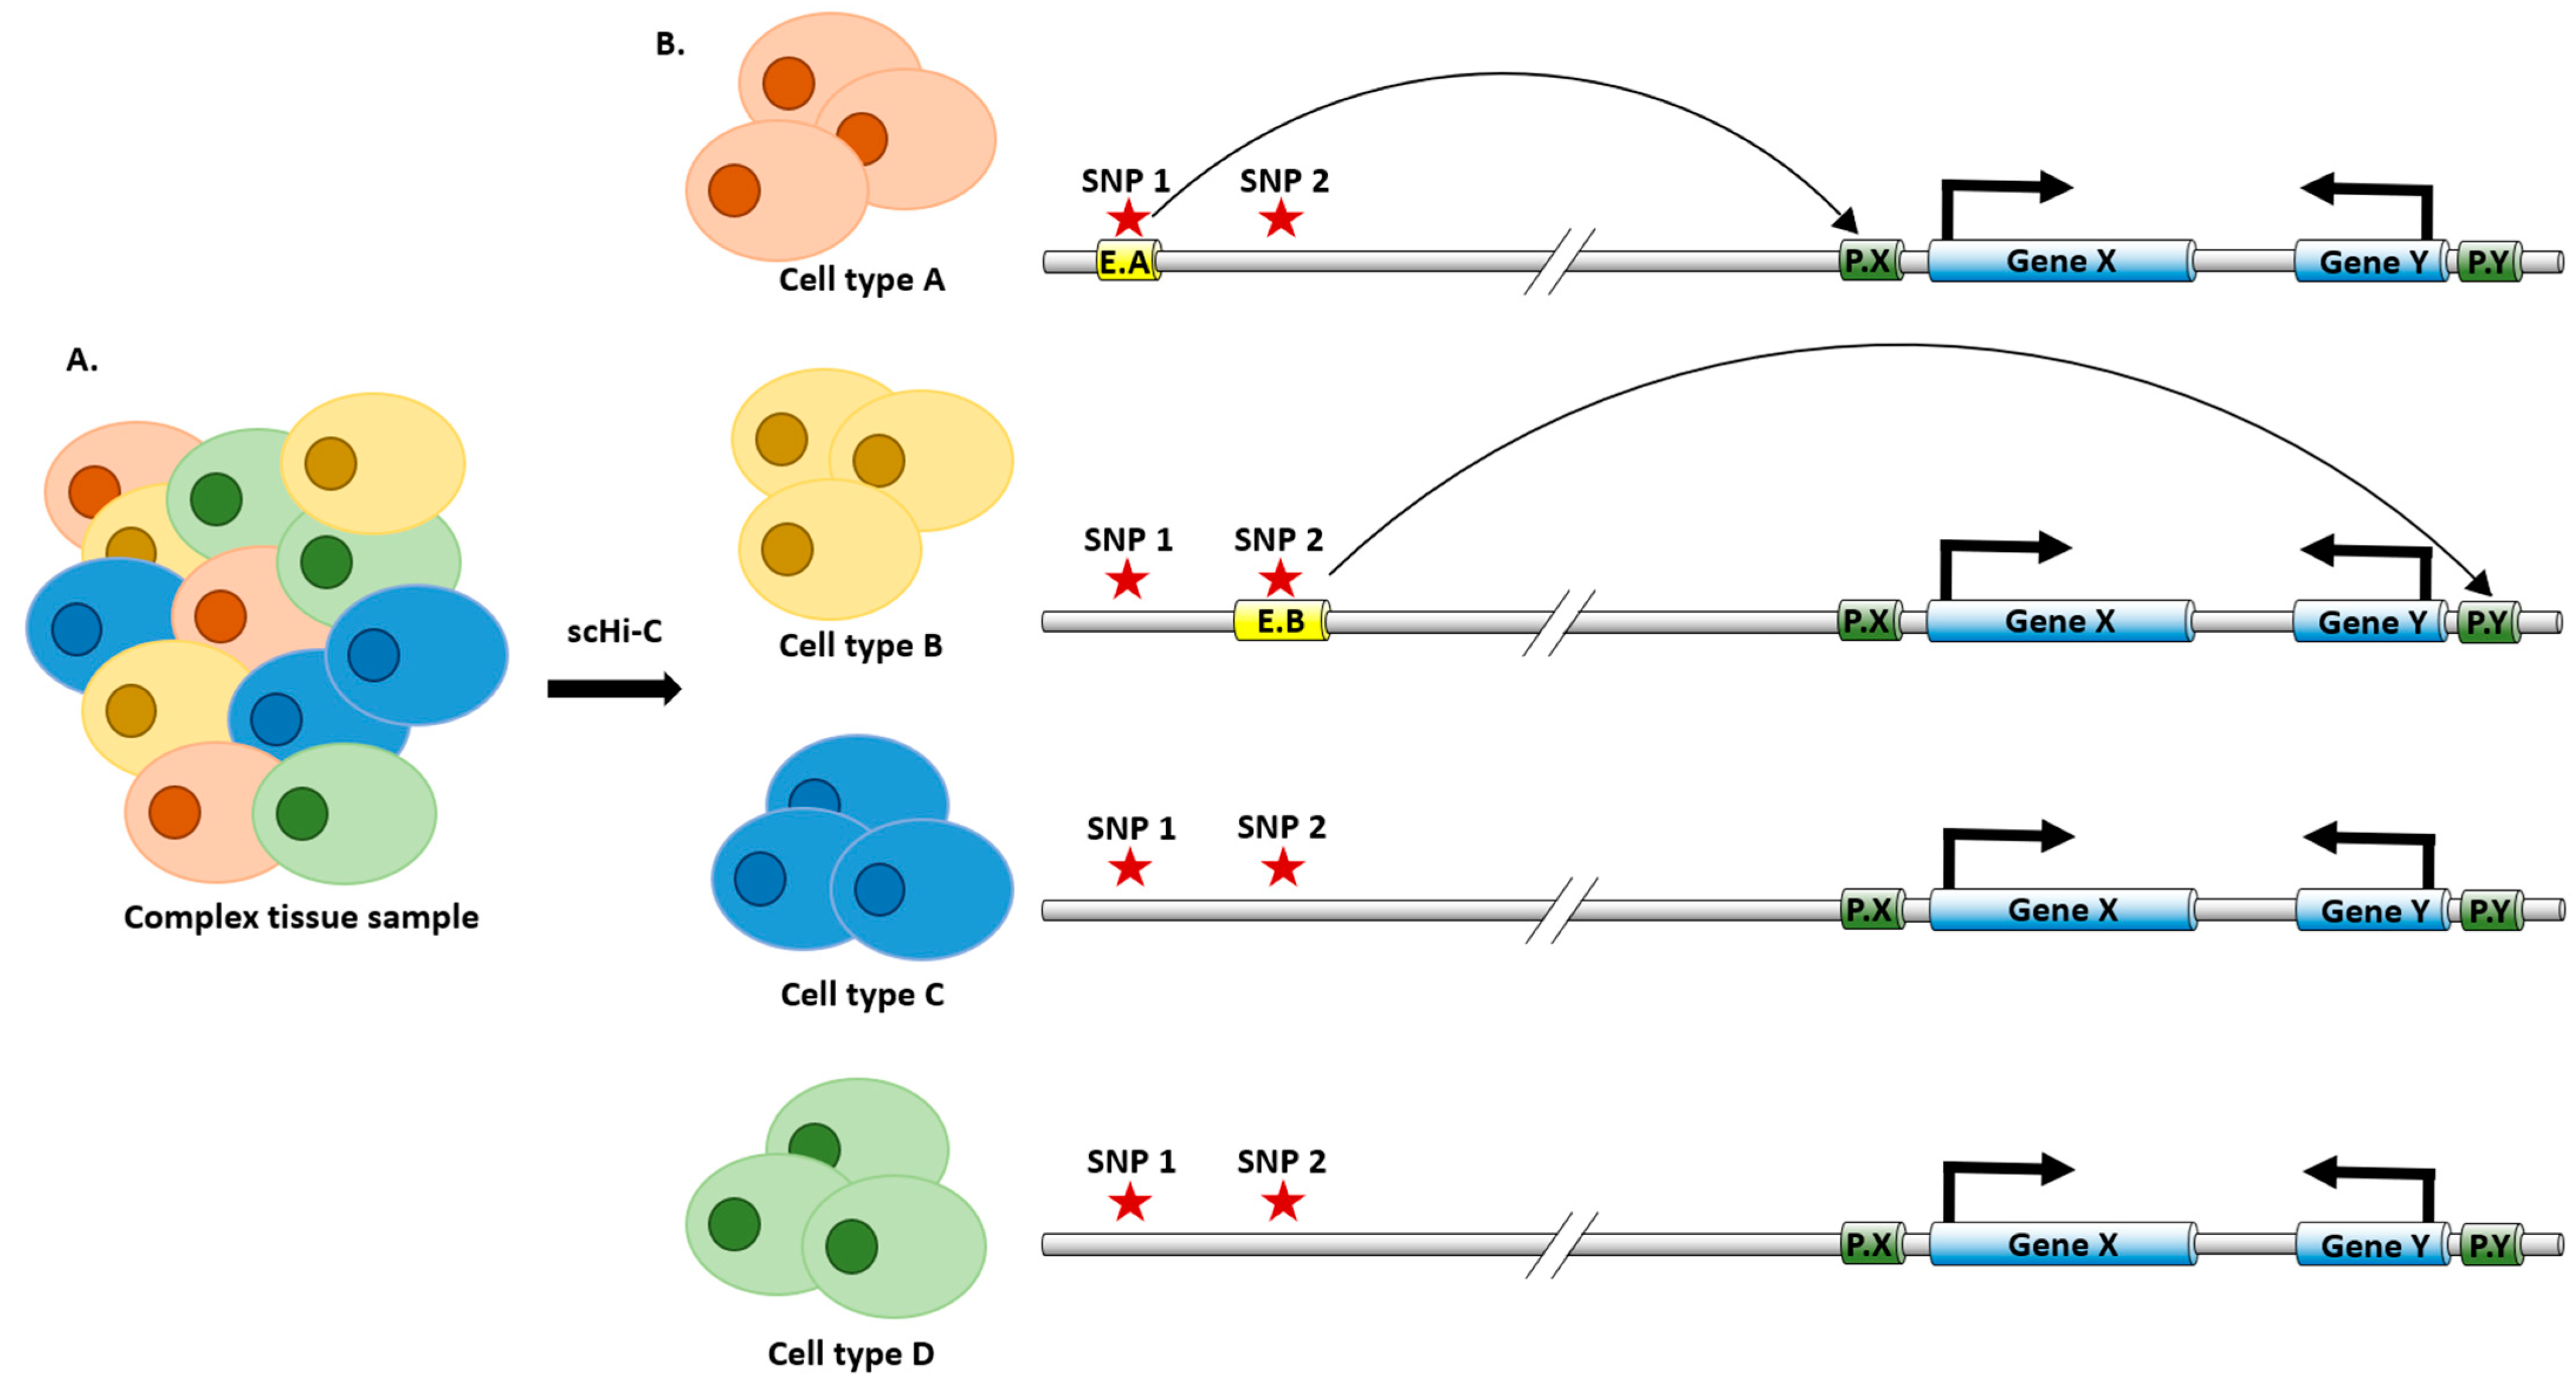
2.3. Chromatin Interactions
3. Integrative Omics Analysis
4. Single Cell Analysis
5. Discussion
6. Relevant Resources
Author Contributions
Funding
Institutional Review Board Statement
Informed Consent Statement
Data Availability Statement
Acknowledgments
Conflicts of Interest
Abbreviations
| Abbreviation | Meaning |
| 1D | One-dimensional |
| 3C | Chromosome conformation capture |
| 3D | Three-dimensional |
| ABC | Activity-by-contact |
| AD | Alzheimer’s disease |
| ADHD | Attention deficit hyperactivity disorder |
| BD | Bipolar disorder |
| CNV | Copy number variants |
| CT | Chromosome territory |
| DEL | Deletions |
| DG | Dentate gyrus |
| DUP | Duplication |
| FIRE | Frequently interacting region |
| GWAS | Genome-wide association studies |
| Hi-C | High-throughput chromatin conformation capture |
| INV | Inversion |
| LDSC | Linkage disequilibrium score regression |
| Mb | Mega-base |
| MEI | Mobile element insertion |
| MP | Mental process |
| PIR | Promoter interacting regions |
| TAD | Topologically associating domain |
| sci-Hi-C | Single-cell combinatorial index Hi-C |
| SCZ | Schizophrenia |
| scHi-C | Single cell Hi-C |
| SNP | Single nucleotide polymorphism |
| SV | Structural variant |
| UD | Unipolar depression |
| WES | Whole exome sequencing |
| WGS | Whole genome sequencing |
References
- Schmitt, A.D.; Hu, M.; Ren, B. Genome-wide mapping and analysis of chromosome architecture. Nat. Rev. Mol. Cell Biol. 2016, 17, 743–755. [Google Scholar] [CrossRef] [PubMed] [Green Version]
- Bonev, B.; Cavalli, G. Organization and function of the 3D genome. Nat. Rev. Genet. 2016, 17, 661–678. [Google Scholar] [CrossRef] [PubMed]
- Li, Y.; Hu, M.; Shen, Y. Gene regulation in the 3D genome. Hum. Mol. Genet. 2018, 27, R228–R233. [Google Scholar] [CrossRef] [PubMed] [Green Version]
- Rowley, M.J.; Corces, V.G. Organizational principles of 3D genome architecture. Nat. Rev. Genet. 2018, 19, 789–800. [Google Scholar] [CrossRef] [PubMed]
- Jerkovic, I.; Cavalli, G. Understanding 3D genome organization by multidisciplinary methods. Nat. Rev. Mol. Cell Biol. 2021, 22, 511–528. [Google Scholar] [CrossRef]
- Zheng, H.; Xie, W. The role of 3D genome organization in development and cell differentiation. Nat. Rev. Mol. Cell Biol. 2019, 20, 535–550. [Google Scholar] [CrossRef]
- Marchal, C.; Sima, J.; Gilbert, D.M. Control of DNA replication timing in the 3D genome. Nat. Rev. Mol. Cell Biol. 2019, 20, 721–737. [Google Scholar] [CrossRef]
- Lieberman-Aiden, E.; van Berkum, N.L.; Williams, L.; Imakaev, M.; Ragoczy, T.; Telling, A.; Amit, I.; Lajoie, B.R.; Sabo, P.J.; Dorschner, M.O.; et al. Comprehensive mapping of long-range interactions reveals folding principles of the human genome. Science 2009, 326, 289–293. [Google Scholar] [CrossRef] [Green Version]
- Rao, S.S.P.; Huntley, M.H.; Durand, N.C.; Stamenova, E.K.; Bochkov, I.D.; Robinson, J.T.; Sanborn, A.L.; Machol, I.; Omer, A.D.; Lander, E.S.; et al. A 3D map of the human genome at kilobase resolution reveals principles of chromatin looping. Cell 2014, 159, 1665–1680. [Google Scholar] [CrossRef] [Green Version]
- Bonev, B.; Mendelson Cohen, N.; Szabo, Q.; Fritsch, L.; Papadopoulos, G.L.; Lubling, Y.; Xu, X.; Lv, X.; Hugnot, J.-P.; Tanay, A.; et al. Multiscale 3D Genome Rewiring during Mouse Neural Development. Cell 2017, 171, 557–572.e24. [Google Scholar] [CrossRef] [Green Version]
- Schmitt, A.D.; Hu, M.; Jung, I.; Xu, Z.; Qiu, Y.; Tan, C.L.; Li, Y.; Lin, S.; Lin, Y.; Barr, C.L.; et al. A compendium of chromatin contact maps reveals spatially active regions in the human genome. Cell Rep. 2016, 17, 2042–2059. [Google Scholar] [CrossRef] [Green Version]
- Cremer, T.; Cremer, M. Chromosome territories. Cold Spring Harb. Perspect. Biol. 2010, 2, a003889. [Google Scholar] [CrossRef] [PubMed] [Green Version]
- Dixon, J.R.; Selvaraj, S.; Yue, F.; Kim, A.; Li, Y.; Shen, Y.; Hu, M.; Liu, J.S.; Ren, B. Topological domains in mammalian genomes identified by analysis of chromatin interactions. Nature 2012, 485, 376–380. [Google Scholar] [CrossRef] [PubMed] [Green Version]
- Nora, E.P.; Lajoie, B.R.; Schulz, E.G.; Giorgetti, L.; Okamoto, I.; Servant, N.; Piolot, T.; van Berkum, N.L.; Meisig, J.; Sedat, J.; et al. Spatial partitioning of the regulatory landscape of the X-inactivation centre. Nature 2012, 485, 381–385. [Google Scholar] [CrossRef] [PubMed] [Green Version]
- Schoenfelder, S.; Fraser, P. Long-range enhancer-promoter contacts in gene expression control. Nat. Rev. Genet. 2019, 20, 437–455. [Google Scholar] [CrossRef] [PubMed]
- Lagler, T.M.; Abnousi, A.; Hu, M.; Yang, Y.; Li, Y. HiC-ACT: Improved detection of chromatin interactions from Hi-C data via aggregated Cauchy test. Am. J. Hum. Genet. 2021, 108, 257–268. [Google Scholar] [CrossRef] [PubMed]
- Martin, J.S.; Xu, Z.; Reiner, A.P.; Mohlke, K.L.; Sullivan, P.; Ren, B.; Hu, M.; Li, Y. HUGIn: Hi-C Unifying Genomic Interrogator. Bioinformatics 2017, 33, 3793–3795. [Google Scholar] [CrossRef]
- Stadhouders, R.; Filion, G.J.; Graf, T. Transcription factors and 3D genome conformation in cell-fate decisions. Nature 2019, 569, 345–354. [Google Scholar] [CrossRef]
- Krijger, P.H.L.; de Laat, W. Regulation of disease-associated gene expression in the 3D genome. Nat. Rev. Mol. Cell Biol. 2016, 17, 771–782. [Google Scholar] [CrossRef]
- Schulz, J.M.; Al-Khazraji, B.K.; Shoemaker, J.K. Sodium nitroglycerin induces middle cerebral artery vasodilatation in young, healthy adults. Exp. Physiol. 2018, 103, 1047–1055. [Google Scholar] [CrossRef] [Green Version]
- Mifsud, B.; Tavares-Cadete, F.; Young, A.N.; Sugar, R.; Schoenfelder, S.; Ferreira, L.; Wingett, S.W.; Andrews, S.; Grey, W.; Ewels, P.A.; et al. Mapping long-range promoter contacts in human cells with high-resolution capture Hi-C. Nat. Genet. 2015, 47, 598–606. [Google Scholar] [CrossRef] [PubMed]
- Fullwood, M.J.; Liu, M.H.; Pan, Y.F.; Liu, J.; Xu, H.; Mohamed, Y.B.; Orlov, Y.L.; Velkov, S.; Ho, A.; Mei, P.H.; et al. An oestrogen-receptor-alpha-bound human chromatin interactome. Nature 2009, 462, 58–64. [Google Scholar] [CrossRef] [PubMed] [Green Version]
- Fang, R.; Yu, M.; Li, G.; Chee, S.; Liu, T.; Schmitt, A.D.; Ren, B. Mapping of long-range chromatin interactions by proximity ligation-assisted ChIP-seq. Cell Res. 2016, 26, 1345–1348. [Google Scholar] [CrossRef] [PubMed] [Green Version]
- Beagrie, R.A.; Scialdone, A.; Schueler, M.; Kraemer, D.C.A.; Chotalia, M.; Xie, S.Q.; Barbieri, M.; de Santiago, I.; Lavitas, L.-M.; Branco, M.R.; et al. Complex multi-enhancer contacts captured by genome architecture mapping. Nature 2017, 543, 519–524. [Google Scholar] [CrossRef] [PubMed]
- Winick-Ng, W.; Kukalev, A.; Harabula, I.; Zea-Redondo, L.; Szabó, D.; Meijer, M.; Serebreni, L.; Zhang, Y.; Bianco, S.; Chiariello, A.M.; et al. Cell-type specialization is encoded by specific chromatin topologies. Nature 2021, 599, 684–691. [Google Scholar] [CrossRef] [PubMed]
- Quinodoz, S.A.; Ollikainen, N.; Tabak, B.; Palla, A.; Schmidt, J.M.; Detmar, E.; Lai, M.M.; Shishkin, A.A.; Bhat, P.; Takei, Y.; et al. Higher-Order Inter-chromosomal Hubs Shape 3D Genome Organization in the Nucleus. Cell 2018, 174, 744–757.e24. [Google Scholar] [CrossRef] [PubMed] [Green Version]
- Chen, B.; Guan, J.; Huang, B. Imaging specific genomic DNA in living cells. Annu. Rev. Biophys. 2016, 45, 1–23. [Google Scholar] [CrossRef] [Green Version]
- Dekker, J. Mapping the 3D genome: Aiming for consilience. Nat. Rev. Mol. Cell Biol. 2016, 17, 741–742. [Google Scholar] [CrossRef]
- Yu, M.; Ren, B. The Three-Dimensional Organization of Mammalian Genomes. Annu. Rev. Cell Dev. Biol. 2017, 33, 265–289. [Google Scholar] [CrossRef]
- Dekker, J.; Belmont, A.S.; Guttman, M.; Leshyk, V.O.; Lis, J.T.; Lomvardas, S.; Mirny, L.A.; O’Shea, C.C.; Park, P.J.; Ren, B.; et al. 4D Nucleome Network The 4D nucleome project. Nature 2017, 549, 219–226. [Google Scholar] [CrossRef]
- Zhuang, X. Spatially resolved single-cell genomics and transcriptomics by imaging. Nat. Methods 2021, 18, 18–22. [Google Scholar] [CrossRef] [PubMed]
- Harabula, I.; Pombo, A. The dynamics of chromatin architecture in brain development and function. Curr. Opin. Genet. Dev. 2021, 67, 84–93. [Google Scholar] [CrossRef] [PubMed]
- Nagano, T.; Lubling, Y.; Stevens, T.J.; Schoenfelder, S.; Yaffe, E.; Dean, W.; Laue, E.D.; Tanay, A.; Fraser, P. Single-cell Hi-C reveals cell-to-cell variability in chromosome structure. Nature 2013, 502, 59–64. [Google Scholar] [CrossRef] [PubMed] [Green Version]
- Nagano, T.; Lubling, Y.; Várnai, C.; Dudley, C.; Leung, W.; Baran, Y.; Mendelson Cohen, N.; Wingett, S.; Fraser, P.; Tanay, A. Cell-cycle dynamics of chromosomal organization at single-cell resolution. Nature 2017, 547, 61–67. [Google Scholar] [CrossRef] [PubMed] [Green Version]
- Flyamer, I.M.; Gassler, J.; Imakaev, M.; Brandão, H.B.; Ulianov, S.V.; Abdennur, N.; Razin, S.V.; Mirny, L.A.; Tachibana-Konwalski, K. Single-nucleus Hi-C reveals unique chromatin reorganization at oocyte-to-zygote transition. Nature 2017, 544, 110–114. [Google Scholar] [CrossRef] [Green Version]
- Tan, L.; Xing, D.; Chang, C.-H.; Li, H.; Xie, X.S. Three-dimensional genome structures of single diploid human cells. Science 2018, 361, 924–928. [Google Scholar] [CrossRef] [Green Version]
- Ramani, V.; Deng, X.; Qiu, R.; Gunderson, K.L.; Steemers, F.J.; Disteche, C.M.; Noble, W.S.; Duan, Z.; Shendure, J. Massively multiplex single-cell Hi-C. Nat. Methods 2017, 14, 263–266. [Google Scholar] [CrossRef] [Green Version]
- Kim, H.-J.; Yardımcı, G.G.; Bonora, G.; Ramani, V.; Liu, J.; Qiu, R.; Lee, C.; Hesson, J.; Ware, C.B.; Shendure, J.; et al. Capturing cell type-specific chromatin compartment patterns by applying topic modeling to single-cell Hi-C data. PLoS Comput. Biol. 2020, 16, e1008173. [Google Scholar] [CrossRef]
- Mulqueen, R.M.; Pokholok, D.; O’Connell, B.L.; Thornton, C.A.; Zhang, F.; O’Roak, B.J.; Link, J.; Yardımcı, G.G.; Sears, R.C.; Steemers, F.J.; et al. High-content single-cell combinatorial indexing. Nat. Biotechnol. 2021, 39, 1574–1580. [Google Scholar] [CrossRef]
- Lee, D.-S.; Luo, C.; Zhou, J.; Chandran, S.; Rivkin, A.; Bartlett, A.; Nery, J.R.; Fitzpatrick, C.; O’Connor, C.; Dixon, J.R.; et al. Simultaneous profiling of 3D genome structure and DNA methylation in single human cells. Nat. Methods 2019, 16, 999–1006. [Google Scholar] [CrossRef]
- Liu, H.; Zhou, J.; Tian, W.; Luo, C.; Bartlett, A.; Aldridge, A.; Lucero, J.; Osteen, J.K.; Nery, J.R.; Chen, H.; et al. DNA methylation atlas of the mouse brain at single-cell resolution. Nature 2021, 598, 120–128. [Google Scholar] [CrossRef] [PubMed]
- Li, G.; Liu, Y.; Zhang, Y.; Kubo, N.; Yu, M.; Fang, R.; Kellis, M.; Ren, B. Joint profiling of DNA methylation and chromatin architecture in single cells. Nat. Methods 2019, 16, 991–993. [Google Scholar] [CrossRef] [PubMed]
- Yu, M.; Abnousi, A.; Zhang, Y.; Li, G.; Lee, L.; Chen, Z.; Fang, R.; Lagler, T.M.; Yang, Y.; Wen, J.; et al. SnapHiC: A computational pipeline to identify chromatin loops from single-cell Hi-C data. Nat. Methods 2021, 18, 1056–1059. [Google Scholar] [CrossRef] [PubMed]
- Zhang, R.; Zhou, T.; Ma, J. Multiscale and integrative single-cell Hi-C analysis with Higashi. Nat. Biotechnol. 2022, 40, 254–261. [Google Scholar] [CrossRef]
- Zhou, J.; Ma, J.; Chen, Y.; Cheng, C.; Bao, B.; Peng, J.; Sejnowski, T.J.; Dixon, J.R.; Ecker, J.R. Robust single-cell Hi-C clustering by convolution- and random-walk-based imputation. Proc Natl Acad Sci USA 2019, 116, 14011–14018. [Google Scholar] [CrossRef] [Green Version]
- Forcato, M.; Nicoletti, C.; Pal, K.; Livi, C.M.; Ferrari, F.; Bicciato, S. Comparison of computational methods for Hi-C data analysis. Nat. Methods 2017, 14, 679–685. [Google Scholar] [CrossRef]
- Zhou, T.; Zhang, R.; Ma, J. The 3D genome structure of single cells. Annu. Rev. Biomed. Data Sci. 2021, 4, 21–41. [Google Scholar] [CrossRef]
- Galitsyna, A.A.; Gelfand, M.S. Single-cell Hi-C data analysis: Safety in numbers. Brief. Bioinformatics 2021, 22, bbab316. [Google Scholar] [CrossRef]
- Simpkins, C.A.; Simpkins, A.M. Neuroscience for Clinicians: Evidence, Models, and Practice; Springer: Berlin/Heidelberg, Germany, 2012; p. 143. ISBN 978-1-4614-4842-6. [Google Scholar]
- Bassett, D.S.; Gazzaniga, M.S. Understanding complexity in the human brain. Trends Cogn. Sci. (Regul. Ed.) 2011, 15, 200–209. [Google Scholar] [CrossRef] [Green Version]
- O’Leary, D.H.; Polak, J.F.; Kronmal, R.A.; Manolio, T.A.; Burke, G.L.; Wolfson, S.K. Carotid-artery intima and media thickness as a risk factor for myocardial infarction and stroke in older adults. Cardiovascular Health Study Collaborative Research Group. N. Engl. J. Med. 1999, 340, 14–22. [Google Scholar] [CrossRef]
- Jevtic, S.; Sengar, A.S.; Salter, M.W.; McLaurin, J. The role of the immune system in Alzheimer disease: Etiology and treatment. Ageing Res. Rev. 2017, 40, 84–94. [Google Scholar] [CrossRef] [PubMed]
- Jansen, I.E.; Savage, J.E.; Watanabe, K.; Bryois, J.; Williams, D.M.; Steinberg, S.; Sealock, J.; Karlsson, I.K.; Hägg, S.; Athanasiu, L.; et al. Genome-wide meta-analysis identifies new loci and functional pathways influencing Alzheimer’s disease risk. Nat. Genet. 2019, 51, 404–413. [Google Scholar] [CrossRef] [PubMed]
- Kunkle, B.W.; Grenier-Boley, B.; Sims, R.; Bis, J.C.; Damotte, V.; Naj, A.C.; Boland, A.; Vronskaya, M.; van der Lee, S.J.; Amlie-Wolf, A.; et al. Genetic meta-analysis of diagnosed Alzheimer’s disease identifies new risk loci and implicates Aβ, tau, immunity and lipid processing. Nat. Genet. 2019, 51, 414–430. [Google Scholar] [CrossRef] [Green Version]
- Bryois, J.; Skene, N.G.; Hansen, T.F.; Kogelman, L.J.A.; Watson, H.J.; Liu, Z.; Eating Disorders Working Group of the Psychiatric Genomics Consortium; International Headache Genetics Consortium; 23andMe Research Team; Brueggeman, L.; et al. Genetic identification of cell types underlying brain complex traits yields insights into the etiology of Parkinson’s disease. Nat. Genet. 2020, 52, 482–493. [Google Scholar] [CrossRef]
- McConnell, H.L.; Kersch, C.N.; Woltjer, R.L.; Neuwelt, E.A. The translational significance of the neurovascular unit. J. Biol. Chem. 2017, 292, 762–770. [Google Scholar] [CrossRef] [PubMed] [Green Version]
- Darmanis, S.; Sloan, S.A.; Zhang, Y.; Enge, M.; Caneda, C.; Shuer, L.M.; Hayden Gephart, M.G.; Barres, B.A.; Quake, S.R. A survey of human brain transcriptome diversity at the single cell level. Proc Natl Acad Sci USA 2015, 112, 7285–7290. [Google Scholar] [CrossRef] [Green Version]
- Mathys, H.; Davila-Velderrain, J.; Peng, Z.; Gao, F.; Mohammadi, S.; Young, J.Z.; Menon, M.; He, L.; Abdurrob, F.; Jiang, X.; et al. Single-cell transcriptomic analysis of Alzheimer’s disease. Nature 2019, 570, 332–337. [Google Scholar] [CrossRef]
- Allen, N.J.; Barres, B.A. Neuroscience: Glia—More than just brain glue. Nature 2009, 457, 675–677. [Google Scholar] [CrossRef]
- Zeng, H.; Sanes, J.R. Neuronal cell-type classification: Challenges, opportunities and the path forward. Nat. Rev. Neurosci. 2017, 18, 530–546. [Google Scholar] [CrossRef]
- Song, M.; Yang, X.; Ren, X.; Maliskova, L.; Li, B.; Jones, I.R.; Wang, C.; Jacob, F.; Wu, K.; Traglia, M.; et al. Mapping cis-regulatory chromatin contacts in neural cells links neuropsychiatric disorder risk variants to target genes. Nat. Genet. 2019, 51, 1252–1262. [Google Scholar] [CrossRef]
- Nott, A.; Holtman, I.R.; Coufal, N.G.; Schlachetzki, J.C.M.; Yu, M.; Hu, R.; Han, C.Z.; Pena, M.; Xiao, J.; Wu, Y.; et al. Brain cell type-specific enhancer-promoter interactome maps and disease-risk association. Science 2019, 366, 1134–1139. [Google Scholar] [CrossRef]
- Song, M.; Pebworth, M.-P.; Yang, X.; Abnousi, A.; Fan, C.; Wen, J.; Rosen, J.D.; Choudhary, M.N.K.; Cui, X.; Jones, I.R.; et al. Cell-type-specific 3D epigenomes in the developing human cortex. Nature 2020, 587, 644–649. [Google Scholar] [CrossRef] [PubMed]
- Hu, B.; Won, H.; Mah, W.; Park, R.B.; Kassim, B.; Spiess, K.; Kozlenkov, A.; Crowley, C.A.; Pochareddy, S.; PsychENCODE Consortium; et al. Neuronal and glial 3D chromatin architecture informs the cellular etiology of brain disorders. Nat. Commun. 2021, 12, 3968. [Google Scholar] [CrossRef] [PubMed]
- Li, M.; Santpere, G.; Imamura Kawasawa, Y.; Evgrafov, O.V.; Gulden, F.O.; Pochareddy, S.; Sunkin, S.M.; Li, Z.; Shin, Y.; Zhu, Y.; et al. Integrative functional genomic analysis of human brain development and neuropsychiatric risks. Science 2018, 362, eaat7615. [Google Scholar] [CrossRef] [PubMed] [Green Version]
- Crowley, C.; Yang, Y.; Qiu, Y.; Hu, B.; Abnousi, A.; Lipiński, J.; Plewczyński, D.; Wu, D.; Won, H.; Ren, B.; et al. FIREcaller: Detecting frequently interacting regions from Hi-C data. Comput. Struct. Biotechnol. J. 2021, 19, 355–362. [Google Scholar] [CrossRef] [PubMed]
- Giusti-Rodriguez, P.; Lu, L.; Yang, Y.; Crowley, C.A.; Liu, X.; Juric, I.; Martin, J.S.; Abnousi, A.; Allred, S.C.; Ancalade, N.; et al. Using three-dimensional regulatory chromatin interactions from adult and fetal cortex to interpret genetic results for psychiatric disorders and cognitive traits. BioRxiv 2018. [Google Scholar] [CrossRef] [Green Version]
- Schizophrenia Working Group of the Psychiatric Genomics Consortium. Biological insights from 108 schizophrenia-associated genetic loci. Nature 2014, 511, 421–427. [Google Scholar] [CrossRef] [Green Version]
- Pardiñas, A.F.; Holmans, P.; Pocklington, A.J.; Escott-Price, V.; Ripke, S.; Carrera, N.; Legge, S.E.; Bishop, S.; Cameron, D.; Hamshere, M.L.; et al. Common schizophrenia alleles are enriched in mutation-intolerant genes and in regions under strong background selection. Nat. Genet. 2018, 50, 381–389. [Google Scholar] [CrossRef] [Green Version]
- Schizophrenia Working Group of the Psychiatric Genomics Consortium; Ripke, S.; Walters, J.T.; O’Donovan, M.C. Mapping genomic loci prioritises genes and implicates synaptic biology in schizophrenia. medRxiv 2020. [Google Scholar] [CrossRef]
- Singh, T.; Poterba, T.; Curtis, D.; Akil, H.; Al Eissa, M.; Barchas, J.D.; Bass, N.; Bigdeli, T.B.; Breen, G.; Bromet, E.J.; et al. Exome sequencing identifies rare coding variants in 10 genes which confer substantial risk for schizophrenia. medRxiv 2020. [Google Scholar] [CrossRef]
- Halvorsen, M.; Huh, R.; Oskolkov, N.; Wen, J.; Netotea, S.; Giusti-Rodriguez, P.; Karlsson, R.; Bryois, J.; Nystedt, B.; Ameur, A.; et al. Increased burden of ultra-rare structural variants localizing to boundaries of topologically associated domains in schizophrenia. Nat. Commun. 2020, 11, 1842. [Google Scholar] [CrossRef] [PubMed] [Green Version]
- Gazal, S.; Finucane, H.K.; Furlotte, N.A.; Loh, P.-R.; Palamara, P.F.; Liu, X.; Schoech, A.; Bulik-Sullivan, B.; Neale, B.M.; Gusev, A.; et al. Linkage disequilibrium-dependent architecture of human complex traits shows action of negative selection. Nat. Genet. 2017, 49, 1421–1427. [Google Scholar] [CrossRef] [PubMed]
- Wainschtein, P.; Jain, D.P.; Yengo, L.; Zheng, Z.; TOPMed Anthropometry Working Group; Trans-Omics for Precision Medicine Consortium; Cupples, L.A.; Shadyab, A.H.; McKnight, B.; Shoemaker, B.M.; et al. Recovery of trait heritability from whole genome sequence data. BioRxiv 2019. [Google Scholar] [CrossRef]
- Lupiáñez, D.G.; Kraft, K.; Heinrich, V.; Krawitz, P.; Brancati, F.; Klopocki, E.; Horn, D.; Kayserili, H.; Opitz, J.M.; Laxova, R.; et al. Disruptions of topological chromatin domains cause pathogenic rewiring of gene-enhancer interactions. Cell 2015, 161, 1012–1025. [Google Scholar] [CrossRef] [Green Version]
- Redin, C.; Brand, H.; Collins, R.L.; Kammin, T.; Mitchell, E.; Hodge, J.C.; Hanscom, C.; Pillalamarri, V.; Seabra, C.M.; Abbott, M.-A.; et al. The genomic landscape of balanced cytogenetic abnormalities associated with human congenital anomalies. Nat. Genet. 2017, 49, 36–45. [Google Scholar] [CrossRef] [Green Version]
- Sun, Q.; Crowley, C.A.; Huang, L.; Wen, J.; Chen, J.; Bao, E.L.; Auer, P.L.; Lettre, G.; Reiner, A.P.; Sankaran, V.G.; et al. From GWAS variant to function: A study of ∼148,000 variants for blood cell traits. HGG Adv. 2022, 3, 100063. [Google Scholar] [CrossRef]
- Zhao, B.; Shan, Y.; Yang, Y.; Yu, Z.; Li, T.; Wang, X.; Luo, T.; Zhu, Z.; Sullivan, P.; Zhao, H.; et al. Transcriptome-wide association analysis of brain structures yields insights into pleiotropy with complex neuropsychiatric traits. Nat. Commun. 2021, 12, 2878. [Google Scholar] [CrossRef]
- Walters, R.K.; Polimanti, R.; Johnson, E.C.; McClintick, J.N.; Adams, M.J.; Adkins, A.E.; Aliev, F.; Bacanu, S.-A.; Batzler, A.; Bertelsen, S.; et al. Transancestral GWAS of alcohol dependence reveals common genetic underpinnings with psychiatric disorders. Nat. Neurosci. 2018, 21, 1656–1669. [Google Scholar] [CrossRef] [Green Version]
- Grove, J.; Ripke, S.; Als, T.D.; Mattheisen, M.; Walters, R.K.; Won, H.; Pallesen, J.; Agerbo, E.; Andreassen, O.A.; Anney, R.; et al. Identification of common genetic risk variants for autism spectrum disorder. Nat. Genet. 2019, 51, 431–444. [Google Scholar] [CrossRef] [Green Version]
- Wray, N.R.; Ripke, S.; Mattheisen, M.; Trzaskowski, M.; Byrne, E.M.; Abdellaoui, A.; Adams, M.J.; Agerbo, E.; Air, T.M.; Andlauer, T.M.F.; et al. Genome-wide association analyses identify 44 risk variants and refine the genetic architecture of major depression. Nat. Genet. 2018, 50, 668–681. [Google Scholar] [CrossRef] [Green Version]
- Won, H.; de la Torre-Ubieta, L.; Stein, J.L.; Parikshak, N.N.; Huang, J.; Opland, C.K.; Gandal, M.J.; Sutton, G.J.; Hormozdiari, F.; Lu, D.; et al. Chromosome conformation elucidates regulatory relationships in developing human brain. Nature 2016, 538, 523–527. [Google Scholar] [CrossRef] [PubMed] [Green Version]
- Zhou, X.; Chen, Y.; Mok, K.Y.; Kwok, T.C.Y.; Mok, V.C.T.; Guo, Q.; Ip, F.C.; Chen, Y.; Mullapudi, N.; Alzheimer’s Disease Neuroimaging Initiative; et al. Non-coding variability at the APOE locus contributes to the Alzheimer’s risk. Nat. Commun. 2019, 10, 3310. [Google Scholar] [CrossRef] [PubMed] [Green Version]
- Collins, R.L.; Brand, H.; Karczewski, K.J.; Zhao, X.; Alföldi, J.; Francioli, L.C.; Khera, A.V.; Lowther, C.; Gauthier, L.D.; Wang, H.; et al. A structural variation reference for medical and population genetics. Nature 2020, 581, 444–451. [Google Scholar] [CrossRef] [PubMed]
- Ebert, P.; Audano, P.A.; Zhu, Q.; Rodriguez-Martin, B.; Porubsky, D.; Bonder, M.J.; Sulovari, A.; Ebler, J.; Zhou, W.; Serra Mari, R.; et al. Haplotype-resolved diverse human genomes and integrated analysis of structural variation. Science 2021, 372, eabf7117. [Google Scholar] [CrossRef] [PubMed]
- Johnston, M.J.; Nikolic, A.; Ninkovic, N.; Guilhamon, P.; Cavalli, F.M.G.; Seaman, S.; Zemp, F.J.; Lee, J.; Abdelkareem, A.; Ellestad, K.; et al. High-resolution structural genomics reveals new therapeutic vulnerabilities in glioblastoma. Genome Res. 2019, 29, 1211–1222. [Google Scholar] [CrossRef] [Green Version]
- Wang, J.; Huang, T.Y.-T.; Hou, Y.; Bartom, E.; Lu, X.; Shilatifard, A.; Yue, F.; Saratsis, A. Epigenomic landscape and 3D genome structure in pediatric high-grade glioma. Sci. Adv. 2021, 7, eabg4126. [Google Scholar] [CrossRef]
- Hasin, Y.; Seldin, M.; Lusis, A. Multi-omics approaches to disease. Genome Biol. 2017, 18, 83. [Google Scholar] [CrossRef]
- Karczewski, K.J.; Snyder, M.P. Integrative omics for health and disease. Nat. Rev. Genet. 2018, 19, 299–310. [Google Scholar] [CrossRef]
- Fulco, C.P.; Nasser, J.; Jones, T.R.; Munson, G.; Bergman, D.T.; Subramanian, V.; Grossman, S.R.; Anyoha, R.; Doughty, B.R.; Patwardhan, T.A.; et al. Activity-by-contact model of enhancer-promoter regulation from thousands of CRISPR perturbations. Nat. Genet. 2019, 51, 1664–1669. [Google Scholar] [CrossRef]
- Nasser, J.; Bergman, D.T.; Fulco, C.P.; Guckelberger, P.; Doughty, B.R.; Patwardhan, T.A.; Jones, T.R.; Nguyen, T.H.; Ulirsch, J.C.; Lekschas, F.; et al. Genome-wide enhancer maps link risk variants to disease genes. Nature 2021, 593, 238–243. [Google Scholar] [CrossRef]
- Sey, N.Y.A.; Hu, B.; Mah, W.; Fauni, H.; McAfee, J.C.; Rajarajan, P.; Brennand, K.J.; Akbarian, S.; Won, H. A computational tool (H-MAGMA) for improved prediction of brain-disorder risk genes by incorporating brain chromatin interaction profiles. Nat. Neurosci. 2020, 23, 583–593. [Google Scholar] [CrossRef] [PubMed]
- Langfelder, P.; Horvath, S. WGCNA: An R package for weighted correlation network analysis. BMC Bioinformatics 2008, 9, 559. [Google Scholar] [CrossRef] [PubMed] [Green Version]
- Tan, L.; Ma, W.; Wu, H.; Zheng, Y.; Xing, D.; Chen, R.; Li, X.; Daley, N.; Deisseroth, K.; Xie, X.S. Changes in genome architecture and transcriptional dynamics progress independently of sensory experience during post-natal brain development. Cell 2021, 184, 741–758.e17. [Google Scholar] [CrossRef] [PubMed]
- Rowland, B.; Huh, R.; Hou, Z.; Hu, M.; Shen, Y.; Li, Y. THUNDER: A reference-free deconvolution method to infer cell type proportions from bulk Hi-C data. BioRxiv 2020. [Google Scholar] [CrossRef] [PubMed]
- Wang, X.; Park, J.; Susztak, K.; Zhang, N.R.; Li, M. Bulk tissue cell type deconvolution with multi-subject single-cell expression reference. Nat. Commun. 2019, 10, 380. [Google Scholar] [CrossRef] [PubMed] [Green Version]
- Takei, Y.; Zheng, S.; Yun, J.; Shah, S.; Pierson, N.; White, J.; Schindler, S.; Tischbirek, C.H.; Yuan, G.-C.; Cai, L. Single-cell nuclear architecture across cell types in the mouse brain. Science 2021, 374, 586–594. [Google Scholar] [CrossRef] [PubMed]
- Yu, M.; Li, Y.; Hu, M. Mapping chromatin loops in single cells. Trends Genet, 2022; in press. [Google Scholar]
- Takei, Y.; Yun, J.; Zheng, S.; Ollikainen, N.; Pierson, N.; White, J.; Shah, S.; Thomassie, J.; Suo, S.; Eng, C.L.; et al. Integrated spatial genomics reveals global architecture of single nuclei. Nature 2021, 590, 344–350. [Google Scholar] [CrossRef]
- Su, J.-H.; Zheng, P.; Kinrot, S.S.; Bintu, B.; Zhuang, X. Genome-Scale Imaging of the 3D Organization and Transcriptional Activity of Chromatin. Cell 2020, 182, 1641–1659.e26. [Google Scholar] [CrossRef]
- Nguyen, H.Q.; Chattoraj, S.; Castillo, D.; Nguyen, S.C.; Nir, G.; Lioutas, A.; Hershberg, E.A.; Martins, N.M.C.; Reginato, P.L.; Hannan, M.; et al. 3D mapping and accelerated super-resolution imaging of the human genome using in situ sequencing. Nat. Methods 2020, 17, 822–832. [Google Scholar] [CrossRef]
- Mateo, L.J.; Murphy, S.E.; Hafner, A.; Cinquini, I.S.; Walker, C.A.; Boettiger, A.N. Visualizing DNA folding and RNA in embryos at single-cell resolution. Nature 2019, 568, 49–54. [Google Scholar] [CrossRef]
- Stevens, T.J.; Lando, D.; Basu, S.; Atkinson, L.P.; Cao, Y.; Lee, S.F.; Leeb, M.; Wohlfahrt, K.J.; Boucher, W.; O’Shaughnessy-Kirwan, A.; et al. 3D structures of individual mammalian genomes studied by single-cell Hi-C. Nature 2017, 544, 59–64. [Google Scholar] [CrossRef] [PubMed] [Green Version]
- Rao, S.; Yao, Y.; Bauer, D.E. Editing GWAS: Experimental approaches to dissect and exploit disease-associated genetic variation. Genome Med. 2021, 13, 41. [Google Scholar] [CrossRef] [PubMed]
- Fulco, C.P.; Munschauer, M.; Anyoha, R.; Munson, G.; Grossman, S.R.; Perez, E.M.; Kane, M.; Cleary, B.; Lander, E.S.; Engreitz, J.M. Systematic mapping of functional enhancer-promoter connections with CRISPR interference. Science 2016, 354, 769–773. [Google Scholar] [CrossRef] [PubMed] [Green Version]
- Klann, T.S.; Black, J.B.; Chellappan, M.; Safi, A.; Song, L.; Hilton, I.B.; Crawford, G.E.; Reddy, T.E.; Gersbach, C.A. CRISPR-Cas9 epigenome editing enables high-throughput screening for functional regulatory elements in the human genome. Nat. Biotechnol. 2017, 35, 561–568. [Google Scholar] [CrossRef] [PubMed]
- Moore, C.B.; Guthrie, E.H.; Huang, M.T.-H.; Taxman, D.J. Short hairpin RNA (shRNA): Design, delivery, and assessment of gene knockdown. Methods Mol. Biol. 2010, 629, 141–158. [Google Scholar] [CrossRef] [Green Version]
- Nandakumar, S.K.; McFarland, S.K.; Mateyka, L.M.; Lareau, C.A.; Ulirsch, J.C.; Ludwig, L.S.; Agarwal, G.; Engreitz, J.M.; Przychodzen, B.; McConkey, M.; et al. Gene-centric functional dissection of human genetic variation uncovers regulators of hematopoiesis. eLife 2019, 8, e44080. [Google Scholar] [CrossRef]
- Liu, L.; Zhang, B.; Hyeon, C. Extracting multi-way chromatin contacts from Hi-C data. PLoS Comput. Biol. 2021, 17, e1009669. [Google Scholar] [CrossRef]
- Branco, M.R.; Pombo, A. Intermingling of chromosome territories in interphase suggests role in translocations and transcription-dependent associations. PLoS Biol. 2006, 4, e138. [Google Scholar] [CrossRef] [Green Version]
- Maass, P.G.; Weise, A.; Rittscher, K.; Lichtenwald, J.; Barutcu, A.R.; Liehr, T.; Aydin, A.; Wefeld-Neuenfeld, Y.; Pölsler, L.; Tinschert, S.; et al. Reorganization of inter-chromosomal interactions in the 2q37-deletion syndrome. EMBO J. 2018, 37, e96257. [Google Scholar] [CrossRef]
- Monahan, K.; Horta, A.; Lomvardas, S. LHX2- and LDB1-mediated trans interactions regulate olfactory receptor choice. Nature 2019, 565, 448–453. [Google Scholar] [CrossRef]
- Lu, L.; Liu, X.; Huang, W.-K.; Giusti-Rodríguez, P.; Cui, J.; Zhang, S.; Xu, W.; Wen, Z.; Ma, S.; Rosen, J.D.; et al. Robust Hi-C Maps of Enhancer-Promoter Interactions Reveal the Function of Non-coding Genome in Neural Development and Diseases. Mol. Cell 2020, 79, 521–534.e15. [Google Scholar] [CrossRef] [PubMed]
- Fujita, Y. Regulation and dysregulation of spatial chromatin structure in the central nervous system. Anat. Sci. Int. 2021, 96, 179–186. [Google Scholar] [CrossRef] [PubMed]
- Sun, D.; Weng, J.; Dong, Y.; Jiang, Y. 3D genome organization in the central nervous system, implications for neuropsychological disorders. J. Genet. Genomics 2021, 48, 1045–1056. [Google Scholar] [CrossRef] [PubMed]
- Mangnier, L.; Joly-Beauparlant, C.; Droit, A.; Bilodeau, S.; Bureau, A. Cis-regulatory hubs: A new 3D model of complex disease genetics with an application to schizophrenia. Life Sci. Alliance 2022, 5, e202101156. [Google Scholar] [CrossRef]
- Wang, D.; Liu, S.; Warrell, J.; Won, H.; Shi, X.; Navarro, F.C.P.; Clarke, D.; Gu, M.; Emani, P.; Yang, Y.T.; et al. Comprehensive functional genomic resource and integrative model for the human brain. Science 2018, 362, eaat8464. [Google Scholar] [CrossRef] [Green Version]
- Tan, L.; Xing, D.; Daley, N.; Xie, X.S. Three-dimensional genome structures of single sensory neurons in mouse visual and olfactory systems. Nat. Struct. Mol. Biol. 2019, 26, 297–307. [Google Scholar] [CrossRef]
- Beagan, J.A.; Pastuzyn, E.D.; Fernandez, L.R.; Guo, M.H.; Feng, K.; Titus, K.R.; Chandrashekar, H.; Shepherd, J.D.; Phillips-Cremins, J.E. Three-dimensional genome restructuring across timescales of activity-induced neuronal gene expression. Nat. Neurosci. 2020, 23, 707–717. [Google Scholar] [CrossRef]
- Luo, X.; Liu, Y.; Dang, D.; Hu, T.; Hou, Y.; Meng, X.; Zhang, F.; Li, T.; Wang, C.; Li, M.; et al. 3D Genome of macaque fetal brain reveals evolutionary innovations during primate corticogenesis. Cell 2021, 184, 723–740.e21. [Google Scholar] [CrossRef]
- Rajarajan, P.; Borrman, T.; Liao, W.; Schrode, N.; Flaherty, E.; Casiño, C.; Powell, S.; Yashaswini, C.; LaMarca, E.A.; Kassim, B.; et al. Neuron-specific signatures in the chromosomal connectome associated with schizophrenia risk. Science 2018, 362, eaat4311. [Google Scholar] [CrossRef] [Green Version]
- Espeso-Gil, S.; Halene, T.; Bendl, J.; Kassim, B.; Ben Hutta, G.; Iskhakova, M.; Shokrian, N.; Auluck, P.; Javidfar, B.; Rajarajan, P.; et al. A chromosomal connectome for psychiatric and metabolic risk variants in adult dopaminergic neurons. Genome Med. 2020, 12, 19. [Google Scholar] [CrossRef]


| Imaging-Based | Sequencing-Based | |
|---|---|---|
| Mapping approach | Absolute spatial coordinates of pre-selected target sequences | Relative spatial relationships among sequencing reads |
| Sample preparation | In situ hybridization or sequencing needs fixed cells. Live cell measurement possible, e.g., with DAM- or CRISPR-based methods | Lysis needed for sequencing |
| Multiplicity of contacts | Multiway | Pairwise for 3C-based methods and multiway for ligation-free methods |
| Spatial distance of detected contacts | Can detect interchromosomal contacts | 3C-based methods more often observe intrachromosomal interactions while ligation-free methods also detect abundant interchromosomal contacts |
| Advantages | Inherently single-cell measurement, preservation of cell location information in the tissue context, direct readout of spatial coordinates, detection of multi-way interactions | High throughput and sequence coverage, no need to preselect loci of interest |
| Limitations | Limited throughput, or limited resolution when providing genome or chromosome-wide coverage | No direct spatial information, most based on millions of cells, 3C-based interactions are not easily transformed to spatial distance, ligation and fragmentation efficiency, requires high-depth |
| Representative single-cell technologies | DNA seqFISH+ [99], MERFISH [100], OligoFISSEQ [101], ORCA [102] | Single-nucleus methyl-3C [40], Methyl-HiC [42], Dip-C [36], Nagano et al., 2017 [34], Flyamer et al., 2017 [35], Stevens et al., 2017 [103], sciHi-C [37] |
| Name | Data Type | Description | URL |
|---|---|---|---|
| HUGIn | HiC, PC-HiC, HiChIP/PLAC-Seq | HUGIn is an integrative Hi-C data visualization tool with a built-in database | http://hugin2.genetics.unc.edu (accessed on 28 February 2022) |
| 3D Genome Browser | Hi-C, ChIA-PET, Capture Hi-C, HiChIP/PLAC-Seq | Visualization of the chromosomal contract matrices | http://3dgenome.fsm.northwestern.edu (accessed on 28 February 2022) |
| WashU Epigenome Browser | 5C, Hi-C, ChIA-PET | Supports multiple types of long-range genome interaction data | http://epigenomegateway.wustl.edu (accessed on 28 February 2022) |
| 3DIV | Hi-C | A 3D-genome interaction viewer and database | http://3div.kr (accessed on 28 February 2022) |
| Juicebox | Hi-C | Software for visualizing data from Hi-C | http://www.aidenlab.org/juicebox (accessed on 28 February 2022) |
| HiGlass | Hi-C | Displaying and comparing large matrices within a web page | http://higlass.gehlenborglab.org (accessed on 28 February 2022) |
| Nucleome Browser | Multi-data | Multimodal, interactive data visualization and exploration platform | http://vis.nucleome.org (accessed on 28 February 2022) |
| Species | Tissue/Cell Type | Technology | Reference |
|---|---|---|---|
| Human | Fetal cortical plate and germinal zone | Hi-C | Won et al., 2016 [82] |
| Human | DLPFC, hippocampus | Hi-C | Schmitt et al., 2016 [11] |
| Human | Fetal and adult brain | Hi-C | Giusti-Rodriguez et al., 2018 [67] |
| Human | Brain tissues | Hi-C | Li et al., 2018 [65] |
| Human | Brain tissues | Hi-C | Wang et al., 2018 [117] |
| Human | Fetal brain | Capture Hi-C | Song et al., 2019 [61] |
| Human | Adult brain | PLAC-seq | Nott et al., 2019 [62] |
| Human | Adult cortex | sc-m3c-seq | Lee et al., 2019 [40] |
| Mouse | Retina and main olfactory epithelium | Dip-C | Tan et al., 2019 [118] |
| Mouse | Olfactory sensory neurons | Hi-C | Monahan et al., 2019 [112] |
| Human | Fetal cortex | PLAC-seq | Song et al., 2020 [63] |
| Human | Neurogenesis and brain | eHi-C | Lu et al., 2020 [113] |
| Mouse | Mouse cortical neurons | Hi-C | Beagan et al., 2020 [119] |
| Mouse | Brain | immuno-GAM | Winick-Ng et al., 2021 [25] |
| Mouse | Hippocampus | sc-m3c-seq | Liu et al., 2021 [41] |
| Mouse | Cortex and hippocampus | Dip-C | Tan et al., 2021 [94] |
| Macaque | Fetal brain | Hi-C | Luo et al., 2021 [120] |
| Human | Neurons and glia | Hi-C | Hu et al., 2021 [64] |
| Human | Neural progenitor cells | Hi-C | Rajarajan et al., 2018 [121] |
| Human | Midbrain dopaminergic neurons | Hi-C | Espeso-Gil et al., 2020 [122] |
Publisher’s Note: MDPI stays neutral with regard to jurisdictional claims in published maps and institutional affiliations. |
© 2022 by the authors. Licensee MDPI, Basel, Switzerland. This article is an open access article distributed under the terms and conditions of the Creative Commons Attribution (CC BY) license (https://creativecommons.org/licenses/by/4.0/).
Share and Cite
Liu, W.; Zhong, W.; Chen, J.; Huang, B.; Hu, M.; Li, Y. Understanding Regulatory Mechanisms of Brain Function and Disease through 3D Genome Organization. Genes 2022, 13, 586. https://doi.org/10.3390/genes13040586
Liu W, Zhong W, Chen J, Huang B, Hu M, Li Y. Understanding Regulatory Mechanisms of Brain Function and Disease through 3D Genome Organization. Genes. 2022; 13(4):586. https://doi.org/10.3390/genes13040586
Chicago/Turabian StyleLiu, Weifang, Wujuan Zhong, Jiawen Chen, Bo Huang, Ming Hu, and Yun Li. 2022. "Understanding Regulatory Mechanisms of Brain Function and Disease through 3D Genome Organization" Genes 13, no. 4: 586. https://doi.org/10.3390/genes13040586