Abstract
Central China has a rich terrain with a temperate monsoon climate and varied natural environments for the Chinese honeybee (Apis cerana cerana). However, little comprehensive research on population genetic diversity has been done in this area. A population survey of the structure and genetic diversity of Apis cerana cerana in this area is deeply needed for understanding adaptation to variable environments and providing more references for the protection of honeybee biodiversity. In this study, we present a dataset of 72 populations of Chinese honeybees collected from nine sites by whole genome sequencing in Central China. We obtained 2,790,214,878 clean reads with an average covering a depth of 22×. A total of 27,361,052 single nucleotide polymorphisms (SNPs) were obtained by mapping to the reference genome with an average mapping rate of 93.03%. Genetic evolution analysis was presented via the population structure and genetic diversity based on the datasets of SNPs. It showed that Apis cerana cerana in plains exhibited higher genetic diversity than in mountain areas. The mantel test between Apis cerana cerana groups revealed that some physical obstacles, especially the overurbanization of the plains, contributed to the differentiation. This study is conducive to elucidating the evolution of Apis cerana in different environments and provides a theoretical basis for investigating and protecting the Chinese honeybee.
1. Introduction
Adaptation to a changing environment is a fundamental problem in evolutionary biology. Understanding the impact of the environment on biological genetic diversity can not only clarify the course of evolution but also provide information on how to protect the ecological environment [1]. Therefore, taking knowledge of genetic resources in a specific natural area will provide references for the strategy design of biodiversity conservation and balancing ecology and economy.
Population structure and genetic diversity are the two main factors leading to ecological and evolutionary dynamics flourishing in the natural environment [2]. Experiment evidence showed that characterization of structural variation has a significant influence on the evolutionary processes of Tibetans’ adaptation to the Qinghai-Tibet Plateau [3]. Except for humans, genetic population structure was also proven to have a regulatory effect on the adaptive evolution of fishes, like sticklebacks [4,5], or other reproducing individuals, including cells, viruses, multicellular organisms and so on [6]. In addition, it has been demonstrated that genetic diversity maintenance is crucial for all species, not just a few domestic species like cultivated plants or domesticated animals [7]. Genetic diversity of the wild animals, insects, and any other special economic animals or crops are also worthy of attention for ensuring all aspects of biodiversity conservation. Some parameters such as expected heterozygous number (He), observed heterozygous number (Ho), nucleic acid diversity (Pi), and polymorphism information content (PIC) can be used to indicate the level of an animal’s genetic diversity efficiency and subdivision of population [8].
Chinese honeybee (Apis cerana cerana) is a subspecies and special honeybee resource of Apis cerana that evolved over time for long-term adaption to the natural ecological environment in China [9,10]. It mainly nests in distinct habitats of complex topography, divergent climate, and varied flora, resulting in high resistance to changes in the external environment [11,12]. As one of the local advantage species and pollinators with a wide distribution in China [13], Apis cerana cerana is a vital component of natural ecosystems that pollinates numerous flowering plants and agricultural crops, providing ecological and financial support to residents [14,15]. Abundant scientific evidence shows that the functional genes of honeybees have excellent adaptability in coping with external environmental changes, ecological diversity and economic profits [16,17,18].
Previous studies on Apis cerana cerana have classified it into nine ecological types based on morphometric measurement indicators [19], including Hainan, the Yunnan-Guizhou Plateau, Tibet, Aba, Changbai Mountain, southern Yunnan, North China, South China, and Central China [20]. As more investigators began to study the genetic diversity of Apis cerana cerana, our understanding of Apis cerana cerana continued to improve until 2015, when the reference genome of Apis cerana was published [21]. Whole genome sequencing of a single population can provide a detailed characterization of genetic variation and may clarify the evolutionary development of the population [22]. A comprehensive genomic study of Apis cerana cerana in most parts of China indicated the simple hierarchical division. It proposed that physical barriers (such as islands and mountains) were the main obstacles leading to gene exchange, thereby leading to population differentiation [15]. Other studies have reported that Apis cerana cerana, even in specific regions, can be highly variable [23,24,25], suggesting that populations from limited geographic areas still have large genetic differences.
Hubei Province is located in Central China, in the middle reaches of the Yangtze River, with a rich terrain and belongs to the temperate monsoon climate. The geographical environment of the area is hilly and mountainous, with elevations ranging from 200 m to 3100 m, and there are more than 150 kinds of nectar source plants, creating excellent regional natural conditions for Apis cerana cerana [26,27]. Therefore, surveying the population structure and genetic diversity of Apis cerana cerana in this area is deeply needed to understand its adaptation to variable environments and provide more references for protecting honeybee biodiversity in Central China.
2. Materials and Methods
2.1. Sample Collection
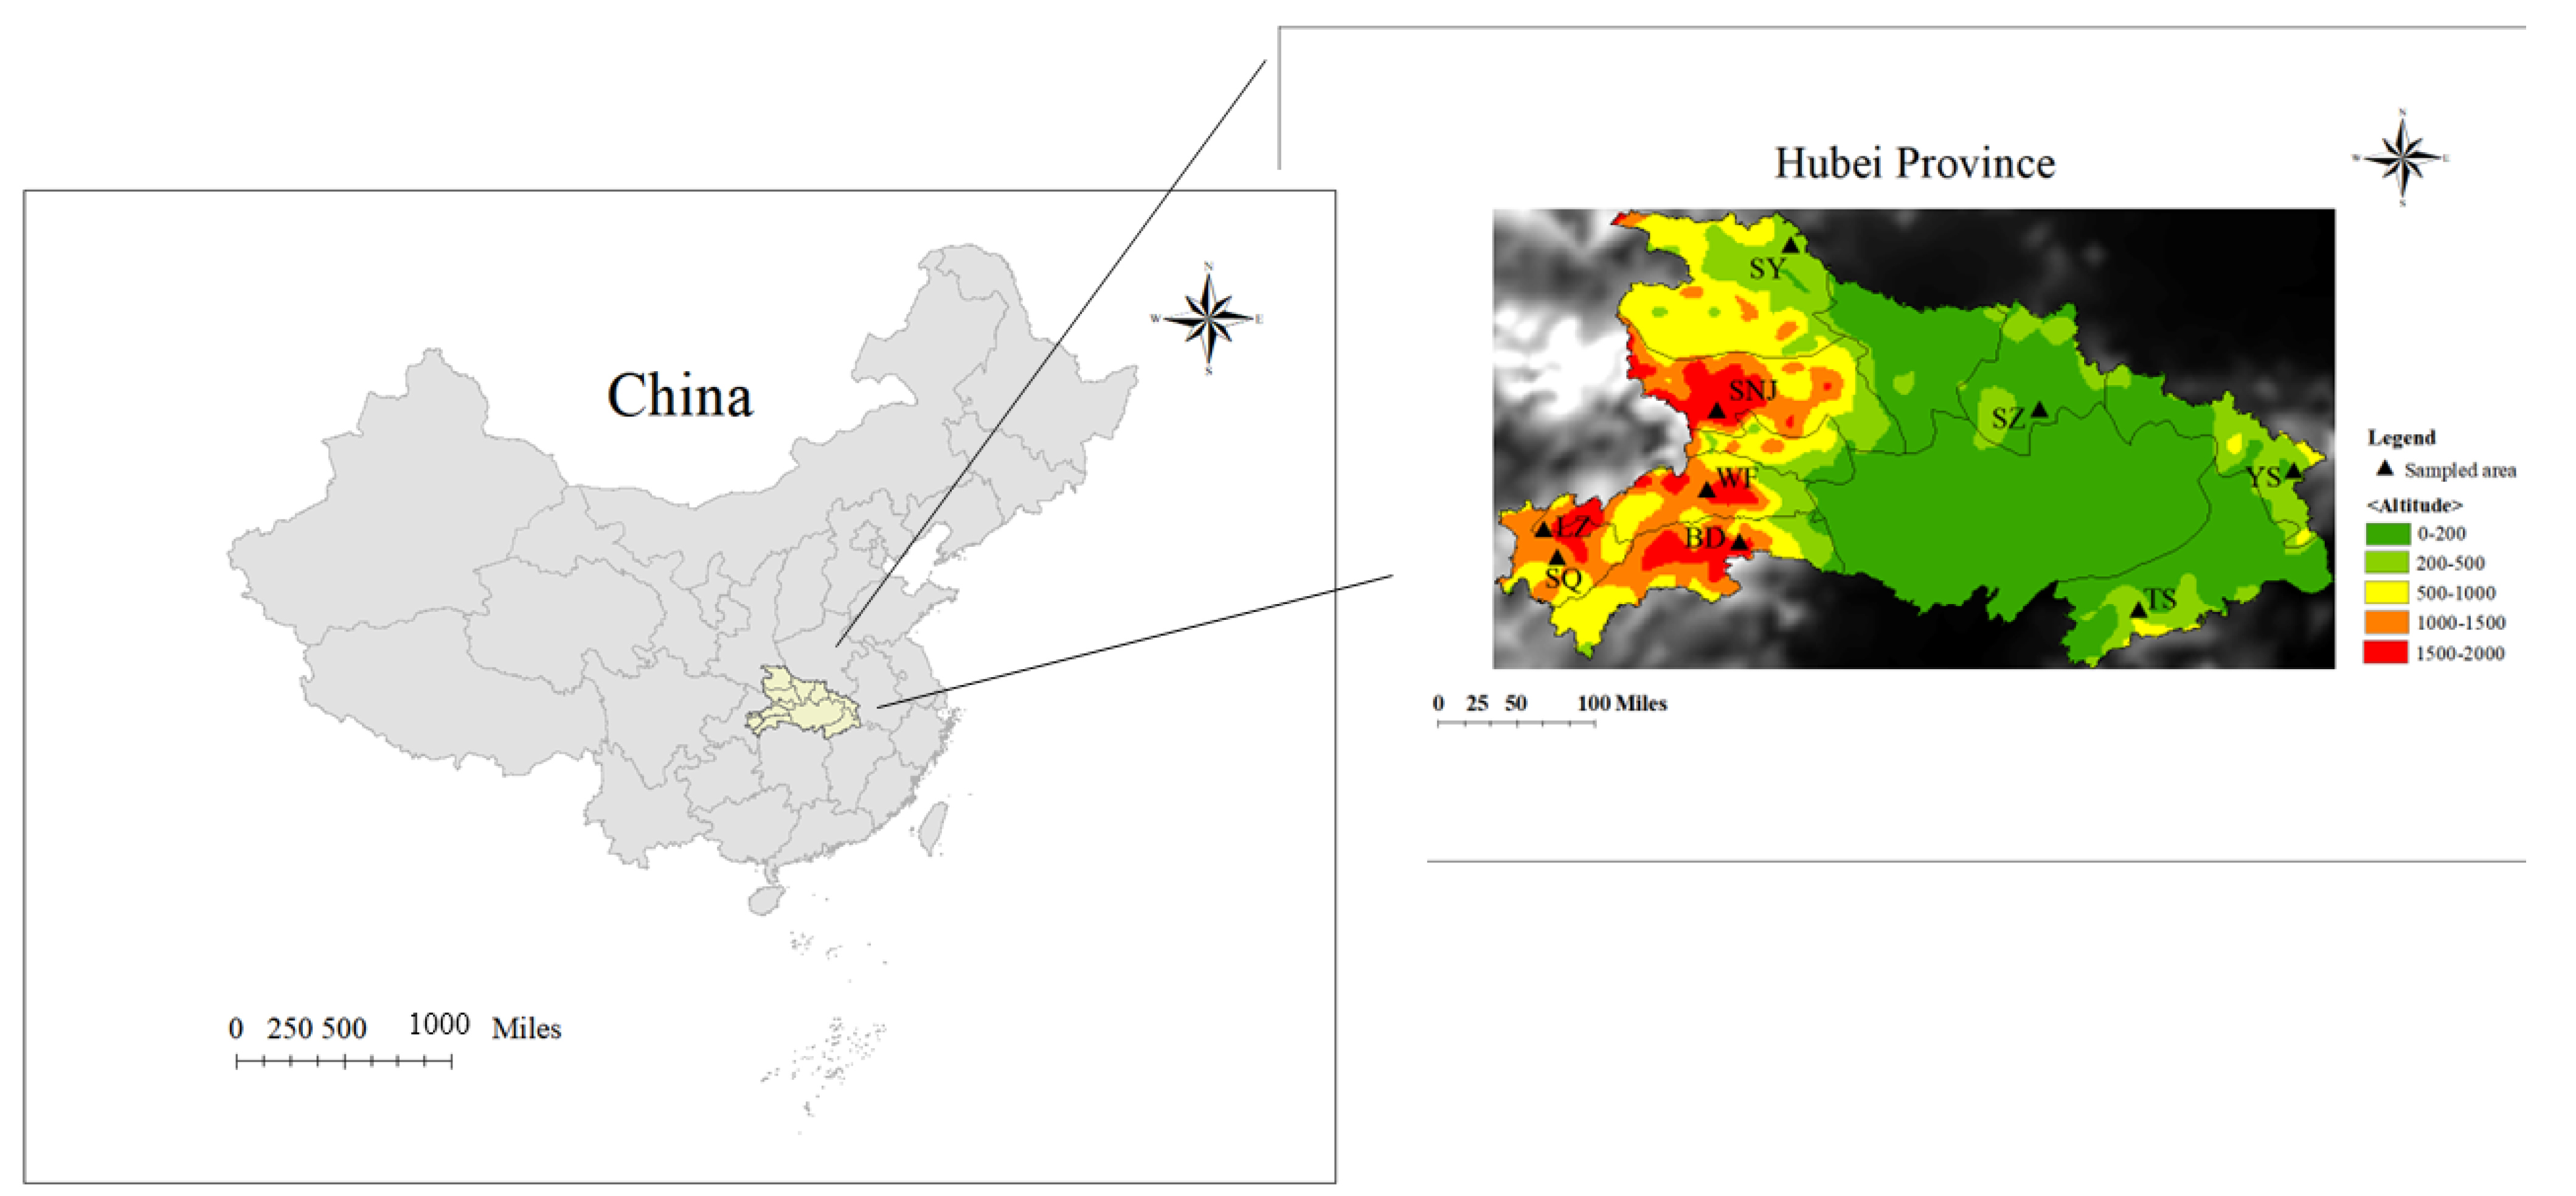
As experimental materials for this study, 72 worker bees (Apis cerana cerana) were obtained from nine different geographic mountain areas in Central China (Table 1 and Figure 1). Sampled honeybees were divided into nine groups of 4 to 10 colonies by geographic names (Table 1). All honeybee samples were stored in a −80 °C refrigerator for further DNA extraction and sequencing.

Table 1.
Sample information of the Apis cerana cerana from nine Central China regions.

Figure 1.
Specific geographic locations of the sampled honeybees in China, where the yellow area represents the sampling site of the representative area of Central China (Hubei Province). Sampling positions in Hubei Province were highlighted in a colorful magnified area map (right). Base layer map information comes from Resource and Environment Science and Data Center (page: https://www.resdc.cn/data.aspx?DATAID=200 (accessed on 1 January 2015)).
2.2. DNA Extraction
For each bee colony, one worker bee was randomly selected, and total genomic DNA was extracted from its thorax tissue using the Universal Genome DNA Kit (Cat.No.CW0553, ComWin Biotech, Beijing, China) according to the manufacturer’s protocol. After extraction, DNA was treated with RNase A (Cat.No.CW0601S, ComWin Biotech, Beijing, China). The quality and total amount of DNA were measured using Nanodrop 2000 (Thermo Scientific, Wilmington, DE, USA).
2.3. Whole Genome Sequencing
The whole genome sequencing of qualified sample genomic DNA was performed on the Illumina Hi-Seq 4000 platform provided by Biomarker Technologies Corporation, Beijing. The DNA was primarily segmented by mechanical interruption (ultrasonic purified). Then the fragment size was selected by agarose gel electrophoresis after the end repairing, dA-tailing and adapter ligation. Eventually, PCR amplification was performed to obtain a 350 bp insert size paired-end library. The established library was first purified and qualified, and finally, the qualified library was sequenced.
2.4. Quality Control of Sequencing Reads
The quality of raw reads was validated using FastQC (version 1.11.4) [28]. Adapter sequences, primers, poly-A tails, and low-quality reads were removed with cutadapt [29]. Low-quality data filtering included removing reads with adapter, reads containing more than 10% of N, and reads containing more than 50% bases with a quality value of less than 10 to obtain clean reads for subsequent bioinformatic analysis.
2.5. Mapping and Variation Detection
Clean reads were mapped to the reference Apis cerana genome (Apis_cerana.ACSNU2.0) with BWA (version 0.7.17) [30]. We statistically processed the information on sequencing depth and genome coverage of each sample for variation detection. Using the Haplotype Caller of GATK (version 4.2.0) [31] to detect the variation of SNP, the annotation of SNP was realized by SnpEff (version 5.1) [32].
2.6. Genetic Diversity Analysis
In practical scientific research, when it comes to average correlations between individuals in large genomic datasets, population structure results in systematic patterns visualized using dimension reduction techniques like principal component analysis (PCA) [33], or bayesian clustering methods like STRUCTURE [34,35,36]. PCA, phylogenetic tree, structure and genetic diversity analysis were carried out using vcftools [37] to convert vcf into plink format.
PCA analysis based on the allele frequency distribution among 72 populations was performed to assess the significance of each principal component. PC1 and PC2 were plotted using the ggplot2 package [38] in R 3.6.1 software. To establish the evolutionary relationship among honeybees sampled from nine sites, a neighbor-joining phylogenetic tree was constructed to represent the genetic distances among the population. To accurately identify the ancestral components of the 72 individuals from nine sampling sites, population structure was constructed by a Bayesian clustering program using admixture software [39] to estimate the ancestral composition of each individual with genome-wide unlinked sites. The value of K = 2 to 5 (two–five ancestors) was selected using the admixture model and visualized using R 3.6.1.
2.7. Correlations between Environmental Variables and Genetic Diversity
The Mantel test was performed using the Fst matrix and distance matrix with the ade4 software package [40] in R3.6.1. To describe the possible changes in the correlation between the genetic distance and geographical distance, we used PASSaGE (version 2) [41], for Manchester correlation analysis according to the distance. The rank divided the distance matrix into submatrices. The populations within the geographical boundary distance described by each submatrix corresponded to populations with different genetic distances. The average Fst of the set “distance level” was calculated separately to generate a polyline “interference graph” that was combined with the Manchester correlation map for a more intuitive view.
3. Results
3.1. Genome Sequencing
A total of 72 individual Apis cerana cerana from nine geographic units (Hubei Province), including WF, SNJ, YS, LZ, SQ, SY, TS, SZ, and BD (for each, n = 4–9), were sequenced. Raw reads of the sequencing data were first filtered to remove the adapter and low-quality sequences, filtered reads with more than a 10% N content, or more than 50% low-quality bases (quality value < 10). After quality control, 2,790,214,878 clean reads in total were generated (Table 2). The average percentage of the sequencing data that yielded a Phred quality score of 30 (Q score > 30) is 91.81% (Table 2). It indicates the probability that a given base is incorrectly called by the sequencer. Subsequently, 150 bp insert size of paired-end reads of clean reads were mapped to the reference genome of Apis cerana (Apis_cerana.ACSNU2.0), resulting in 2,7361,052 SNP numbers totally with 22× average coverage depth and an average mapping rate of 93.03% (Table 2).
Table 2.
The summary of whole genome resequencing and read mapping results.
3.2. Population Structure Analysis
Cluster analysis showed that when the K value was 2, Apis cerana cerana in SZ and YS regions were divided into one class. The other regions formed a large group with clear boundaries between regions. When the K value was 3, SZ and YS still formed one group, while the large cluster was split. SNJ formed a cluster. Other regions formed their unique pedigree composition with SNJ, SZ and YS. When the K value was 4, SNJ and WF formed a cluster, TS and YS formed a cluster and SZ formed a cluster, respectively. The other regions (SY, SQ, LZ, BD) formed their unique pedigree composition with these three lineages. The BD and the other three regions showed different degrees of pedigree, and part of the BD area showed a special lineage with clear differences in the area. The result of the PCA scatter plot of principal factor 1 (variation 2.51%) and principal factor 2 (variation 2.18%) further supported the patterns (Figure 2B). When the K value was 5, TS, YS and SZ still formed two clusters, respectively, while SNJ was split into two areas, and the differentiation of SY, SQ, LZ, BD and WF was further emphasized, split into three areas, showing a highly mixed state.
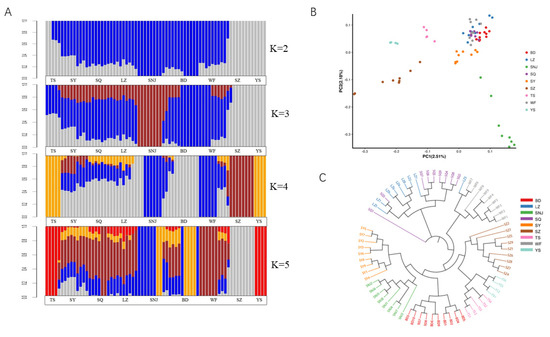
Figure 2.
Analysis of the population structure from nine geographic locations. (A): Population structure of 72 individuals from different locations. (B): Principal component analysis of 72 individuals from different locations. (C): Neighbor-joining tree of 72 individuals.
These results were further supported by the phylogenetic tree of the SNP data (Figure 2C). SNJ did not split as a whole and was clustered with SY. TS, YS, and SZ were close. LZ and SQ were clustered into one class. SNJ, SY, BD, TS, YS, SZ, and WF were clustered in a large cluster. These results are consistent with the results of STRUCTURE at K values ranging from 3 to 5. After a comprehensive comparison, we considered that K = 4 was relatively reasonable, and all regions were divided into 5 genetic components; blue region (SNJ, WF), gray region (BD), brown region (SZ), yellow region (YS, TS), and a mixed area of blue, gray, brown and yellow (SY, SQ, LZ).
According to the environmental characteristics of the bee sampling sites (Table 1), we divided the bees collected from the measurement areas into high-altitude type (SNJ, WF), middle-altitude type (BD, SY, SQ, LZ), and low-altitude type (SZ, YS, TS), consistent with the results of STRUCTURE.
3.3. Genetic Diversity Analysis
Genetic diversity analysis was performed by calculating MAF, He, Ho and PIC (Table 3). The fixation index (Fst) between populations was calculated to quantify the genetic differentiation (Table 4). The Fst ranged from 0.00706 (LZ, SQ) to 0.05165 (SNJ, YS), with an overall mean of 0.02470, indicating low genetic differentiation. Compared with Apis cerana cerana in North China (average Fst = 0.132) [13], Apis cerana cerana in Central China was less differentiated at the level of genetic differentiation. The Fst difference between the different regions of the honeybee was small, showing low species diversity at the ecotype level, while the values of Fst were consistent with the overall heterogeneity of the population structure. Apis cerana cerana in the central low-altitude regions (SZ, TS, YS) had the highest Fst distribution (average Fst = 0.029965). The average values of Fst in the central high-altitude region and middle-latitude region are 0.02456 and 0.01101, respectively. The Fst 0.051650 between SNJ (high-altitude region) and YS (low-altitude) was moderately differentiated.
Table 3.
Genetic diversity of the Apis cerana cerana from nine Central China regions.
Table 4.
Fst value of the Apis cerana cerana from nine Central China regions.
The region of Central China (SNJ, WF, BD, SY, SQ, LZ, SZ, YS, TS) showed variable differentiation states, with most being in a low differentiation state, though SNJ and YS were in a moderately differentiated state. Although the genetic differentiation of Apis cerana cerana in low-altitude regions (SZ, TS, YS) was higher than in other regions, the Fst average value (0.024696) is lower than 0.05, indicating that the genetic composition of Apis cerana cerana in these regions was similar, and the degree of differentiation was low.
The PIC, Ne, Pi, Ho, and He of each SNP locus in the population were separately calculated (Table 3). PIC measured the degree of variation of the population DNA (the overall PIC average was 0.2451). Among these regions, the BD region has the lowest PIC at 0.2334, whereas the average PIC of the YS region was the highest at 0.2812. The populations in lower altitude regions had higher genetic polymorphisms (SZ, TS, YS) with an average PIC of 0.2620, which is consistent with the distribution of Pi. Nucleotide diversity is an indicator of diversity within or between populations. The average Pi values of TS and YS were 0.3614 and 0.3720, respectively, higher than the average (the average Pi = 0.3176). Furthermore, the low-altitude region (TS, SZ, YS) surpassed the mean polymorphic information (Pi = 0.3477 > 0.3176), and there was high differentiation (mean Fst = 0.02456) and high genetic variation (high polymorphism, PIC = 0.2620 > 0.2451).
Apis cerana cerana in the lower altitude regions have more biodiversity and heterozygosity than in other areas. Nevertheless, there were differences among heterozygosity (He), variance (PIC), and diversity (Pi) in YS, SZ, and TS, among which YS had higher heterozygosity, variation, and diversity, and while YS and TS belonged to one cluster, SZ belonged to another and had lower heterozygosity, variation, and diversity. A comparison of the STRUCTURE map with a K value of 4 (Figure 2A) revealed that the low-altitude area was divided into another cluster. In addition, we calculated all sampled groups with an average Ho of 0.3368, which was higher than the He of 0.2865. The low-altitude region (YS) has the highest Ho, He, and Pic (0.4126, 0.3477 and 0.2812, respectively), indicating that the population heterozygosity was high, which could be affected by the combined effects of selection, mutation, and genetic drift.
3.4. Mantel Test between Apis Cerana Cerana Groups
The correlation between a single or a group of environmental variable factors (such as latitude, longitude, altitude, geographical distance, etc.) was tested. The significant correlation between matrices was analyzed by p-value < 0.01 in this study. Mantel test was performed on genetic distance (Fst), environmental factors (Table 5), and geographical distance (Table 6). The results showed that among the seven environmental factors, the genetic distance between populations in nine different geographical regions was positively correlated with the geographical distance, longitude and altitude (p = 0.0038 < 0.01, p = 0.0015 < 0.01, p = 0.0197 < 0.05), but had no significant correlation with other environmental variables (Table 7). The correlation degree between physical distance and genetic distance was r = 0.54243. The correlation degree between altitude and genetic distance was r = 0.32431. These results indicate that geographical distance and location had a significant correlation with the genetic differentiation of Apis cerana cerana populations in Central China.
Table 5.
Information of environmental factors of nine Central China regions.
Table 6.
Geographic distance between nine Central China regions (unit: km).
Table 7.
p-value calculated by Mantel test of Fst matrix of the Chinese honeybee populations and environmental factors.
4. Discussion
The evolution of species and the generation of diversity are mostly due to environmental changes. Central China has a rich terrain and belongs to the temperate monsoon climate. The geographical environment of this area is plainly and mountainous, with elevations ranging from 200 m to 3100 m, creating a rich source of nectar source plants and excellent regional natural conditions for Chinese honeybee [26,27]. To understand the relationships between genetic differentiation and the environment, this study collected Apis cerana cerana from nine regions in Central China and analyzed the population structure and genetic diversity. To obtain as much information as possible about local Apis cerana cerana, we included as many collection points as possible in one collection area. The samples were mainly collected from traditional beehives, including crate hives, barrel beehives, and wall hole hives. The domestication process of Apis cerana cerana is rather slow, and domestic bees and wild bees often undergo mutual transformation [42]. Therefore, in this study, we believe that different beehive types have a negligible effect on bee society.
The traditional method used 40 morphological indicators to classify Apis cerana [13]. These morphological indicators could be classified into several categories, such as color, angle of the right forewing, and body length, to obtain more comprehensive classification results [43]. As the reference genome of Apis cerana was published [21], more investigators began to study the genetic diversity of Apis cerana [13,44,45]. To analyze the classification, population structure analysis was performed to calculate the degree of mixed blood among individuals if gene exchange has occurred in subpopulations (Figure 2A). When the K value was 4, the STRUCTURE map revealed that SNJ and WF formed a cluster, TS and YS formed a cluster and SZ formed a cluster, respectively. The other region (SY, SQ, LZ, BD) formed its unique pedigree composition with these three lineages. These results were further supported by the PCA analysis and phylogenetic tree (Figure 2B,C), which inferred the differentiation relationships of populations in a low-altitude area separated from populations in high- and low-altitude areas.
Genetic variation is critical for the survival of bees in changing climates. For bees, high genetic diversity at the population level can increase the adaptability of colonies, as bee colonies with higher diversity promote stability and homeostasis [46,47]. To obtain the genetic diversity, we calculated the values of PIC, He, Ho, Pi, and the MAF (Table 3), which can reflect the degree of genetic variation within populations. The Fst value can reveal the genetic differentiation distance between populations (Table 4), which is divided into three levels of genetic differentiation: moderate differentiation (0.05 < Fst < 0.15), larger differentiation (0.15 < Fst < 0.25) and high differentiation (Fst > 0.25). A previous study calculated Apis cerana cerana at the subspecies level between different ecological-type populations, for which the average Fst differentiation was 0.162, resulting in high differentiation [15]. In this study, we observed an overall mean Fst value of 0.02470, indicating low genetic differentiation. Compared with Apis cerana cerana in a specific region (North China) (average Fst = 0.132) [13], Apis cerana cerana in Central China was more lowly differentiated at the level of genetic differentiation. It may be because the geographical distance between populations was limited, and there are no strong physical barriers in this area. There was, however, a special observation that the average Fst between YS and SNJ was 0.05165 (0.05 < Fst < 0.15), reaching the medium differentiation level. We also noticed that the genetic differentiation of Apis cerana cerana in low-altitude regions (SZ, TS, YS) was higher than that in other regions. Overall, we speculate that long geographical distances enlarge the genetic differentiation, and the plains are more conducive to gene flow. Previous studies have suggested that honeybees migrate rapidly to areas without strong physical barriers, which can promote gene flow and reduce genetic differentiation [48]. The rapid spread of the African honeybees in European countries can better illustrate the potential for the rapid migration of honeybees [49].
To understand the effect of environmental factors on genetic distance, we calculated the Fst and environmental variable factor of Apis cerana cerana in Central China. The correlation between the genetic distance and environmental factors calculated by the Fst is one of the most common methods for assessing the spatial communication of the population structure [50]. Our results showed that geographical distance, altitude, and longitude significantly correlated with the genetic differentiation of Apis cerana cerana populations in Central China. We inferred that the mixed terrain of plain and mountain could cause the differentiation. Previous studies have suggested that islands and mountains can form physical barriers that, in turn, cause group isolation [15]. In China, various human activities, such as the loss of agricultural land and urbanization, led to the loss of the habitat of Apis cerana cerana, especially in the vast plains of China. However, complex terrains are more resistant to human activities, which could be the reason for the medium differentiation of Apis cerana cerana between SNJ and YS. Therefore, we think that the isolation of Apis cerana cerana by human urban agglomerations is as important as the physical isolation caused by mountains.
In summary, as a wide-range species, Apis cerana shows good potential concerning climate change. Still, stresses such as pesticides, pollutants, pathogens, parasites, and limited flower resources caused by human activities threaten the survival of Apis cerana in China [51,52]. This study provides a theoretical basis for investigating and protecting Chinese honeybees by comparing the population structure and genetic diversity of Apis cerana cerana from nine geographical regions in Central China.
5. Conclusions
This study used genomic data to analyze a wide-range Apis cerana cerana species, and provided insights into the differentiation and diversity of the species in Central China. Apis cerana cerana in plains exhibited high genetic diversity, and physical barriers (altitude) and distance were the important factors for the differentiation. Human activities, such as urbanization, also greatly impact differentiation. The results of this study contribute to elucidating the evolution of Apis cerana in different environments and promote our understanding of how to protect honeybees from current and future challenges.
Author Contributions
F.F. designed the experiments and wrote the manuscript. X.C. performed the data analysis. X.L. supervised the experiments. J.L., X.S., X.F. and Z.W. contributed greatly to modifying the manuscript. All authors have read and agreed to the published version of the manuscript.
Funding
We acknowledge the support of the Fundamental Research Funds for the Central Universities (2662021FW009) and Qingshan Public Welfare Special Fund (CEPFQS202169-14).
Institutional Review Board Statement
The Tab of Animal Experimental Ethical Inspection of Laboratory Animal Centre, Huazhong Agriculture University, Approval Code: HZAUBE-2019-001, Approval Date: 2019-08-21.
Informed Consent Statement
Not applicable.
Data Availability Statement
The raw genome sequencing datasets generated during the current study have been submitted to the NCBI Sequence Read Archive (SRA). Accession numbers are listed in Table 2.
Conflicts of Interest
The authors declare no conflict of interest.
Abbreviations
He: expected heterozygous number; Ho: observed heterozygous number; Pi: nucleic acid diversity; PIC: polymorphism information content; Fst: the fixation index; PCA: a principal component analysis.
References
- Skelly, D.K.; Joseph, L.N.; Possingham, H.P.; Freidenburg, L.K.; Farrugia, T.J. Evolutionary responses to climate change. Conserv. Biol. 2007, 21, 1353–1355. [Google Scholar] [CrossRef] [PubMed]
- Allen, B.; Lippner, G.; Chen, Y.T.; Fotouhi, B.; Momeni, N. Evolutionary dynamics on any population structure. Nature 2016, 544, 227. [Google Scholar] [CrossRef] [PubMed] [Green Version]
- Quan, C.; Li, Y.; Wang, Y.; Ping, J.; Zhou, G. Characterization of Structural Variation in Tibetans Reveals New Evidence of High-altitude Adaptation and Introgression. Genome Biol. 2020, 22, 1–21. [Google Scholar] [CrossRef] [PubMed]
- Fang, B.; Kemppainen, P.; Momigliano, P.; Merilä, J. Population Structure Limits Parallel Evolution in Sticklebacks. Mol. Biol. Evol. 2021, 38, 4205–4221. [Google Scholar] [CrossRef]
- Kemppainen, P.; Li, Z.; Rastas, P.; Löytynoja, A.; Fang, B.; Yang, J.; Guo, B.; Shikano, T.; Merilä, J. Genetic population structure constrains local adaptation in sticklebacks. Mol. Ecol. 2021, 30, 1946–1961. [Google Scholar] [CrossRef] [PubMed]
- Nowak, M.A.; Tarnita, C.E.; Antal, T. Evolutionary dynamics in structured populations. Philos. Trans. R. Soc. Lond. 2010, 365, 19–30. [Google Scholar] [CrossRef] [PubMed] [Green Version]
- Laikre, L.; Hoban, S.; Bruford, M.W.; Segelbacher, G.; Vernesi, C. Post-2020 goals overlook genetic diversity. Science 2020, 367, 1082–1085. [Google Scholar] [CrossRef] [Green Version]
- Peixoto, M.G.C.D.; Carvalho, M.R.S.; Egito, A.A.; Steinberg, R.S.; Bruneli, F.Â.T.; Machado, M.A.; Santos, F.C.; Rosse, I.C.; Fonseca, P.A.S. Genetic Diversity and Population Genetic Structure of a Guzerá (Bos indicus) Meta-Population. Animals 2021, 11, 1125. [Google Scholar] [CrossRef]
- Smith, D.R.; Villafuerte, L.; Otis, G.; Palmer, M.R. Biogeography of Apis cerana F. and A. nigrocincta Smith: Insights from mtDNA studies. Apidologie 2000, 31, 265–279. [Google Scholar] [CrossRef] [Green Version]
- Radloff, S.E.; Hepburn, C.; Hepburn, H.R.; Fuchs, S.; Hadisoesilo, S.; Tan, K.; Engel, M.S. Population structure and classification of Apis cerana. Apidologie 2010, 41, 589–601. [Google Scholar] [CrossRef] [Green Version]
- Rol, A.; Dharam, P. Asiatic Honeybee Apis Cerana; Springer: Dordrecht, The Netherlands, 2013. [Google Scholar]
- Zhao, H.; Li, G.; Guo, D.; Wang, Y.; Xu, B. Transcriptomic and metabolomic landscape of the molecular effects of glyphosate commercial formulation on Apis mellifera ligustica and Apis cerana cerana. Sci. Total Environ. 2020, 744, 140819. [Google Scholar] [CrossRef] [PubMed]
- Li, Y.; Chao, T.; Fan, Y.; Lou, D.; Wang, G. Population genomics and morphological features underlying the adaptive evolution of the eastern honey bee (Apis cerana). BMC Genom. 2019, 20, 869. [Google Scholar]
- Hou, C.; Li, B.; Luo, Y.; Deng, S.; Diao, Q. First detection of Apis mellifera filamentous virus in Apis cerana cerana in China. J. Invertebr. Pathol. 2016, 138, 112–115. [Google Scholar] [CrossRef] [PubMed]
- Chao, C.; Wang, H.; Liu, Z.; Xiao, C.; Tang, J.; Meng, F.; Wei, S. Population Genomics Provide Insights into the Evolution and Adaptation of the Eastern Honey Bee (Apis cerana). Mol. Biol. Evol. 2018, 9, 2260–2271. [Google Scholar]
- Meng, J.; Wang, L.; Wang, C.; Zhao, G.; Guo, X. AccPDIA6 from Apis cerana cerana plays important roles in antioxidation. Pestic. Biochem. Physiol. 2021, 175, 104830. [Google Scholar] [CrossRef]
- Zhao, G.; Zhao, W.; Cui, X.; Xu, B.; Liu, Q.; Li, H.; Guo, X. Identification of an MGST2 gene and analysis of its function in antioxidant processes in Apis cerana. Arch. Insect Biochem. Physiol. 2021, 106, e21770. [Google Scholar] [CrossRef]
- Fan, W.; Li, G.; Zhang, X.; Wang, Y.; Li, H. The role of melatonin and Tryptophan-5-hydroxylase-1 in different abiotic stressors in Apis cerana cerana. J. Insect Physiol. 2021, 128, 104180. [Google Scholar] [CrossRef]
- Ruttner, F. Biogeography and taxonomy of honeybees/Friedrich Ruttner. J. N. Y. Entomol. Soc. 1989, 97, 365–367. [Google Scholar]
- Hodges, J. The global organization of animal genetic resources. In World Congress on Genetics Applied to Livestock Production; Animal Production & Health Division, FAO: Rome, Italy, 1990. [Google Scholar]
- Park, D.; Jung, J.W.; Choi, B.S.; Jayakodi, M.; Kwon, H.W. Uncovering the novel characteristics of Asian honey bee, Apis cerana, by whole genome sequencing. BMC Genom. 2015, 16, 1. [Google Scholar] [CrossRef] [Green Version]
- Francioli, L.C.; Menelaou, A.; Pulit, S.L.; van Dijk, F.; Palamara, P.F.; Elbers, C.C.; Neerincx, P.B.T.; Ye, K.; Guryev, V.; Kloosterman, W.P.; et al. Whole-genome sequence variation, population structure and demographic history of the Dutch population. Nat. Genet. 2014, 46, 818–825. [Google Scholar]
- Xu, X.; Zhu, X.; Zhou, S.; Wu, X.; Zhou, B. Genetic differentiation between Apis cerana cerana populations from Damen Island and adjacent mainland in China. Acta Ecol. Sin. 2013, 33, 122–126. [Google Scholar] [CrossRef]
- Yin, L.; Ji, T. Genetic diversity of the honeybee Apis cerana in Yunnan, China, based on mitochondrial DNA. Genet. Mol. Res. 2013, 12, 2002–2009. [Google Scholar] [CrossRef] [PubMed]
- Fang, L.; Shi, T.; Huang, S.; Yu, L.; Bi, S. Genetic structure of Mount Huang honey bee (Apis cerana) populations: Evidence from microsatellite polymorphism. Hereditas 2016, 153, 8. [Google Scholar]
- Xie, C.H. SRAP Analysis of Genetic Diversity of Riparian Plant Distylium chinense in Hubei Province. Bull. Bot. Res. 2012, 32, 311–319. [Google Scholar]
- Ping, L.X.; Quan, H.Z.; Chen, F.J.; Liang, H.W.; Lan, L.F. RAPD analysis for the genetic diversity of four populations of Davidia involucrata Baill.in Shennongjia area, Hubei Province. J. Beijing For. Univ. 2006, 28, 66. [Google Scholar]
- Andrews, S. FastQC: A quality control tool for high throughput sequence data. In Babraham Bioinformatics; Babraham Institute: Cambridge, UK, 2010. [Google Scholar]
- Martin, M. Cutadapt removes adapter sequences from high-throughput sequencing reads. EMBnet J. 2011, 17, 10–12. [Google Scholar] [CrossRef]
- Li, H.; Durbin, R. Fast and accurate short read alignment with Burrows-Wheeler transform. Bioinformatics 2009, 25, 1754–1760. [Google Scholar] [CrossRef] [Green Version]
- Mckenna, A.; Hanna, M.; Banks, E.; Sivachenko, A.; Cibulskis, K.; Kernytsky, A.; Garimella, K.; Altshuler, D.; Gabriel, S.; Daly, M. The Genome Analysis Toolkit: A MapReduce framework for analyzing next-generation DNA sequencing data. Genome Res. 2010, 20, 1297–1303. [Google Scholar] [CrossRef] [Green Version]
- Cingolani, P.; Platts, A.; Wang, L.L.; Coon, M.; Nguyen, T.; Wang, L.; Land, S.J.; Lu, X.; Ruden, D.M. A program for annotating and predicting the effects of single nucleotide polymorphisms, SnpEff. Fly 2012, 6, 80–92. [Google Scholar] [CrossRef] [Green Version]
- Han, L.; Ralph, P. Local PCA shows how the effect of population structure differs along the genome. Genetics 2019, 211, 289–304. [Google Scholar]
- Pritchard, J.K.; Stephens, M.J.; Donnelly, P.J. Inference of Population Structure Using Multilocus Genotype Data. Genetics 2000, 155, 945–959. [Google Scholar] [CrossRef] [PubMed]
- Falush, D.; Stephens, M.; Pritchard, J.K. Inference of Population Structure Using Multilocus Genotype Data: Linked Loci and Correlated Allele Frequencies. Genetics 2003, 164, 1567–1587. [Google Scholar] [CrossRef] [PubMed]
- Liliana, P.H.; Yarimar, R.; Carla, S.; Christopher, P.; Ángel, C.; Lareu, M.V. An overview of Structure: Applications, parameter settings, and supporting software. Front. Genet. 2013, 4, 98. [Google Scholar]
- Danecek, P.; Auton, A.; Abecasis, G.; Albers, C.A.; Anks, E.B.; Depristo, M.A.; Handsaker, R.E.; Lunter, G.; Marth, G.T.; Sherry, S.T. The variant call format and VCFtools. Bioinformatics 2011, 27, 2156–2158. [Google Scholar] [CrossRef] [PubMed]
- Wickham, H. ggplot2: Elegant Graphics for Data Analysis, 2nd ed.; Springer: Cham, Switzerland, 2016. [Google Scholar]
- Evanno, G.S.; Regnaut, S.J.; Goudet, J. Detecting the number of clusters of individuals using the software Structure: A simulation study. Mol. Ecol. 2005, 14, 2611–2620. [Google Scholar] [CrossRef] [Green Version]
- Dray, S.; Dufour, A.-B. The ade4 Package: Implementing the Duality Diagram for Ecologists. J. Stat. Softw. 2007, 22, 1–20. [Google Scholar] [CrossRef] [Green Version]
- Rosenberg, M.S.; Anderson, C.D. PASSaGE: Pattern Analysis, Spatial Statistics and Geographic Exegesis. Version 2. Methods Ecol. Evol. 2011, 2, 229–232. [Google Scholar] [CrossRef]
- Yue-Hui, M.A.; Gui-Fang, X.U.; Wang, D.Y.; Liu, H.L.; Yang, Y. Study on Dynamic Information of Animal Genetic Resources in China. Agric. Ences China 2003, 2, 80–84. [Google Scholar]
- Amin, E.; Brooks, S.A.; Tomas, B.; Ellis, J.D. Population genomics and morphometric assignment of western honey bees (Apis mellifera L.) in the Republic of South Africa. BMC Genom. 2018, 19, 615. [Google Scholar]
- Hao, L.; Zhou, S.; Zhu, X.; Xinjian, X.U.; Cai, Z.; Niu, Q.; Yuan, C.; Chen, D.; Zhou, B. Genetic differentiation and genetic diversity analysis of Apis cerana in northeast China. J. Northeast Agric. Univ. 2019, 50, 35–43. [Google Scholar]
- Ji, Y.; Li, X.; Ji, T.; Tang, J.; Zhou, X. Gene reuse facilitates rapid radiation and independent adaptation to diverse habitats in the Asian honeybee. Sci. Adv. 2020, 6, eabd3590. [Google Scholar] [CrossRef] [PubMed]
- Jones, J.C.; Myerscough, M.R.; Graham, S.; Oldroyd, B.P. Honey Bee Nest Thermoregulation: Diversity Promotes Stability. Science 2004, 305, 402–404. [Google Scholar] [CrossRef] [Green Version]
- Oldroyd, B.P.; Fewell, J.H. Genetic diversity promotes homeostasis in insect colonies. Trends Ecol. Evol. 2007, 22, 408–413. [Google Scholar] [CrossRef]
- Gloag, R.; Ding, G.; Christie, J.R.; Buchmann, G.; Beekman, M.; Oldroyd, B.P. An invasive social insect overcomes genetic load at the sex locus. Nat. Ecol. Evol. 2016, 1, 0011. [Google Scholar] [CrossRef]
- Schneider, S.S.; Degrandihoffman, G.; Smith, D.R. The African honey bee: Factors contributing to a successful biological invasion. Annu. Rev. Entomol. 2004, 49, 351. [Google Scholar] [CrossRef] [Green Version]
- Diniz-Filho, J.A.F.; Soares, T.N.; Lima, J.S.; Dobrovolski, R.; Landeiro, V.L.; Telles, M.P.d.C.; Rangel, T.F.; Bini, L.M. Mantel test in population genetics. Genet. Mol. Biol. 2013, 36, 475–485. [Google Scholar] [CrossRef] [Green Version]
- Goulson, D.; Nicholls, E.; Botias, C.; Rotheray, E.L. Bee declines driven by combined stress from parasites, pesticides, and lack of flowers. Science 2015, 347, 1435. [Google Scholar] [CrossRef]
- Klein, S.; Cabirol, A.; Devaud, J.M.; Ba Rron, A.B.; Lihoreau, M. Why Bees Are So Vulnerable to Environmental Stressors. Trends Ecol. Evol. 2017, 32, 268–278. [Google Scholar] [CrossRef]

Publisher’s Note: MDPI stays neutral with regard to jurisdictional claims in published maps and institutional affiliations. |
© 2022 by the authors. Licensee MDPI, Basel, Switzerland. This article is an open access article distributed under the terms and conditions of the Creative Commons Attribution (CC BY) license (https://creativecommons.org/licenses/by/4.0/).