Abstract
Obesity is one of the main public health problems in Mexico and the world and one from which a large number of pathologies derive. Single nucleotide polymorphisms (SNPs) of various genes have been studied and proven to contribute to the development of multiple diseases. SNPs of the leptin pathway have been associated with the control of hunger and energy expenditure as well as with obesity and type 2 diabetes mellitus. Therefore, the present work focused on determining the association between anthropometric markers and biochemical and dietary factors related to obesity and SNPs of leptin pathway genes, such as the leptin gene (LEP), the leptin receptor (LEPR), proopiomelanocortin (POMC), prohormone convertase 1 (PCSK1), and the melanocortin 4 receptor (MC4R). A population of 574 young Mexican adults of both sexes, aged 19 years old on average and without metabolic disorders previously diagnosed, underwent a complete medical and nutritional evaluation, biochemical determination, and DNA extraction from the blood; DNA samples were subsequently genotyped. Association analyses between anthropometric, biochemical, and dietary variables with SNPs were performed using binary logistic regressions (p-value = 0.05). Although the sampled population did not have previously diagnosed diseases, the evaluation results showed that 33% were overweight or obese according to BMI and 64% had non-clinically elevated levels of body fat. From the 74 SNP markers analyzed from the five previously mentioned genes, 62 showed polymorphisms within the sampled population, and only 35 of these had significant associations with clinical variables. The risk associations (OR > 1) occurred between clinical markers with elevated values for waist circumference, waist–height index, BMI, body fat percentage, glucose levels, insulin levels, HOMA-IR, triglyceride levels, cholesterol levels, LDL-c, low HDL-c, carbohydrate intake, and protein intake and SNPs of the LEP, LEPR, PCSK1, and MC4R genes. On the other hand, the protective associations (OR < 1) were associated with markers including elevated values for insulin, HOMA-IR, cholesterol, c-LDL, energy intake > 2440 Kcal/day, and lipid intake and SNPs of the LEP and LEPR genes and POMC. The present study describes associations between SNPs in leptin pathway genes, revealing positive and negative interactions between reported SNPs and the clinical markers related to obesity in a sampled Mexican population. Hence, our results open the door for the further study of new genetic variants and their influence on obesity.
1. Introduction
Obesity is a metabolic disease characterized by a chronic inflammatory process related to the accumulation of ectopic adipose tissue in different areas of the body [1]. Unfortunately, this condition has become more and more frequent in recent years in Mexico, a country that has positioned itself among the nations with the highest rates of obesity in both adults and children [2,3]. According to the 2018 National Survey of Health and Nutrition (ENSANUT) in Mexico, the prevalence of obesity in children aged 5 to 11 years is 20%, compared with 15% among males aged 12 to 19 years. Women between 20 and 29 years old showed an obesity prevalence of 26%, which increased to 46% among women aged 30 to 59 years; when the male population was analyzed, a less pronounced increment was observed, from 24% to 35%. Older adults showed different dynamics; women have a 40% prevalence of obesity, compared to a 26% prevalence among men [4]. Multiple studies reported that obesity is related to several factors, including elevated energy consumption, a sedentary lifestyle, the consumption of alcoholic beverages, smoking, and several genetic factors [5]. For example, studies have described the positive or negative effects of single nucleotide polymorphisms (SNPs) on metabolic pathways and health conditions [6,7].
Leptin (LEP) is a protein with a hormone-like function that is produced and secreted by adipose tissue. Research has demonstrated its importance in controlling the homeostasis of energy regulation; its disruption can cause imbalances in the regulation of food intake, body mass, immune responses, and lipolysis [8,9]. The diversity of leptin’s actions is attributed to its effects on the central nervous system (CNS), which occurs by crossing the blood-brain barrier through a receptor-mediated endocytosis mechanism [10]. Satiety control is regulated by the leptin and melanocortin pathway, in which the LEP secreted by adipocytes interacts with the leptin receptor (LEPR) present in the neurons of the arcuate nucleus of the hypothalamus. Activating this receptor causes the activation of different transcription factors that allow the transcription of proopiomelanocortin (POMC), which is subjected to post-translational modifications, especially to proteolysis regulated by prohormone convertase 1 (PCSK1). The resultant peptides—α and β melanocyte-stimulating hormones—are recognized and activate the melanocortin 4 receptor (MC4R) present in neurons of the paraventricular nucleus, inducing satiety signals and increasing energy utilization (Figure 1) [11,12,13].
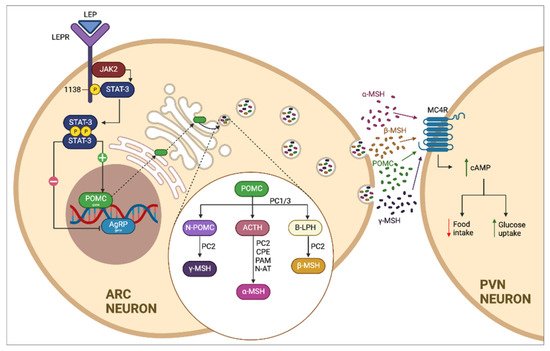
Figure 1.
Classical leptin–melanocortin pathway. The melanocortin pathway is regulated by the production of leptin (LEP) and its receptor (LEPR) present in neurons of the arcuate nucleus of the hypothalamus. LEP induces the expression of proopiomelanocortin (POMC) by activating the JAK-STAT pathway, which is transported by cellular cisterns and degraded by specific enzymes present in the cell, including prohormone convertase 1 (PCSK1, PC1/3), which promotes the formation of α and β melanocyte-stimulating hormones (α/β-MSH) and which are recognized by the melanocortin 4 receptor (MC4R) present in neurons of the paraventricular nucleus of the hypothalamus, which induces the sensation of satiety and increased energy use.
Different gene SNPs have been shown to affect leptin and melanocortin pathways, promoting the development of clinical markers of obesity; the polymorphism rs7799039 of the leptin gene has been associated with obesity, and the SNP rs1137101 of the LEPR gene has been associated with a risk for the development of type 2 diabetes mellitus in the Turkish population [14]. In the same way, the POMC polymorphism rs934778 has been reported as a risk factor that affects insulin sensitivity [15]. The rs6232 polymorphism of the gene that codes for PCSK1 has also been associated with both childhood and adult obesity [16]; likewise, the rs2229616 polymorphism of the MC4R gene has been associated with an increased risk of developing type 2 diabetes mellitus in Saudi patients [17].
Several studies have addressed specific genetic variants of the leptin-melanocortin pathway in the Mexican population, but none of them carried out an integrated evaluation of this pathway. The present work, therefore, focuses on the evaluation of the association of clinical markers related to obesity and SNPs of the LEP, LEPR, POMC, PCSK1, and MC4R genes in a healthy Mexican population.
2. Materials and Methods
2.1. Characteristics of the Subjects and Clinical Evaluation
A total sampled population of 574 freshmen from the Universidad Autónoma de Querétaro, both sexes, aged 18 to 30 years without a previous diagnosis of chronic non-communicable diseases, was selected. The participants signed informed consent to perform the clinical evaluation and for the management of the sample and the use of their data for scientific research. The project was approved by the Bioethics Committee of the Facultad de Ciencias Naturales of the Universidad Autónoma de Querétaro (Reference no. 58FCN2020) and performed under the guidelines of the Declaration of Helsinki [18].
All participants underwent an anthropometric assessment that consisted of collecting data from their waist and hip circumference, weight, and height. All anthropometric evaluations were performed by nutritionists, in duplicate, non-consecutively, using previously standardized procedures recommended by the World Health Organization [19].
Body weight and body composition, which are based on the percentages of fat and lean mass, were determined through bioelectrical bioimpedance equipment (SECA mBCA Mod. 514, Hamburg, Germany) previously calibrated with known weight standards. Height was determined with a 2 m stadiometer (SECA-Bodymeter, Mod. 208 Hamburg, Germany) with a separation of 0.1 cm. Height was measured barefoot, ensuring that the heels, calves, buttocks, shoulders, and back of the head were in contact with the wall; measurements were taken according to the “Frankfurt map”. Using the weight and height data, the body mass index (BMI) was calculated. The waist circumference was measured by placing a tape measure (SECA, Mod. 201, Hamburg, Germany) on a line midway between the upper iliac crest and the lower costal margin at the end of a normal expiration.
For biochemical blood analyses, a fasting blood sample was taken by venipuncture of the arm in 5 mL vacutainer tubes without clotting agents. The blood samples were centrifuged at 2500 rpm for 10 min to obtain the serum needed to perform biochemical analyses of glucose, triglycerides, cholesterol, HDL, and insulin through a colorimetric enzymatic technique (SPINREACT, Girona, Spain) using automated Mindray Mod. BS 120 equipment (Shenzhen, China). Serum LDL-cholesterol concentrations were calculated using the Fridelwald formula (LDL = CT-HDL (TG/5)) in participants with TG < 400 mg/dL.
The presence of obesity risk factors was assessed according to the following anthropometric, biochemical, and clinical indicators: body mass index > 25.0 kg/m2; waist circumference (women > 80 cm and men > 90 cm); waist–hip index (women > 0.85 and men > 0.95); waist–height ratio > 0.50; body fat percentage (women > 35% and men > 20%); fasting glucose > 100 mg/dL; insulin (>14 µ/mL for women and >11 U/mL for men); HOMA index (>2.9 for women and >2.3 for men); total cholesterol (>200 mg/dL); low-density lipoproteins cholesterol (LDL-c) (>130 mg/dL); high-density lipoproteins cholesterol (HDL-c) (<50 mg/dL for women and <40 mg/dL for men); triglycerides (>150 mg/dL).
Dietary intake information was obtained using a food frequency questionnaire with 116 items that were previously validated by the “Carlos Alcocer Cuarón” FCN-UAQ Nutrition Clinic, Human Nutrition Laboratory (FCN-UAQ). The total energy intake and macronutrient composition were analyzed using the United States Department of Agriculture Food Composition Databases. The total energy intake was dichotomized according to the median of the population. Carbohydrate, protein, and lipid intakes were expressed in percentages and grams. High intakes were considered at >60%, >30%, and >20%, respectively.
2.2. Extraction and Quantification of Genetic Material
Genomic DNA was extracted from whole blood samples (200 μL) using the QIAamp 96 DNA blood kit (QIAGEN, Valencia, CA, USA) according to the manufacturer’s protocol and recommendations. The concentration and 260/280 quality ratio for all isolated DNA samples were determined using the Nanodrop spectrophotometer (Wilmington, DE, USA) and stored at −20 °C until use. Purified DNA was used for genotyping using a concentration of 25 ng of DNA/mL with a purity rate of 1.8–2. The samples were diluted to a final stock concentration of 25 ng/mL using nuclease-free water.
2.3. Microarray Assay
The Illumina Custom Array was designed including 74 genetic variants for the analyzed genes (Table 1) among other markers. DNA samples (30–50 ng) were genotyped with the Illumina Infinium HTS Automated protocol and the Beadchip Global Screening Array (GSA-24 v1.0) microarray according to the manufacturer’s instructions in the following steps: the whole genome was isothermally amplified, fragmented, precipitated, and resuspended; later, the resuspended samples were hybridized to the array for the enzymatic base extension and fluorescent staining; and finally, the Illumina iScan System recorded the fluorescent data of the beadchips. The genotype calling was determined using the Illumina GenomeStudio Genotyping software and only the samples with call rates greater than 0.95 were considered for this study. The whole protocol was performed in the Código 46 Genetics Laboratories [20].

Table 1.
List of 74 genetic variants evaluated in the study.
2.4. Genetic and Statistical Analyses
The genotypes were analyzed using GenAlEx to calculate allelic and genotypic frequencies. Alleles with a lower representation within the population (frequency < 0.05) were purged before testing them for the Hardy-Weinberg Equilibrium (HWE) and the presence of private alleles. Recessive genotypes were tested for their statistical significance (p-value = 0.05) and compared to both dominant and heterozygous genotypes.
To evaluate the anthropometric, biochemical, and dietary variables of the population, two groups were classified according to sex, and the means of each group were compared by Student’s t-test (p ≤ 0.05). Binary logistic regressions were performed to analyze the associations, where all the previously enlisted variables were compared against the SNPs, adjusted according to age and sex. Associations with values of p ≤ 0.05 were considered significant. All statistical analyses were performed using the Statistical Package for the Social Sciences (IBM SPSS Statistics for Macintosh, Version 26.0., Armonk, NY, USA: IBM Corp).
3. Results
3.1. Description of the Study Population
The general characteristics of the population were divided by sexes, where no statistically significant differences were observed (p < 0.05) in age, hip circumference, waist-to-height ratio, BMI, serum insulin levels, HOMA-IR, cholesterol, LDL-c, protein intake (%ID), lipid intake (%ID), or daily carbohydrate intake. However, significant statistical differences were observed (p < 0.05) in variables associated with sexual dimorphisms, such as height, weight, waist circumference, waist-hip ratio, and percentage of body fat, as well as in biochemical variables, such as glucose, triglycerides, and HDL-c, and dietary intake in daily energy and grams of protein and lipid intake (Table 2).
Table 2.
Anthropometric, biochemical, and dietary variables of the sampled population.
Although the sampled subjects had not been previously diagnosed with metabolic disorders, we observed that 31% accumulated fat in the abdominal region (Figure 2A) according to waist circumference, 30% had a gynoid-type body distribution according to waist-hip ratio (Figure 2B), and 39% of the studied population showed cardiovascular risk according to the waist-to-height ratio (Figure 2C). Their nutritional status, determined by BMI, showed that the prevalence of obesity was 8%, 25% were overweight, and 67% were of normal weight or were underweight (Figure 2D). According to the percentage of body fat, only 36% of the population had normal or low fat, while 64% had elevated fat (Figure 2E).
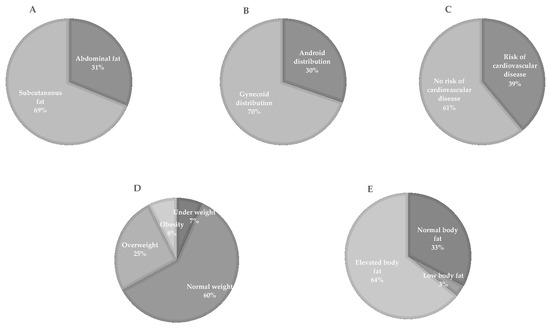
Figure 2.
Prevalence of anthropometric markers in the population. (A) The corporal mass distribution according to waist circumference is shown. (B) shows the distribution of body fat according to the waist-hip ratio. (C) shows the percentage of the population at risk of cardiovascular disease according to the waist-to-height ratio. (D) The percentage of the population with low weight, normal weight, overweight, and obesity according to BMI is shown. (E) shows the prevalence of low, normal, and high body fat.
3.2. Genetic Frequencies
From the 74 SNPs analyzed in this study, only 11 did not show a polymorphic variation within our sampled population: 5 for LEPR, 1 for POMC, 4 for PCSK1, and 1 for MC4R (Table 3). Consequently, 63 SNPs were selected for further analysis. Of these, 35 markers showed significant statistical associations (binary logistic regression, p ≤ 0.05) with obesity markers, from which 23 polymorphisms were statistically associated with the risk of any of the evaluated clinical markers (OR > 1) (Table 4), 6 polymorphisms had protective associations with obesity markers (OR < 1) (Table 5), and 3 polymorphisms showed both risk and protective associations with some obesity markers.
Table 3.
Genetic frequencies of evaluated variants.
Table 4.
Significant statistical associations between clinical markers of obesity and SNPs of LEP, LEPR, POMC, PCSK1, and MC4R, considered to be risk factors.
Table 5.
Significant statistical associations between clinical markers of obesity and SNPs of LEP, LEPR, POMC, PCSK1, and MC4R: protective factors.
3.3. Association between Clinical Markers of Obesity and SNPs of Leptin Pathway Genes
Risk associations with anthropometric markers related to obesity showed that the SNPs rs10244329 (OR = 1.965) and rs11760956 (OR = 1.666) found in the LEP gene were associated with a large waist circumference, rs10244329 (OR = 2.055) and rs11760956 (OR = 1.523) were associated with the waist–height index, and rs111573261 (OR = 2.399) and rs78862345 (OR = 2.399) from the LEPR gene were also associated with the same anthropometric marker. Elevated BMI was associated with rs11760956 (OR = 1.571), and an elevated percentage of body fat was associated with rs10244329 (OR = 2.415), both SNPs from the LEP gene.
Statistically significant risk associations were observed between some analyzed SNP markers and obesity-related biochemical markers. A strong positive association between glucose and rs114280901 (OR = 5.169) was found; elevated insulin levels showed associations with the LEP gene rs11760956 (OR = 2.175) as well as with rs12035604 (OR = 2.257), rs1137101 (OR = 1.834), and rs4655723 (OR = 2.353) from the LEPR gene. Similarly, the HOMA-IR showed a direct association with rs4655724 (OR = 1.671). Associations between lipid profile biomarkers and SNPs from the LEPR gene were also found, specifically between elevated triglyceride values and rs6700896 (OR = 1.903) and rs1805096 (OR = 1.872). The rs17392686 marker from the PCSK1 gene showed a strong association with high levels of total cholesterol (OR = 7.508). Elevated LDL cholesterol was associated with three SNPs from the LEPR gene, rs9436301 (OR = 2.612), rs77451629 (OR = 5.216), and rs1171278 (OR = 2.32). Lastly, high-density cholesterol (HDL-c) showed associations with rs12145690 (OR = 1.844), rs9436301 (OR = 1.557), rs11208648 (OR = 3.102), rs970467 (OR = 1.865), rs10128072 (OR = 1.594), and rs1171278 (OR = 1.673) from the LEPR gene and rs34114122 (OR = 2.842) from the MC4R gene.
Statistical associations between SNPs and dietary factors were found; rs4731426 (OR = 1.724) from the LEP gene showed a risk associated with a high intake of carbohydrates as well as with rs77451629 (OR = 5.031), rs2025803 (OR = 1.744), rs2104564 (OR = 3.318), and rs1751492 (OR = 4.262) of the LEP gene. Variants rs2229616 (OR = 6.857) from the MC4R gene and rs271923 (OR = 3.962) from the PCSK1 gene were associated with a high protein intake.
Interestingly, no statistically significant protective associations were observed with anthropometric obesity markers. However, rs11208659 from LEP appeared to be a protective factor for elevated insulin levels (OR = 0.319) and for elevated HOMA-IR (OR = 0.331). The SNPs of the LEPR gene, rs1045895 (OR = 0.506) and rs9436748 (OR = 0.462), showed a protective association with elevated total cholesterol, whereas rs10244329 (OR = 0.383) from the LEP gene and rs1045895 (OR = 0.287) and rs9436748 (OR = 0.326) were observed to be protective factors against HDL-c. Meanwhile, rs72683113 (OR = 0.549) from the LEPR gene showed a protective association with high energy consumption, and rs1137101 (OR = 0.661) from the LEPR gene and rs28932472 (OR = 0.658) from the POMC gene were seen as protective against high lipid intake (Table 5).
Variants rs10244329 and rs11760956 from the LEP gene were directly associated with classic obesity markers (Table 6). These two SNPs were the only markers with statistically significant associations (p < 0.05) with body fat percentage, waist circumference, and BMI when the mean values were analyzed using Student’s t-test (Table S1 in Supplementary Materials).
Table 6.
Determination of the influence of SNPs on obesity.
4. Discussion
The leptin pathway has been consistently associated with food intake and energy expenditure by various authors and associated with obesity and obesity-related diseases [8]. The present study shows multiple associations between genetic variants of the LEP, LEPR, POMC, PCSK1, and MC4R genes and anthropometric, biochemical, and dietary markers. Waist circumference is an anthropometric marker commonly associated with abdominal obesity and increased morbidity and mortality from associated diseases [21]. The results suggested an association between waist circumference and SNPs from the LEP gene, rs10244329 and rs11760956. These two genetic variants have also been associated with obesity markers by other authors, while rs10244329 was associated with body fat index in a study with European adolescents [22], and rs11760956 has been associated with rapid body weight regain [23]. Moreover, these two SNPs were associated with a high waist-to-height ratio along with two more genetic variants from the LEPR gene that were not previously analyzed in the literature, rs111573261 and rs78862345. Associations between rs11760956 and elevated BMI, and rs10244329 and elevated body fat percentage were observed and reported in this study.
Concerning biochemical markers, elevated glucose was associated with a genetic variant of the LEPR gene, rs114280901, and elevated insulin levels were associated with rs11760956 from the LEP gene and with rs1137101 from the LEPR gene. Rs1137101 was observed to influence the weight of the mother and the newborn in a Romanian study [24]; likewise, the association between this genetic LEPR variant and a resistance to treatment against breast cancer in a population of overweight Mexican women was also reported [25]. Similarly, our results show an association between elevated insulin levels and rs12035604 and rs4655723 from the LEPR gene that was not previously reported. Variants rs6700896 and rs1805096 were found to be associated with triglycerides, whereas rs6700896 was previously associated with increased cardiovascular risk in a meta-analysis reported in 2017 [26] as well as in a published study in a Chinese population [27]. Another study, conducted in the Egyptian population, showed that rs6700896 was associated with non-alcoholic hepatic steatosis and insulin resistance [28], with results suggesting that hypertriglyceridemia is a common marker of non-alcoholic hepatic steatosis and insulin resistance. In a study on a Mexican population diagnosed with morbid obesity, rs1805096 was related to ligament imbalance and was significantly associated with the diagnosed medical condition [29]. Elevated cholesterol had a strong association with a previously unreported variant of the PCSK gene (rs17392686), opening the door for future research on this genetic variant of the gene.
In our study, elevated LDL-c showed an association with rs9436301, which was previously reported in a study in pregnant women, where it was associated with higher levels of circulating leptin and elevated expression of LEP in the placenta [30]. Moreover, rs1171278 has been associated with the expression of the LEP gene and an increment in plasma leptin levels through a genome-wide association study (GWAS) [31]. Our results showed low HDL-c levels were associated with seven LEPR SNPs, one of them not previously reported, as well as another SNP found in the MC4R gene. Interestingly, rs12145690 has been observed in a Spanish Mediterranean female population associated with circulating leptin levels, adjusted for BMI [32], and rs970467 has been associated with lipid markers related to kidney cancer [33]. In a systematic review of the Lausanne Cohort 65+, rs10128072 was associated with fat mass and waist circumference, whereas the rs34114122 variant found in the MC4R gene was associated with obesity, high fat mass, and high food intake in the Hispanic population [34].
Protective associations between SNPs and biochemical markers have been previously reported; variant rs11208659 was identified as a protective factor in a study conducted in Spanish children [35], and in the results of this study, insulin protective factor and observed HOMA-IR values were elevated, which indicates that it may be a genetic marker associated with metabolic alterations and obesity. Our results show rs1045895 to be negatively associated with elevated cholesterol levels; nevertheless, a negative association has been observed with BMI in the American population [36]. No previous studies were found indicating the association of rs9436748 with obesity or any biochemical or anthropometric alteration; however, it has been shown to be a risk factor for breast cancer [37]. Both rs2025803 and rs10749753 have been previously associated as protective factors for elevated LDL-c and have been associated in the same way with low plasma leptin levels [32]. Although published data do not show an association of the SNPs with biochemical markers, these previous studies had a different approach from the one used in our research. Therefore, these associations have certainly not been explored. When analyzing the food intake data, rs4731426 of the LEP gene showed a negative association with a high consumption of carbohydrates. In a previous study performed on a population of South India, rs4731426 was associated with obesity and increased body weight gain [38], and its relationship with obesity has already been reported in other populations [23].
5. Conclusions
The analyzed population in this study was not previously diagnosed with metabolic disorders, so the associations found between SNPs and clinical variables are highly relevant to understanding future pathologies in the studied population. Although the reported markers associated with energy and macronutrient intake have been previously described, the strong associations found in the present study are unique and provide new insights into the association between clinical and genetic markers, ascertaining the influence of the SNPs of the leptin pathway in the individual imbalances in the evaluated clinical markers.
Supplementary Materials
The following supporting information can be downloaded at: https://www.mdpi.com/article/10.3390/genes13060945/s1, Table S1: Determination of the influence of SNPs on classic markers of obesity.
Author Contributions
R.O.C.-L. and L.V.H.-R.: both authors completed the total analysis of the data and participated in the draft writing; A.A.-G.: participated in obtaining the clinical data and writing the manuscript; W.G.-M.: participated in the genetic analysis of the samples and data curation; L.H.-T.: participated in the genetic analysis of the samples; M.d.L.A.-C.: participated in the genetic analysis of the samples; C.V.-S.: participated in the genotyping of the samples; K.L.F.-V.: participated in obtaining the clinical data; M.A.A.-L.: participated in obtaining clinical data and revising the manuscript; T.G.-G.: participated in obtaining the data and samples and in data analysis; V.M.R.-G.: participated in the genetic analysis of the samples and the co-direction of the entire work; U.M.-C.: participated in obtaining the samples and data, data analysis, and co-direction of the entire work. All authors participated in the writing, discussion, and structuring of the manuscript. All authors have read and agreed to the published version of the manuscript.
Funding
This research was partially financed through the Funding for Knowledge Development provided by the Universidad Autónoma de Querétaro, 2021 (FONDEC-UAQ 2021). Likewise, the genetic analysis of the samples was carried out by CÓDIGO 46 S.A. of C.V. and by funds provided by the Universidad Autónoma de Querétaro. The publishing cost was financed by the Tecnologico de Monterrey.
Institutional Review Board Statement
The study was conducted in accordance with the Declaration of Helsinki and approved by the Ethics Committee of Facultad de Ciencias Naturales, Universidad Autónoma de Querétaro (protocol number 58FCN2020 and date of approval 1 October 2020).
Informed Consent Statement
Informed consent was obtained from all subjects involved in the study.
Data Availability Statement
Not applicable.
Acknowledgments
To the UAQ Health System (SUSALUD-UAQ), to the “Carlos Alcocer Cuarón” FCN-UAQ Nutrition Clinic, Human Nutrition Laboratory (FCN-UAQ), to the program “Summer of science in the central region, Mexico 2021”, to the bachelor students from the Nutrition program at the FCN-UAQ, Alonso Chama-Aviles, and María Fernanda Garrido-León. To the Academic group of Biomedical Research and Functional Foods (UAQ-CA-140) and CÓDIGO 46 S.A. de C.V., for their support with the technological facilities for the development of this project; to Mark Arcuri for reviewing the manuscript language.
Conflicts of Interest
The authors declare no conflict of interest.
References
- Avalos-Soriano, A.; De la Cruz-Cordero, R.; Rosado, J.; Garcia-Gasca, T. 4-Hydroxyisoleucine from Fenugreek (Trigonella foenum-graecum): Effects on Insulin Resistance Associated with Obesity. Molecules 2016, 21, 1596. [Google Scholar] [CrossRef] [PubMed]
- Aceves-Martins, M.; Llauradó, E.; Tarro, L.; Solà, R.; Giralt, M. Obesity-promoting factors in Mexican children and adolescents: Challenges and opportunities. Glob. Health Action 2016, 9, 29625. [Google Scholar] [CrossRef] [PubMed]
- Vázquez-Velázquez, V.; Laviada-Molina, H.; García-García, E.; Sandoval-Diez, E.; Mancillas-Adame, L. Perceptions, Attitudes, and Barriers to Obesity Care in Mexico: Data From the ACTION-IO Study. Obesity 2021, 29, 317–326. [Google Scholar] [CrossRef] [PubMed]
- Colchero, M.A.; Fuentes, M.L.; Salinas, C.A.A. La Obesidad en México; Revista Médica del Instituto Mexicano del Seguro Social: Mexico City, Mexico, 2018; ISBN 9786075111797. [Google Scholar]
- Flores-Viveros, K.L.; Aguilar-Galarza, B.A.; Ordóñez-Sánchez, M.L.; Anaya-Loyola, M.A.; Moreno-Celis, U.; Vázquez-Cárdenas, P.; García-Gasca, T. Contribution of genetic, biochemical and environmental factors on insulin resistance and obesity in Mexican young adults. Obes. Res. Clin. Pract. 2019, 13, 533–540. [Google Scholar] [CrossRef]
- Povel, C.M.; Boer, J.M.A.; Reiling, E.; Feskens, E.J.M. Genetic variants and the metabolic syndrome: A systematic review. Obes. Rev. 2011, 12, 952–967. [Google Scholar] [CrossRef]
- Maycotte-Cervantes, M.L.; Aguilar-Galarza, A.; Anaya-Loyola, M.A.; Anzures-Cortes, M.d.L.; Haddad-Talancón, L.; Méndez-Rangel, A.S.; García-Gasca, T.; Rodríguez-García, V.M.; Moreno-Celis, U. Influence of Single Nucleotide Polymorphisms of ELOVL on Biomarkers of Metabolic Alterations in the Mexican Population. Nutrients 2020, 12, 3389. [Google Scholar] [CrossRef]
- Obradovic, M.; Sudar-Milovanovic, E.; Soskic, S.; Essack, M.; Arya, S.; Stewart, A.J.; Gojobori, T.; Isenovic, E.R. Leptin and Obesity: Role and Clinical Implication. Front. Endocrinol. 2021, 12, 585887. [Google Scholar] [CrossRef]
- Izquierdo, A.G.; Crujeiras, A.B.; Casanueva, F.F.; Carreira, M.C. Leptin, obesity, and leptin resistance: Where are we 25 years later? Nutrients 2019, 11, 2704. [Google Scholar] [CrossRef]
- Crujeiras, A.B.; Carreira, M.C.; Cabia, B.; Andrade, S.; Amil, M.; Casanueva, F.F. Leptin resistance in obesity: An epigenetic landscape. Life Sci. 2015, 140, 57–63. [Google Scholar] [CrossRef]
- Fairbrother, U.; Kidd, E.; Malagamuwa, T.; Walley, A. Genetics of Severe Obesity. Curr. Diab. Rep. 2018, 18, 85. [Google Scholar] [CrossRef]
- Nordang, G.B.N.; Busk, Ø.L.; Tveten, K.; Hanevik, H.I.; Fell, A.K.M.; Hjelmesæth, J.; Holla, Ø.L.; Hertel, J.K. Next-generation sequencing of the monogenic obesity genes LEP, LEPR, MC4R, PCSK1 and POMC in a Norwegian cohort of patients with morbid obesity and normal weight controls. Mol. Genet. Metab. 2017, 121, 51–56. [Google Scholar] [CrossRef] [PubMed]
- Ayers, K.L.; Glicksberg, B.S.; Garfield, A.S.; Longerich, S.; White, J.A.; Yang, P.; Du, L.; Chittenden, T.W.; Gulcher, J.R.; Roy, S.; et al. Melanocortin 4 Receptor Pathway Dysfunction in Obesity: Patient Stratification Aimed at MC4R Agonist Treatment. J. Clin. Endocrinol. Metab. 2018, 103, 2601–2612. [Google Scholar] [CrossRef] [PubMed]
- Ghalandari, H.; Hosseini-Esfahani, F.; Mirmiran, P. The association of polymorphisms in leptin/leptin receptor genes and ghrelin/ghrelin receptor genes with overweight/obesity and the related metabolic disturbances: A review. Int. J. Endocrinol. Metab. 2015, 13, e19073. [Google Scholar] [CrossRef] [PubMed]
- Zeng, C.P.; Lin, X.; Peng, C.; Zhou, L.; You, H.M.; Shen, J.; Deng, H.W. Identification of novel genetic variants for type 2 diabetes, childhood obesity, and their pleiotropic loci. J. Hum. Genet. 2019, 64, 369–377. [Google Scholar] [CrossRef]
- Jarvela, T.S.; Shakya, M.; Bachor, T.; White, A.; Low, M.J.; Lindberg, I. Reduced Stability and pH-Dependent Activity of a Common Obesity-Linked PCSK1 Polymorphism, N221D. Endocrinology 2019, 160, 2630–2645. [Google Scholar] [CrossRef]
- Bakhashab, S.; Filimban, N.; Altall, R.M.; Nassir, R.; Qusti, S.Y.; Alqahtani, M.H.; Abuzenadah, A.M.; Dallol, A. The effect sizes of PPARγ rs1801282, FTO rs9939609, and MC4R rs2229616 variants on type 2 diabetes mellitus risk among the western saudi population: A cross-sectional prospective study. Genes 2020, 11, 98. [Google Scholar] [CrossRef]
- World Medical Association. World Medical Association Declaration of Helsinki. Ethical principles for medical research involving human subjects. Bull. World Health Organ. 2001, 79, 373–374. [Google Scholar]
- World Health Organization. Transforming and Scaling up Health Professionals’ Education and Training; WHO Publication: Geneva, Switzerland, 2013; Volume 124.
- Ilumina Inc. (Ed.) Ilumina Inc Infinium HTS Assay: Reference Guide; Ilumina Inc.: San Diego, CA, USA, 2019; Volume 2, pp. 1–83. ISBN 1000000074604. [Google Scholar]
- Ross, R.; Neeland, I.J.; Yamashita, S.; Shai, I.; Seidell, J.; Magni, P.; Santos, R.D.; Arsenault, B.; Cuevas, A.; Hu, F.B.; et al. Waist circumference as a vital sign in clinical practice: A Consensus Statement from the IAS and ICCR Working Group on Visceral Obesity. Nat. Rev. Endocrinol. 2020, 16, 177–189. [Google Scholar] [CrossRef]
- Labayen, I.; Ruiz, J.R.; Moreno, L.A.; Ortega, F.B.; Beghin, L.; Dehenauw, S.; Benito, P.J.; Diaz, L.E.; Ferrari, M.; Moschonis, G.; et al. The effect of ponderal index at birth on the relationships between common LEP and LEPR polymorphisms and adiposity in adolescents. Obesity 2011, 19, 2038–2045. [Google Scholar] [CrossRef]
- Thonusin, C.; Shinlapawittayatorn, K.; Chattipakorn, S.C.; Chattipakorn, N. The impact of genetic polymorphisms on weight regain after successful weight loss. Br. J. Nutr. 2020, 124, 809–823. [Google Scholar] [CrossRef]
- Mărginean, C.; Mărginean, C.O.; Iancu, M.; Meliţ, L.E.; Tripon, F.; Bănescu, C. The FTO rs9939609 and LEPR rs1137101 mothers–newborns gene polymorphisms and maternal fat mass index effects on anthropometric characteristics in newborns. Medicine 2016, 95, e5551. [Google Scholar] [CrossRef] [PubMed]
- Méndez-Hernández, A.; Gallegos-Arreola, M.P.; Moreno-Macías, H.; Espinosa Fematt, J.; Pérez-Morales, R. LEP rs7799039, LEPR rs1137101, and ADIPOQ rs2241766 and 1501299 Polymorphisms Are Associated with Obesity and Chemotherapy Response in Mexican Women with Breast Cancer. Clin. Breast Cancer 2017, 17, 453–462. [Google Scholar] [CrossRef] [PubMed]
- Wu, L.; Sun, D. Leptin receptor gene polymorphism and the risk of cardiovascular disease: A systemic review and meta-analysis. Int. J. Environ. Res. Public Health 2017, 14, 375. [Google Scholar] [CrossRef] [PubMed]
- Jin, S.G.; Chen, G.L.; Yang, S.L.; Zhao, M.Y. Gene-gene interactions among CX3CL1, LEPR and IL-6 related to coronary artery disease in Chinese Han population. Int. J. Clin. Exp. Pathol. 2015, 8, 5968–5973. [Google Scholar]
- Swellam, M.; Hamdy, N. Association of nonalcoholic fatty liver disease with a single nucleotide polymorphism on the gene encoding leptin receptor. IUBMB Life 2012, 64, 180–186. [Google Scholar] [CrossRef]
- Rojano-Rodriguez, M.E.; Beristain-Hernandez, J.L.; Zavaleta-Villa, B.; Maravilla, P.; Romero-Valdovinos, M.; Olivo-Diaz, A. Leptin receptor gene polymorphisms and morbid obesity in Mexican patients. Hereditas 2016, 153, 1–5. [Google Scholar] [CrossRef][Green Version]
- Vlahos, A.; Mansell, T.; Burgner, D.; Collier, F.; Novakovic, B.; Saffery, R.; Vuillermin, P.; Ponsonby, A.L.; Carlin, J.; Allen, K.; et al. Determinants of placental leptin receptor gene expression and association with measures at birth. Placenta 2020, 100, 89–95. [Google Scholar] [CrossRef]
- Sun, Q.; Cornelis, M.C.; Kraft, P.; Qi, L.; van Dam, R.M.; Girman, C.J.; Laurie, C.C.; Mirel, D.B.; Gong, H.; Sheu, C.C.; et al. Genome-wide association study identifies polymorphisms in LEPR as determinants of plasma soluble leptin receptor levels. Hum. Mol. Genet. 2010, 19, 1846–1855. [Google Scholar] [CrossRef]
- Ortega-Azorín, C.; Coltell, O.; Asensio, E.M.; Sorlí, J.V.; González, J.I.; Portolés, O.; Saiz, C.; Estruch, R.; Ramírez-Sabio, J.B.; Pérez-Fidalgo, A.; et al. Candidate Gene and Genome-Wide Association Studies for Circulating Leptin Levels Reveal Population and Sex-Specific Associations in High Cardiovascular Risk Mediterranean Subjects. Nutrients 2019, 11, 2751. [Google Scholar] [CrossRef]
- Moore, L.; Brennan, P.; Meisner, A.; Hung, R.; Karami, S.; Rosenberg, P.; Yeager, M.; Stephen, C.; Zaridze, D.; Matveev, V.; et al. Abstract A89: Association of genes involved in lipid metabolism-peroxidation and risk of renal cancer in the Central European Renal Cancer Case-Control Study. In Proceedings of the Epidemiology/Lifestyle Factors, Washington, DC, USA, 16–19 November 2008; American Association for Cancer Research: Philadelphia, PA, USA, 2008; p. A89. [Google Scholar]
- Cole, S.A.; Butte, N.F.; Voruganti, V.S.; Cai, G.; Haack, K.; Kent, J.W.; Blangero, J.; Comuzzie, A.G.; McPherson, J.D.; Gibbs, R.A. Evidence that multiple genetic variants of MC4R play a functional role in the regulation of energy expenditure and appetite in Hispanic children. Am. J. Clin. Nutr. 2010, 91, 191–199. [Google Scholar] [CrossRef]
- Olza, J.; Rupérez, A.I.; Gil-Campos, M.; Leis, R.; Cañete, R.; Tojo, R.; Gil, Á.; Aguilera, C.M. Leptin receptor gene variant rs11804091 is associated with BMI and insulin resistance in Spanish female obese children: A case-control study. Int. J. Mol. Sci. 2017, 18, 1690. [Google Scholar] [CrossRef] [PubMed]
- Gallicchio, L.; Chang, H.H.; Christo, D.K.; Thuita, L.; Huang, H.Y.; Strickland, P.; Ruczinski, I.; Clipp, S.; Helzlsouer, K.J. Single nucleotide polymorphisms in obesity-related genes and all-cause and cause-specific mortality: A prospective cohort study. BMC Med. Genet. 2009, 10, 103. [Google Scholar] [CrossRef] [PubMed]
- Artac, M.; Altundag, K. Leptin and breast cancer: An overview. Med. Oncol. 2012, 29, 1510–1514. [Google Scholar] [CrossRef] [PubMed]
- Dasgupta, S.; Salman, M.; Siddalingaiah, L.B.; Lakshmi, G.L.; Xaviour, D.; Sreenath, J. Genetic variants in leptin: Determinants of obesity and leptin levels in south Indian population. Adipocyte 2015, 4, 135–140. [Google Scholar] [CrossRef] [PubMed]


Publisher’s Note: MDPI stays neutral with regard to jurisdictional claims in published maps and institutional affiliations. |
© 2022 by the authors. Licensee MDPI, Basel, Switzerland. This article is an open access article distributed under the terms and conditions of the Creative Commons Attribution (CC BY) license (https://creativecommons.org/licenses/by/4.0/).