Article

Comparative Transcriptome Analysis of Purple and Green Non-Heading Chinese Cabbage and Function Analyses of BcTT8 Gene

State Key Laboratory of Crop Genetics & Germplasm Enhancement, Key Laboratory of Biology and Genetic Improvement of Horticultural Crops (East China), Ministry of Agriculture and Rural Affairs of the P. R. China, Engineering Research Center of Germplasm Enhancement and Utilization of Horticultural Crops, Ministry of Education of the P. R. China, Nanjing Agricultural University, Nanjing 210095, China
*
Author to whom correspondence should be addressed.
Genes 2022, 13(6), 988; https://doi.org/10.3390/genes13060988
Submission received: 17 April 2022 / Revised: 15 May 2022 / Accepted: 23 May 2022 / Published: 31 May 2022
(This article belongs to the Section Plant Genetics and Genomics)

Abstract

:
Non-heading Chinese cabbage (Brassica campestris ssp. chinensis) is an important vegetative crop in the south of China. As an antioxidant, anthocyanin is the major quality trait for vegetables with purple leaves or petioles. However, the molecular biosynthetic mechanism of anthocyanin in non-heading Chinese cabbage has not been explained exclusively. In this study, two non-heading Chinese cabbage with contrasting colors in the leaves were used as the materials for RNA-seq. A total of 906 DEGs were detected, and we found that the anthocyanin and flavonoid biosynthetic pathways are significantly enriched in the purple NHCC. The transcriptome result was verified by RT-qPCR. Though bioinformatics analysis, BcTT8 was selected as the candidate gene for the regulation of anthocyanin synthesis, and the characterization of BcTT8 was elucidated by the functional analyses. The results proved that BcTT8 is a nucleus protein and phylogenetically close to the TT8 protein from Brassica. After silencing BcTT8, the total anthocyanin content of pTY-BcTT8 plants decreased by 42.5%, and the relative expression levels of anthocyanin pathway genes BcDFR, BcLODX and BcUF3GT-1 were significantly downregulated, while the transcription level of BcFLS was significantly upregulated. Compared with the wild type, the transgenic Arabidopsis showed obvious violet in the cotyledons part, and the anthocyanin biosynthetic genes such as AtDFR and AtLODX were significantly upregulated. In conclusion, BcTT8 is critical in the anthocyanin synthesis process of non-heading Chinese cabbage. Our findings illustrated the molecular mechanism of anthocyanin biosynthesis in non-heading Chinese cabbage.

1. Introduction

Anthocyanins are a type of water-soluble pigment that belongs to the flavonoid family, and they play a role in plant color, development, and reactions to their biotic and abiotic environments [1]. Except for these biological functions in the plant, they are also involved in human health, since they can be employed to prevent cardiovascular and neurological illnesses [2]. However, the biosynthesis of anthocyanins is also influenced by the abiotic stress, such as temperature, high light intensity, sucrose, UV irradiation, and drought [3,4,5,6,7].
In many plant species, the anthocyanin production pathway is conserved and well elucidated [8,9,10]. There are four steps for anthocyanin biosynthesis. The first key step is that chalcone synthase (CHS) catalyzes the production of naringenin chalcone from one molecule of 4-coumaroyl CoA and three molecules of malonyl CoA. Then, the production of naringenin, dihydrokaempferol, dihydroquercetin, or dihydromyricetin is catalyzed by the chalcone isomerase (CHI), flavanone 3-hydroxylase (F3H), flavonoid 3′-hydroxylase (F3′H) and flavonoid 3′5′-hydroxylase (F3′5′H), respectively. Subsequently, dihydroflavonol-4-reductase (DFR) catalyzes the reaction to form colorless leucoanthocyanins, which are used for leucoanthocyanidin dioxygenase/anthocyanidin synthase (LODX/ANS) to produce colored anthocyanidins. Finally, the UDP-glucose flavonoid-3-O-glucosyltransferase (UF3GT) modifies the colored anthocyanidins to form stable anthocyanins [11].
Anthocyanin biosynthesis-related transcription factors are composed of three major types: MYB, basic helix–loop–helix (bHLH), and WD40 repeat (WDR) transcription factors [12]. The MYB family protein can be classified into four groups depending on the number of adjacent repeats: R3, R2R3, R1R2R3, 4R MYB types [12,13]. The R2R3-MYB is the largest subgroup of the MYB family involved in the flavonoid pathway. The R2R3-MYB transcription factors have an n terminal DNA-binding domain (the MYB domain) and an activation or repression domain usually located at the C terminus [14]. The R2R3-MYB genes PAP1/MYB75, PAP2/MYB90, MYB113 and MYB114 positively regulate anthocyanin synthesis [14]. In addition, bHLHs are also involved in regulating anthocyanin biosynthesis. The subgroup Ⅲf bHLH transcription factor had been reported to mediate the anthocyanin synthesis. In Arabidopsis, bHLH transcription factors TT8, EGL3, and GL3 are responsible for anthocyanin biosynthesis [15]. The bHLH proteins influence anthocyanin synthesis by directly activating the anthocyanin pathway genes or forming the MBW complex to mediate the structural genes. It was reported that DcTT8 could regulate anthocyanin in Dendrobium candidum through inducing the expression of DcF3′H and DcUFGT [16], and the same activation pattern was also observed in other higher plants such as Nelumbo nucifera and tree peony (Paeonia suffruticosa) [17,18]. What is more, in Arabidopsis, MBW complexes could directly target AtDFR and AtLODX to regulate their transcriptional activity and in Medicago truncatula MtTT8 together with MtWD40-1, they could directly target activated promoters of MtANS to regulate anthocyanin synthesis [19,20]. In addition, in radish, RsTT8 activates the RsCHS and RsDFR promoters when co-expressed with RsMYB1 [21].
Non-heading Chinese cabbage (NHCC), which belongs to the Brassica family, has a great economic value in agricultural production [22]. The main secondary metabolites of non-heading Chinese cabbage includes flavonols, flavones, and anthocyanin [23]. The purple Brassica crops receive increased attention from the public for high levels of anthocyanin accumulation in mature leaves [24]. In the Brassica crop, the heterologous over-expression of BrTT8 cloned from ‘Zi He’ (Brassica rapa var. chinensis) increased the anthocyanin content and upregulated the expression level of CHS2, F3H, and UFGT genes in regeneration tomato shoots [25]. Additionally, RNA-seq revealed in purple Pak-Choi (Brassica Campestris L. ssp. chinensis L. Makino) that the transcript levels of several structural genes related to anthocyanin synthesis were significantly upregulated [26]. Although there are some studies about the molecular regulation of anthocyanin in Brassica [27], the molecular regulatory mechanisms of non-heading Chinese cabbage have not been elucidated exclusively.

2. Materials and Methods

2.1. Plant Materials

The experimental materials were planted and located on the 15th September of 2020 in Jiangsu Agricultural Expo Park (119°01′ N, 31°09′ E). After growing for two months, we collected the leaves of purple NHCC ‘HP072′ and green NHCC ‘HG072′ to perform the experiment. Three biological replicates were quickly put in the liquid nitrogen and then sequenced by the company Biomarker (Beijing, China).

2.2. Determination of Total Anthocyanin Content

The total anthocyanin content was detected by the pH differential method [28]. First of all, 100 mg of fresh leaves were dipped in 3.4 mL methanol (40% acetic acid) and sonicated for 30 min; then, they were centrifuged for 10 min at 3000 rpm. All supernatants were filtered with a 0.45 μm filter. The filtrate was diluted 20 times, taken in two 1 mL samples, and reacted with 4 mL KCl (pH 1) and 4 mL NaAc (pH 4.5), respectively. After incubation for 30 min at room temperature, we measured the absorbance at 510 nm and 700 nm in an Enzyme Linked Immunosorbent Assay (ELISA) and calculated the total anthocyanin content.

2.3. Transcriptome Analysis of Green and Purple NHCC

An mRNA isolation kit was utilized to isolate the total mRNA from the leaves (Aidlab, Beijing, China). The quality of mRNA concentration was measured using a NanoDrop 2000 (Thermo Fisher Scientific, Wilmington, DE, USA). The NEBNext UltraTM RNA Library Prep Kit for Illumina was used (NEB, Ipswich, MA, USA) to generate the sequencing libraries. The Illumina HiSeq2500 platform (San Diego, CA, USA) at Biomarker (Beijing, China) was applied to sequence the libraries. The FPKM (fragments per kilobase of transcript per million fragments mapped) method was applied to calculate the gene expression levels. The NHCC001 genome was used as the reference genome [29].

2.4. Gene Function Annotation and Differential Expressed Gene Identification

In this study, we exploited the six common databases to access the gene function annotation: Nr (NCBI non-redundant protein sequences, RefSeq non-redundant proteins (nih.gov)); Nt (NCBI non-redundant nucleotide sequences); Pfam (http://pfam.xfam.org/ (accessed on 25 January 2020)); KOG/COG (http://www.ncbi.nlm.nih.gov/COG/ (accessed on 1 February 2020)); Swiss-Prot (http://www.expasy.ch/sprot (accessed on 7 February 2020)), KO (http://www.genome.jp/kegg/ (accessed on 12 February 2020)); GO (Gene Ontology, http://www.geneontology.org/ (accessed on 13 February 2020)). We took use of the DESeq2 to analyze the differential expression genes of two groups [30]. We used Benjamini and Hochberg’s approach for controlling the false discovery rate (FDR) (p < 0.05). The differentially expressed genes (DEGs) were selected on the basis of having at least a two-fold difference in expression between the HG072 and HP072 (p < 0.05). GO analysis of the DEGs was carried out using the topGO package (p < 0.05).

2.5. Expression of Anthocyanin-Related Pathway Genes in Green and Purple NHCC

To verify the results of transcriptome analysis, RT-qPCR was carried out for anthocyanin pathway genes. The reverse transcription of mRNA was used the Evo M-MLV RT Kit II (Accurate Biotechnology, Hunan, China) as directed by the protocols. RT-qPCR was carried out on the ABI StepOne (Applied Biosystems, Waltham, MA, USA) with Hieff® qPCR SYBR Green Master Mix (Yeasen, Shanghai, China) in triplicate. Data were normalized with BcACTIN gene of NHCC, and the 2−ΔΔCT method was employed for analysis [31]. The gene-specific primer sequences are listed in Supplementary Table S1.

2.6. Sequence Analysis of BcTT8

The coding sequence of BcTT8 gene from the transcriptome result was blasted in the NHCC database (http://nhccbase.njau.edu.cn/website/ (accessed on 1 June 2020)). We identified the coding sequence of BcTT8 through ORF Finder (https://www.ncbi.nlm.nih.gov/orffinder/ (accessed on 3 June 2020)) The structure analysis of BcTT8 protein was identified through the online website NCBI-CDD (https://www.ncbi.nlm.nih.gov/Structure/cdd/wrpsb.cgi (accessed on 5 June 2020)). Homologous sequences of other species were found by NCBI-BLAST (https://blast.ncbi.nlm.nih.gov/Blast.cgi (accessed on 5 June 2020)). The sequences alignments were carried out by DNAMAN 9.

2.7. Subcellular Localization Assays and Analysis of Phylogenetic Tree

We amplified the coding sequence of BcTT8 using the gene-specific primers (Supplementary Table S1) and then cloned it into the PRI101 vector with a CaMV35S promoter. The construct was transformed into A. tumefaciens strain GV3101, and we resuspended the overnight cultures of A. tumefaciens strains with infiltration buffer (10 mM MgCl2, 10 mM MES, and 0.1 mM acetosyringone) to OD600 at 0.8 and incubated them at room temperature for 4 h. The suspension was infiltrated into Nicotiana. benthamiana leaves. The injected plants were grown under the appropriate growth condition for about 60 h; next, the leaf samples were observed using the Laser Scanning Confocal Microscope (Zeiss LSM780); 35S:GFP alone served as the control. A neighbor-joining phylogenetic tree was constructed with MEGA X (1000 bootstrap replicates).

2.8. Silencing of BcTT8 through VIGS System

To silence of BcTT8, we designed a self-hybridizing palindromic oligonucleotide of 80 nt (Supplementary Table S1) following the protocol [32]. The primers p-TYMV-F and p-TYMV-R were used to identify the pTY-BcTT8 plasmid with the expected size (1566 nt). The total of 50μg purified pTY-BcTT8 plasmid was diluted with 50μL ddH2O; then, we mixed the plasmid with 0.1 M spermidine, 10 μL gold power and 0.1 M CaCl2 in the 2 mL tubes on ice for 20 min. The mixture was centrifuged at 12,000 rpm for 15 s, and it was washed 4 times using the ethanol (100%). For infecting, we utilized the particle bombardment, and the empty VIGS vector (pTY-S) plasmid was inoculated as a control.

2.9. Overexpression of BcTT8 in Arabidopsis

The coding sequence of BcTT8 was cloned into vector PRI101-GFP; BcTT8-GFP plasmid was transformed into Agrobacterium tumefaciens strain GV3101 and cultured in LB liquid medium with antibiotics (50 mg·L−1 kanamycin and 50 mg·L−1 rifampicin). We conducted this experiment by the floral dip method [33]. Overnight cultures of A. tumefaciens strains were resuspended and diluted using the 5% sucrose solution buffer (pH 5.8) containing 0.01–0.05% (vol/vol) Silwet L-77 to OD600 ≈0.8. Then, we dipped the Arabidopsis inflorescences for 60 s until the resuspended Agrobacterium cells carrying the BcTT8 gene were transferred. To obtain the transformants, the treated plants were selected with the solid medium with 50 mg·L−1 kanamycin and 160 mg·L−1 timentin.

2.10. Statistical Analysis

We analyzed the data through Microsoft Excel 2021 and the statistical significance of the differences between the two cultivars was determined with by an unpaired t-test with SPSS 22.0. Significant differences (p < 0.05) were indicated with different letters.

3. Results

3.1. Samples Expression Pattern and Differentially Expressed Genes Clustering

In our study, we measured the total anthocyanin content in the two non-heading Chinese cabbage varieties; the total anthocyanin content of purple NHCC is 3.5 folds higher than the green one, which is 7.57 mg·100 g−1 and 2.26 mg·100 g−1, respectively (Figure S1). Based on the anthocyanin difference between the two cultivars, we performed comparative transcriptome analysis. The sequencing results contained a total of 906 DEGs, of which 520 DEGs showed upregulation and 386 DEGs showed downregulation (Figure 1 and Supplementary Table S2) Among these, we annotated 11 classes of transcription factor family protein, and the bHLH family was comprised four genes, of which only BcTT8 was upregulated (Table 1 and Supplementary Table S3).

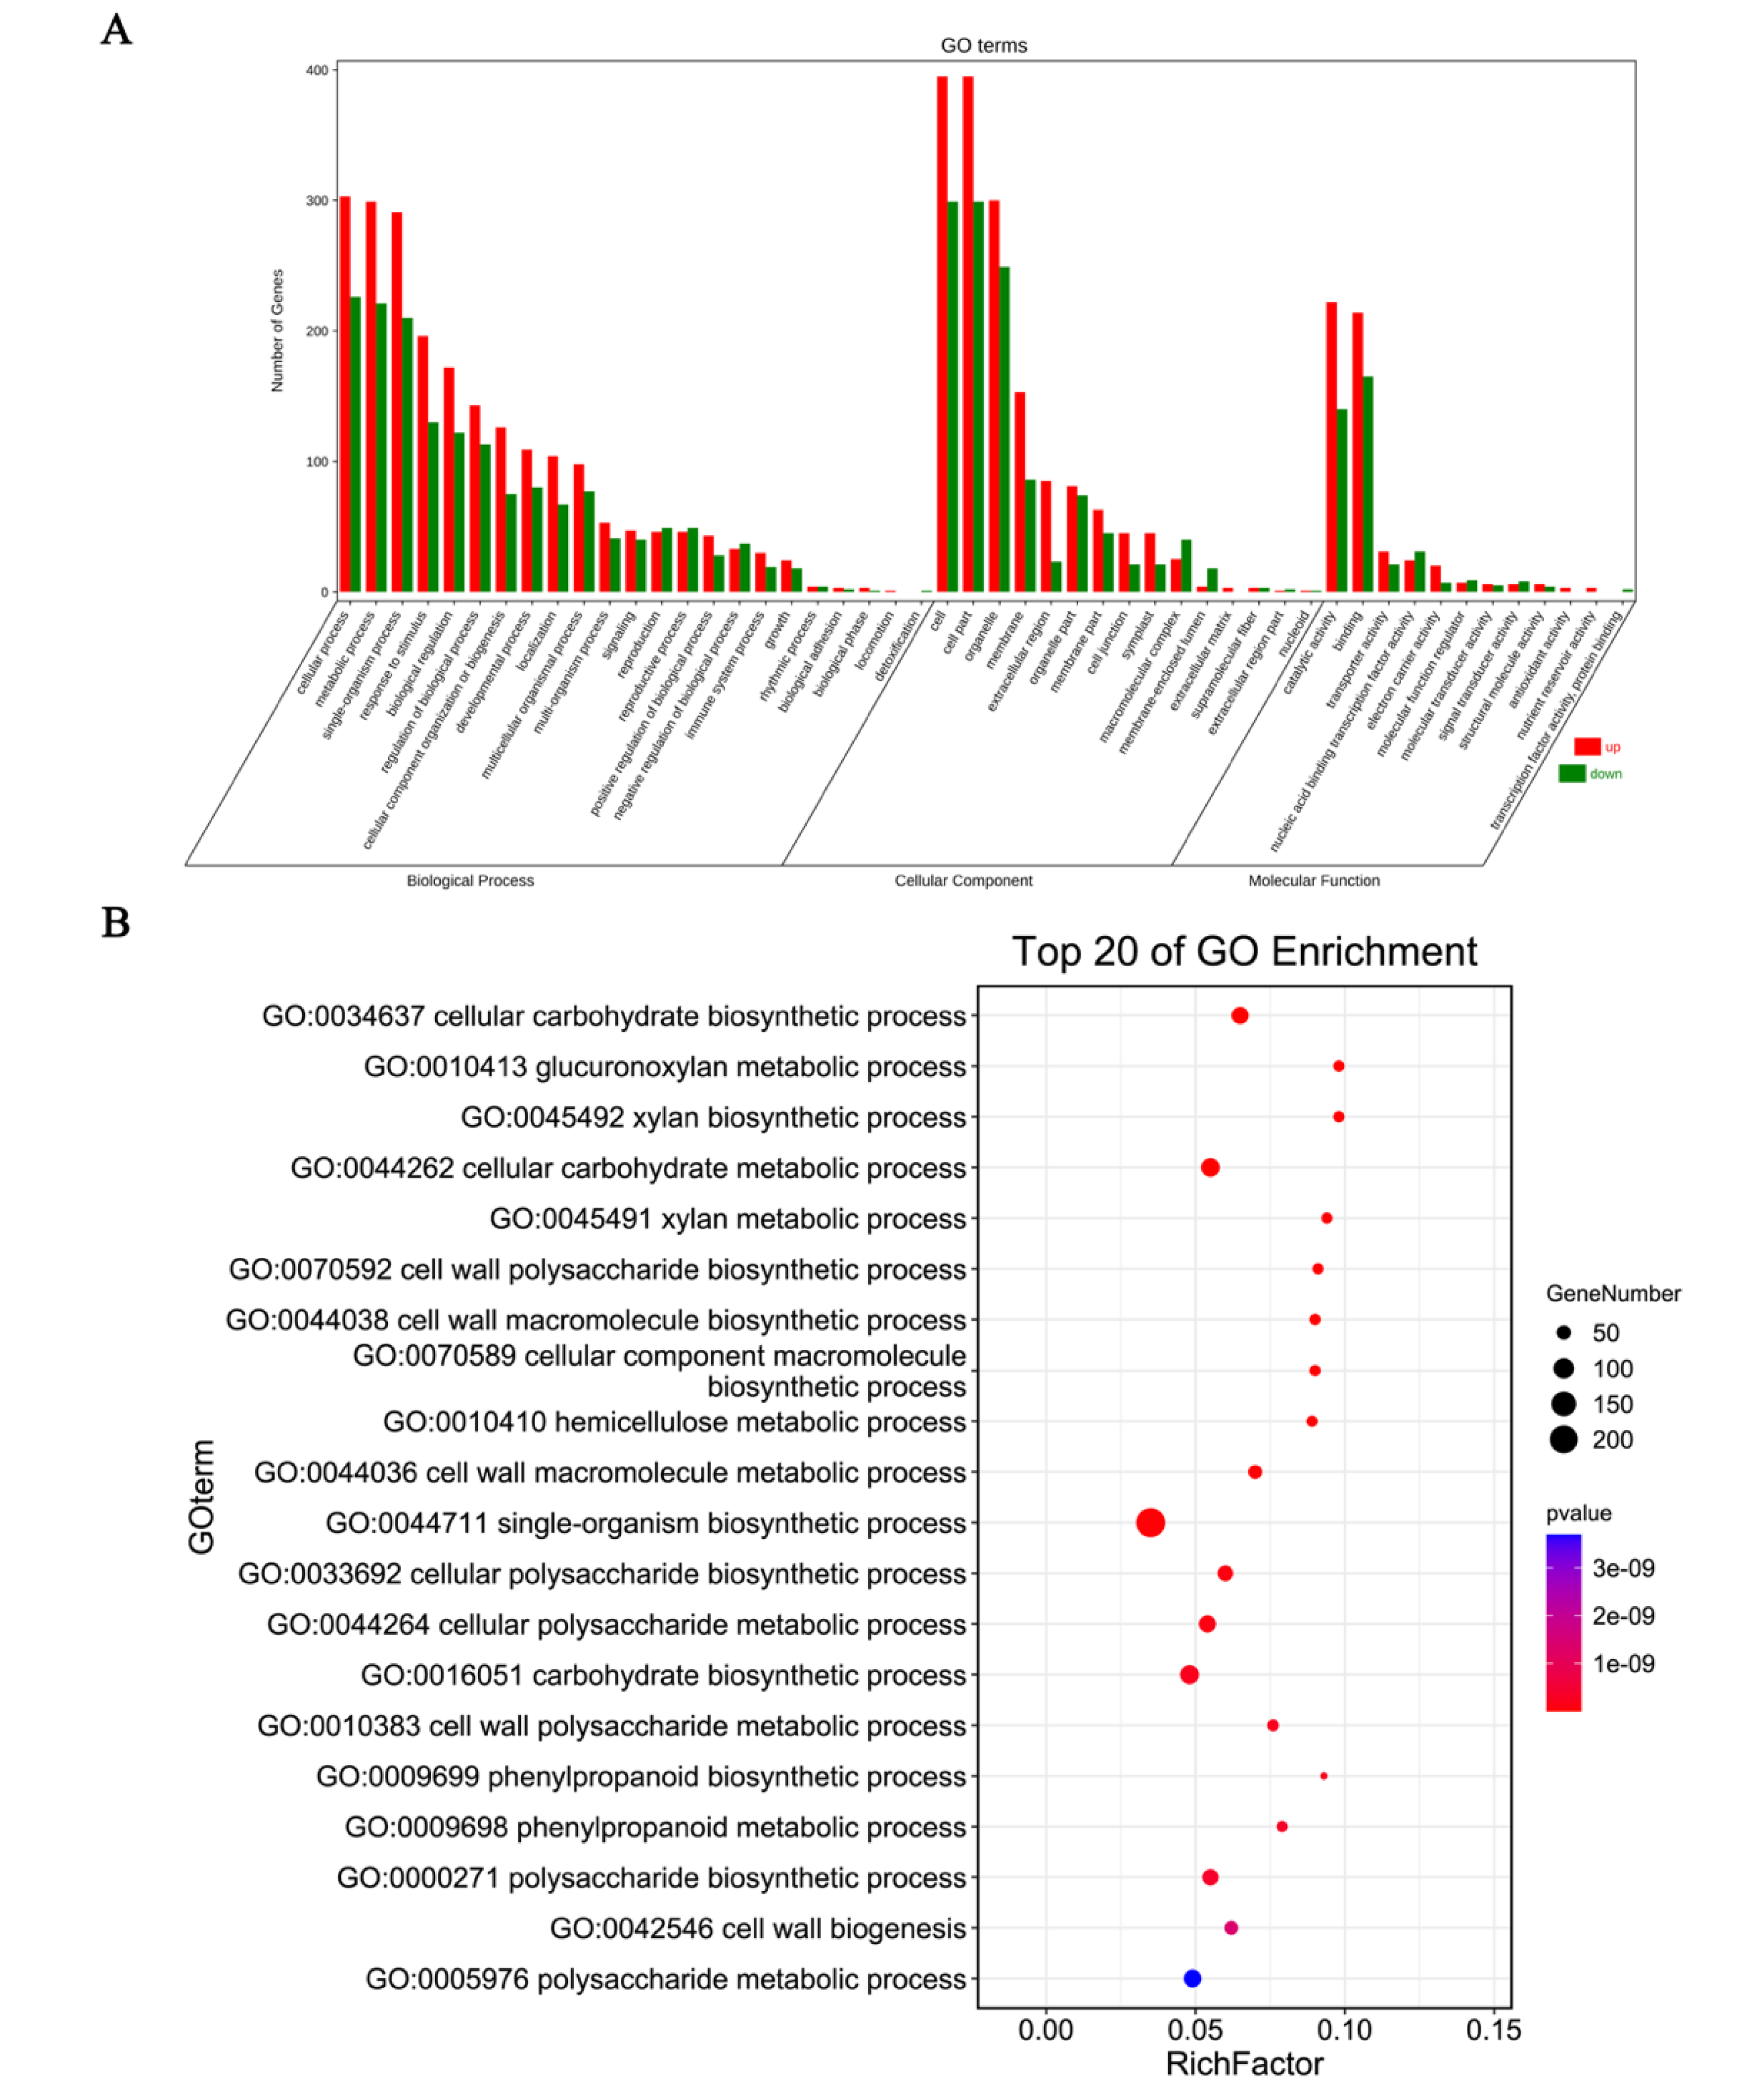
3.2. Differentially Expressed Genes GO Enrichment

In our result, the DEGs genes were enriched in the GO terms and further classified into three categories: the cell component category, biological process as well as molecular function process (Figure 2A and Supplementary Table S4). A total of 377 upregulated and 271 downregulated unigenes were annotated to GO terms in the biological process, of which most of the DEGs were mainly linked to the metabolic process, cellular process and single-organism process (Supplementary Table S5). A total of 754 DEGs were annotated into the cell component category, including 441 upregulated and 313 downregulated genes. For the category of cell component, most of the upregulated and downregulated unigenes were further classified into cell, cell part, and organelle terms (Supplementary Table S6). In the molecular function process, a total of 581 DEGs were enriched into this classification, and most of them were mainly related to the catalytic activity and binding terms (Supplementary Table S7).
For the GO functional enrichment, the top 20 GO functional process was annotated (Figure 2B). The ‘anthocyanin-containing compound biosynthetic’ process (GO:0009718) was not in the top20 GO biological terms, while it was also significantly enriched (2.71 × 10⁻⁶, p < 0.05) (Supplementary Table S8). A total of 15 DEGs involved in the ‘anthocyanin-containing compound biosynthetic’ process and the upregulated DEGs were comprised of the anthocyanin accumulation genes BcCHI-1, BcCHI-2, BcDFR, BcLODX, BcUF3GT-1, BcUF3GT-2, BcUF75C1, BcTT19-1, BcTT19-2, Bc5MAT and transcription factors BcTT8, BcMYBL2-1, and BcMYBL2-2 (Table 2).

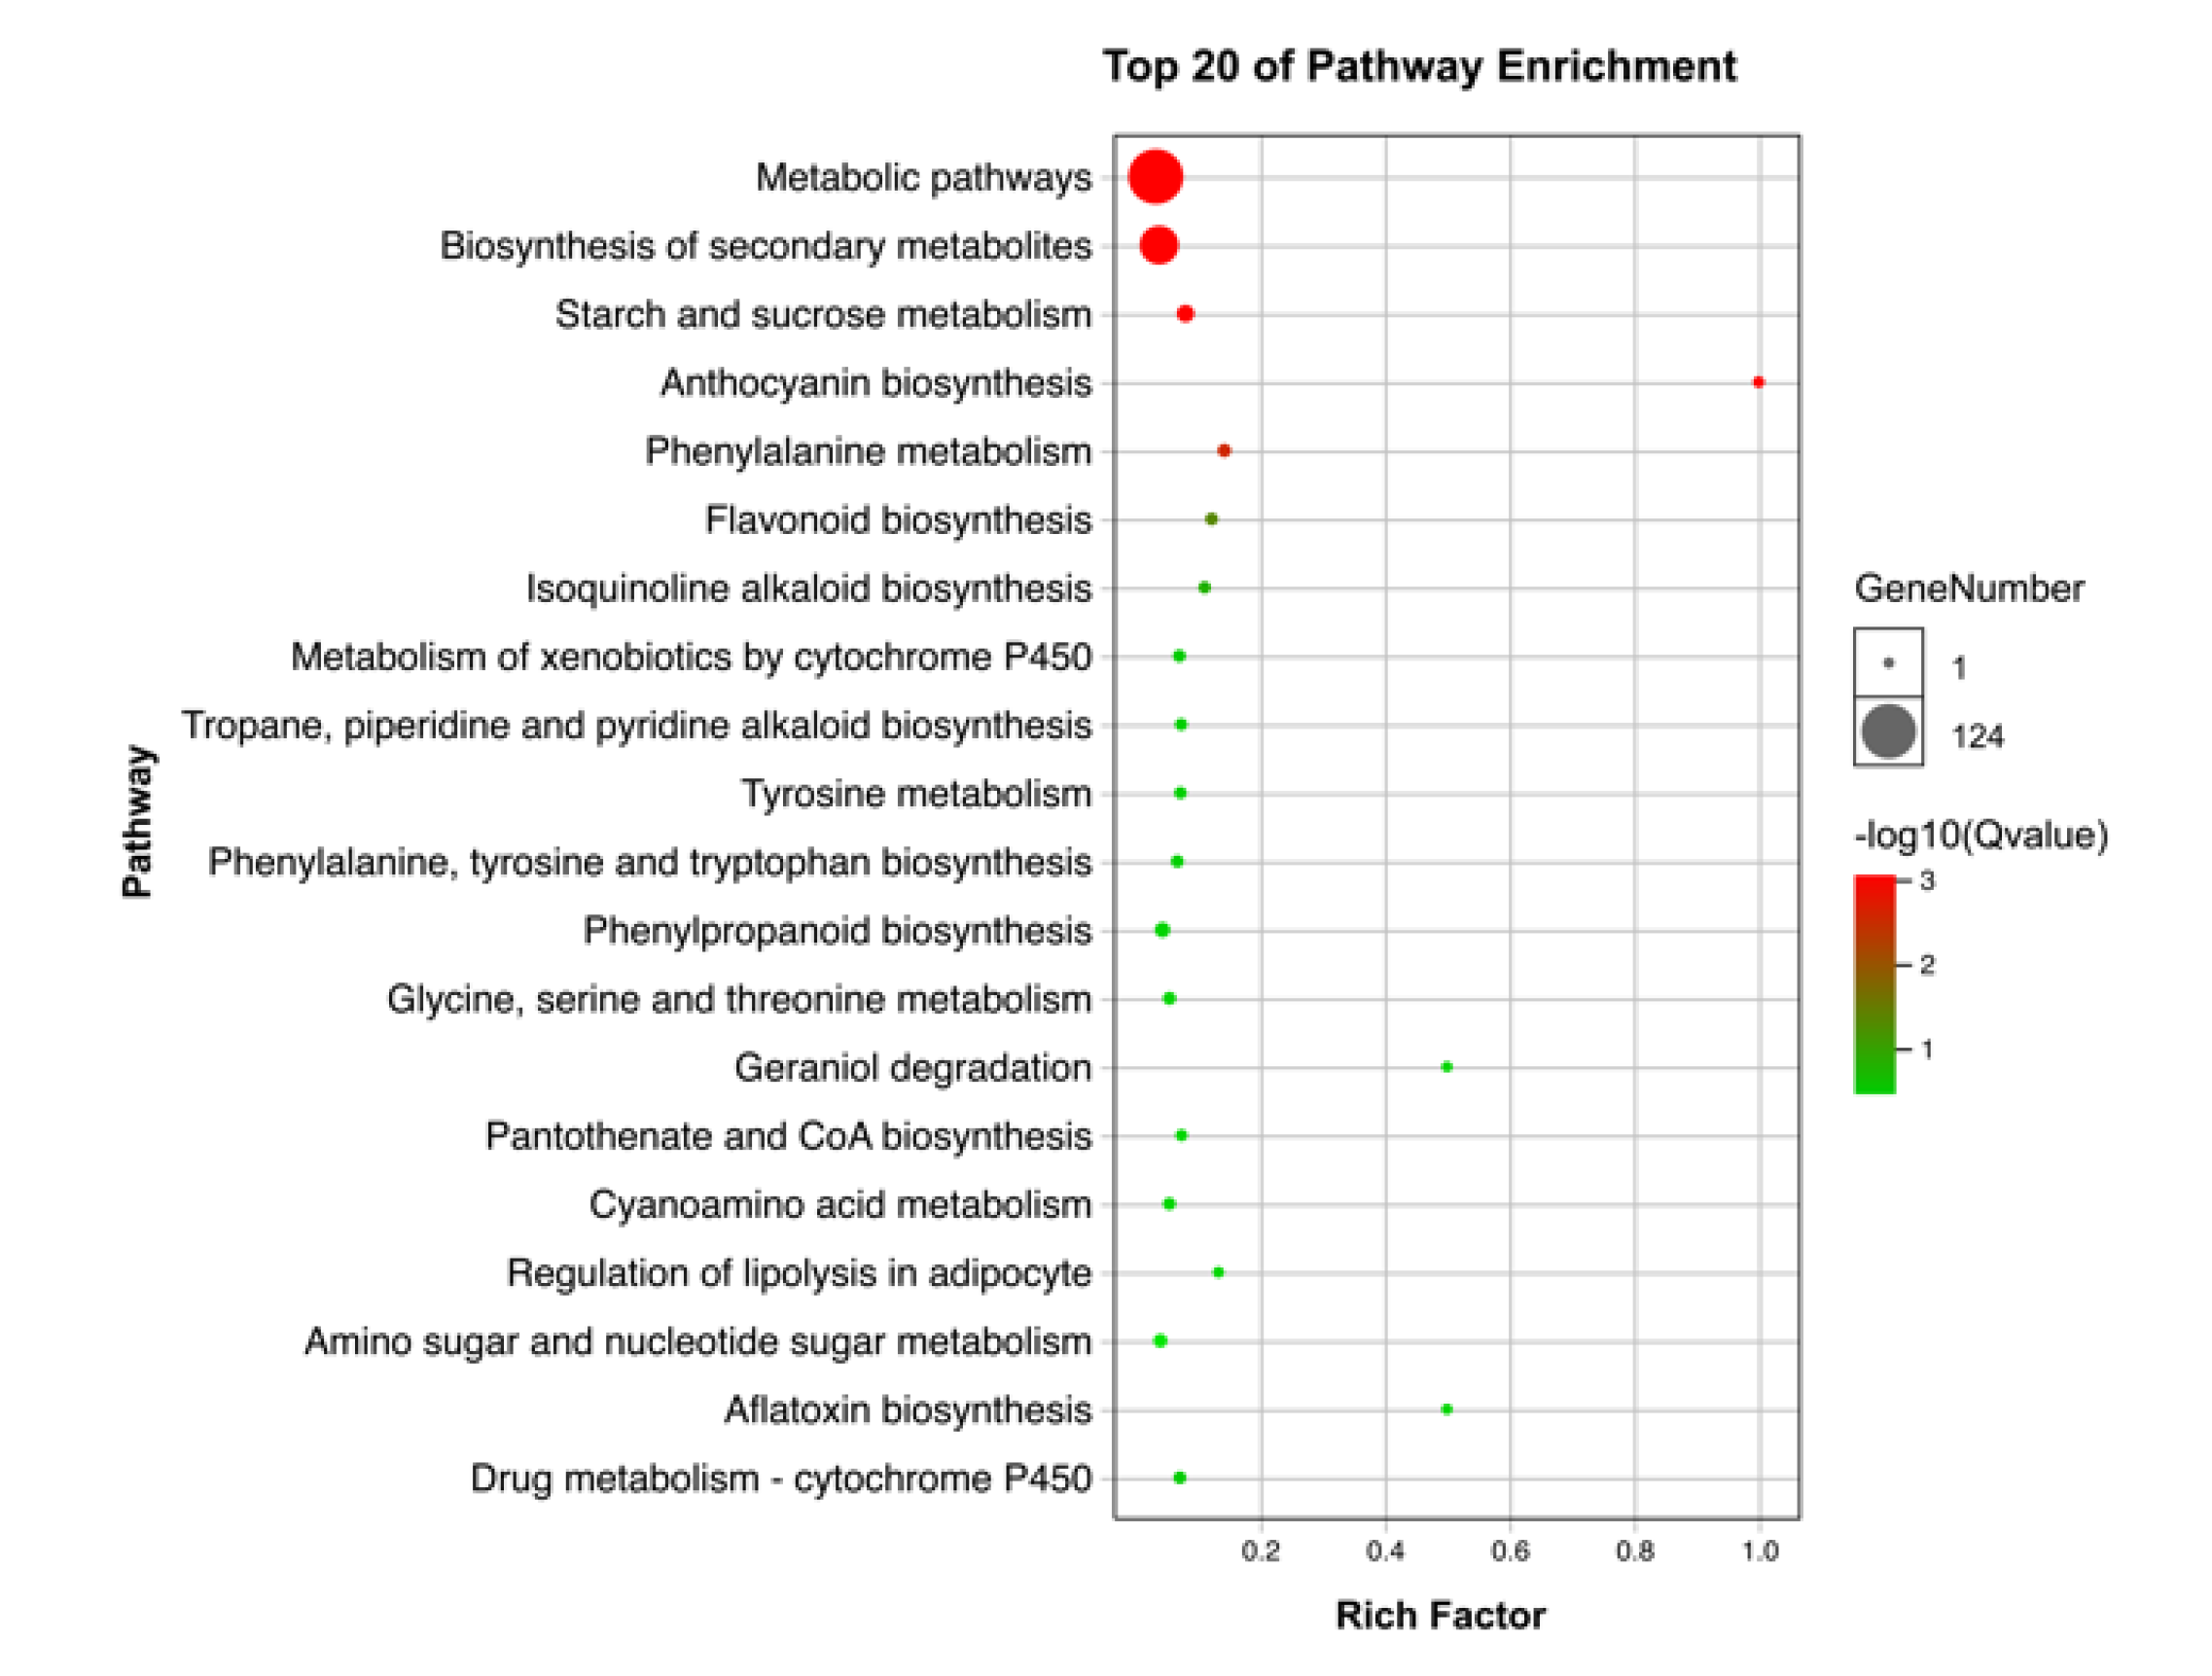
3.3. Differentially Expressed Genes KEGG Enrichment

We performed the KEGG pathway enrichment to annotate the key genes of the anthocyanin biosynthesis pathway, and a total of 245 unigenes were identified (Supplementary Table S9). The 20 most KEGG pathways are shown (Figure 3). In the anthocyanin biosynthetic pathway (ko00942), BcUF3GT-1, BcUF3GT-2, and BcUF75C1 were detected, which could encode the UDP-glucose flavonoid-3-O-glucosyltransferase transferase protein (Table 3). Six DEGs were enriched in the flavonoid biosynthetic pathway (ko00941), including BcCHI-1, BcCHI-2, BcDFR, BcLODX, BcFLS, and BcC4H (Table 3). There were no BcCHS, BcF3H and BcF3′H in the list, but several structural genes BcCHI-1, BcCHI-2, BcDFR, BcLODX, BcUF3GT-1, BcUF3GT-2, and BcUF75C1 were involved in the anthocyanin biosynthesis pathway, showing the upregulation.

3.4. Verification of Transcriptome Result by RT-qPCR

In order to verify the results, several genes related to anthocyanin biosynthesis were selected and measured by RT-qPCR (Figure 4). The result indicated that the transcript expression levels of BcDFR (BraC09g018850), BcLODX (BraC03g052160) and BcUF3GT-1 (BraC06g022480) in HP072 were remarkably more upregulated than those in HG072. Similarly, the relative expression levels of transcription factors BcTT8 (BraC09g027820) and BcMYBL2-1 (BraC07g035800) were also significantly higher in HP072 than in HG072. However, the expression levels of the early anthocyanin biosynthesis genes (EBGs) BcCHS2 (BraC10g026540), BcF3H (BraC02g029180) and BcF3′H (BraC08g015770) showed no difference between these two samples (Table 4). The relative expression levels of these genes were consistent with the transcriptome analysis result.

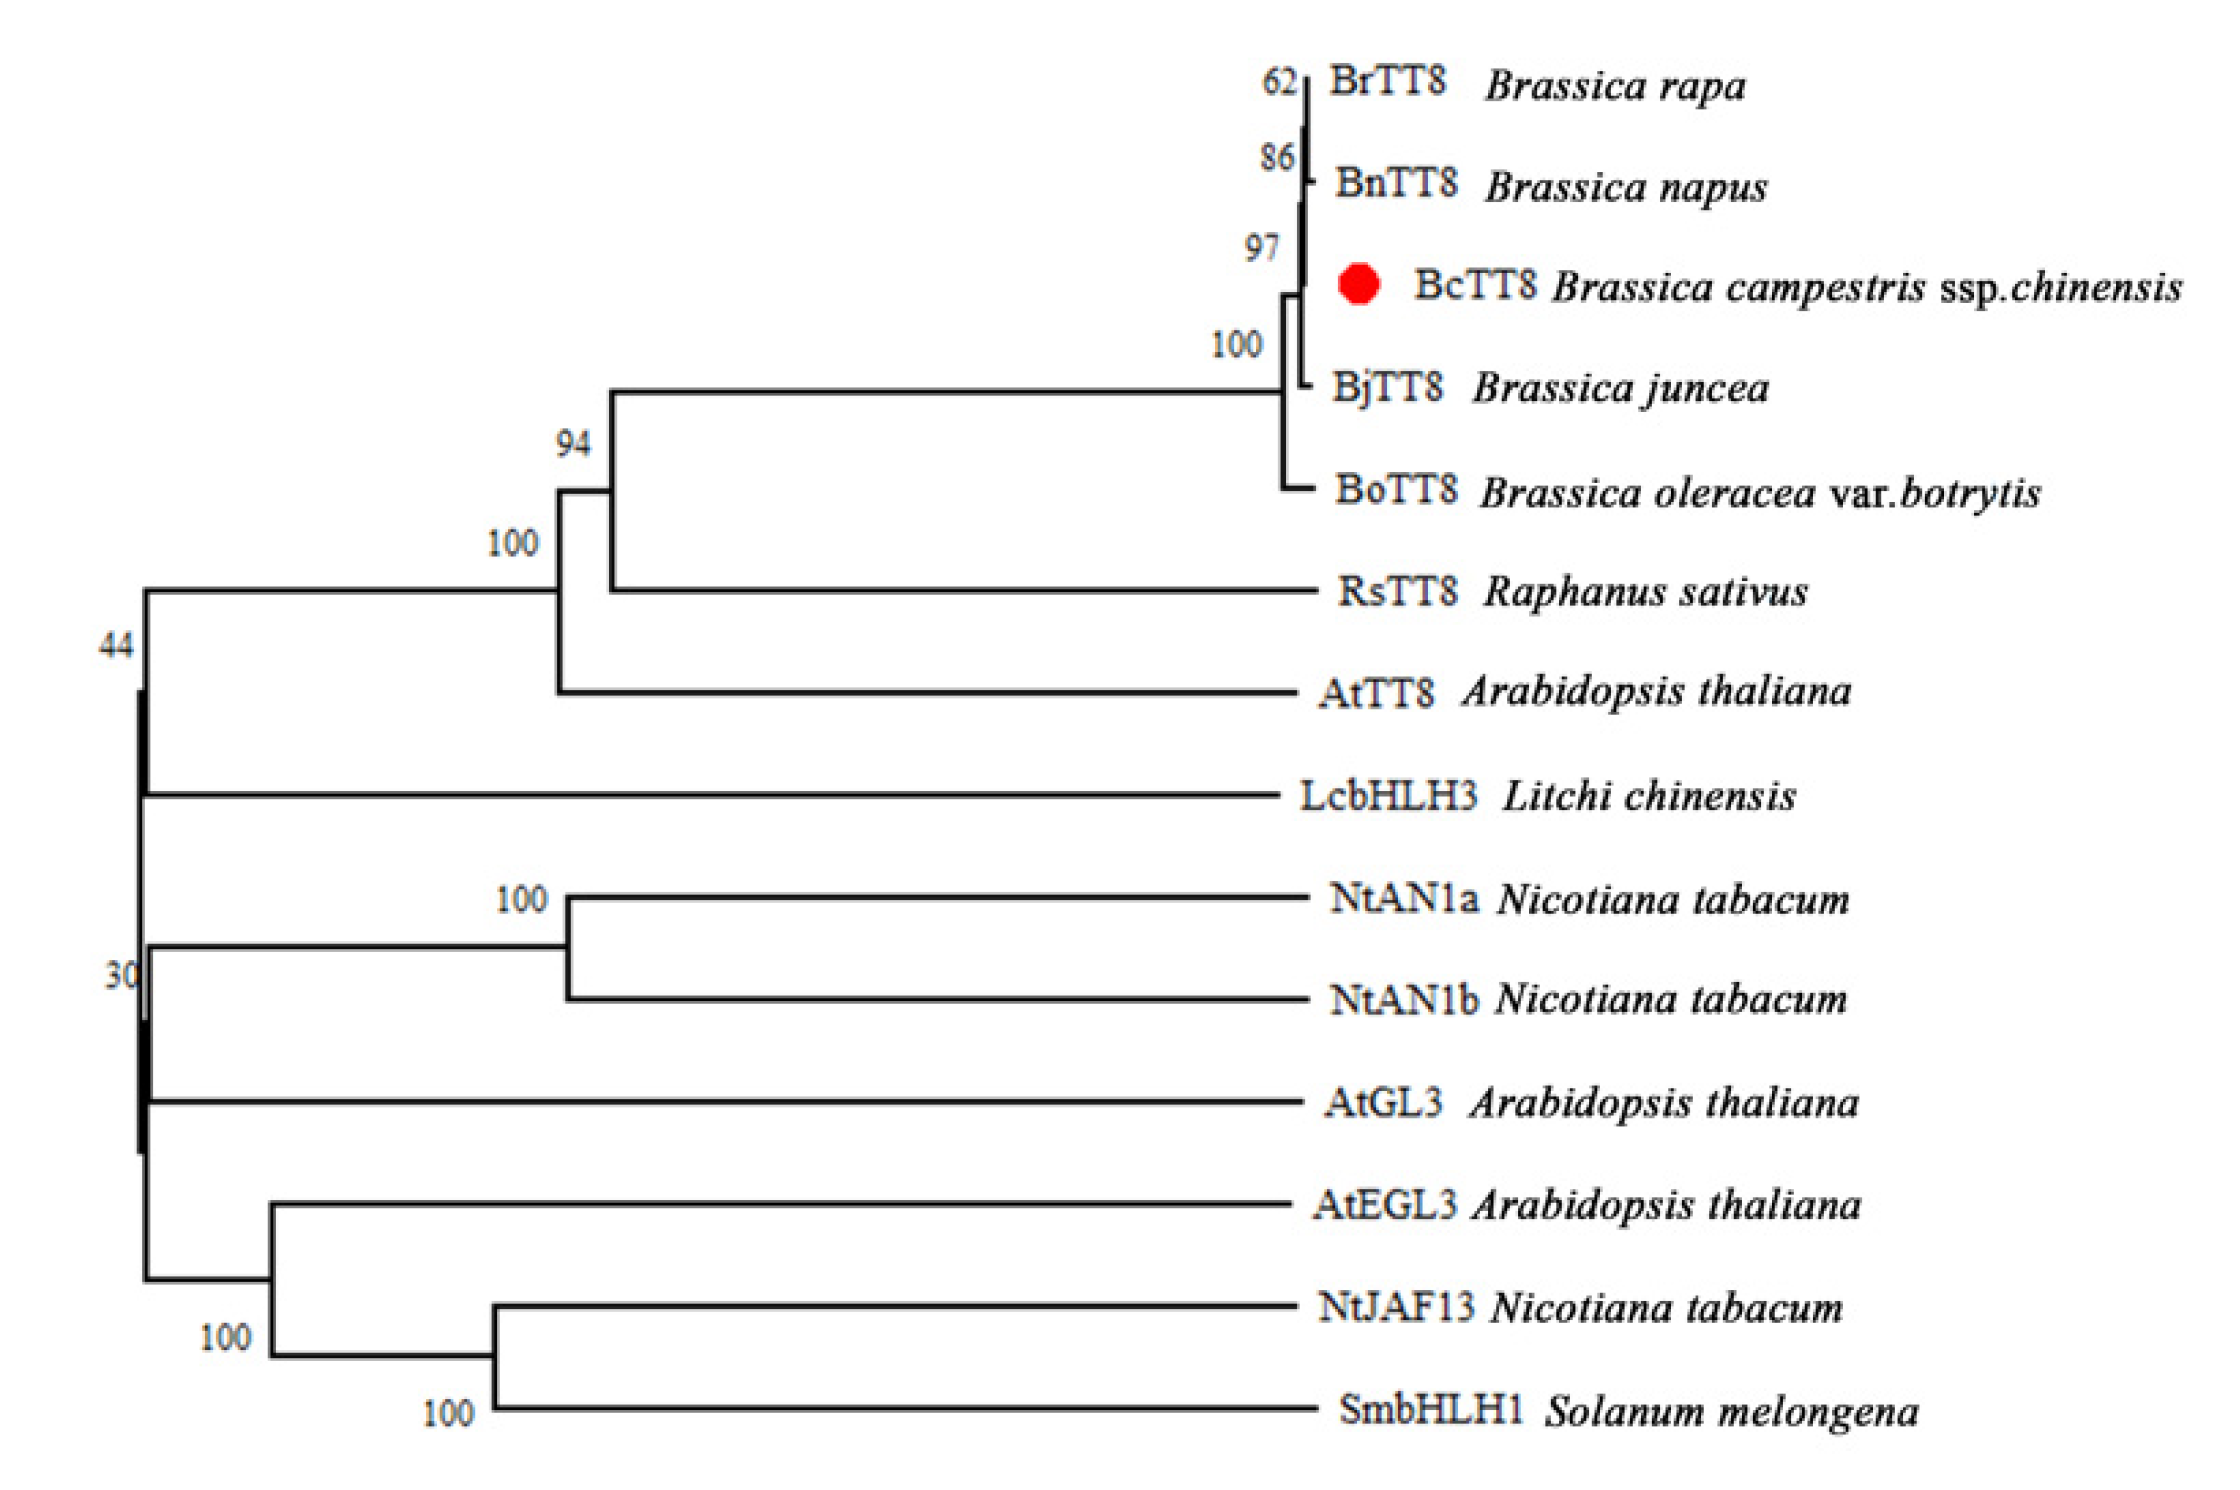
3.5. Characterization and Phylogenetic Analysis of BcTT8

The BcTT8 homologous clone result showed that it encodes a 1566 bp nucleotide sequence and the ORF encodes a full function protein with 521 amino acids. Structure analysis results demonstrated that BcTT8 belongs to the bHLH family, which contains the conserved bHLH-MYC-N and the bHLH superfamily domains (Figure S2). Multiple sequences analysis for BcTT8 and other homologous proteins (Figure S3). A phylogenetic tree was performed to analyze the homologous relationship between BcTT8 and similar bHLH proteins in other species. The result showed that BcTT8 had the closest phylogeny with BoTT8 (Brassica oleracea var. botrytis) (Figure 5).

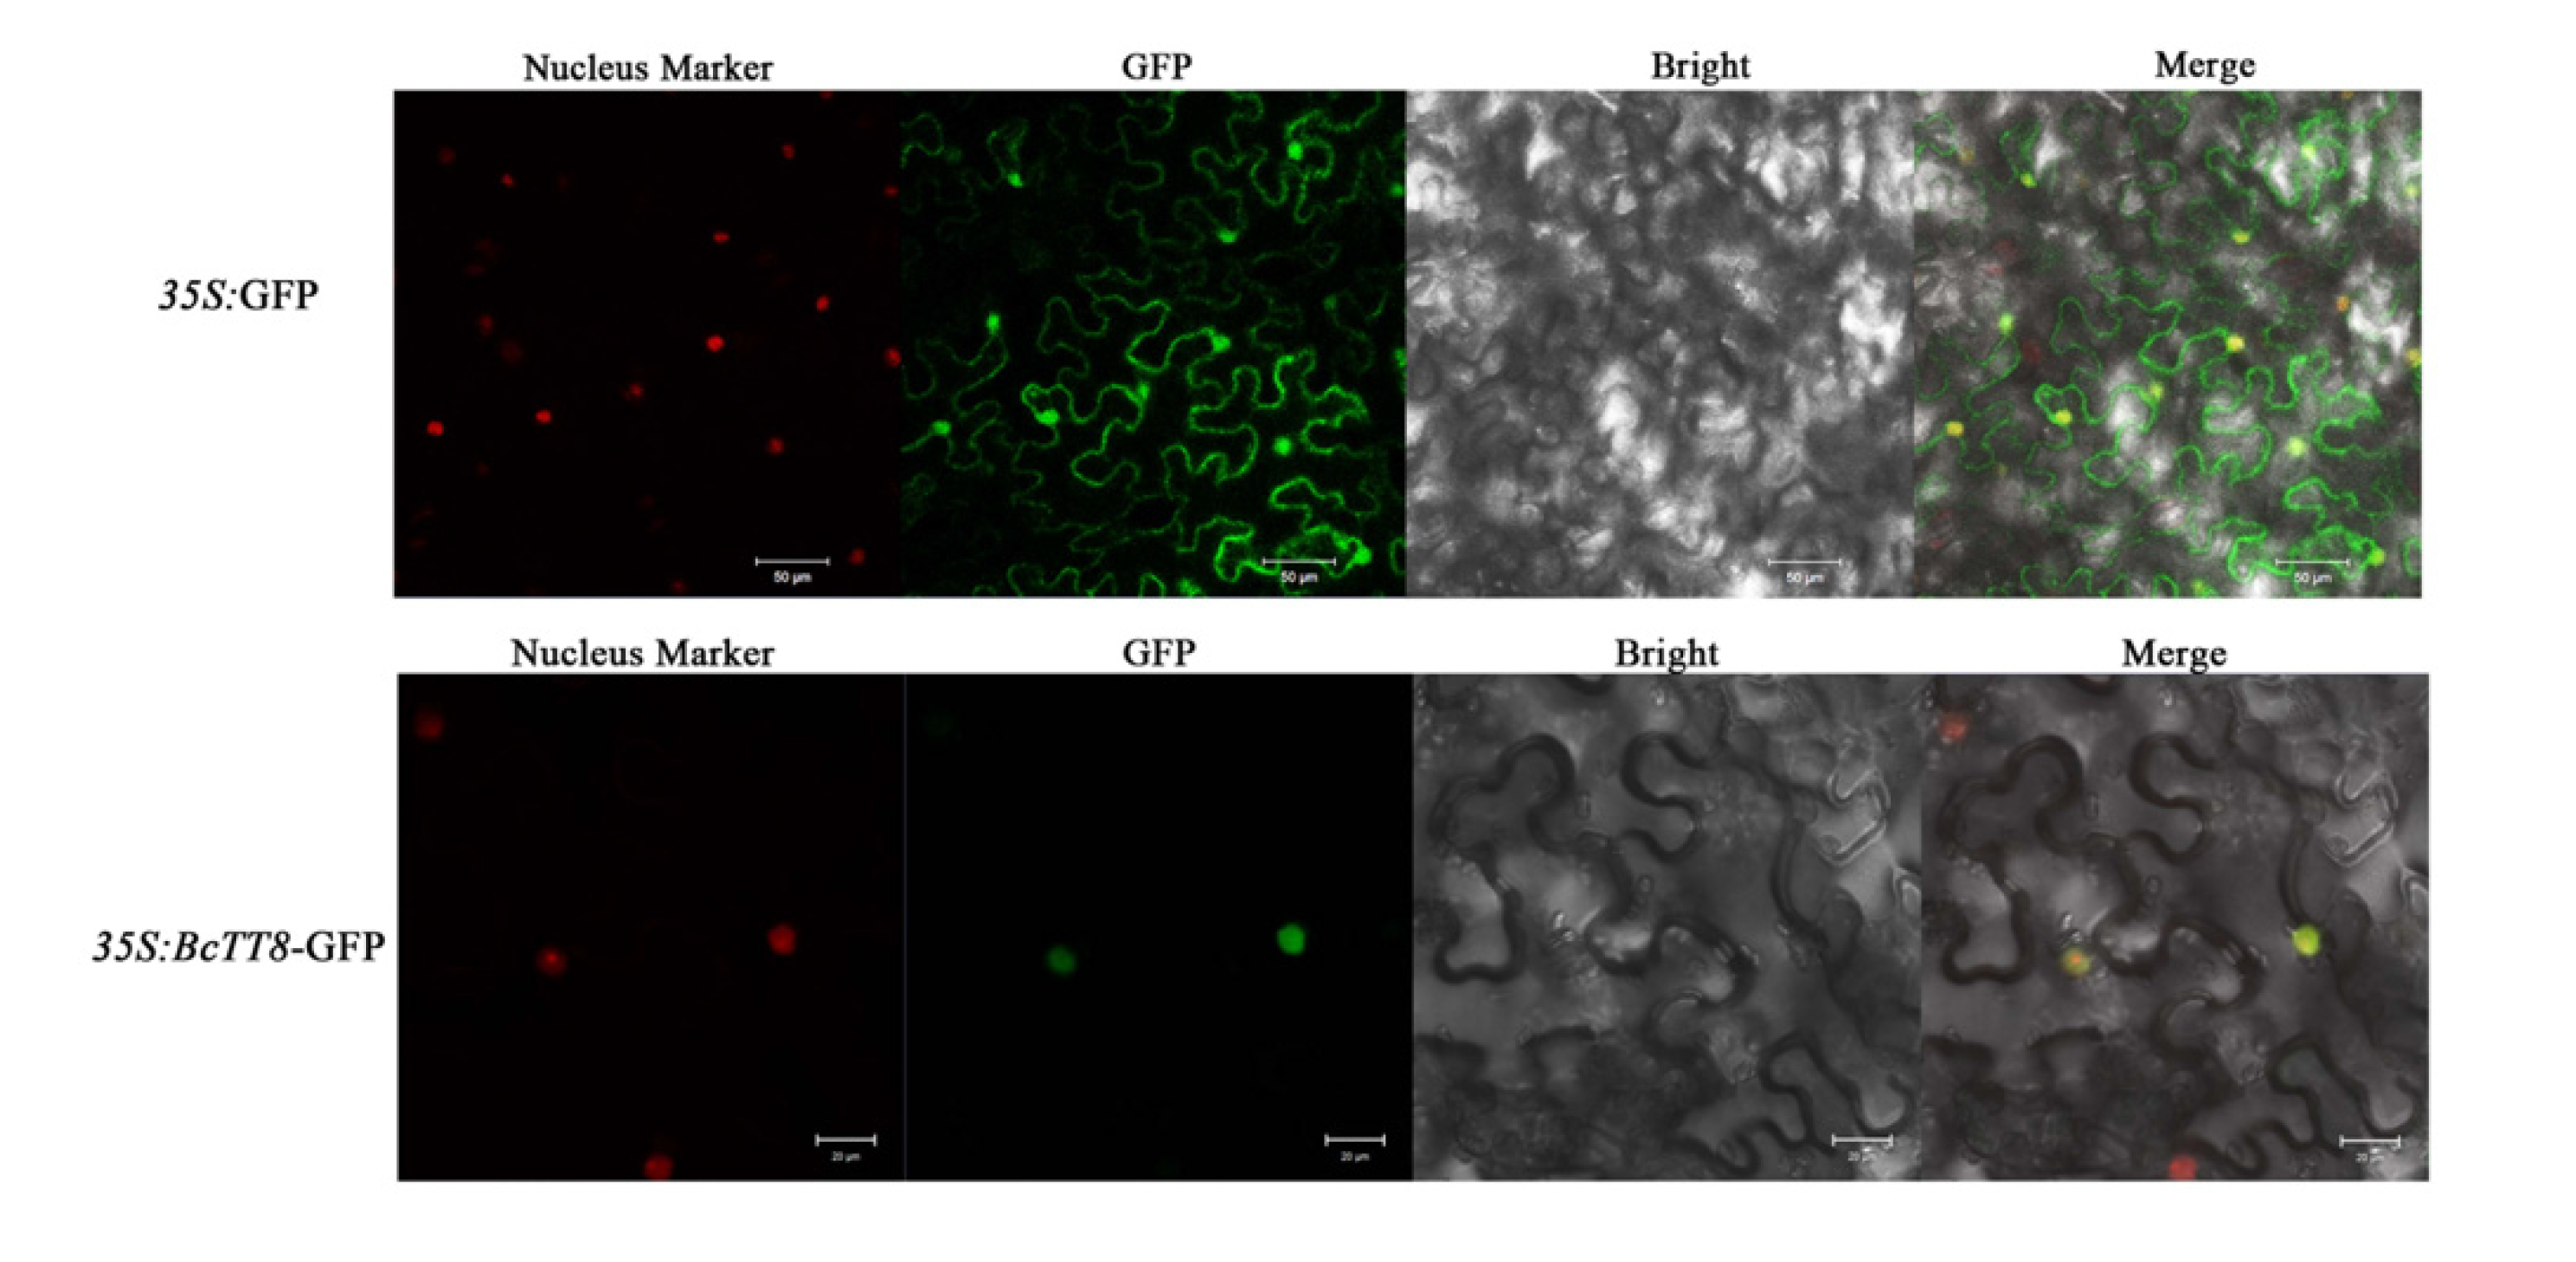
3.6. Subcellular Localization of BcTT8

We constructed a 35S:BcTT8-GFP fusion vector to analyze the subcellular localization of BcTT8 protein. The suspension was infiltrated into N. benthamiana leaves. In the cell nucleus, we observed the BcTT8-GFP fusion protein while the empty vector GFP protein was observed in both the nucleus and the cytoplasm, which indicated the BcTT8 functions in the cell nucleus (Figure 6).

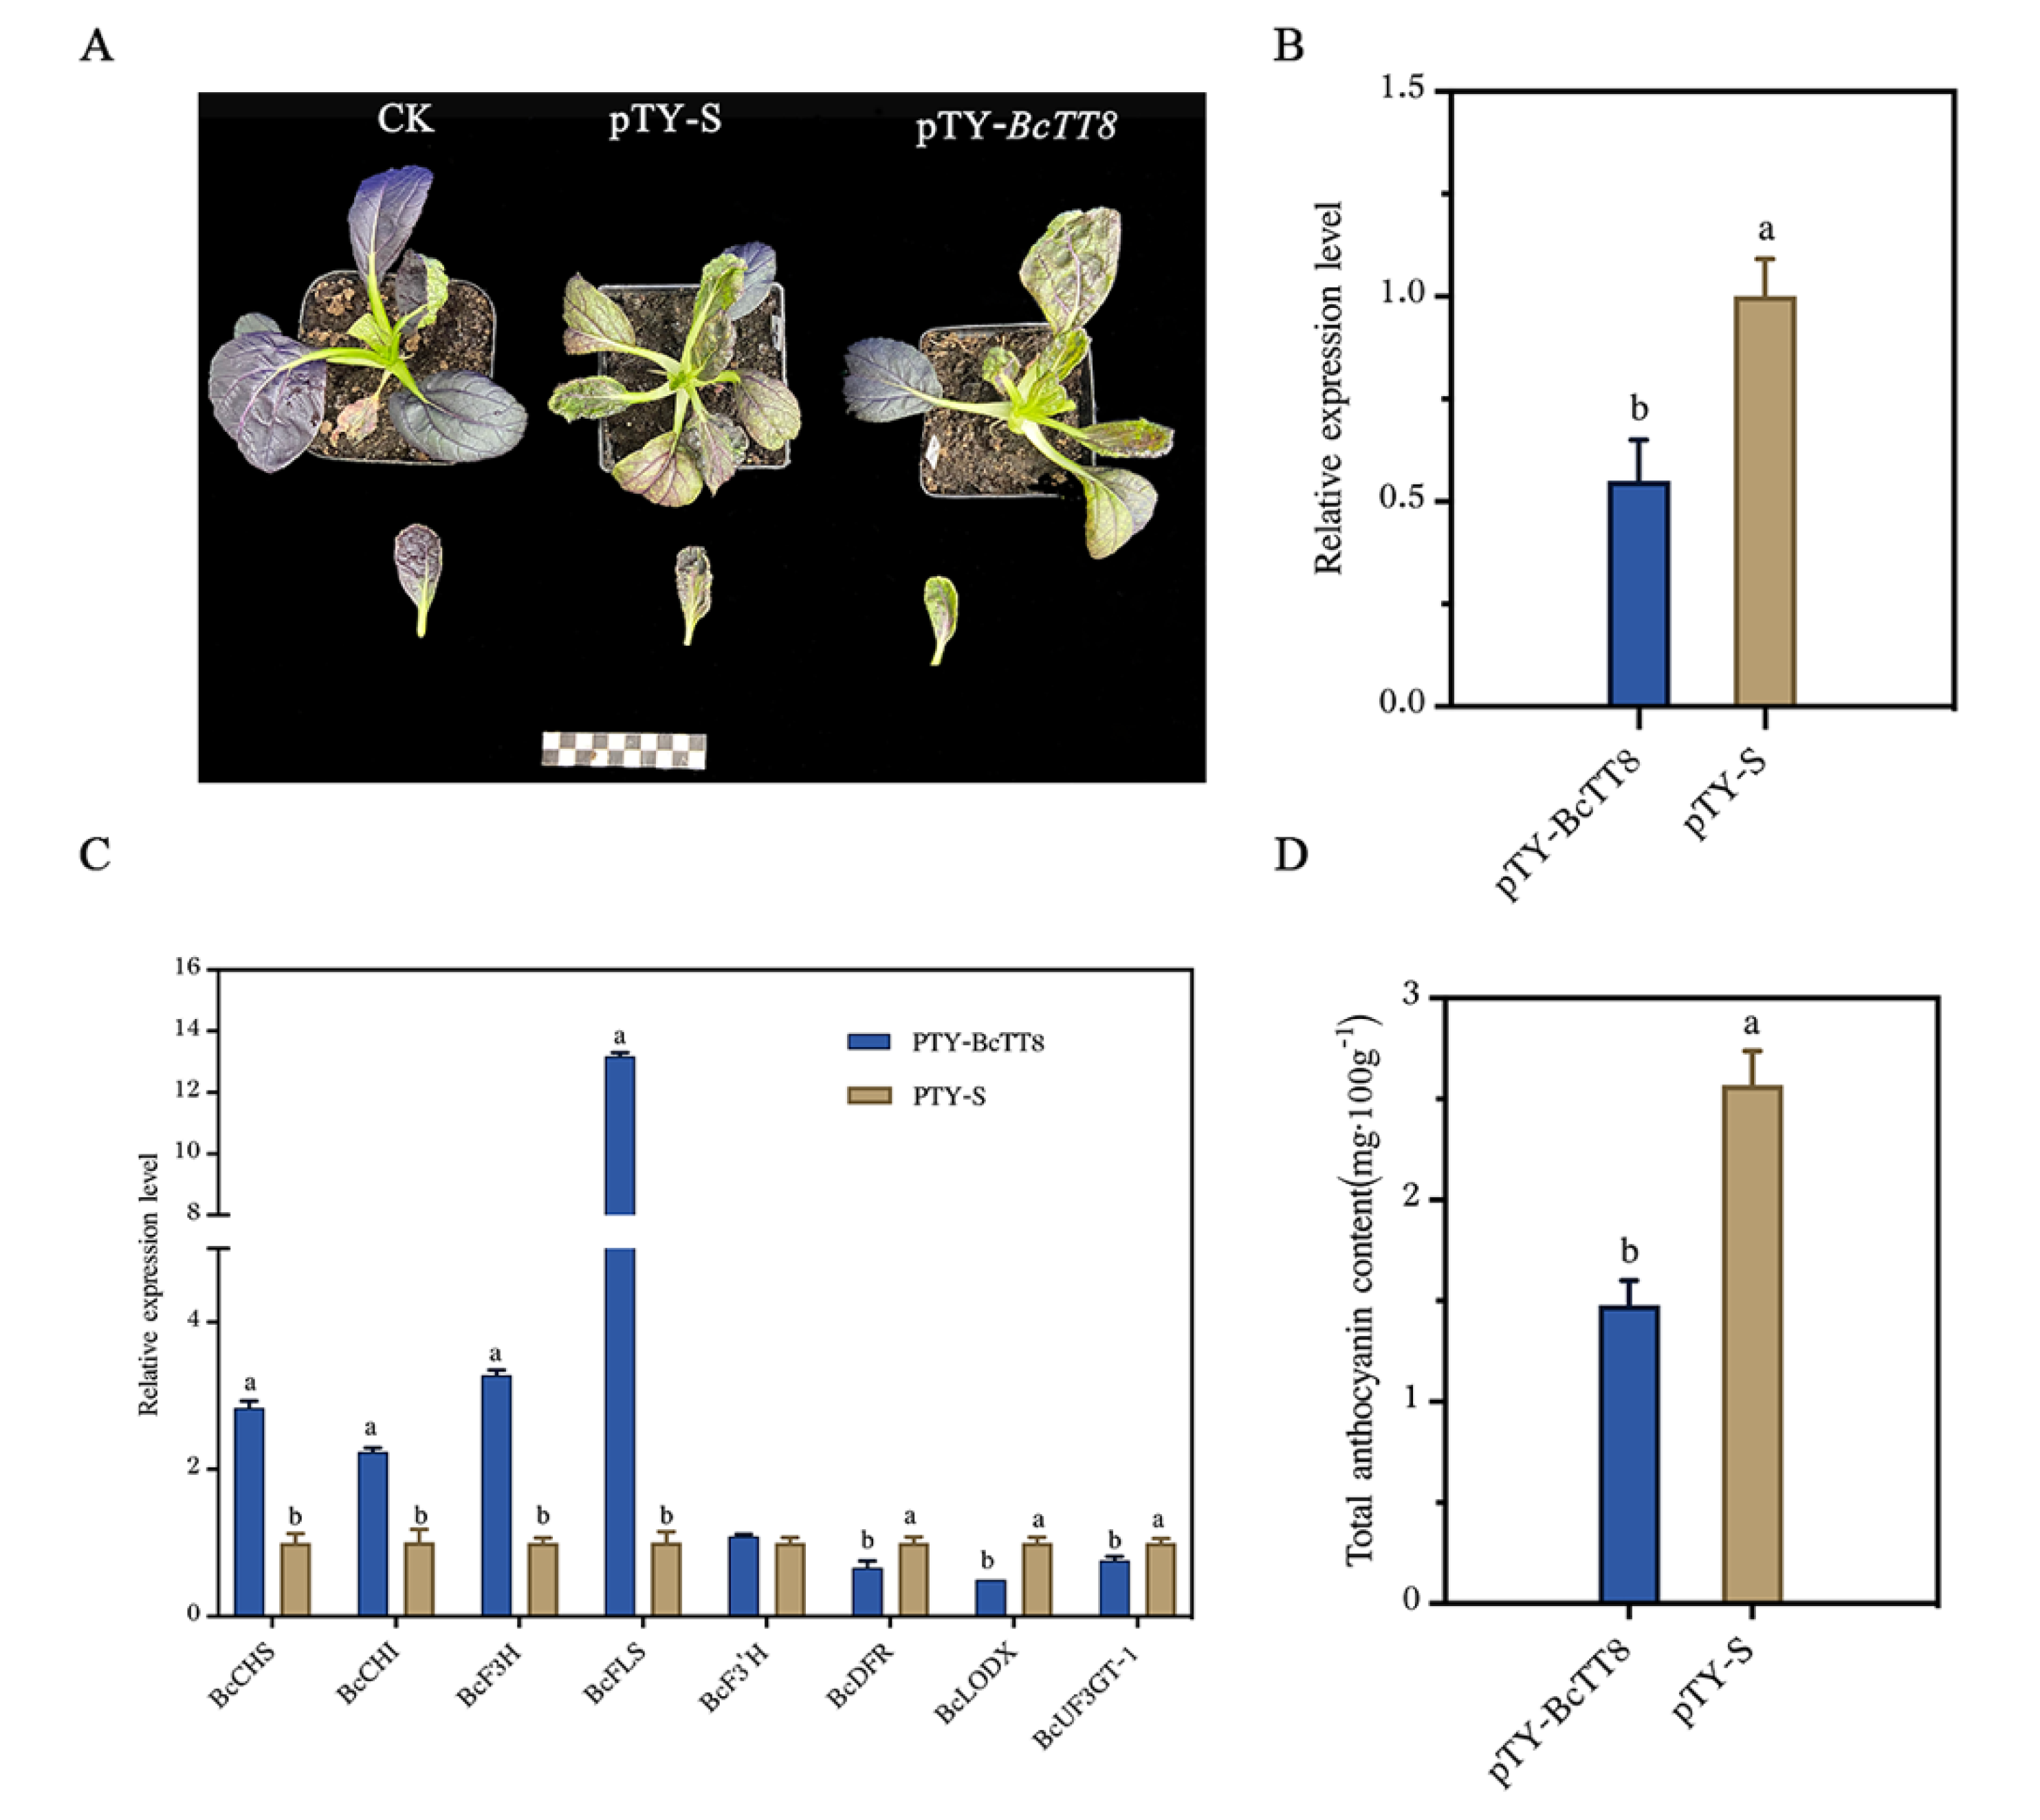
3.7. Expression Analysis of Structural Genes after Silencing of BcTT8

In this study, we obtained from these plants emerged color fading, which was one of the viral symptoms. However, the color variations among control plants, infected pTY-S plasmid plants and the infected pTY-BcTT8 plants were obviously different. Both the viral plants appeared to have color fading, but the one inoculated with pTY-BcTT8 presented barely violet (Figure 7A), and the silencing efficiency of BcTT8 expression was about 50% compared with control (Figure 7B). We performed the RT-qPCR assay for analyzing the transcription expression levels of anthocyanin synthesis-related genes. The expression levels of BcCHS, BcCHI and BcF3H were significantly increased in pTY-BcTT8 plants, while BcF3′H showed no difference between pTY-S and pTY-BcTT8 plants. FLS (flavonol synthase) is regarded as the key gene for the biosynthesis of flavonols, and in the present study, the BcFLS showed significantly high expression in pTY-BcTT8 plants. The expression levels of BcDFR, BcLODX and BcUFG3T-1 were significantly declined in pTY-BcTT8 plants compared with pTY-S plants (Figure 7C).
We determined the total amount of anthocyanin content; the content of pTY-BcTT8 silencing plants was about 57.5% for the content of pTY-S plants, which was 1.48 mg·100 g−1 and 2.57 mg·100 g−1, respectively (Figure 7D). We proposed that the silencing of BcTT8 caused the redirection of metabolism flux to flavonol synthase that reduced the anthocyanin accumulation.

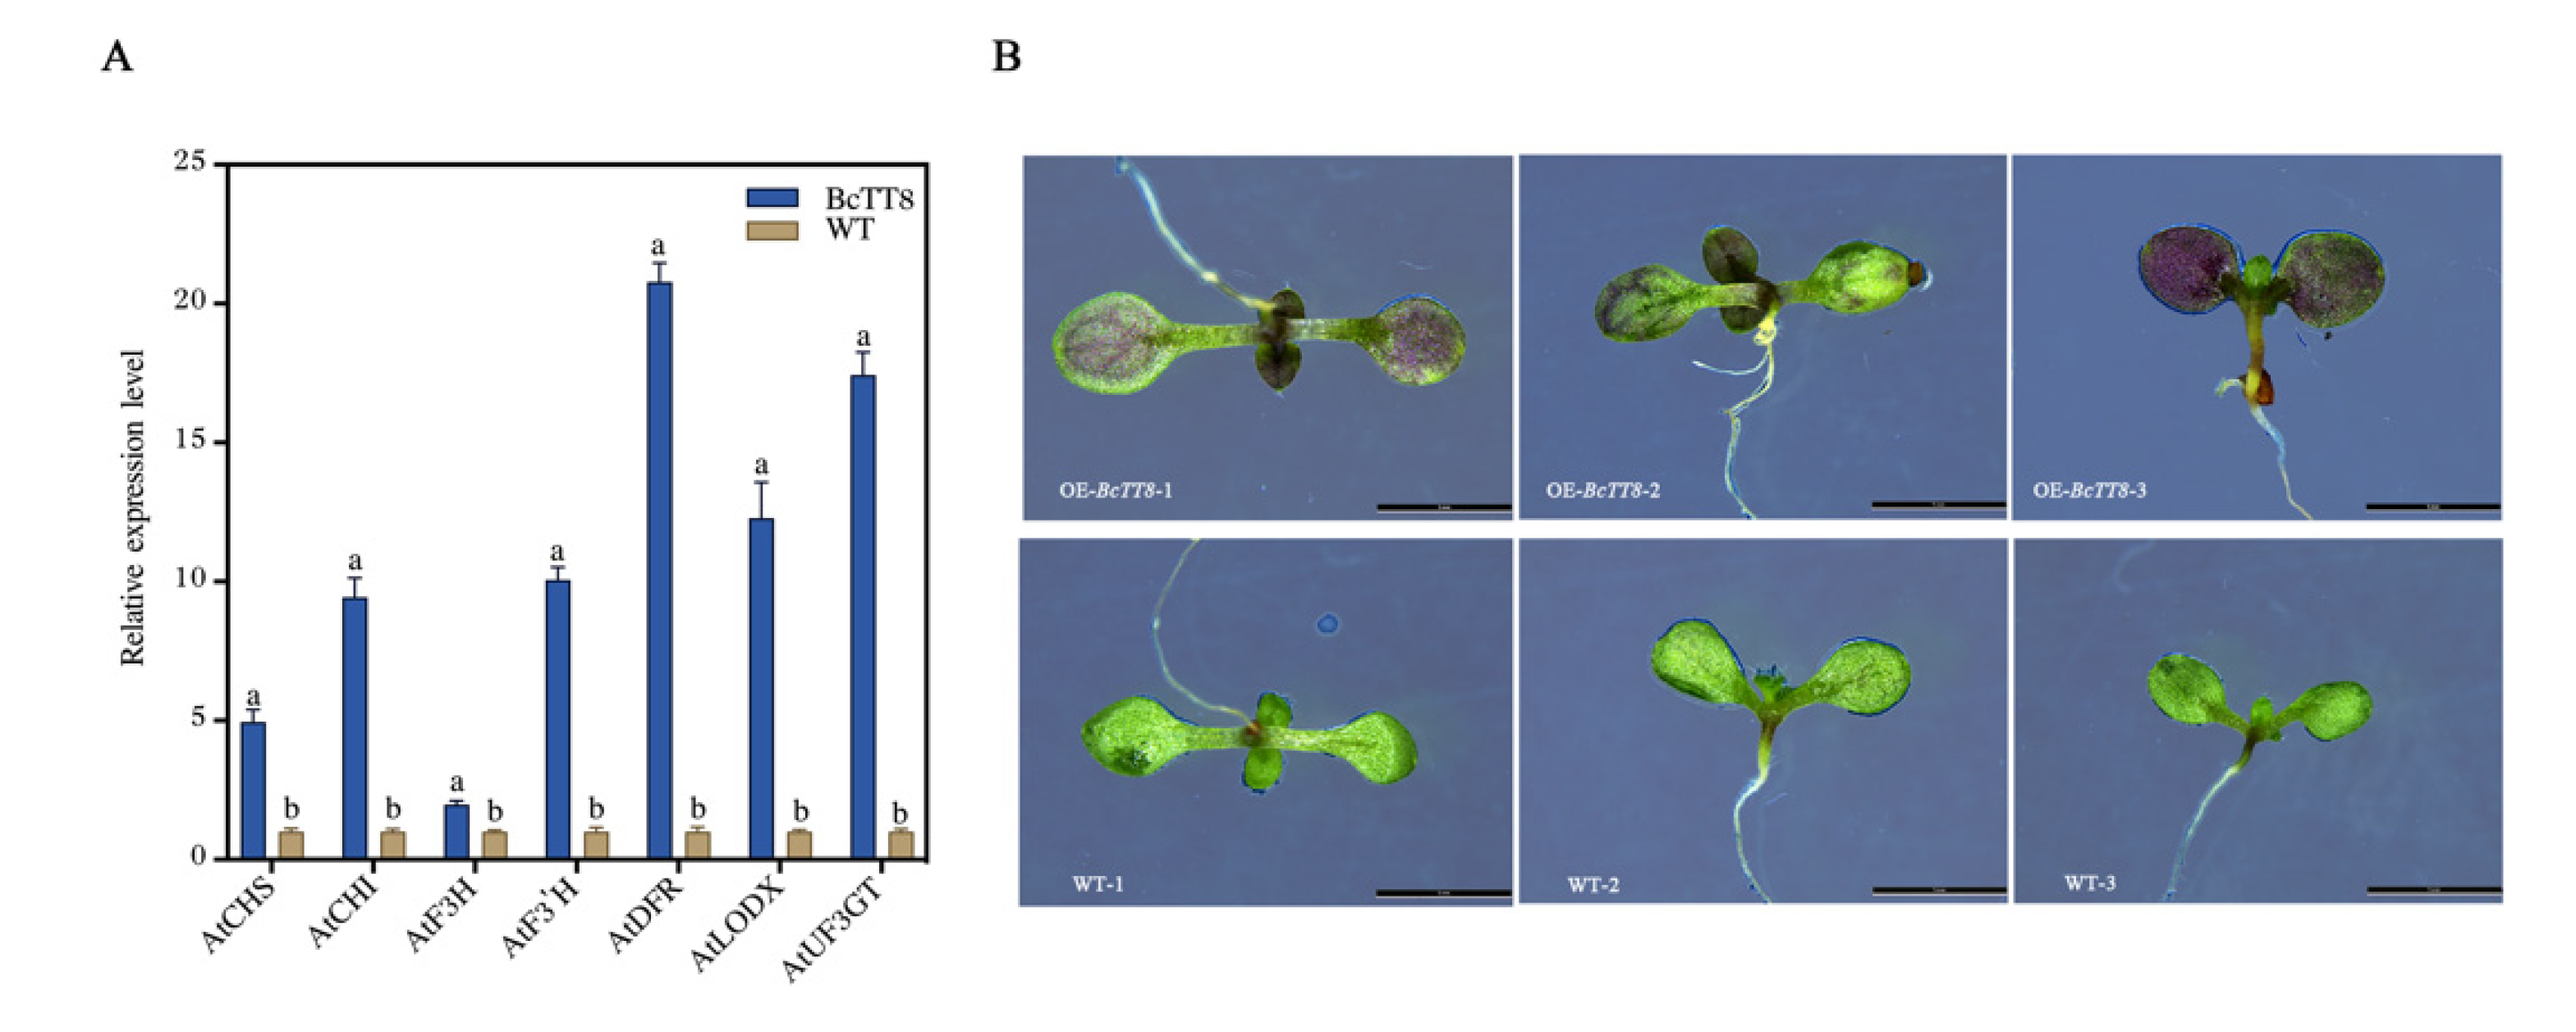
3.8. Heterologous Expression Analysis of BcTT8 in Arabidopsis

In order to elucidate the function of BcTT8, we constructed a 35S:BcTT8 vector using an Agrobacterium-mediated floral dip method. The coding sequence of BcTT8 was 1566 bp, and three transgenic plants were selected from the MS solid medium (Figure S4). Compared with wild-type plants, BcTT8-overexpressed plants had increased transcription levels of anthocyanin biosynthesis pathway genes. AtCHS, AtCHI, AtF3H, AtF3′H, AtDFR, AtLODX, and AtUF3GT were all significantly upregulated (Figure 8A). The cotyledons of transgenic plants presented obviously violet, but the WT still appeared green (Figure 8B), which demonstrated that BcTT8 promoted anthocyanin synthesis in Arabidopsis.

4. Discussion

Transcriptome analysis is a powerful tool for selecting the differentially expressed genes (DEGs) with our samples, which are useful to find the candidate genes. Contrasting transcriptome analysis had been performed in two Pak-Choi, and they found that in the purple variety, ‘flavonoid biosynthesis’ was the only KEGG significantly enriched pathway, which comprises structural genes BrDFR, BrLODX, BrUF3GT-1, BrUF3GT-2, and BrUF75C1 [26]. As for the release of the NHCC001 genome [29], we identified several enriched anthocyanin-related pathways and further explain the mechanism of anthocyanin regulation. Our results have many differences with the previous studies, except for the ‘flavonoid’ pathway, the ‘anthocyanin biosynthesis’, ‘starch and sucrose metabolism’, and ‘biosynthesis of secondary metabolites’ pathways, which were also significantly enriched (Figure 3). Phenylpropane and flavonoid pathway genes participate in synthesizing the precursors of anthocyanin, which is also a subgroup of flavonoid [15], so that genes that participate in the ‘flavonoid’ and ‘phenylalanine metabolism’ pathways were significantly enriched. What is more, catalyzing anthocyanin synthesis requires ample enzymes, and encoding these products costs a large amount of energy by starch hydrolysis [34]; thus, it makes sense that the ‘starch and sucrose metabolism’ pathway genes were significantly enriched in the purple NHCC HG072. The KEGG pathway enrichment results confirmed that several structural genes, BcDFR, BcLODX, BcUF3GT-1, BcUF3GT-2, and BcUF75C1, which are related to the flavonoid and anthocyanin pathways, showed significantly expression in purple leaves (Table 3). Our analyses are in accordance with the transcriptome profiling in Pak-Choi and red Chinese cabbage (Brassica Rapa), of which the BrDFR, BrLDOX, BrUF3GT, and BrUGT75C1-1 are highly expressed [26,35], and relevant studies have revealed that these genes are critical in the process of anthocyanin biosynthesis [36].
Utilizing comparative RNA sequencing, researchers found that MYB and bHLH TFs are involved in the anthocyanin biosynthetic pathway [37,38]. MYB and bHLH TFs could finely tune the expression of anthocyanin pathway genes, so it is crucial to analyze transcription factor expression levels that could provide thorough insights into the regulatory mechanism of anthocyanin synthesis. In our study, we identified that BcTT8 was more significantly expressed in purple leaves (Figure 4), indicating that BcTT8 functions as an anthocyanin biosynthetic regulator. Earlier studies reported that NnTT8 recovered anthocyanin accumulation in Arabidopsis tt8 mutant [18], and other bHLH family proteins were also proved to regulate anthocyanin biosynthesis in other higher plants [39,40,41]. In our study, both the pTY plants and pTY-BcTT8 plants presented color fading (Figure 7A), which was a symptom of virus injection [42], but the silencing of BcTT8 led to more severe symptoms. BcTT8-silenced non-heading Chinese cabbage showed a notable downregulation of anthocyanin biosynthetic genes BcDFR, BcLODX, and BcUF3GT, while the transcription level of BcFLS increased considerably (Figure 7C). Previous studies had proved that in other plant species, bHLH transcription factors could activate the expression of DFR, ANS, and UFGT, which improve the anthocyanin content [16,17]; thus, we proposed that in non-heading Chinese cabbage, transcription factor BcTT8 also facilitates the similar function, which could explain the downregulation of the LBGs and the decrease in anthocyanin production. We should mention that the production of flavonols and anthocyanins share the same biosynthesis pathway and compete for the same precursors. Flavonol synthase (FLS) may direct the dihydroflavonol precursors to the flavonol route [8]. In our study, BcFLS exhibited significant upregulation in the BcTT8-silencing plants as the anthocyanin content decreased dramatically. The metabolic flux redirection was also observed in other higher plants. Mutations in ScbHLH17 prevented the biosynthesis of anthocyanins in white Seneclo cruentus cultivars, and the RNAi silencing lines of anthocyanidin reductase (ANR) induced a redirection of the proanthocyanidin as well as the flavonol biosynthesis pathway, causing a reduction in anthocyanin synthesis in strawberry [43,44].
In Caryophyllales plants, the suppression of DFR and ANS resulted in the lack of anthocyanin, but the ectopic overexpression of these two genes induced anthocyanin accumulation [45]. In the BcTT8-overexpressed lines, the relative expression levels of anthocyanin structural genes showed significant upregulation, especially the LBGs AtDFR, AtLODX and AtUF3GT, causing the transgenic plants to present obviously violet (Figure 8A,B).
Brassicaceous vegetables have been receiving scientific attention for many years because numerous studies reported that eating these vegetables would reduce the risk of some chronical diseases and kinds of cancer [46,47]. The main reason for that is that brassicaceous vegetables contain various phytonutrients such as the polyphenol, glucosinolates, carotenoid or terpenoid groups. Currently, purple brassicaceous vegetables, including non-heading Chinese cabbage, Chinese cabbage, Zicaitai, and kale have become increasingly popular not only for their attractive colors but also for the benefits they bring to the public. An increasing number of studies have pointed out that diets in anthocyanins help lower the risk of cancer, cardiovascular diseases, diabetes, oxidative stress, inflammation, and related diseases [48,49,50]. Non-heading Chinese cabbage is a nutrition-rich vegetable that is widely consumed worldwide, but the molecular mechanism of anthocyanin synthesis is under explored. In this study, we identified that BcCHI-1, BcCHI-2, BcDFR, BcLODX, BcUF3GT-1, BcUF3GT-2, BcUF75C1, and one bHLH transcription factor BcTT8 were significantly upregulated in purple NHCC, and functional analyses demonstrated that BcTT8 could positively promote anthocyanin accumulation. Our findings illustrated the anthocyanin molecular regulation of non-heading Chinese cabbage, which could provide the theoretical basis for breeding high anthocyanin content non-heading Chinese cabbage cultivars.

5. Conclusions

In the present study, we have a further understanding of the anthocyanin biosynthetic pathway in non-heading Chinese cabbage through the comparative transcriptome analysis. A number of DEGs related to anthocyanin and flavonoid biosynthesis pathways were identified, indicating their important roles in the anthocyanin biosynthesis in NHCC. In addition, we explained the function of BcTT8 gene and demonstrated that BcTT8 is of great importance in anthocyanin synthesis.

Supplementary Materials

The following supporting information can be downloaded at: https://www.mdpi.com/article/10.3390/genes13060988/s1. Figure S1: Photographs of green NHCC ‘HG072′ and purple NHCC ‘HP072′ (A) and total anthocyanin content of these two cultivars (B); Figure S2: Conversed domains analysis of BcTT8; Figure S3: Amino acids sequences blast of bHLH proteins; Figure S4: Agarose gel electrophoresis picture of BcTT8 transgenic plants verification by RT-PCR. Table S1: Primer pairs used in this study; Table S2: All the DEGs from the transcriptome result; Table S3: Differentially expressed transcription factors list from the transcriptome result; Table S4: Classification of GO terms; Table S5: GO classification of biological process; Table S6: GO classification of cell component; Table S7: GO classification of molecular function; Table S8: Result of GO enrichment annotation: Table S9: Result of KEGG pathway annotation.

Author Contributions

L.T. completed the experiments and wrote the manuscript; D.X. participated in plotting; Y.Y. helped data collection and analysis; H.W. was involved in the transcriptome data analyses; J.W. and T.L. helped the revision of this manuscript; X.H. provided materials used in this study; Y.L. designed the study and provided financial support. All authors have read and agreed to the published version of the manuscript.

Funding

This work was funded by the National Key Research and Development Program (2018YFD1000805), Independent Innovation of Agricultural Science and Technology Projects in Jiangsu Province (CX (20) 2017), the National Vegetable Industry Technology System (CARS-23-A16), and Jiangsu Seed Industry Revitalization Project (JBGS (2021) 015).

Institutional Review Board Statement

Not applicable.

Informed Consent Statement

Not applicable.

Data Availability Statement

The raw data of the transcriptome have been uploaded to NCBI-Sequence Read Archive (https://www.ncbi.nlm.nih.gov/search/all/?term=SRA (accessed on 8 April 2022)). HG072-1: SRR18693103; HG072-2: SRR18691869; HG072-3: SRR18693073; HP072-1: SRR18693245; HP072-2: SRR18729142; HP072-3: SRR18693566.

Acknowledgments

We thank Yuehua Ma (Central laboratory of College of Horticulture, Nanjing Agricultural University) for assistance in using a multi-detection microplate reader.

Conflicts of Interest

The authors declare no conflict of interest.

References

  1. Davies, K.M.; Albert, N.W.; Schwinn, K.E. From landing lights to mimicry: The molecular regulation of flower colouration and mechanisms for pigmentation patterning. Funct. Plant Biol. 2012, 39, 619–638. [Google Scholar] [CrossRef] [PubMed]
  2. Mattioli, R.; Francioso, A.; Mosca, L.; Silva, P. Anthocyanins: A comprehensive review of their chemical properties and health effects on cardiovascular and neurodegenerative diseases. Molecules 2020, 25, 17. [Google Scholar] [CrossRef] [PubMed]
  3. He, Q.; Ren, Y.; Zhao, W.; Li, R.; Zhang, L. Low temperature promotes anthocyanin biosynthesis and related gene expression in the seedlings of purple head Chinese cabbage (Brassica rapa L.). Genes 2020, 11, 81. [Google Scholar] [CrossRef] [PubMed] [Green Version]
  4. Luo, Y.; Teng, S.; Yin, H.; Zhang, S.; Tuo, X.; Tran, L.S.P. Transcriptome analysis reveals roles of anthocyanin-and jasmonic acid-biosynthetic pathways in rapeseed in response to high light stress. Int. J. Mol. Sci. 2021, 22, 13027. [Google Scholar] [CrossRef]
  5. Guo, R.; Yuan, G.; Wang, Q. Sucrose enhances the accumulation of anthocyanins and glucosinolates in broccoli sprouts. Food Chem. 2011, 129, 1080–1087. [Google Scholar] [CrossRef] [PubMed]
  6. Dębski, H.; Szwed, M.; Wiczkowski, W.; Szawara-Nowak, D.; Bączek, N.; Horbowicz, M. UV-B radiation increases anthocyanin levels in cotyledons and inhibits the growth of common buckwheat seedlings. Acta Biol. Hung. 2016, 67, 403–411. [Google Scholar] [CrossRef] [PubMed] [Green Version]
  7. Nakabayashi, R.; Yonekura-Sakakibara, K.; Urano, K.; Suzuki, M.; Yamada, Y.; Nishizawa, T.; Matsuda, F.; Kojima, M.; Sakakibara, H.; Shinozaki, K.; et al. Enhancement of oxidative and drought tolerance in Arabidopsis by overaccumulation of antioxidant flavonoids. Plant J. 2014, 77, 367–379. [Google Scholar] [CrossRef]
  8. Martens, S.; Preuß, A.; Matern, U. Multifunctional flavonoid dioxygenases: Flavonol and anthocyanin biosynthesis in Arabidopsis thaliana L. Phytochemistry 2010, 71, 1040–1049. [Google Scholar] [CrossRef]
  9. An, J.P.; Zhang, X.W.; Liu, Y.J.; Wang, X.F.; You, C.X.; Hao, Y.J. ABI5 regulates ABA-induced anthocyanin biosynthesis by modulating the MYB1-bHLH3 complex in apple. J. Exp. Bot. 2021, 72, 1460–1472. [Google Scholar] [CrossRef]
  10. Sun, C.; Deng, L.; Du, M.; Zhao, J.; Chen, Q.; Huang, T.; Jiang, H.; Li, C.B.; Li, C. A transcriptional network promotes anthocyanin biosynthesis in tomato flesh. Mol. Plant. 2020, 13, 42–58. [Google Scholar] [CrossRef]
  11. Biswas, T.; Mathur, A.; Gupta, V.; Luqman, S.; Mathur, A.K. Elicitation and phenylalanine precursor feeding based modulation of in vitro anthocyanin production, enzyme activity and gene expression in an Indian ginseng congener-panax sikkimensis ban. Ind. Crops Prod. 2020, 145, 111986. [Google Scholar] [CrossRef]
  12. Ramsay, N.A.; Glover, B.J. MYB–bHLH–WD40 protein complex and the evolution of cellular diversity. Trends Plant Sci. 2005, 10, 63–70. [Google Scholar] [CrossRef] [PubMed]
  13. Lipsick, J.S. One billion years of Myb. Oncogene 1996, 13, 223–235. [Google Scholar] [PubMed]
  14. Dubos, C.; Stracke, R.; Grotewold, E.; Weisshaar, B.; Martin, C.; Lepiniec, L. MYB transcription factors in Arabidopsis. Trends Plant Sci. 2010, 15, 573–581. [Google Scholar] [CrossRef]
  15. Wang, X.C.; Wu, J.; Guan, M.L.; Zhao, C.H.; Geng, P.; Zhao, Q. Arabidopsis MYB4 plays dual roles in flavonoid biosynthesis. Plant J. 2020, 101, 637–652. [Google Scholar] [CrossRef]
  16. Jia, N.; Wang, J.J.; Liu, J.; Jiang, J.; Sun, J.; Yan, P.; Sun, Y.; Wan, P.; Ye, W.; Fan, B. DcTT8, a bHLH transcription factor, regulates anthocyanin biosynthesis in Dendrobium candidum. Plant Physiol. Biochem. 2021, 162, 603–612. [Google Scholar] [CrossRef]
  17. Qi, Y.; Zhou, L.; Han, L.; Zou, H.; Miao, K.; Wang, Y. PsbHLH1, a novel transcription factor involved in regulating anthocyanin biosynthesis in tree peony (Paeonia suffruticosa). Plant Physiol. Biochem. 2021, 154, 396–408. [Google Scholar] [CrossRef]
  18. Deng, J.; Li, J.J.; Su, M.Y.; Lin, Z.Y.; Chen, L.; Yang, P.F. A bHLH gene NnTT8 of Nelumbo nucifera regulates anthocyanin biosynthesis. Plant Physiol. Biochem. 2021, 158, 518–523. [Google Scholar] [CrossRef]
  19. Xu, W.J.; Grain, D.; Bobet, S.; le Gourrierec, J.; Thevenin, J.; Kelemen, Z.; Lepiniec, L.; Dubos, C. Complexity and robustness of the flavonoid transcriptional regulatory network revealed by comprehensive analyses of MYB-bHLH-WDR complexes and their targets in Arabidopsis seed. New Phytol. 2014, 202, 132–144. [Google Scholar] [CrossRef]
  20. Li, P.; Chen, B.; Zhang, G.; Chen, L.; Dong, Q.; Wen, J.; Mysore, K.S.; Zhao, J. Regulation of anthocyanin and proanthocyanidin biosynthesis by Medicago truncatula bHLH transcription factor MtTT8. New Phytol. 2016, 210, 905–921. [Google Scholar] [CrossRef]
  21. Lim, S.H.; Kim, D.H.; Kim, J.K.; Lee, J.Y.; Ha, S.H. A radish basic helix-loop-helix transcription factor, RsTT8 acts a positive regulator for anthocyanin biosynthesis. Front. Plant Sci. 2017, 8, 1917. [Google Scholar] [CrossRef] [PubMed]
  22. Chen, J.; Zhang, J.; Xiang, Y.; Xiang, L.; Liu, Y.; He, X.; Zhou, X.; Liu, X.; Huang, Z. Extracts of Tsai Tai (Brassica chinensis): Enhanced antioxidant activity and anti-aging effects both in vitro and in Caenorhabditis elegans. Food Funct. 2016, 7, 943–952. [Google Scholar] [CrossRef] [PubMed]
  23. Ma, X.; Ding, Q.; Hou, X.L.; You, X. Analysis of flavonoid metabolites in watercress (Nasturtium officinale R. Br.) and the non-heading Chinese cabbage (Brassica rapa ssp. chinensis cv. Aijiaohuang) using UHPLC-ESI-MS/MS. Molecules 2021, 26, 5825. [Google Scholar] [CrossRef] [PubMed]
  24. Abbaoui, B.; Lucas, C.R.; Riedl, K.M.; Clinton, S.K.; Mortazavi, A. Cruciferous vegetables, isothiocyanates, and bladder cancer prevention. Mol. Nutr. Food Res. 2018, 62, 1800079. [Google Scholar] [CrossRef] [PubMed]
  25. Zhang, Y.; Chen, G.; Dong, T.; Pan, Y.; Zhao, Z.; Tian, S.; Hu, Z. Anthocyanin accumulation and transcriptional regulation of anthocyanin biosynthesis in purple bok choy (Brassica rapa var. chinensis). J. Agric. Food Chem. 2014, 62, 12366–12376. [Google Scholar] [CrossRef]
  26. Zhang, L.; Xu, B.; Wu, T.; Yang, Y.; Fan, L.; Wen, M.; Sui, J. Transcriptomic profiling of two Pak Choi varieties with contrasting anthocyanin contents provides an insight into structural and regulatory genes in anthocyanin biosynthetic pathway. BMC Genom. 2017, 18, 288. [Google Scholar] [CrossRef] [Green Version]
  27. Guo, N.; Cheng, F.; Wu, J.; Liu, B.; Zheng, S.; Liang, J.; Wang, X. Anthocyanin biosynthetic genes in Brassica rapa. BMC Genom. 2014, 15, 1–11. [Google Scholar] [CrossRef] [Green Version]
  28. Lee, J.; Durst, R.W.; Wrolstad, R.E. Determination of total monomeric anthocyanin pigment content of fruit juices, beverages, natural colorants, and wines by the pH differential method: Collaborative study. J. AOAC Int. 2005, 88, 1269–1278. [Google Scholar] [CrossRef] [Green Version]
  29. Li, Y.; Liu, G.F.; Ma, L.M.; Liu, T.K.; Zhang, C.W.; Xiao, D.; Zheng, H.K.; Chen, F.; Hou, X.L. A chromosome-level reference genome of non-heading Chinese cabbage [Brassica campestris (syn. Brassica rapa) ssp. chinensis]. Hortic. Res. 2020, 7, 212. [Google Scholar] [CrossRef]
  30. Love, M.I.; Huber, W.; Anders, S. Moderated estimation of fold change and dispersion for RNA-seq data with DESeq2. Genome Biol. 2014, 15, 1–21. [Google Scholar] [CrossRef] [Green Version]
  31. Livak, K.J.; Schmittgen, T.D. Analysis of relative gene expression data using real-time quantitative PCR and the 2−ΔΔCT method. Methods 2001, 25, 402–408. [Google Scholar] [CrossRef] [PubMed]
  32. Yu, J.; Yang, X.D.; Wang, Q.; Gao, L.W.; Yang, Y.; Xiao, D.; Liu, T.K.; Li, Y.; Hou, X.L.; Zhang, C.W. Efficient virus-induced gene silencing in Brassica rapa using a turnip yellow mosaic virus vector. Biol. Plant. 2018, 62, 826–834. [Google Scholar] [CrossRef]
  33. Zhang, X.; Henriques, R.; Lin, S.S.; Niu, Q.W.; Chua, N.H. Agrobacterium-mediated transformation of Arabidopsis thaliana using the floral dip method. Nat. Protoc. 2006, 1, 641–646. [Google Scholar] [CrossRef]
  34. Stein, O.; Granot, D. An overview of sucrose synthases in plants. Front. Plant Sci. 2019, 10, 95. [Google Scholar] [CrossRef] [PubMed] [Green Version]
  35. Rameneni, J.J.; Choi, S.R.; Chhapekar, S.S.; Kim, M.S.; Singh, S.; Yi, S.Y.; Oh, S.H.; Kim, H.; Lee, C.Y.; Oh, M.H.; et al. Red Chinese cabbage transcriptome analysis reveals structural genes and multiple transcription factors regulating reddish purple color. Int. J. Mol. Sci. 2020, 21, 2901. [Google Scholar] [CrossRef] [Green Version]
  36. Zhang, Y.; Butelli, E.; Martin, C. Engineering anthocyanin biosynthesis in plants. Curr. Opin. Plant Biol. 2014, 19, 81–90. [Google Scholar] [CrossRef]
  37. Huang, G.; Zeng, Y.; Wei, L.; Yao, Y.; Dai, J.; Liu, G.; Gui, Z. Comparative transcriptome analysis of mulberry reveals anthocyanin biosynthesis mechanisms in black (Morus atropurpurea Roxb.) and white (Morus alba L.) fruit genotypes. BMC Plant Biol. 2020, 20, 1–12. [Google Scholar] [CrossRef]
  38. Li, J.; An, Y.; Wang, L. Transcriptomic analysis of Ficus carica peels with a focus on the key genes for anthocyanin biosynthesis. Int. J. Mol. Sci. 2020, 21, 1245. [Google Scholar] [CrossRef] [Green Version]
  39. Lim, S.H.; Kim, D.H.; Jung, J.A.; Lee, J.Y. Alternative splicing of the basic helix-loop-helix transcription factor gene CmbHLH2 affects anthocyanin biosynthesis in ray florets of chrysanthemum (Chrysanthemum morifolium). Front. Plant Sci. 2021, 12, 1116. [Google Scholar] [CrossRef]
  40. Li, Y.; Shan, X.; Gao, R.; Yang, S.; Wang, S.; Gao, X.; Wang, L. Two IIIf clade-bHLHs from Freesia hybrida play divergent roles in flavonoid biosynthesis and trichome formation when ectopically expressed in Arabidopsis. Sci. Rep. 2016, 6, 30514. [Google Scholar] [CrossRef] [Green Version]
  41. Xu, W.; Grain, D.; le Gourrierec, J.; Harscoët, E.; Berger, A.; Jauvion, V.; Scagnelli, A.; Berger, N.; Bidzinski, P.; Kelemen, Z.; et al. Regulation of flavonoid biosynthesis involves an unexpected complex transcriptional regulation of TT8 expression in Arabidopsis. New Phytol. 2013, 198, 59–70. [Google Scholar] [CrossRef] [PubMed]
  42. Ratcliff, F.; Martin-Hernandez, A.M.; Baulcombe, D.C. Technical advance: Tobacco rattle virus as a vector for analysis of gene function by silencing. Plant J. 2001, 25, 237–245. [Google Scholar] [CrossRef] [PubMed]
  43. Fischer, T.C.; Mirbeth, B.; Rentsch, J.; Sutter, C.; Ring, L.; Flachowsky, H.; Habegger, R.; Hoffmann, T.; Hanke, M.V.; Schwab, W. Premature and ectopic anthocyanin formation by silencing of anthocyanidin reductase in strawberry (Fragaria × ananassa). New Phytol. 2014, 201, 440–451. [Google Scholar] [CrossRef] [PubMed]
  44. Jin, X.H.; Huang, H.; Wang, L.; Sun, Y.; Dai, S.L. Transcriptomics and metabolite analysis reveals the molecular mechanism of anthocyanin biosynthesis branch pathway in different Seneclo cruentus cultivars. Front. Plant Sci. 2016, 7, 1307. [Google Scholar] [CrossRef] [Green Version]
  45. Sakuta, M.; Tanaka, A.; Iwase, K.; Miyasaka, M.; Ichiki, S.; Hatai, M.; Inoue, Y.T.; Yamagami, A.; Nakano, T.; Yoshida, K.; et al. Anthocyanin synthesis potential in betalain-producing Caryophyllales plants. J. Plant Res. 2021, 134, 1335–1349. [Google Scholar] [CrossRef]
  46. Soundararajan, P.; Kim, J.S. Anti-carcinogenic glucosinolates in cruciferous vegetables and their antagonistic effects on prevention of cancers. Molecules 2018, 23, 2983. [Google Scholar] [CrossRef] [Green Version]
  47. Melim, C.; Lauro, M.R.; Pires, I.M.; Oliveira, P.J.; Cabral, C. The role of glucosinolates from cruciferous vegetables (Brassicaceae) in gastrointestinal cancers: From prevention to therapeutics. Pharmaceutics 2022, 14, 190. [Google Scholar] [CrossRef]
  48. He, J.; Giusti, M.M. Anthocyanins: Natural colorants with health-promoting properties. Annu. Rev. Food Sci. Technol. 2010, 1, 163–187. [Google Scholar] [CrossRef]
  49. Pojer, E.; Mattivi, F.; Johnson, D.; Stockley, C.S. The case for anthocyanin consumption to promote human health: A review. Compr. Rev. Food Sci. Food Saf. 2013, 12, 483–508. [Google Scholar] [CrossRef]
  50. Khoo, H.E.; Azlan, A.; Tang, S.T.; Lim, S.M. Anthocyanidins and anthocyanins: Colored pigments as food, pharmaceutical ingredients, and the potential health benefits. Food Nutr. Res. 2017, 61, 1361779. [Google Scholar] [CrossRef] [Green Version]
Figure 1. The volcano map tells us the expression trends of these DEGs between green and purple samples; the red dots and green dots present the upregulation and downregulation of DEGs, respectively, while the black dots mean genes without a significant difference in expression between the two samples.
Genes 13 00988 g001
Figure 2. Gene Ontology classification enrichment analysis results of DEGs. GO classification of upregulated and downregulated DEGs (A), the Top 20 GO enrichment process (B). Rich Factor: DEGs numbers/total gene numbers enriched in the process.
Genes 13 00988 g002
Figure 3. The 20 most KEGG pathway enrichment for DEGs. Rich Factor: DEGs numbers/total gene numbers enriched in the pathway.
Genes 13 00988 g003
Figure 4. Analysis of genes related to anthocyanin biosynthesis-related genes using the RT-qPCR. Gene expression levels were normalized to BcActin. Error bars represent the standard error of the mean (n = 3).
Genes 13 00988 g004
Figure 5. The phylogenetic tree of BcTT8 protein in non-heading Chinese cabbage and similar bHLH proteins in other species. The protein labeled with a red dot was BcTT8. Gene bank number BrTT8 (XP_009113574.1); BjTT8 (AIN41653.1); RsTT8 (ASF79354.1); BnTT8 (QFU95692.1); BoTT8 (ADP76654.1); NtAN1a (NP_001312042.1); NtAN1b (NP_001289454.1), AtGL3 (NP_680372); AtEGL3 (NP_176552); AtTT8 (CAC14865); SmbHLH1 (AFJ05597.1); LcbHLH3 (APP94124.1).
Genes 13 00988 g005
Figure 6. Subcellular localization of 35S:GFP and 35S:BcTT8-GFP, bars = 20 μm, 35S:GFP was used as a control.
Genes 13 00988 g006
Figure 7. Photographs of WT, pTY-S and pTY-BcTT8 plants (A) and RT-qPCR analysis result of BcTT8 and anthocyanin pathway genes (B,C) and total anthocyanin content in plants (D). Significant differences (p < 0.05) were indicated with different letters.
Genes 13 00988 g007
Figure 8. Identification of BcTT8 transgenic plants. RT-qPCR analysis of anthocyanin pathway genes in BcTT8-overexpression plants (A) and photographs of WT and BcTT8 transgenic plants taken by stereoscopic microscope, bars = 5 mm (B).
Genes 13 00988 g008
Table 1. DEGs of bHLH Gene Family.
Gene NameGene IDMean FPKM (Purple)Mean FPKM (Green)Log2FC
BcTT8BraC09g02782020.9711860.1286037.1793481
BcEGL1BraC09g0140200.1646810.77609633−2.7202394
BcGL3BraC04g0161600.3749621.52723467−1.6471003
BcPRE1BraC07g0198801.3300226.18879667−2.371988
Table 2. Anthocyanin-Containing Compound Biosynthetic Process (qvalue = 2.71 × 10⁻⁶).
Gene NameGene IDMean FPKM (Purple)Mean FPKM (Green)Log2FCUp or Down Regulated
BcCHI-1BraC09g05356071.5237106730.1621511.4134447up
BcCHI-2BraC09g05386049.6499543319.183057671.54414961up
BcDFRBraC09g018850332.7632040.08453112.0172491up
BcLODXBraC03g05216035.9533830.1352723338.22759096up
BcNCED4BraC08g0142300.688357333−8.7651817down
BcFLSBraC10g030090107.904424259.9946647−1.1015793down
BcUF3GT-1BraC06g022480205.77341730.05015433312.021179up
BcUF3GT-2BraC10g01254057.12839133015.1169748up
BcUF75C1BraC08g010530322.2732950.6110519.20124194up
BcTT19-1BraC02g00705082.25163410.8874163.10472421up
BcTT19-2BraC10g02421090.538103670.04746633311.1466138up
Bc5MATBraC09g00315083.300022330.08053766710.1547666up
BcTT8BraC09g02782016.567958330.1286037.1793481up
BcMYBL2-1BraC07g03580042.0675111.6994163334.83412855up
BcMYBL2-2BraC02g02100014.610188333.1592603332.38862003up
Table 3. Anthocyanin and Flavonoid Biosynthesis Pathway DEGs.
PathwayGene NameGene IDMean FPKM (Purple)Mean FPKM (Green)Log2FCUp or Downregulated
Flavonoid BiosynthesisBcCHI-1BraC09g05356071.5237106730.1621511.4134447up
BcCHI-2BraC09g05386049.6499543319.183057671.54414961up
BcDFRBraC09g018850332.7632040.08453112.0172491up
BcLODXBraC03g05216035.9533830.1352723338.22759096up
BcC4HBraC03g016590156.211275718.5947473.233418596up
BcFLSBraC10g030090107.904424259.9946647−1.1015793down
Anthocyanin biosynthesisBcUF3GT-1BraC06g022480205.77341730.05015433312.021179up
BcUF3GT-2BraC10g01254057.12839133015.1169748up
BcUF75C1BraC08g010530322.2732950.6110519.20124194up
Table 4. Gene list verified by RT-qPCR.
Gene NameGene IDMean FPKM (Purple)Mean FPKM (Green)Log2FCUp or Down Regulated
BcCHS2BraC10g026540471.590159471.78468870.000594985
BcCHI-1BraC09g05356071.5237106730.1621511.4134447up
BcF3HBraC02g0291804.8074563337.09875−0.525317861
BcF3′HBraC08g01577024.73574530.335388−0.13065833
BcDFRBraC09g018850332.7632040.08453112.0172491up
BcLODXBraC03g05216035.9533830.1352723338.22759096up
BcFLSBraC10g030090107.904424259.9946647−1.1015793down
BcUF3GT-1BraC06g022480205.77341730.05015433312.021179up
BcTT8BraC09g02782016.567958330.1286037.1793481up
BcMYBL2-1BraC07g03580042.0675111.6994163334.83412855up
Publisher’s Note: MDPI stays neutral with regard to jurisdictional claims in published maps and institutional affiliations.

