Abstract
Flowering time is an important agronomic trait in Brassica rapa and has a wide range of variation. The change from vegetative to reproductive development is a major transition period, especially in flowering vegetable crops. In this study, two non-heading Chinese cabbage varieties with significantly different flowering times, Pak-choi (B. rapa var. communis Tesn et Lee) and Caitai (B. rapa var. tsaitai Hort.), were used to construct segregated F2 populations. The bulk-segregant approach coupled with whole genome re-sequencing was used for QTL sequencing (QTL-seq) analysis to map flowering time traits. The candidate genes controlling flowering time in B. rapa were predicted by homologous gene alignment and function annotation. The major-effect QTL ft7.1 was detected on chromosome A07 of B. rapa, and the FT family gene BrFT was predicted as the candidate gene. Moreover, a new promoter regional difference of 1577 bp was revealed by analyzing the sequence of the BrFT gene. The promoter region activity analysis and divergent gene expression levels indicated that the difference in the promoter region may contribute to different flowering times. These findings provide insights into the mechanisms underlying the flowering time in Brassica and the candidate genes regulating flowering in production.
1. Introduction
The flowering characteristics of crops are important agronomic traits that are closely related to agricultural production. Flowering time has always been the focus of researchers and breeders, as it is useful for improving crop introduction and breeding. The transition from vegetative to reproductive growth is controlled by various physiological factors and genetic pathways [1]. For example, artificial lighting can affect the flowering of chrysanthemum and is conducive to year-round production [2]. In potatoes, early flowering reduces the yield and quality of vegetative organs [3]. Therefore, appropriately regulating flowering time is especially important to maximize reproductive success and seed production.
The molecular mechanisms underlying plant flowering have been extensively studied in a series of plants. In Arabidopsis, flowering involves six major pathways, including the photoperiod/circadian clock, vernalization, age, autonomy, ambient temperature, and gibberellin pathways [4,5]. More than 180 Arabidopsis genes are implicated in the flowering time networks, such as FLOWERING LOCUS T (FT), CONSTANS (CO), FLOWERING LOCUS C (FLC), and FRI (FRIGIDA) [6,7,8]. It is suggested that the transcriptional regulation of the florigen gene FT is crucial for integrating information from internal and external factors, i.e., age, the amount of gibberellic acid, and temperature [9]. FT plays pivotal roles in floral induction and encodes a long-distance floral signaling molecule that moves from the distal end of the leaf to the meristem [10,11,12,13]. The flowering time is generally controlled by quantitative trait loci (QTLs). FT homologs have been identified in many crops, including tomato [14], rice [15], soybean [16], onion [17], and cucumber [18].
The large genus Brassica comprises a diverse group of important oil, fodder, and vegetable crops. Cultivated varieties of diploid B. rapa exhibit highly diverse morphological and developmental traits. The flowering time in B. rapa is a significant developmental trait that is usually controlled by the temperature and/or photoperiod. Non-heading Chinese cabbage (B. rapa ssp. chinensis, 2n = 20; NHCC) belongs to the B. rapa non-heading Chinese cabbage subspecies, which includes five other variants [19]. The photoperiod response to changes in day length and the vernalization response to low temperatures are two major pathways that regulate the flowering time in Arabidopsis thaliana [9]. The vernalization pathway is considered a main flowering path and is highly divergent among different subgroups. Generally, the early flowering types, including the oil types and several Pak-choi cultivars, flower very early, even without vernalized conditions. Chinese cabbages and turnips are mostly late-flowering types that need long-term vernalization to promote flowering. A low temperature is needed for the flowering of NHCC, whose budding, bolting, and flowering time are affected by the site, temperature, and time of vernalization treatment [20]. Previous studies have mainly focused on the molecular mechanism of genes during bolting and flowering in NHCC. Researchers have confirmed that MAF, TEM, and FLC family genes play important roles in regulating NHCC bolting and flowering [20,21,22]. In addition, the bolting and flowering of NHCC is not only regulated by the vernalization pathway but is also affected by other factors. For example, previous studies have shown that photoperiodic flowering-related genes BrCDF1, BcGI, BcFT, etc. were involved in the flowering process of NHCC [23,24,25]. As a biennial vegetable, NHCC is usually sown in autumn and flowers in the next spring after overwintering. Because the young stems or leaves are the main consumed parts, early bolting and flowering can reduce the quality and yield of NHCC [22], directly affecting the economic benefits. Therefore, the research on candidate genes controlling bolting/flowering in NHCC has important practical significance for the regulation and selection of bolting-tolerant or late-bolting cultivars.
In this study, we conducted QTL-seq using two NHCC cultivars, wym-97 and cx-49, to identify the major QTLs controlling the flowering time of NHCC. Candidate genes were identified using QTL-seq and resequencing. Our study will provide a theoretical foundation for the development of elite genes and the regulation of NHCC flowering.
2. Materials and Methods
2.1. Plant Materials and Phenotypic Analysis
Two non-heading Chinese cabbage inbred lines (wym-97 and cx-49) with contrast flowering times were used to construct mapping populations in this study. The inbred line wym-97 (var. communis Tesn et Lee) is a late-flowering variety, and cx-49 (var. tsaitai Hort.) is an early flowering variety. Suzhouqing is a late-flowering cultivar of NHCC and used in promoter activity analysis. wym-97 and cx-49 were used as parent lines to generate the F1 (wym-97 × cx-49) plants. Two F2 populations were then generated by the self-pollination of F1 plants, i.e., 1-F2 and 2-F2. The 350 and 250 individuals of the 1-F2 and 2-F2 population were grown in the cities of Hangzhou (the Qiaosi experimental field, 120°36′ E, 30°37′ N) and Lishui (the Bihuzhen experimental field, 119°79′ E, 28°35′ N) for phenotypic statistics of their respective flowering traits. The seeds were planted in early November, and the flowering time, which refers to the days from sowing to flowering, was treated as the target trait in this study. The statistical analysis on phenotypic data was performed using Microsoft Excel 2019 (Microsoft, Seattle, Washington, DC, USA).
2.2. Sample Collection and Bulk Construction
According to the phenotypic data, the individuals with an extremely early or late flowering time were determined. Young leaves of selected extreme individuals were collected, frozen in liquid nitrogen, and immediately stored in a −80 °C freezer. Sample DNA was extracted using the modified CTAB method [26]. The purity and integrity were detected using agarose gels. The concentration was then detected using a Nanodrop to ensure that the DNA could be used to construct sequencing libraries. Equal amounts of DNA were pooled to form four DNA pools, namely, E1-bulk (40 early flowering individuals in the 1-F2 population), L1-bulk (40 late-flowering individuals in the 1-F2 population), E2-bulk (30 early flowering individuals in the 2-F2 population), and L2-bulk (30 late-flowering individuals in the 2-F2 population). Finally, the two parent lines (wym-97 and cx-49) and four extreme bulked pools were sequenced using an Illumina HiSeq 4000 PE150 (Illumina, Inc., San Diego, CA, USA).
2.3. QTL-Seq Analysis and the Prediction of Candidate Genes
The Illumina TruSeq was used to construct the sequencing libraries, and BWA software [27] was used to compare the sequenced reads with the reference genome of NHCC [19] after filtering low-quality reads. GATK software was used to detect SNP information, and ANNOVAR was employed to perform SNP annotation. After filtering, the SNP index distribution of the four bulks was obtained in a 2 Mb window and a 50 kb step size. The Δ(SNP-index) value was calculated by subtracting the SNP index of L1/L2-bulks from that of E1/E2-bulks, respectively. The regions above the yellow thresholds (p < 0.01) were regarded as candidate QTLs. The candidate genes were then predicted by delineation of the Δ(SNP-index) peak region and the functional annotation of flowering homologous genes. The peak region is the top 15% of the sliding window points sorted according to the Δ(SNP-index) value within candidate QTLs.
2.4. Comparison of Candidate Gene Promoter Activities
The promoters of the candidate gene in wym-97, cx-49 and suzhouqing were cloned using primers QCFT-pF6/pR1 and then recombined into the vector pGreenⅡ-0800-LUC. The constructed vector and control (empty vector) were transformed into Agrobacterium GV3101. The inocula (OD600 = 0.8) were injected into tobacco leaves, protected from light overnight, and then cultured under normal light conditions for 72 h. Fluorescein potassium salt (Yeasen, Shanghai, China) was then injected and placed in the dark for 5 min. The images were observed and photographed using an in vivo plant imaging system (LB985 Night SHADE, Stuttgart, Germany).
2.5. Quantitative Verification
The quantitative experiment was conducted by the parent lines wym-97 and cx-49. After germination (20 August 2020), the seeds were sown in the substrate (peat soil:perlite:vermiculite = 1:1:1) and placed in an artificial climate room for cultivation at a temperature of 22 °C/18 °C (day/night), a light/dark ratio of 16 h/8 h (day/night), and a relative humidity of 60%. After 30 days, the tender leaves were sampled for quantitative validation experiments of the candidate genes.
2.6. RNA Extraction, cDNA Synthesis, and qRT-PCR Analysis
An amount of 0.1 g of tender leaves was ground into a powder for the extraction of total RNA (Trizol Reagent). Subsequently, 1 μg of RNA was used to synthesize a 20 μL cDNA system using the Prime-Script™ RT Reagent Kit with gDNA Eraser (TAKARA, Kusatsu, Japan). The total reaction system included 10 μL of SYBR Premix (2×), 1 μL of cDNA, 2 μL of primers (10 μM), and 7 μL of ddH2O. The qRT-PCR program was carried out using the Bio-Rad iCycler Real-Time PCR Detection System (Bio-Rad, Hercules, CA, USA), with pre-denaturation at 95 °C for 1 min, 40 cycles of denaturation at 95 °C for 10 s, annealing at 56 °C for 30 s, and extension at 72 °C for 30 s. Primer pairs were designed using Primer Premier 5.0 and are listed in Supplementary Table S1. The Bcpp2 gene was used as an internal standard for normalizing the gene expression data. The relative expression levels were calculated using the 2−ΔΔCT method [28] and visualized using Graphpad prism (vs. 8.4.3). p value = 0.05 means a significant difference (indicated by *); p value = 0.01 means a very significant difference (indicated by **).
3. Results
3.1. Phenotypic Analysis of the Flowering Time Characteristics
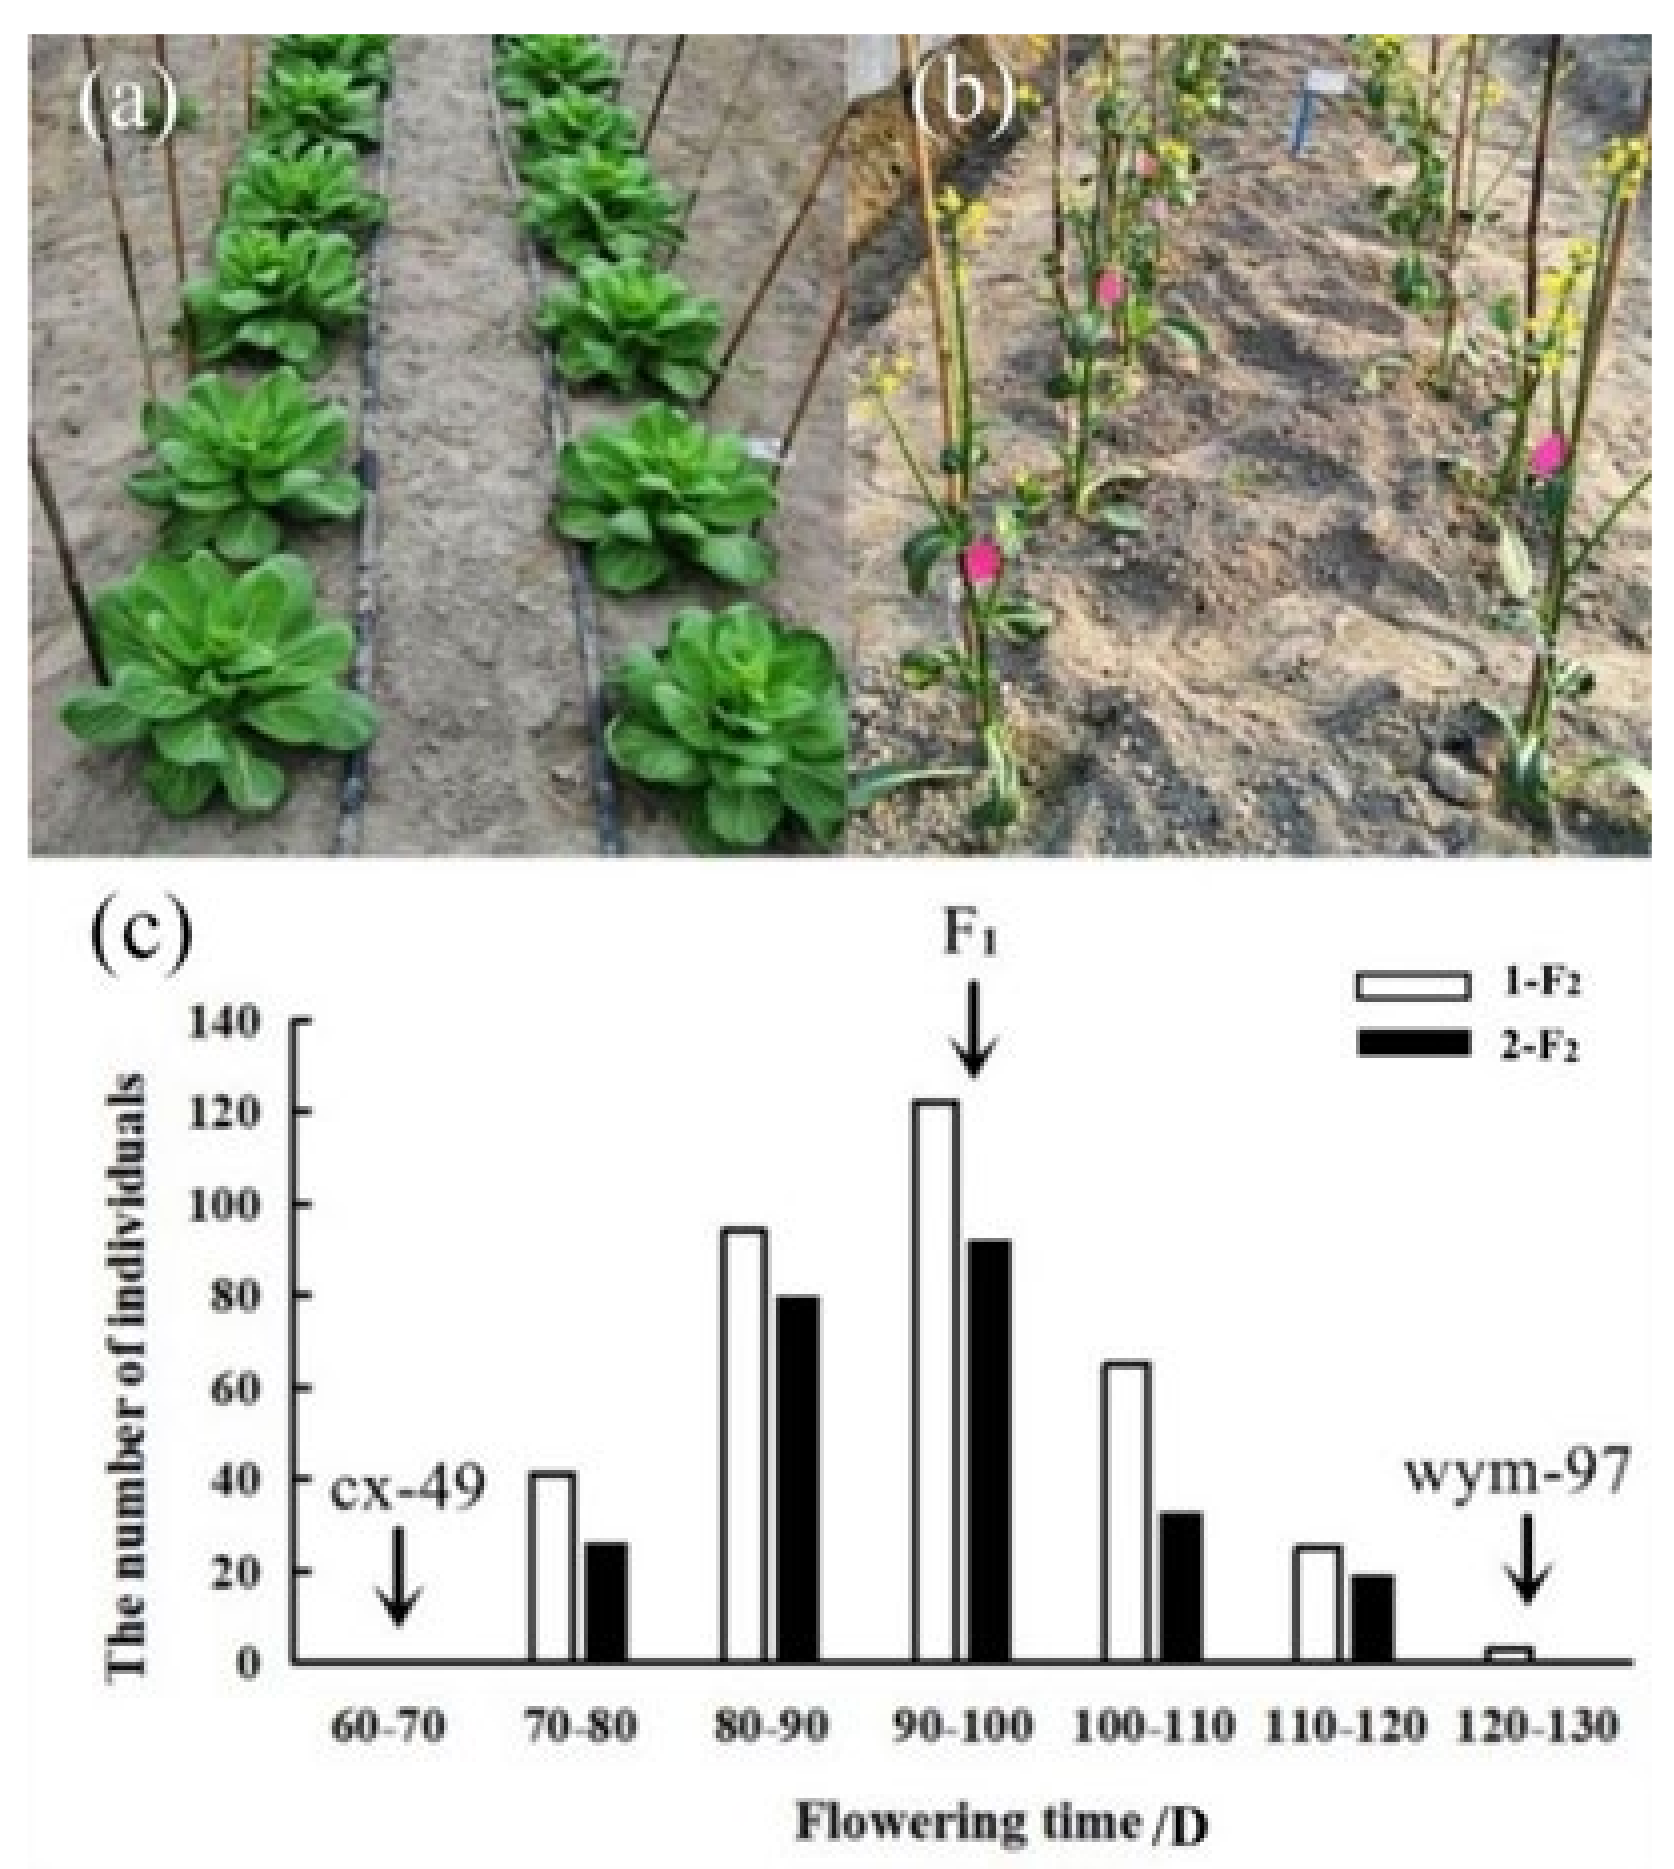
The flowering time was respectively measured from sowing to flowering in the spring of 2020 at Hangzhou and Lishui. A wide range of variation in flowering time was observed among the F2 populations derived from the cross between wym-97 and cx-49. The inbred line wym-97 (var. communis Tesn et Lee) is a late-flowering variety, where the leaves and petioles are the main consuming organs. In contrast, cx-49 (var. tsaitai Hort.) is an early flowering variety, where the scape (pedicel) is the main consuming organ. Two F2 populations were generated by the self-pollination of F1 individuals, including the 1-F2 population with 350 individuals and the 2-F2 population with 250 individuals. In the Hangzhou area, the average flowering time of wym-97 was 128 d, whereas that of cx-49 was 65 d, which was 63 d earlier than that of wym-97. The average flowering duration of the F2 plants was 92.7 d. The earliest flowering was 74 d, and the latest one was 120 d. In Lishui, the average flowering time of wym-97 was 120 d while that of cx-49 was 61 d, so the average flowering time of wym-97 was 59 d later than that of cx-49 at Lishui. The average flowering time of the F2 plants was 91.5 d. The earliest flowering time was 70 d, and the latest flowering time was 118 d. The flowering times of the F2 materials are presented in a normal distribution (Figure 1, Table 1), which is consistent with the quantitative trait inheritance characteristics. The results indicate that flowering time is a quantitative trait regulated by multiple loci.
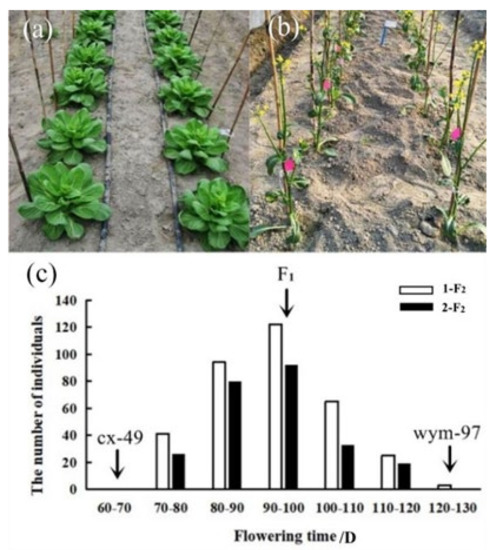
Figure 1.
The flowering time characteristics and frequency distribution of the parent lines, F1 and the F2 populations. (a,b) The performance of the parent lines (80 d after sowing). (c) The frequency distribution of the flowering time of the cx-49, wym-97, F1, 1-F2, and 2-F2 populations. The flowering time of the two parents and F1 is indicated by arrows.

Table 1.
Phenotypic variation in the flowering time of two F2 populations.
3.2. Detection of QTLs
According to the phenotypic data, four bulked pools of F2 individuals (two pools for each F2 population) with extremely early or late flowering times and the two parental lines were subject to Illumina high-throughput sequencing. A total of 953,593,154 bp clean reads were generated, and the Q30 of each sample was above 90% (Table 2). The average sequencing depths of wym-97 and cx-49 were 28.71× and 29.50×, respectively, whereas the sequencing depths of the four pools were 74.54%, 69.76%, 61.87%, and 63.86%, respectively. The genome coverage ranged from 89.34% to 95.90% (at least one base coverage). The quality of the sequencing data was appropriate to satisfy the requirements of QTL-seq analysis.
Table 2.
Statistics of the sequencing data for the parents and extreme pools.
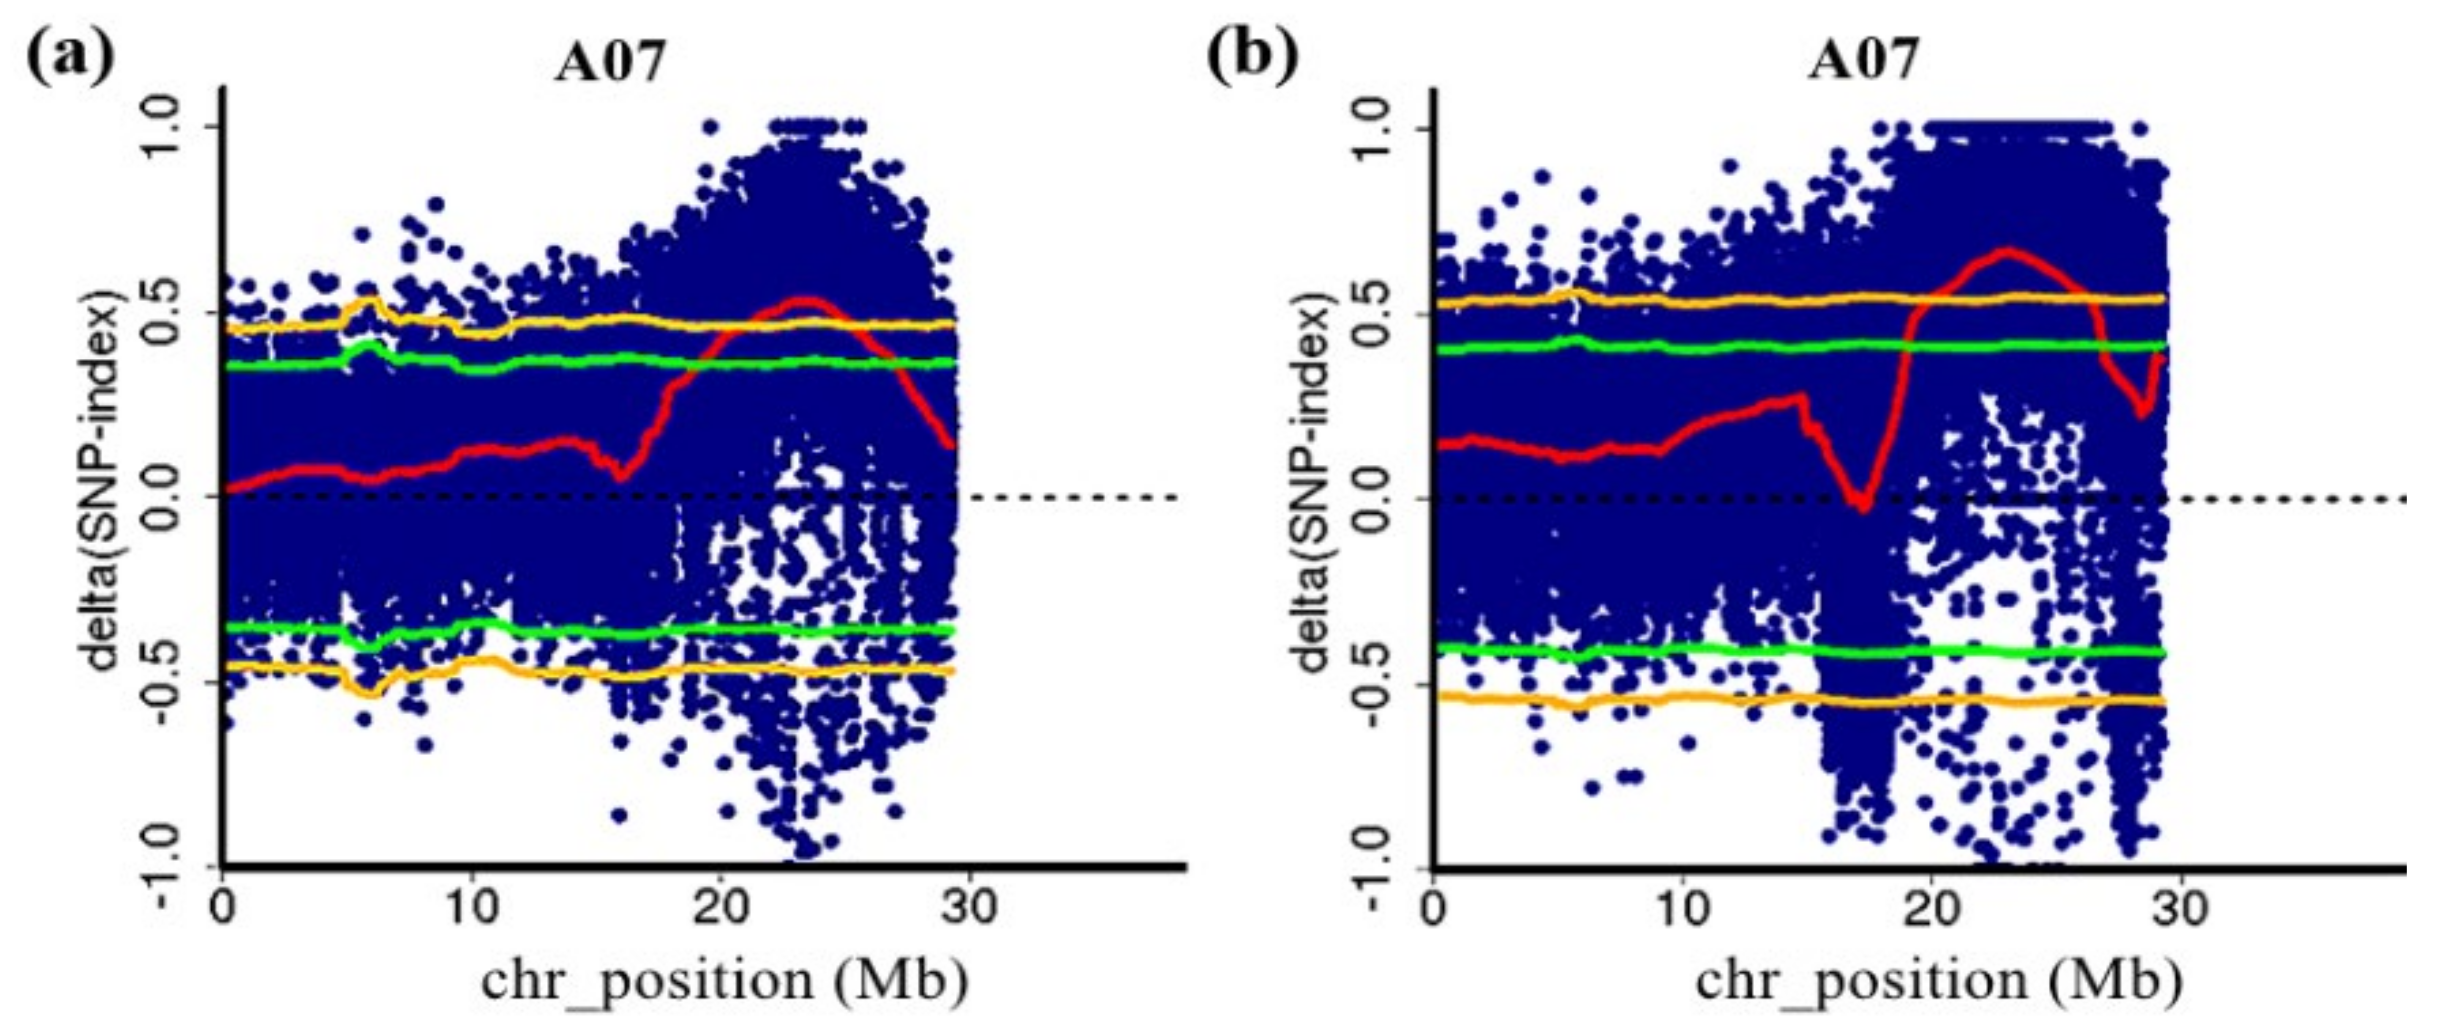
QTL-seq analysis was performed using the genome sequence of non-heading Chinese cabbage as the reference genome [19]. The results showed that two QTLs related to flowering time were detected using two F2 populations, which were both located on chromosome 7 of NHCC (Figure 2). The major-effect QTLs were determined according to a 99% threshold line. In the 1-F2 population, one QTL (FT7.1) was detected with a QTL interval of 21.10–25.25 Mb and a range size of 4.15 Mb. The Δ(SNP-index) value of FT7.1 was 0.463–0.530 (Supplementary Table S2). In the 2-F2 population, one QTL (FT7.2) was also identified. The interval was 20.10–26.15 Mb with a range size of 6.05 Mb. The maximum Δ(SNP-index) value was 0.671, and the minimum was 0.549 (Supplementary Table S3). Both QTLs were on chromosome 7, which shared an overlapping interval designated ft7.1 (21.10–25.25 Mb). Therefore, the major QTL ft7.1 was used for the subsequent analysis.
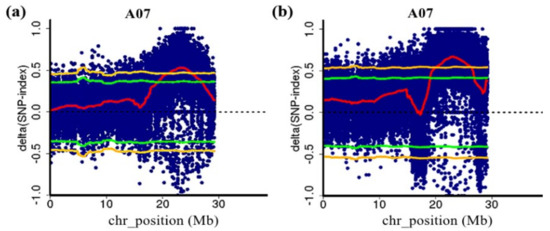
Figure 2.
The major QTL ft7.1 for the flowering time detected by QTL-seq. (a) QTL-seq analysis of chromosome 7 in the 1-F2 population; (b) QTL-seq analysis of chromosome 7 in the 2-F2 population. The blue dots are the Δ(SNP-index) of each SNP, and the red lines are the Δ(SNP-index) fitting lines, Δ(SNP-index) plot of the E and L bulks with confidence intervals under the null hypothesis of no QTLs (green, p < 0.05; yellow, p < 0.01).
3.3. The Prediction of Candidate Genes
The Δ(SNP-index) values in candidate regions were analyzed to further predict the candidate genes within the two QTLs FT7.1 and FT7.2. A 2 Mb window and a 50 Kb step size were used in the QTL-seq analysis. There were 84 and 122 sliding window points in the 4.15 and 6.05 Mb intervals, respectively, and the sliding window points with Δ(SNP-index) values in the top 15% delineated a reduced peak target region (Supplementary Table S4). The peak value of FT7.1 ranged from 22.90 to 23.75 Mb, and the Δ(SNP-index) values ranged from 0.527 to 0.530. The peak value and the Δ(SNP-index) values of FT7.2 ranged from 22.65 to 23.75 Mb and from 0.660 to 0.671, respectively (Table 3 and Supplementary Table S4). Thus, we obtained the peak region of 22.65–23.55 Mb shared by the two QTLs. Meanwhile, a homology comparison was also performed with the flowering homologous genes in A. thaliana in the shared region of FT7.1 and FT7.2. There are 8 candidate genes related to flowering in the major QTL ft7.1 (Table 4), among which BraC07g031540 was located in the peak region of 22.65–23.55 Mb shared by the two QTLs. Based on the above results, the BraC07g031540 (designated BrFT) is likely to be a candidate gene controlling flowering time in our materials.
Table 3.
Summary of QTLs detected for the flowering time with QTL-seq.
Table 4.
The candidate genes related to flowering in the QTL ft7.1.
3.4. Sequence Polymorphism Analysis of the BrFT Gene
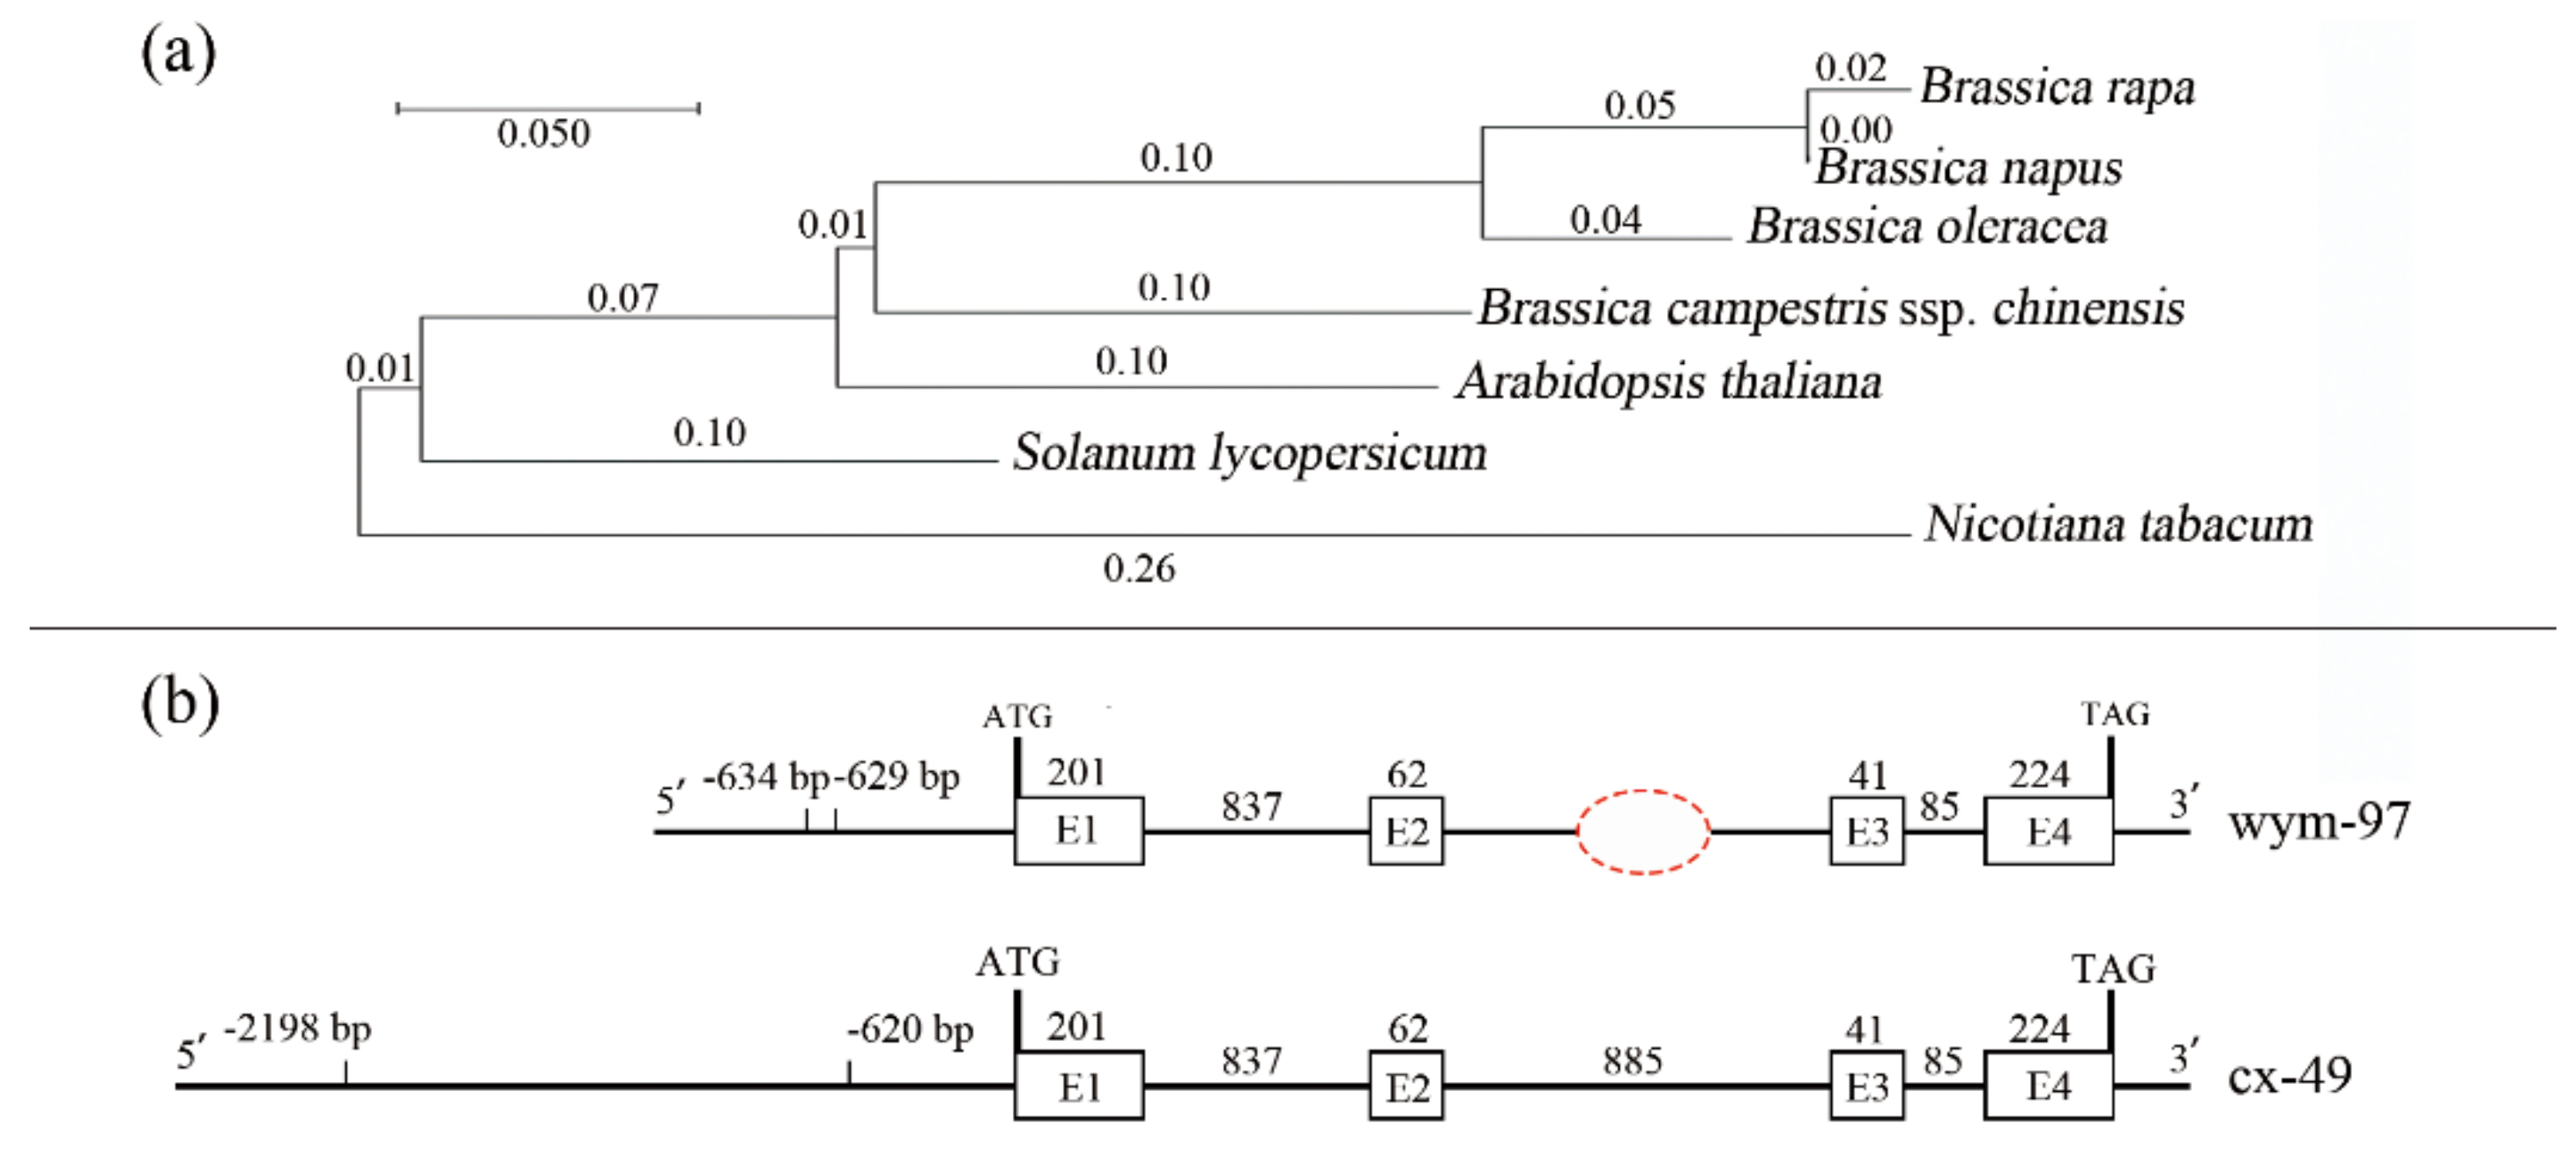
The phylogenetic relationships of the BrFT gene among the Brassica and other plant species were investigated. A phylogenetic tree, including five Brassica species, tomato, and tobacco, was constructed using MEGA X (Figure 3a).

Figure 3.
Phylogenetic analysis of the FT genes and comparison of BrFT gene variations between two parent lines. (a) Phylogenetic tree of the FT genes from different species. (b) The comparison of BrFT gene variations between the two parent lines (cx-49 and wym-97).
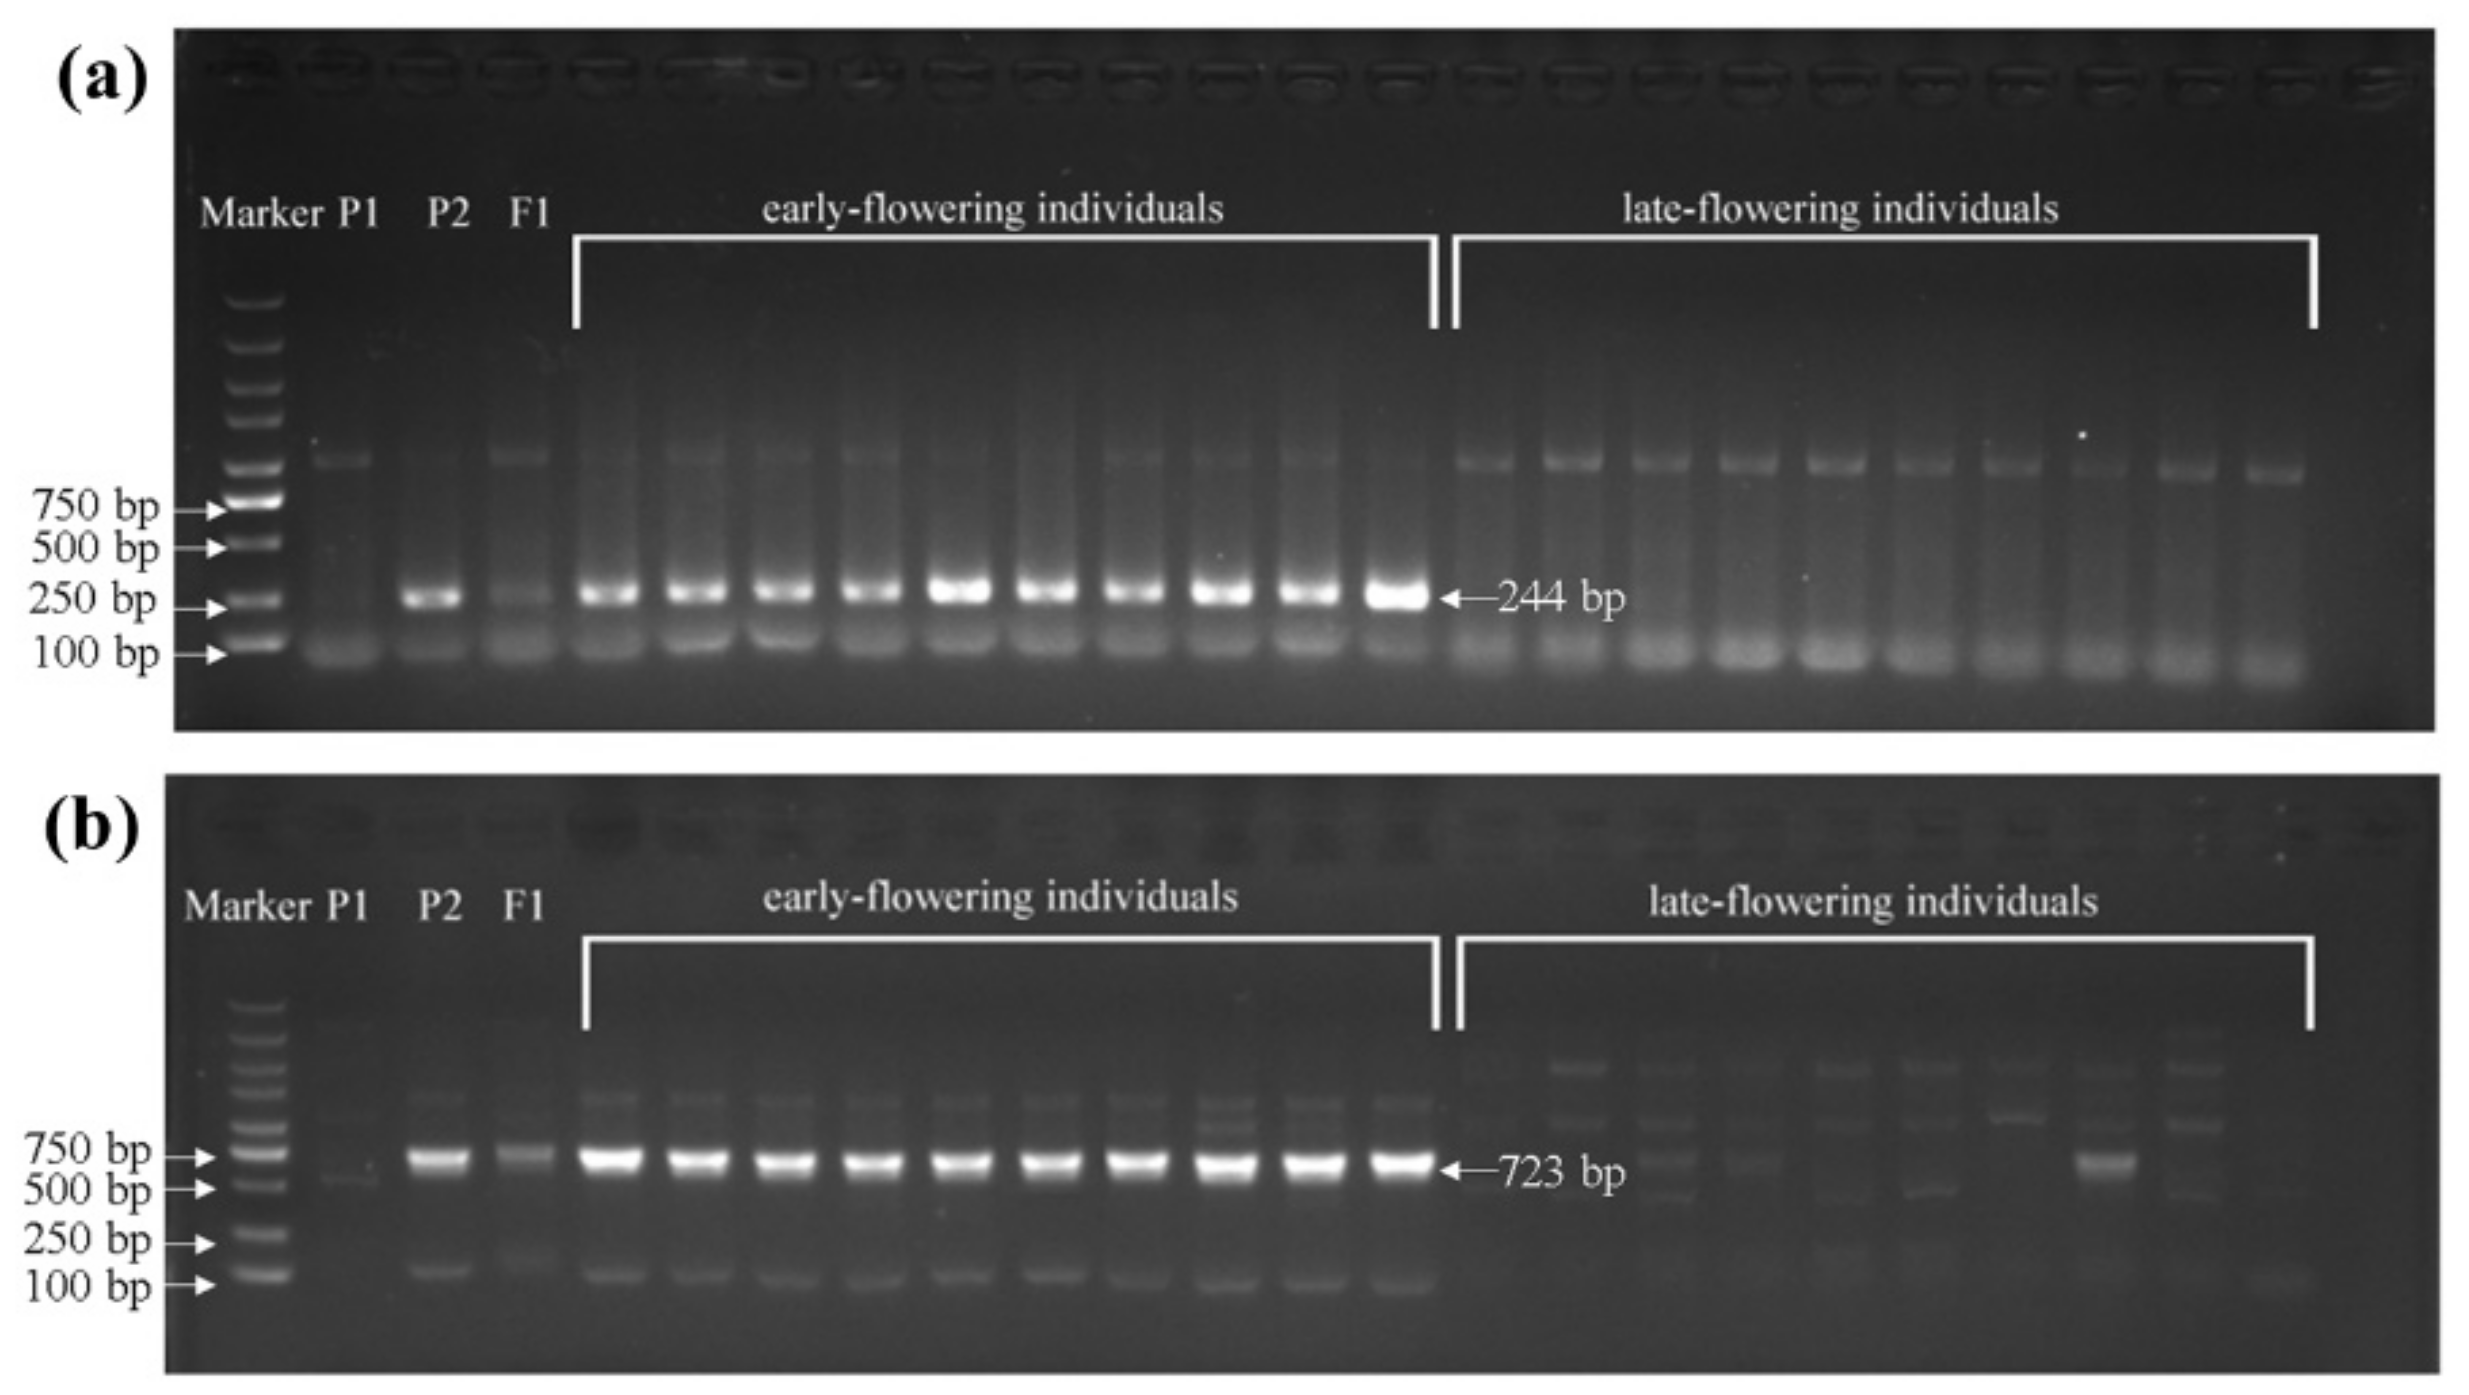
To identify sequence variations in the BrFT gene between the two parents, genomic DNAs of wym-97 and cx-49 were used to design primers to amplify the BrFT gene. The cx-49 BrFT gene was successfully cloned; however, no product was amplified using the genomic DNA of wym-97. Additional segmented primer sets were designed to amplify the genomic sequence of BrFT in wym-97. A new variation in the promoter region was found by amplifying and sequencing the upstream promoter region of the BrFT gene. Compared with wym-97, there was a 1577 bp insertion in the promoter region of cx-49 (Figure 3b). In order to facilitate further identification of the extreme individual plants in the F2 population using molecular markers, a pair of primer pFT2F/2R was developed to detect the variation in the promoter region. The forward primer of the primer sequence was in front of the cx-49 promoter insertion fragment, and the reverse primer was within the cx-49 promoter insertion fragment, with a target amplified fragment of only 244 bp. We also used the primers to compare the results of the parents and 140 extremely early or late-flowering individual plants in the 1-F2 and 2-F2 populations. The results showed that the same fragment insertion as the early flowering parent cx-49 was found in the promoter region of the early flowering lines (Figure 4a). All late-flowering individuals were the same as wym-97. Thereby, the variations in the BrFT promoter region are reliable and the primers can be used for the marker-assisted screening of flowering time.

Figure 4.
The variation detection of the BrFT gene in extreme individuals in the 1-F2 and 2-F2 populations. P1, wym-97; P2, cx-49. (a) The variation detection in the promoter region using primer pFT2F/2R. (b) The variant detection in the intronic region using primer BrFTF5-1/R5-1.
We also found that a stretch of sequence may be inserted between the 259 and 640 bp region of the intron 2 in wym-97, which resulted in failed PCR amplification. Thus, we designed the primer BrFTF5-1/R5-1 at the insertion site, the forward primer of which is in front of the insertion point and the reverse primer of which is behind the insertion point. Nonetheless, the primer could amplify a DNA fragment with 723 bp in length in cx-49 while wym-97 had no amplification product (Figure 4b). Subsequently, 140 individual plants of the 1-F2 and 2-F2 populations flowering extremely early and extremely late were used to verify the primers. The results showed that all early flowering individuals amplified the same bands as the early flowering parent cx-49. All late-flowering individuals showed the same diffuse bands as the late-flowering parent wym-97.
3.5. Verification of the Candidate Gene
The same primer QCFT-pF6/QCFT-pR1 was used to clone the promoters of the BrFT gene in cx-49, wym-97, and the late-flowering cultivar suzhouqing. The promoter regions with lengths of 2342, 764, and 1374 bp were obtained using proBrFT-suzhouqing-LUC as a control. The comparative promoter activity results indicated that the fluorescence value of proBrFT-cx-49-LUC was higher than that of proBrFT-wym-97-LUC and proBrFT-suzhouqing-LUC. Therefore, the promoter activity of cx-49 is higher than that of wym-97. We speculated that the insertion in the promoter region of the early flowering parent cx-49 may activate the transcription of BrFT, thereby promoting the expression of BrFT in cx-49 (Figure 5a). The expression of the BrFT gene in the two parents was also analyzed (Figure 5b). We found that the expression level of BrFT in cx-49 was significantly higher than that in wym-97, indicating that the transcription of BrFT was more active in the early flowering parent cx-49.
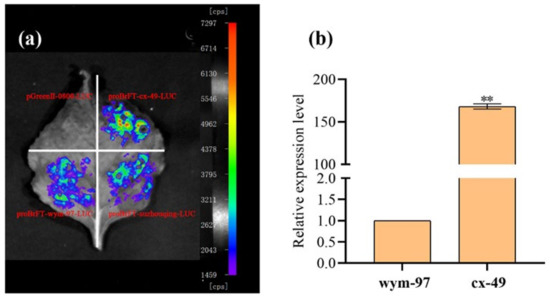
Figure 5.
The verification of candidate gene BrFT. (a) The detection of promoter activities. (b) The expression level of BrFT in parent lines. ** indicated a very significant difference (p value = 0.01).
4. Discussion
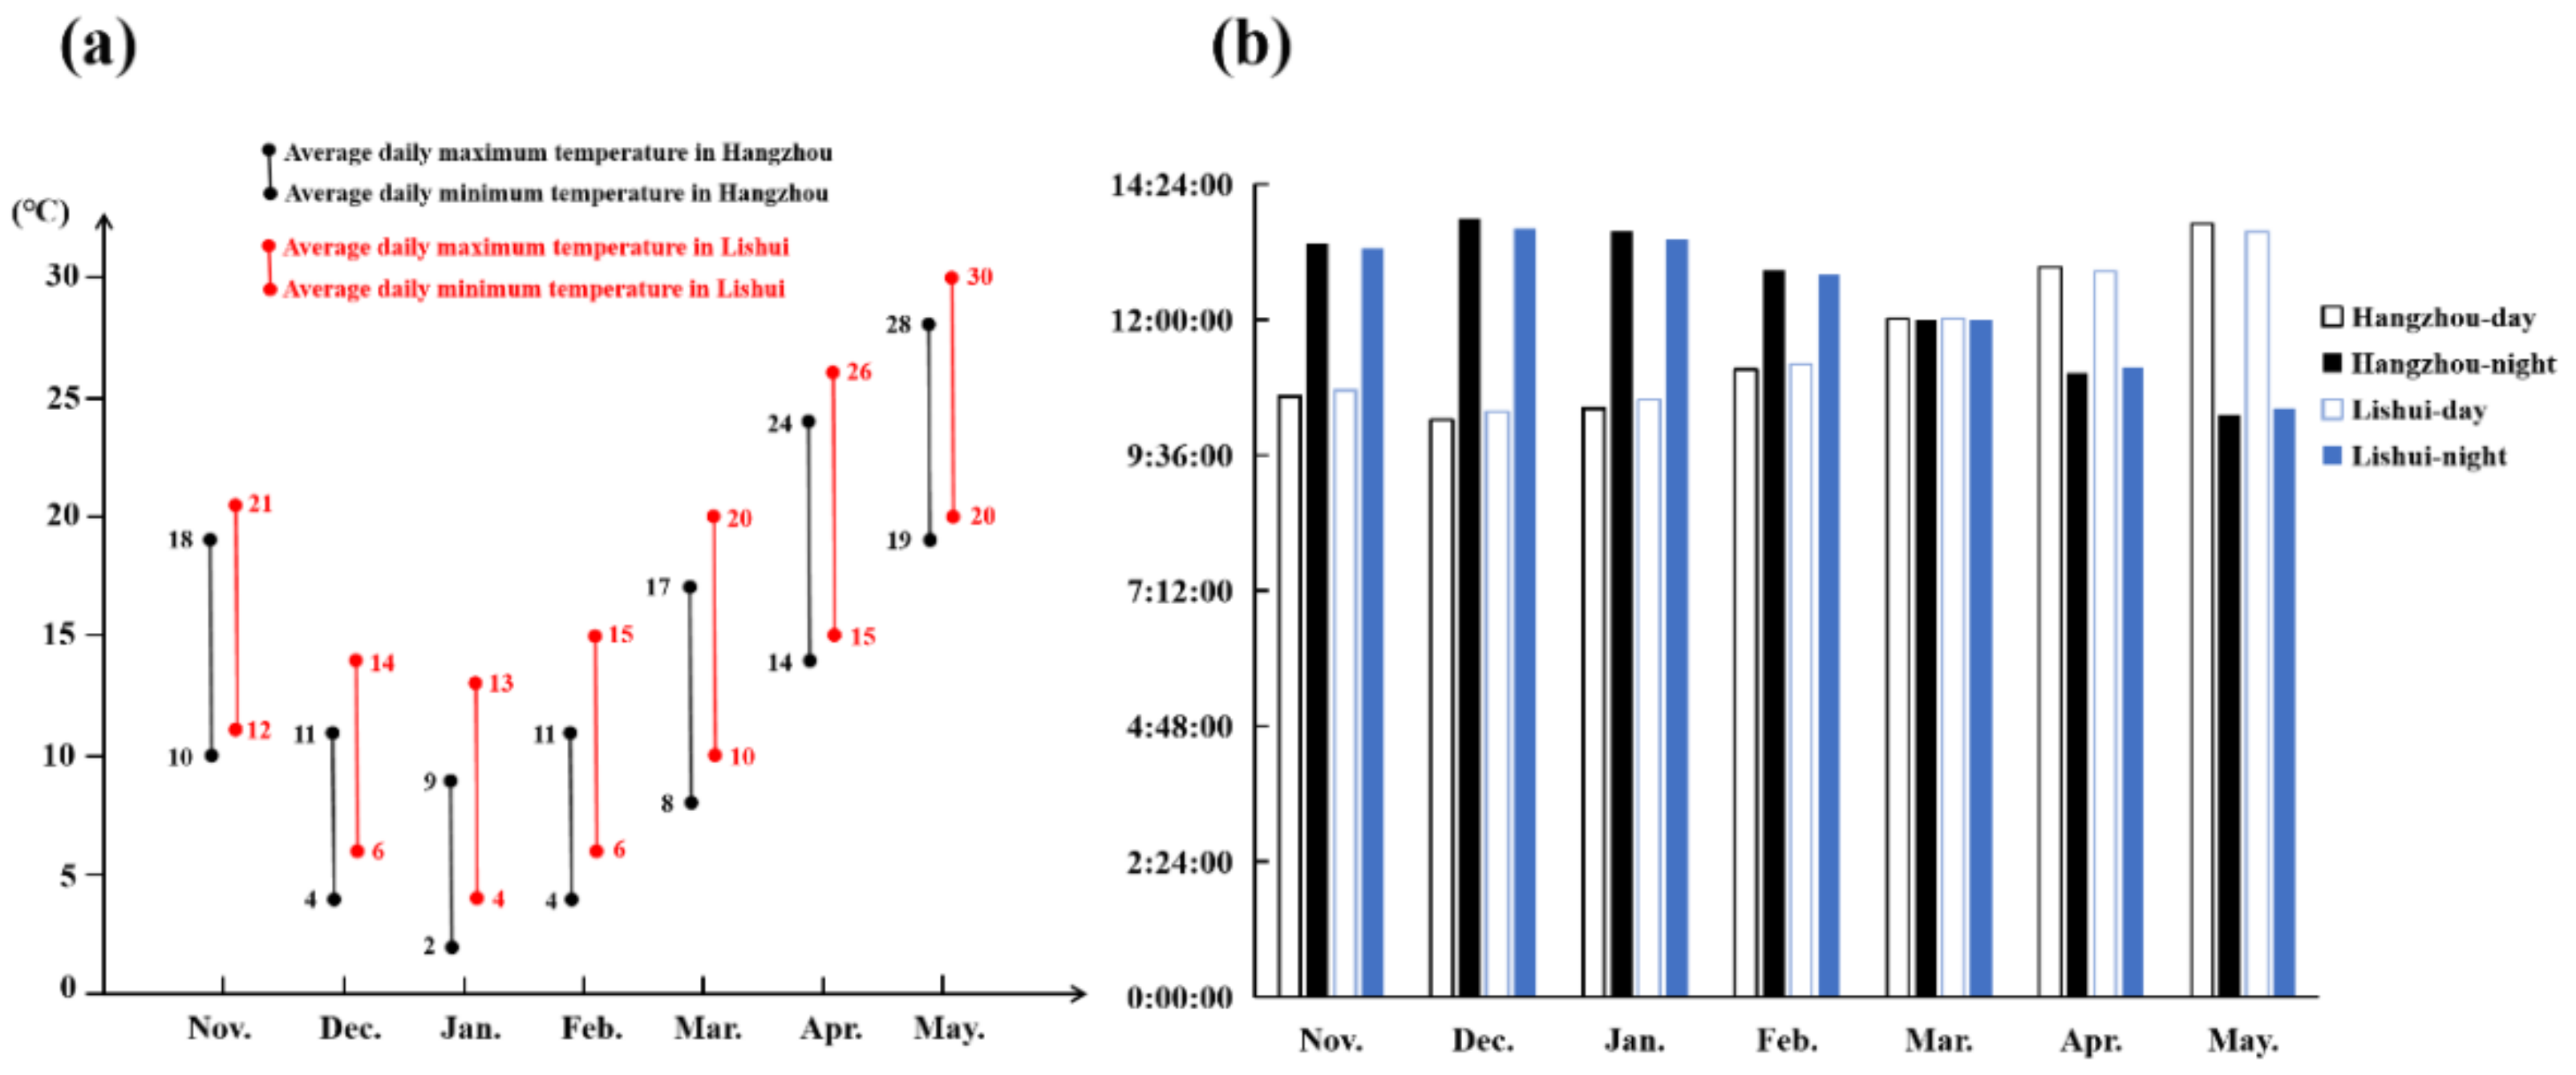
Plant flowering is affected by many factors, among which temperature and light play essential roles [9]. Vernalization pathways are extensive flowering pathways in crucifers, whose flowering requires a low temperature [20]. Nevertheless, temperature is not the only factor that affects the flowering of crucifers. NHCC belongs to the Brassica non-heading Chinese cabbage subspecies, which also includes Pak-choi (var. communis Tesn et Lee), Caitai (var. tsaitai Hort.), Fenniecai (var. multiceps Hort.), Taicai (var. taitsai Hort.), and Tacai (var. rosularis Tsen et Lee) [19]. NHCC originated from the Taihu Lake of the Lower Yangtze River in China. Research on the flowering of NHCC showed that, after low-temperature treatment, long-day conditions can promote the flowering process [29]. In this study, the flowering time of NHCC was nearly a week later under a relatively low temperature environment at Hangzhou compared to Lishui. During the cultivation, the relatively high temperature and long daytime at Lishui could promote the flowering time of NHCC (Figure 6). Combined with previous studies, we propose that a low temperature can promote the flowering of NHCC, but the effect of light, especially after low-temperature treatment, on the flowering of NHCC is also important.

Figure 6.
Statistics of temperature and light in the cultivation season. (a) The statistics of temperature during the cultivation season in Hangzhou and Lishui; (b) the statistics of the light condition in Hangzhou and Lishui.
There are several important stages during the process of plant flowering. Therefore, different target traits have been used to determine flowering traits. Rosental et al. [30] mapped the QTLs affecting lettuce bolting/flowering under four environmental conditions. In wheat, the QTLs associated with flowering were identified by flowering and maturity time [31]. Liu et al. [32] detected the QTLs that controlled bolting in Chinese cabbage and studied the effect of epistasis and locus environment interactions. The bolting and flowering time were measured to identify the QTLs that regulate flowering in radish [33]. In this study, flowering time was used as the target trait and similar mapping results in different years were obtained, and the flowering characteristics of NHCC could be measured.
Many genes are reported to be involved in the flowering time networks [5], including FT, FLC, CO, GIGANTEA (GI), FLAVIN KELCH F BOX 1 (FKF1), and FRI (FRIGIDA) [6,7,8]. The floral integrator gene FT encodes a long-distance systemic signal that moves from the leaves to the shoot meristem through the phloem [10,11,13] while CO is involved in the photoperiod pathway that activates the transcription of FT. The high expression of FT leads to early flowering in plants. FLC takes functions in the vernalization pathway by encoding an MADS-box transcription factor that represses the flowering time [34,35,36,37]. The FLC protein directly binds to the promoter region of the FT gene to repress expression and delay plant flowering [38,39]. In the shoot apical meristem, FT interacts with the bZIP transcription factor FD, forming a FT/FD heterodimer complex, which activates expression of the floral meristem identity genes, and finally results in the initiation of flower bud development [12,13,40,41,42]. Due to the whole-genome triplication event, there are multiple copies of flowering-time-controlling genes in the B. rapa genome, including four FLC, three VRN1, and two FT copies according to BRAD.
Previous studies have identified QTLs associated with flowering time in various crops [18,43,44,45]. Combined with QTL-seq and traditional mapping, the major QTL Ef2.1 that regulates flowering time was also identified using the populations constructed by broccoli × cabbage. According to the functional annotation information, the candidate gene was predicted to be BolGRF6 [46]. Gao et al. [47] used map-based cloning to identify the major QTL DTH7 that regulates flowering time in rice, which encodes the PRR family gene OsPRR37. In cucumber, a major locus on flowering time in ‘Xishuangbanna’ cucumber was identified on chromosome 1 through traditional mapping and QTL-seq. The candidate gene CsaNFYA1 and its network controlling flowering were analyzed [48]. Several QTL mapping studies have been reported on flowering time in B. rapa and have identified QTL regions where the FLC genes were predicted as candidate genes [44,49,50]. In oilseed-type B. rapa, QTL mapping and transcriptome analysis using ‘Chiifu’ and ‘LP08′ as parental materials indicated that BrFLC2 is a candidate gene for rapid flowering in the early flowering cultivar ‘LP08′ [51]. A major QTL on chromosome A02 was detected in several B. rapa populations with BrFLC2 as the candidate gene across different locations and seasons [52]. However, the research on bolting and flowering in NHCC has mainly focused on analyses of the molecular mechanisms of related genes. Moreover, due to the limitation of genomic data, previous research has mainly been based on the B. rapa genome data (BRAD; http://brassicadb.org (accessed on 9 March 2021). It is proposed that the strong effect of FLC on flowering time may obscure the effect of genes in the same pathway or other pathways [45]. In this study, we conducted a genetic mapping of QTLs controlling flowering time in NHCC through QTL-seq and identified the major QTL ft7.1 on chromosome 7. The latest NHCC genome version was used as the reference genome [19] in QTL-seq analysis, which improved the accuracy of genetic mapping. Previous studies reported two major QTLs (Flt1 and Flt2) controlling the budding time of NHCC using RIL populations that derived from non-vernalization parents [45]. The two genes Bra022475 and Bra004117 in the Chinese cabbage genome were detected as A. thaliana FT homologs, which were designated as BrFT1 and BrFT2, respectively. However, there may be functional redundancy in the two FT paralogues in B. rapa. The BrFT2 was considered as the candidate gene for flowering time in the RIL population. In this study, the A. thaliana FT homolog BraC07g031540 in the NHCC genome was identified as the candidate gene in the overlapping QTL region, which was designated as BrFT. Sequence alignment analysis revealed a high homology between Bra004117 and BraC07g031540. Despite the similar transposon insertion observed in BrFT (Figure 3) and BrFT2 [45], we found a new insertion 1577 bp in length in the promoter region of BrFT (Figure 3), which was associated with delayed flowering in B. rapa. Nonetheless, Bra004117 and BraC07g031540 had the same CDS coding region and encoded protein sequences. Thereby, this gene plays a predominant role in controlling flowering time in populations with contrasting flowering habits and could be an excellent target for the improvement of bolting and flowering in B. rapa cultivation. However, multiple genes together form a complex network that regulates plant flowering. This study lays a theoretical foundation for the location of the flowering candidate genes of non-heading Chinese cabbage and a rational method for regulating its flowering in production.
5. Conclusions
In this study, two NHCC varieties with significantly different flowering times were used to construct two F2 populations for QTL-seq analysis. One major-effect QTL ft7.1 was detected on chromosome 7 and BrFT was predicted as the candidate gene. We found a new promoter regional difference by analyzing the BrFT gene sequence in the genomes of two parents and the extreme F2 individuals. We propose that the differences in the promoter region may lead to divergent flowering times and that the BrFT gene is likely to be the main gene responsible for flowering differences in B. rapa.
Supplementary Materials
The following supporting information can be downloaded at: https://www.mdpi.com/article/10.3390/genes13071162/s1. Table S1: Summary of primer sequence information. Table S2: The Δ(SNP-index) value on Chromosome 7 in the 1-F2 population. Table S3: The Δ(SNP-index) value on Chromosome 7 in the 2-F2 population. Table S4: The Δ(SNP-index) value of the sliding window position of QTLs on Chromosome 7.
Author Contributions
Conceptualization, Q.W. and W.W.; data curation, Z.T. and H.H.; formal analysis, Q.W. and X.X.; investigation, T.H. and X.X.; methodology, T.L.; project administration, W.W. and C.B.; software, J.W.; supervision, T.L. and W.W.; validation, H.P., H.H., and Y.Y.; writing—original draft, Q.W. and T.H.; writing—review and editing, Q.W., T.H. and W.W. All authors have read and agreed to the published version of the manuscript.
Funding
This research was funded by Zhejiang Provincial Natural Science Foundation of China under Grant No. LY19C060004. Natural Science Foundation of China under Grant No. 32072575.
Institutional Review Board Statement
Not applicable.
Informed Consent Statement
Not applicable.
Data Availability Statement
Raw sequence reads have been submitted to the NCBI Sequence Read Archive under the accession number PRJNA836239.
Conflicts of Interest
The authors declare no conflict of interest.
References
- Koornneef, M.; Alonso-Blanco, C.; Peeters, A.J.; Soppe, W. Genetic control of flowering time in Arabidopsis. Annu. Rev. Plant Biol. 1998, 49, 345–370. [Google Scholar] [CrossRef] [PubMed] [Green Version]
- Ren, L.P.; Liu, T.; Cheng, Y.; Sun, J.; Gao, J.J.; Dong, B.; Chen, S.M.; Chen, F.D.; Jiang, J.F. Transcriptomic analysis of differentially expressed genes in the floral transition of the summer flowering chrysanthemum. BMC Genom. 2016, 17, 673. [Google Scholar] [CrossRef] [PubMed] [Green Version]
- Abelenda, J.A.; Cruz-Oro, E.; Franco-Zorrilla, J.M.; Prat, S. Potato StCONSTANS-like1 suppresses storage organ formation by directly activating the FT-like StSP5G repressor. Curr. Biol. 2016, 26, 872–881. [Google Scholar] [CrossRef] [PubMed] [Green Version]
- Amasino, R.M.; Michaels, S.D. The timing of flowering. Plant Physiol. 2010, 154, 516–520. [Google Scholar] [CrossRef] [PubMed]
- Fornara, F.; de Montaigu, A.; Coupland, G. SnapShot: Control of flowering in Arabidopsis. Cell 2010, 141, 550.e1–550.e2. [Google Scholar] [CrossRef] [PubMed] [Green Version]
- Parcy, F. Flowering: A time for integration. Int. J. Dev. Biol. 2005, 49, 585–593. [Google Scholar] [CrossRef] [PubMed] [Green Version]
- Song, X.M.; Duan, W.K.; Huang, Z.N.; Liu, G.F.; Wu, P.; Liu, T.K.; Li, Y.; Hou, X.L. Comprehensive analysis of the flowering genes in Chinese cabbage and examination of evolutionary pattern of CO-like genes in plant kingdom. Sci. Rep. 2015, 5, 14631. [Google Scholar] [CrossRef]
- Nie, S.S.; Li, C.; Wang, Y.; Xu, L.; Muleke, E.M.; Tang, M.J.; Sun, X.C.; Liu, L.W. Transcriptomic analysis identifies differentially expressed genes (DEGs) associated with bolting and flowering in Radish (Raphanus sativus L.). Front. Plant Sci. 2016, 7, 682. [Google Scholar] [CrossRef] [Green Version]
- Song, Y.H.; Ito, S.; Imaizumi, T. Flowering time regulation: Photoperiod- and temperature-sensing in leaves. Trends Plant Sci. 2013, 18, 575–583. [Google Scholar] [CrossRef] [Green Version]
- Kardailsky, I.; Shukla, V.K.; Ahn, J.H.; Dagenais, N.; Christensen, S.K.; Nguyen, J.T.; Chory, J.; Harrison, M.J.; Weigel, D. Activation tagging of the floral inducer FT. Science 1999, 286, 1962–1965. [Google Scholar] [CrossRef] [Green Version]
- Weigel, D.; Ahn, J.H.; Blázquez, M.A.; Borevitz, J.O.; Christensen, S.K.; Fankhauser, C.; Ferrándiz, C.; Kardailsky, I.; Malancharuvil, E.J.; Neff, M.M. Activation tagging in Arabidopsis. Plant Physiol. 2000, 122, 1003–1014. [Google Scholar] [CrossRef] [Green Version]
- Corbesier, l.; Vincent, C.; Jang, S.; Fornara, F.; Fan, Q.; Searle, I.; Giakountis, A.; Farrona, S.; Gissot, l.; Turnbull, C. FT protein movement contributes to long-distance signaling in floral induction of Arabidopsis. Science 2007, 316, 1030–1033. [Google Scholar] [CrossRef] [Green Version]
- Turck, F.; Fornara, F.; Coupland, G. Regulation and identity of florigen: FLOWERING LOCUS T moves center stage. Annu. Rev. Plant Biol. 2008, 59, 573–594. [Google Scholar] [CrossRef] [Green Version]
- Lifschitz, E.; Eviatar, T.; Rozman, A.; Shalit, A.; Goldshmidt, A.; Amsellem, Z.; Alvarez, J.P.; Eshed, Y. The tomato FT ortholog triggers systemic signals that regulate growth and flowering and substitute for diverse environmental stimuli. Proc. Natl. Acad. Sci. USA 2006, 103, 6398–6403. [Google Scholar] [CrossRef] [Green Version]
- Tamaki, S.; Matsuo, S.; Wong, H.L.; Yokoi, S.; Shimamoto, K. Hd3a protein is a mobile flowering signal in rice. Science 2007, 316, 1033–1036. [Google Scholar] [CrossRef]
- Kong, F.; Liu, B.; Xia, Z.; Sato, S.; Kim, B.; Watanabe, S.; Yamada, T.; Tabata, S.; Kanazawa, A.; Harada, K.; et al. Two coordinately regulated homologs of FLOWERING LOCUS T are involved in the control of photoperiodic flowering in soybean. Plant Physiol. 2010, 154, 1220–1231. [Google Scholar] [CrossRef] [Green Version]
- Lee, R.; Baldwin, S.; Kenel, F.; McCallum, J.; Macknight, R. FLOWERING LOCUS T genes control onion bulb formation and flowering. Nat. Commun. 2013, 4, 2884. [Google Scholar] [CrossRef] [Green Version]
- Lu, H.; Lin, T.; Klein, J.; Wang, S.; Qi, J.; Zhou, Q.; Sun, J.; Zhang, Z.; Weng, Y.; Huang, S. QTL-seq identifies an early flowering QTL located near Flowering Locus T in cucumber. Theor. Appl. Genet. 2014, 127, 1491–1499. [Google Scholar] [CrossRef]
- Li, Y.; Liu, G.F.; Ma, L.M.; Liu, T.K.; Zhang, C.W.; Xiao, D.; Zheng, H.K.; Chen, F.; Hou, X.L. A chromosome-level reference genome of non-heading Chinese cabbage [Brassica campestris (syn. Brassica rapa) ssp. chinensis]. Hortic. Res. 2020, 7, 212. [Google Scholar] [CrossRef]
- Liu, T.; Li, Y.; Ren, J.; Zhang, C.; Kong, M.; Song, X.M.; Zhou, J.; Hou, X. Over-expression of BcFLC1 from Non-heading Chinese cabbage enhances cold tolerance in Arabidopsis. Biol. Plantarum. 2013, 57, 262–266. [Google Scholar] [CrossRef]
- Huang, F.Y.; Liu, T.K.; Wang, J.; Hou, X.L. Isolation and functional characterization of a floral repressor, BcFLC2, from Pak-choi (Brassica rapa ssp. chinensis). Planta 2018, 248, 423–435. [Google Scholar] [CrossRef]
- Huang, F.Y.; Liu, T.K.; Tang, J.; Duan, W.K.; Hou, X.L. BcMAF2 activates BcTEM1 and represses flowering in Pak-choi (Brassica rapa ssp. chinensis). Plant Mol. Biol. 2019, 100, 19–32. [Google Scholar] [CrossRef]
- Wu, X.T.; Shao, S.X.; Li, Y.; Zhang, C.W.; Hou, X.L.; Shen, Z.G.; Liu, T.K. Cloning of BrCDF1 gene and protein subcellular localization and identification of its interaction with BrFKF1 in non-heading Chinese cabbage. J. Nanjing Agric. Univ. 2017, 40, 812–819. [Google Scholar]
- Zhang, B.; Liu, T.K.; Huang, F.Y.; Shao, S.X.; Wu, X.T.; Hou, X.L. Subcellular localization and interaction proteins screening of flowering gene BcFT in non-heading Chinese cabbage. J. Nanjing Agric. Univ. 2017, 40, 592–600. [Google Scholar]
- Wang, H.Y.; Ren, H.B.; Li, L.; Liu, T.K.; Cheng, Y.Q.; Hou, X.L. Cloning, subcellular localization and silencing function verification of BcGI gene involved in flowering pathway in non-heading Chinese cabbage. J. Nanjing Agric. Univ. 2019, 42, 648–656. [Google Scholar]
- Murray, M.; Thompson, W.F. Rapid isolation of high molecular weight plant DNA. Nucleic Acids Res. 1980, 8, 4321–4326. [Google Scholar] [CrossRef] [Green Version]
- Li, H.; Durbin, R. Fast and accurate short read alignment with Burrows-Wheeler transform. Bioinformatics 2009, 25, 1754–1760. [Google Scholar] [CrossRef] [Green Version]
- Livak, K.J.; Schmittgen, T.D. Analysis of relative gene expression data using real-time quantitative PCR and the 2 − ∆∆CT method. Methods 2001, 25, 402–408. [Google Scholar] [CrossRef] [PubMed]
- Wang, Z.Z.; Hou, R.X.; Li, X.F.; Zhu, H.F.; Zhu, Y.Y. Effects of vernalizaiton time on budding, bolting and flowering of pakchoi. Acta Agric. Shanghai 2013, 29, 50–53. [Google Scholar]
- Rosental, L.; Still, D.W.; You, Y.; Hayes, R.J.; Simko, I. Mapping and identification of genetic loci affecting earliness of bolting and flowering in lettuce. Theor. Appl. Genet. 2021, 134, 3319–3337. [Google Scholar] [CrossRef] [PubMed]
- Kamran, A.; Iqbal, M.; Navabi, A.; Randhawa, H.; Pozniak, C.; Spaner, D. Earliness per se QTLs and their interaction with the photoperiod insensitive allele Ppd-D1a in the Cutler x AC Barrie spring wheat population. Theor. Appl. Genet. 2013, 126, 1965–1976. [Google Scholar] [CrossRef]
- Liu, Y.T.; Li, C.Y.; Shi, X.X.; Feng, H.; Wang, Y.G. Identification of QTLs with additive, epistatic, and QTL × environment interaction effects for the bolting trait in Brassica rapa L. Euphytica 2016, 210, 427–439. [Google Scholar] [CrossRef]
- Ma, Y.; Chhapekar, S.S.; Rameneni, J.J.; Kim, S.; Gan, T.H.; Choi, S.R.; Lim, Y.P. Identification of QTLs and candidate genes related to flower traits and bolting time in Radish (Raphanus sativus L.). Agronomy 2021, 11, 1623. [Google Scholar] [CrossRef]
- Sheldon, C.C.; Burn, J.E.; Perez, P.P.; Metzger, J.; Edwards, J.A.; Peacock, W.J.; Dennis, E.S. The FLF MADS box gene: A repressor of flowering in Arabidopsis regulated by vernalization and methylation. Plant Cell. 1999, 11, 445–458. [Google Scholar] [CrossRef] [Green Version]
- Sheldon, C.C.; Rouse, D.T.; Finnegan, E.J.; Peacock, W.J.; Dennis, E.S. The molecular basis of vernalization: The central role of FLOWERING LOCUS C (FLC). Proc. Natl. Acad. Sci. USA 2000, 97, 3753–3758. [Google Scholar] [CrossRef]
- Sheldon, C.C.; Hills, M.J.; Lister, C.; Dean, C.; Dennis, E.S.; Peacock, W.J. Resetting of FLOWERING LOCUS C expression after epigenetic repression by vernalization. Proc. Natl. Acad. Sci. USA 2008, 105, 2214–2219. [Google Scholar] [CrossRef] [Green Version]
- Schmitz, R.J.; Amasino, R.M. Vernalization:a model for investigating epigenetics and eukaryotic gene regulation in plants. Biochim. Biophys. Acta 2007, 1769, 269–275. [Google Scholar] [CrossRef]
- Searle, I.; He, Y.; Turck, F.; Vincent, C.; Fornara, F.; Kröber, S.; Amasino, R.A.; Coupland, G. The transcription factor FLC confers a flowering response to vernalization by repressing meristem competence and systemic signaling in Arabidopsis. Genes Dev. 2006, 20, 898–912. [Google Scholar] [CrossRef] [Green Version]
- Deng, W.; Ying, C.; Helliwell, A.; Taylor, J.M.; Peacock, W.J.; Dennis, E.S. FLOWERING LOCUS C (FLC) regulates development pathways throughout the life cycle of Arabidopsis. Proc. Natl. Acad. Sci. USA 2011, 108, 6680–6685. [Google Scholar] [CrossRef] [Green Version]
- Abe, M.; Kobayashi, Y.; Yamamoto, S.; Daimon, Y.; Yamaguchi, A.; Ikeda, Y.; Ichinoki, H.; Notaguchi, M.; Goto, K.; Araki, T. FD, a bZIP protein mediating signals from the floral pathway integrator FT at the shoot apex. Science 2005, 309, 1052–1056. [Google Scholar] [CrossRef]
- Wigge, P.A.; Kim, M.C.; Jaeger, K.E.; Busch, W.; Schmid, M.; Lohmann, J.U.; Weigel, D. Integration of spatial and temporal information during floral induction in Arabidopsis. Science 2005, 309, 1056–1059. [Google Scholar] [CrossRef]
- Turnbull, C. Long-distance regulation of flowering time. J. Exp. Bot. 2011, 62, 4399–4413. [Google Scholar] [CrossRef] [Green Version]
- Maheswaran, M.; Huang, N.; Sreerangasamy, S.; McCouch, S. Mapping quantitative trait loci associated with days to flowering and photoperiod sensitivity in rice (Oryza sativa L.). Mol. Breed. 2000, 6, 145–155. [Google Scholar] [CrossRef]
- Zhao, J.; Kulkarni, V.; Liu, N.; Del Carpio, D.P.; Bucher, J.; Bonnema, G. BrFLC2 (FLOWERING LOCUS C) as a candidate gene for a vernalization response QTL in Brassica rapa. J. Exp. Bot. 2010, 61, 1817–1825. [Google Scholar] [CrossRef] [PubMed] [Green Version]
- Zhang, X.M.; Meng, L.; Liu, B.; Hu, Y.Y.; Cheng, F.; Liang, J.L.; Aarts, M.G.M.; Wang, X.W.; Wu, J. A transposon insertion in FLOWERING LOCUS T is associated with delayed flowering in Brassica rapa. Plant Sci. 2015, 241, 211–220. [Google Scholar] [CrossRef]
- Shu, J.S.; Liu, Y.M.; Zhang, L.L.; Li, Z.S.; Fang, Z.Y.; Yang, L.M.; Zhuang, M.; Zhang, Y.Y.; Lv, H.H. QTL-seq for rapid identification of candidate genes for flowering time in broccoli × cabbage. Theor. Appl. Genet. 2018, 131, 917–928. [Google Scholar] [CrossRef]
- Gao, H.; Jin, M.N.; Zheng, X.M.; Chen, J.; Yuan, D.Y.; Xin, Y.Y.; Wang, M.Q.; Huang, D.Y.; Zhang, Z.; Zhou, K.N.; et al. Days to heading 7, a major quantitative locus determining photoperiod sensitivity and regional adaptation in rice. Proc. Natl. Acad. Sci. USA 2014, 111, 16337–16342. [Google Scholar] [CrossRef] [Green Version]
- Tian, Z.; Jahn, M.; Qin, X.D.; Obel, H.O.; Yang, F.; Li, J.; Chen, J.F. Genetic and transcriptomic analysis reveal the molecular basis of photoperiod-regulated flowering in Xishuangbanna cucumber (Cucumis sativus L. var. xishuangbannesis Qi et Yuan). Genes 2021, 12, 1064. [Google Scholar] [CrossRef]
- Xiao, D.; Zhao, J.J.; Hou, X.L.; Basnet, R.K.; Carpio, D.P.; Zhang, N.W.; Bucher, J.; Lin, K.F.; Cheng Wang, X.W. The Brassica rapa FLC homologue FLC2 is a key regulator of flowering time, identified through transcriptional co-expression networks. J. Exp. Bot. 2013, 64, 4503–4516. [Google Scholar] [CrossRef] [Green Version]
- Kitamoto, N.; Yui, S.; Nishikawa, K.; Takahata, Y.; Yokoi, S. A naturally occurring long insertion in the first intron in the Brassica rapa FLC2 gene causes delayed bolting. Euphytica 2014, 196, 213–223. [Google Scholar] [CrossRef]
- Kim, S.; Kim, J.A.; Kang, H.; Kim, D.H. A premature stop codon in BrFLC2 transcript results in early flowering in oilseed-type Brassica rapa plants. Plant. Mol. Biol. 2022, 108, 241–255. [Google Scholar] [CrossRef] [PubMed]
- Lou, P.; Zhao, J.J.; Kim, J.S.; Shen, S.; Bonnema, G. Quantitative trait loci for flowering time and morphological traits in multiple populations of Brassica rapa. J. Exp. Bot. 2007, 58, 4005–4016. [Google Scholar] [CrossRef] [PubMed] [Green Version]

Publisher’s Note: MDPI stays neutral with regard to jurisdictional claims in published maps and institutional affiliations. |
© 2022 by the authors. Licensee MDPI, Basel, Switzerland. This article is an open access article distributed under the terms and conditions of the Creative Commons Attribution (CC BY) license (https://creativecommons.org/licenses/by/4.0/).