1. Introduction
One’s level of motor ability development depends on many factors. One of the most important factors is genetics, which accounts for up to 66% of the variance in sports performance [
1]. Motor abilities from the sports genetics point of view are among the traits with polygenic inheritance, which means that one phenotype results from the effect of several genes. The influence of individual genes can be different. Determining the effect of individual genes on sports performance is a difficult task, as other factors also contribute to the overall phenotype. For example, adaptation mechanisms, such as the supercompensation effect, have a significant impact, especially on motor abilities. The supercompensation effect, or supercompensation, is a complex reaction-adaptation mechanism that represents a set of responses provided by various physiological systems to an external stimulus (stress stimulus) or influence, which in our case is the external physical load. During supercompensation, there is an increase in all the levels of fitness, coordination abilities and psychological properties compared to the state before the stimulus [
2]. In the professional literature, the term supercompensation is often used for the process when, after a load, depleted energy reserves are restored, and their level reaches a higher level than before the load. Supercompensation thus represents a mechanism of adaptation to stress created by an external load [
3]. Supercompensation differs between individuals and also depends on the state of the adaptation itself, in which the threshold value of the stress stimulus is different for differently adapted individuals, e.g., it is different between elite athletes and beginners [
4]. In terms of the speed of response and its effect, we can divide supercompensation into an immediate supercompensation effect, which occurs after just one training load, and a long-term supercompensation effect, which occurs after several training loads, or after a longer time horizon—weeks, months, even years [
2,
4]. During the immediate supercompensation effect, in addition to a higher supply of exhausted resources, there is also neuromuscular activation, or post-activation potentiation of the neuromuscular system, which peaks 4–15 min after a specific load [
5]. Long-term supercompensation results from the cumulative effect of several training loads and thus immediate supercompensation and represents a more permanent state compared to transient physiological changes—an increased level of energy resources, hypertrophied muscles, etc. [
3,
6]. Genetic make-up affects and plays a significant role in the adaptability of motor abilities. Of course, genetic predisposition in itself does not automatically ensure an adapted state; it begins to adapt only after the action of an external physical load, specifically depending on the nature of the load. Different abilities and skills are needed in individual sports disciplines, in which specific gene variants can be advantageous. Athletes possessing the given variants can have higher limits and achieve better sports performances [
7]. We partly understand that an individual with favourable abilities and skills for a given sports discipline, a talent for sports, has an optimal genetic makeup for a given sports performance [
8]. From the point of view of elite sport, strong selection thus affects individuals also from the point of view of “sports genes” [
9].
The
ACE gene was the first gene to be linked to sports performance. The gene codes the angiotensin-1 converting enzyme, part of the RAAS system (renin-angiotensin-aldosterone system), regulating circulatory homeostasis (circulation and blood pressure), cardiovascular functions and skeletal muscle growth. The
ACE gene has an insertion–deletion (indel) polymorphism (polymorphism code—rs4646994) with a sequence length of 287 base pairs resulting from an Alu repeat sequence that inserts into intron 16 [
10,
11]. This is how three
ACE genotypes arise—II homozygote, DD homozygote and ID heterozygote. Many studies have described a higher representation of the I allele in endurance athletes, such as marathon runners, endurance athletics, rowers, mountaineers or middle- (200–400 m) and long-distance (over 400 m) swimmers, in which the frequency of the I allele increases with increasing length disciplines [
12,
13]. The I allele was connected with better Yo-Yo endurance test results, a higher representation of slow muscle fibres (type I), better resistance to fatigue and a higher cardiac output with better peripheral oxygenation of tissues during physical exercise [
14,
15,
16,
17,
18,
19]. The homozygous deletion (DD) genotype was associated with increased muscular performance in individual strength-oriented sports. It was found, for example, that the D allele was dominant in speed-strength-oriented athletes, such as sprinters and short-distance swimmers or weightlifters. The probands of the DD genotype responded to physical stress with greater hypertrophic growth of the left heart ventricle (up to 2.7 times) and greater hypertrophic and hyperplastic growth of skeletal muscles compared to the II genotype in response to exercise [
20,
21,
22]. Williams et al. (2005) found that ACE-mediated activation of angiotensin II and deactivation of bradykinin leads to higher muscle volume, higher muscle strength and a higher proportion of type II muscle fibres [
23,
24].
The
ACTN3 gene codes the α-actinin 3, a structural protein of muscle fibres. This protein is specifically expressed in type II skeletal muscle fibres (mainly fast glycolytic) and is often referred to as the “speed gene” [
11]. It has a connecting role between actin filaments in the Z-line region of the sarcomere, ensuring stability during contractions with a high speed and explosive character [
12]. A known polymorphism of the
ACTN3 gene is the R577X (rs1815739) non-sense mutation, categorised as an SNP (single-nucleotide polymorphism), in which the C base is changed to a T, leading to a change in the amino acid sequence: arginine (R) to a premature stop codon (X). The homozygous X allele results in a complete lack of α-actinin-3 expression, which occurs in an average of 20% of the world’s population [
25]. According to several studies, the X allele has a higher representation in endurance-oriented athletes, with a type I muscle fibre domination (long-distance running and swimming). The X allele also correlates with less muscle mass and lower strength. XX genotype probands have a higher VO
2max baseline than RR genotype carriers [
17,
26,
27,
28]. The XX genotype was also associated with increased cardiovascular fitness [
29]. On the other hand, a strong correlation has been described by several studies between a higher frequency of the R allele and athletes of speed-power sports disciplines (weightlifting, sprints, short-distance swimming, etc.). In a study by Yang et al. (2003), none of the observed speed-power-oriented athletes at the Olympic Games were carriers of the XX genotype [
26]. Carriers of the R allele, especially the RR genotype, had a higher representation of type II muscle fibres and showed higher muscle strength and better results in strength and speed-power [
30], i.e., a better score on the seven continuous vertical jumps test, greater maximal isoinertial force, higher maximal strength and greater muscle volume after 9 weeks of lower extremity resistance training [
17,
28,
31]. The R allele was also associated with a greater adaptive response to strength training [
32].
The
PPARA gene encodes the nuclear receptor protein PPARA (peroxisome proliferator-activated receptor α), a transcription factor [
33], which is the main regulator of lipid metabolism—it supports the uptake, utilisation and catabolism of fatty acids. Furthermore, it is vital from the side of energy glucose homeostasis and vascular inflammation. It is activated in conditions of energy deprivation and metabolic and physiological stress, including physical activity in tissues that catabolise fatty acids, such as liver, skeletal (mainly type I) and cardiac muscle tissue [
34].
PPARA has a significant role in the adaptive response to endurance training [
33,
35]. The most frequently analysed genetic variant is the polymorphism G/C (rs4253778). Genotypes containing the G allele were identified in endurance athletes [
33], especially the GG genotype, which was associated with increased fatty acid oxidation in skeletal muscle. Its frequency was correlated with a higher proportion of slow-twitch type I muscle fibres, which use oxygen more efficiently during continuous muscle activity. Endurance athletes have relatively more slow type muscle fibres than fast type, enabling sustained muscle contraction over a more extended period [
36,
37]. In addition, the GG genotype has been shown to correlate with high oxygen pulse values [
38]. On the other hand, the C allele was highly represented in speed-power-oriented athletes, in which the representation of type II muscle fibres was higher. Overall, C allele carriers had better anaerobic performances [
39]. Athletes with the C allele, but especially with the CC genotype, had greater grip strength, showed better results in the Wingate test (WT30) and had greater muscle mass and contraction strength [
31,
40,
41]. According to Alvarez-Romero et al. (2020), the C allele represents a significant advantage for the trainability of strength abilities [
42]. The mentioned polymorphism also correlates with the growth of the left ventricle as an adaptation to external physical load, in which homozygotes of the C allele had a three-fold enlargement, and heterozygotes had a two-fold enlargement [
18]. Petr et al. (2014) found statistically significant differences in maximal relative performance [Pmax·kg
−1] in WT30 between carriers of the C allele and the GG genotype. According to their results, C allele carriers showed higher speed-strength performances in WT30 [
41]. Additionally, the results show a probable metabolic advantage of the C allele in trained individuals for anaerobic metabolism [
35,
41].
Hypoxia is an insufficient supply of oxygen to the cells and tissues [
43]. This condition is typical for strength-oriented sports disciplines, in which a lack of oxygen (exercise-induced hypoxia) is observed in the muscle tissue. The efficiency of energy supply to skeletal muscle in a hypoxic state depends on many factors affecting the “high anaerobic potential”—i.e., ATP reserves, the concentration and activity of enzymes of glycolysis and the phosphagen system, creatine phosphate, glycogen, etc. [
36,
44]. In human cells, oxygen homeostasis is regulated by the transcription factor—hypoxia-inducible factor-1 (HIF1) [
45], which is recognised as a “master gene” that regulates the expression of downstream genes, ensuring the adaptation of cells to low oxygen partial pressure [
46]. HIF1 is expressed in all human tissues, including skeletal muscle (mainly in fast glycolytic muscle fibres). HIF1 is a dimeric protein composed of the regulatory subunit HIF1A and the constitutively expressed subunit HIF1B [
47]. Under normoxic conditions, HIF1A undergoes rapid degradation. Conversely, under hypoxic conditions, it is stabilised, binds to HIF1B and translocates to the nucleus, where it activates other genes in the pathway. A missense SNP polymorphism (rs11549465, C/T) of the
HIF1A gene results in the substitution of proline at amino acid 582 to serine (Pro582Ser), and increases the stability of the HIF1A protein. This increases the hypoxic resistance of cells and improves glucose metabolism [
46]. Increases in HIF1A protein (but not mRNA levels) and increased transcription of HIF1 target genes such as EPO and VEGF have been acutely demonstrated in humans during single-leg knee extensor exercise. Using hypoxia as an additional stimulus in endurance training, increased levels of
HIF1A mRNA were found in subjects training for several weeks under conditions of high- or low-intensity muscle hypoxia. Similarly, adding training units that create hypoxic muscle conditions led to a significant modulation of the expression profile of muscle genes, which was not observed at muscle normoxia [
44,
48]. These data indicate that carriers of the Ser allele of the
HIF1A gene are more predisposed to strength-oriented exercise than Pro/Pro homozygotes. Carriers of the Pro/Ser genotype in m. vastus lateralis had a significantly higher percentage of type IIX muscle fibres (fast glycolytic), mainly used in disciplines requiring a high level of explosive power. The Pro/Ser heterozygotes had a significantly higher prevalence among weightlifters and other strength-oriented athletes than in the control group [
46,
49,
50,
51].
Our selection of genes ACE, ACTN3, HIF1A and PPARA was based on the results of previous studies, as the polymorphisms’ effects on sports performance and adaptation to training load had been proven. Our gene polymorphism palette affects the composition of muscles, such as the proportion of fast and slow twitch muscle fibres, the lipid and glucose metabolism of muscles, VO2max levels, oxygen consumption and adaptation to hypoxia in muscles; we presumed that these have an essential role in training adaptation in general and on immediate supercompensation. We wanted to study their effects on the immediate supercompensation individually and in combination to evaluate their significance. Moreover, as elite athletes represent adapted individuals to the training load, we wanted to assess their effects in the adapted-athlete group compared with the non-adapted control group to evaluate their role in the training adaptation process.
2. Materials and Methods
Subjects: The experimental group (age 23.65 ± 3.46 years; height 182.51 ± 7.25 cm; body weight 72.9 ± 7.67 kg) consisted of 64 male athletes from the highest performance class of the Slovak Republic from the following sports disciplines: endurance running (n = 23) and football (n = 41). Football players were represented by players of the 1st and 2nd Slovak football leagues. The disciplines of endurance runners included middle- (1500 m) and long-distance (3000 m, 5 km, 10 km) runs. The inclusion criteria for the experimental group were as follows: male professional or elite athlete status (national representatives, national- or international-level competitors, top athletes in the country in the sports discipline) training at least four times per week and aged 18–35. Exclusion criteria: injured or ill athletes and athletes who were not continuously training in the last six. The control group (age 19.91 ± 0.66 years, height 182.09 ± 6.03 cm, body weight 73.94 ± 10.10 kg) consisted of 54 male probands from the general population with a predominantly sedentary lifestyle within a comparable environment to the experimental group, who completed training loads as part of compulsory physical education at the university once a week. The exclusion criteria for the control group were injury, illness, and training on top of the compulsory physical education at the university. All probands were Caucasian. The recruitment of eligible participants was made continuously after the approval of the ethical committee with the help of professional football clubs, representatives and national coaches of the discipline. The recruitment of the control group was made with the help of university physical education teachers. The process and purpose of the research project were explained to the probands, who afterwards agreed to participate and signed the informed consent, which was constructed in accordance with the decision of the Ethics Committee of the Faculty of Natural Sciences, Comenius University, in Bratislava, under the registration numbers ECH19013 and ECH19015.
Genotypization: DNA was isolated from the buccal swab using a standard protocol with a 5% Chelex solution. The purity and concentration of the isolated DNA were verified by spectrophotometric analysis with a nano photometer (Implen) from a sample of 1 μL of purified DNA. Based on the measured sample concentration, we determined the volume of DNA required for the subsequent PCR reaction. The volume of the PCR reaction was 20 μL, and the DNA concentration was 300–400 ng per PCR reaction. My Taq DNA polymerase (Bioline) was used with 5× My Taq Reaction Buffer (Bioline). The temperature of annellation was optimised by the gradient PCR for each gene. The PCR conditions were as follows: initial denaturation for 8 min at 95 °C, and 35 cycles with denaturation of 1 min at 95 °C, annealing for 45 s at 58 °C (
ACE), 58.7 °C (
ACTN3 and
HIF1A) and 50 °C (
PPARA) with an extension for 45 s at 72 °C, and a final extension at 72 °C for 10 min. After the PCR reactions, the specificity of the products was verified on 2% agarose gel. Excluding the
ACE gene (in which the genotypes were detected by the length of the bands on gel as stated below), the products of all other genes (
ACTN3,
HIF1A,
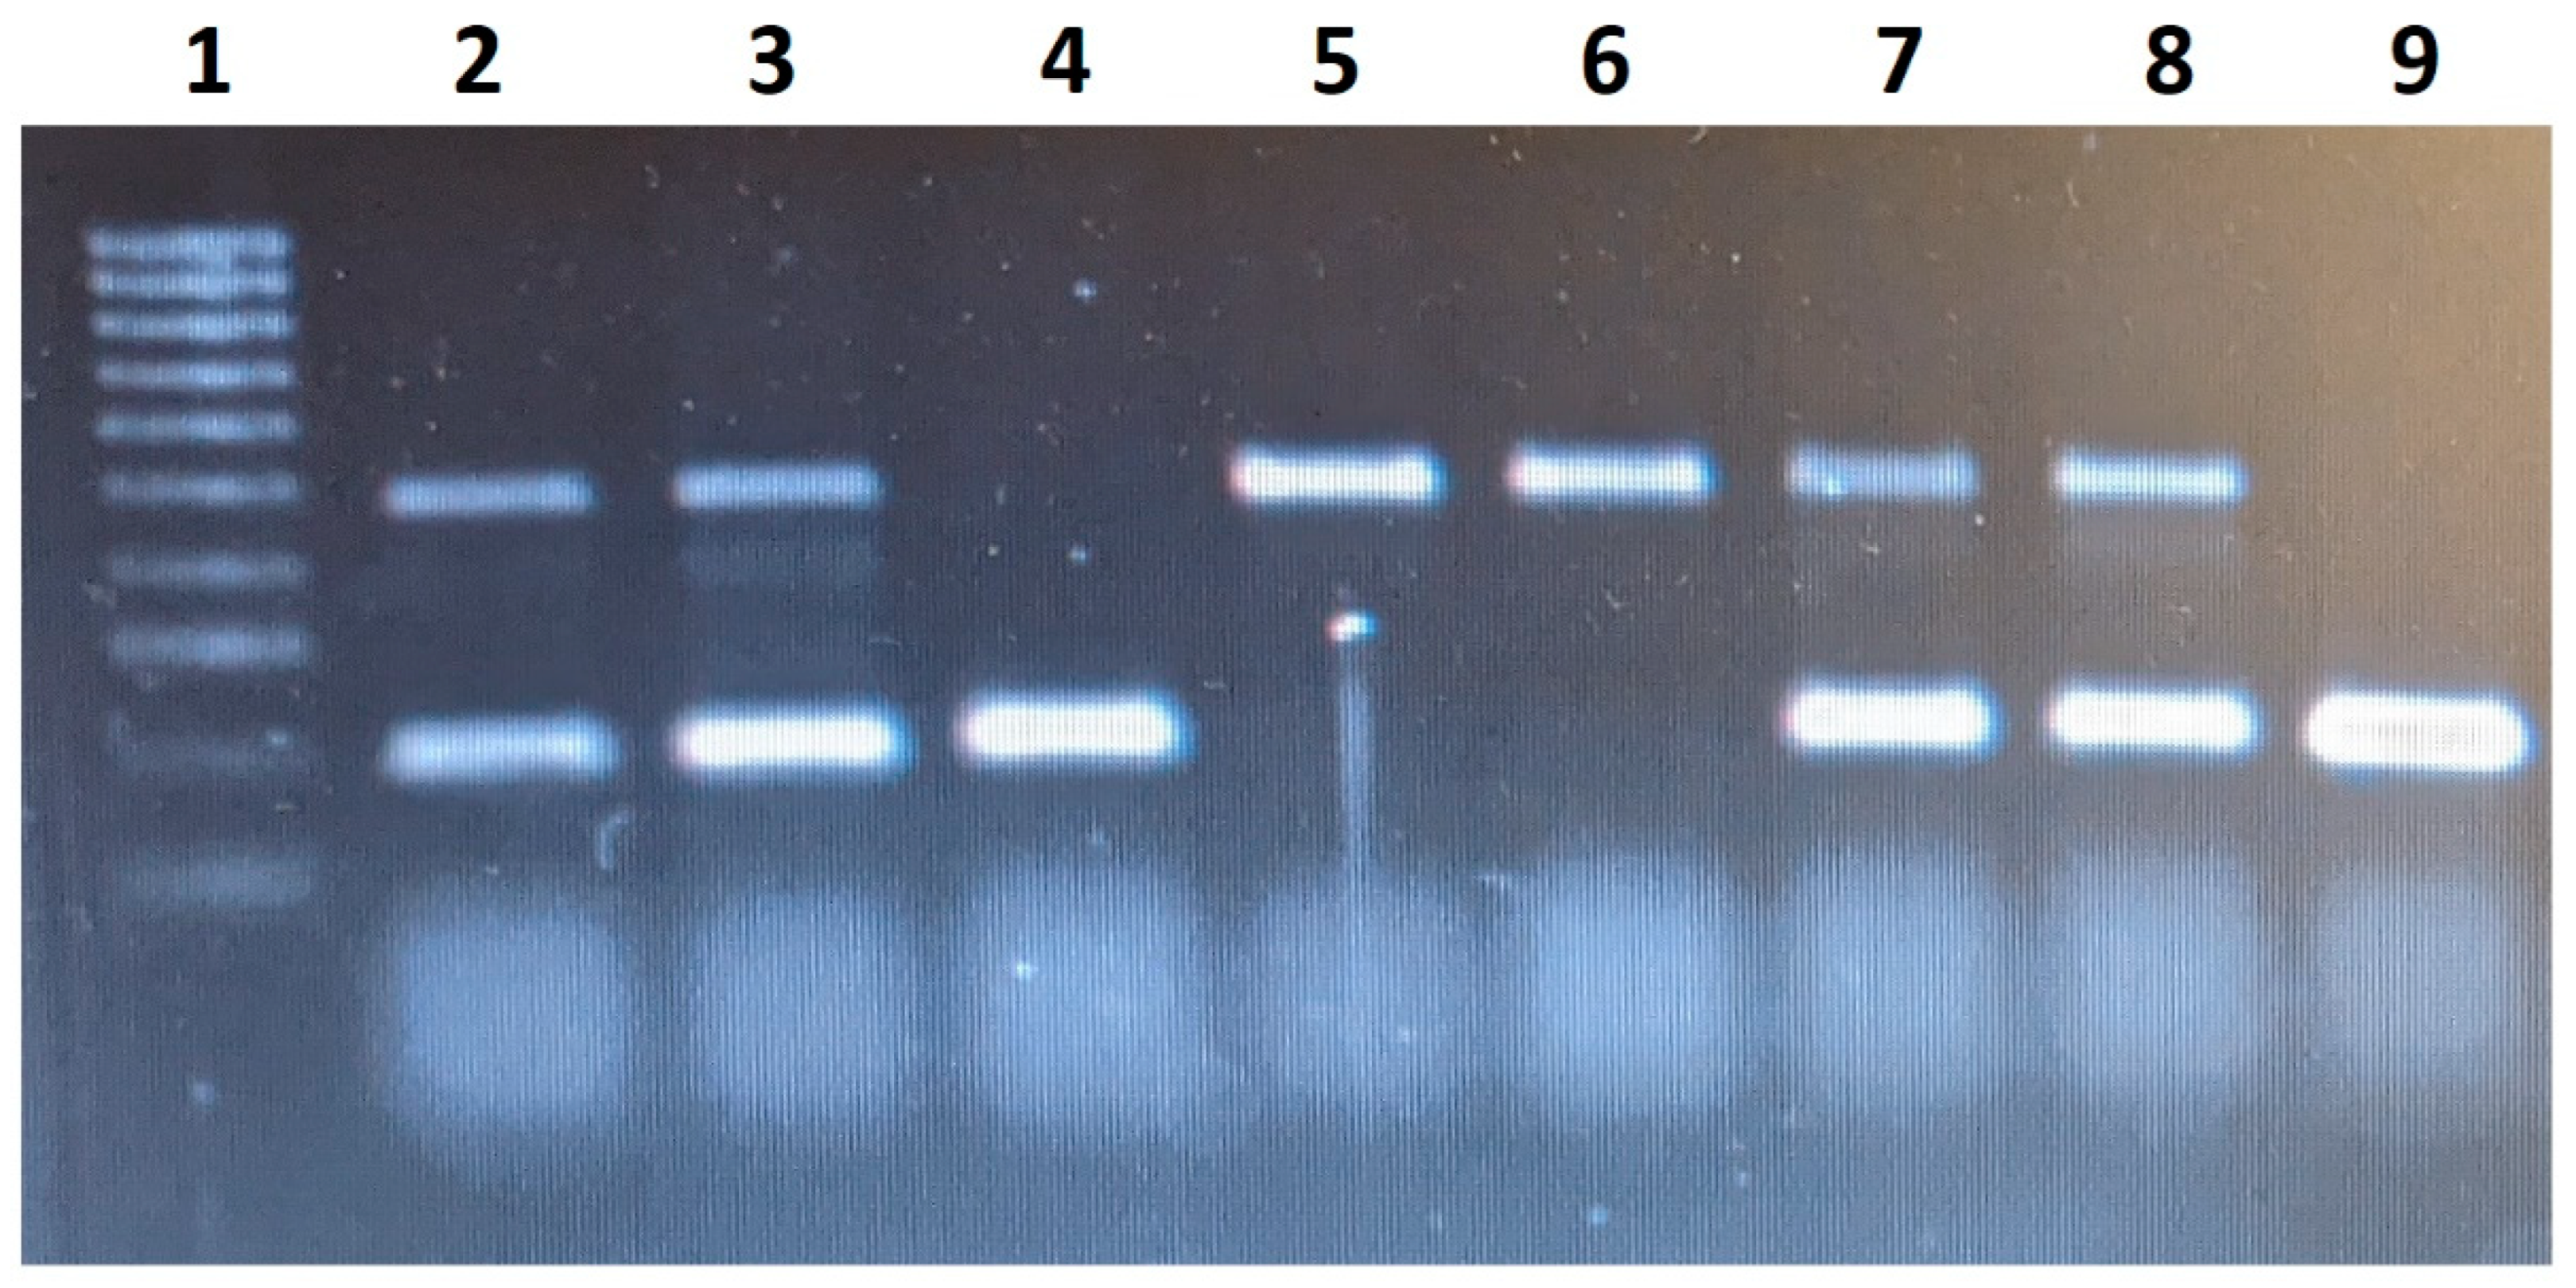
PPARA) were then sent to a certified sequencing laboratory Microsynth Austria GmbH (ISO 9001:2015, ISO/IEC 17025:2017, STS 0429). PCR was used to detect the I and D alleles of the
ACE gene (rs1799752) according to the method described by Tiret et al. [
52] using PCR primers as follows: forward 5′-CTGGAGACCACTCCCATCCTTTCT-3′ and reverse 5′-GATGTGGCCATCACATTCGTCAGAT-3′. This method yields a PCR fragment of 190 bp and 490 bp in the presence of the D and the I alleles, respectively. Genotypes II and DD had one band of correspondent size, and genotype ID had two bands. Bands representing the different lengths of alleles of the
ACE gene are shown in
Figure 1.
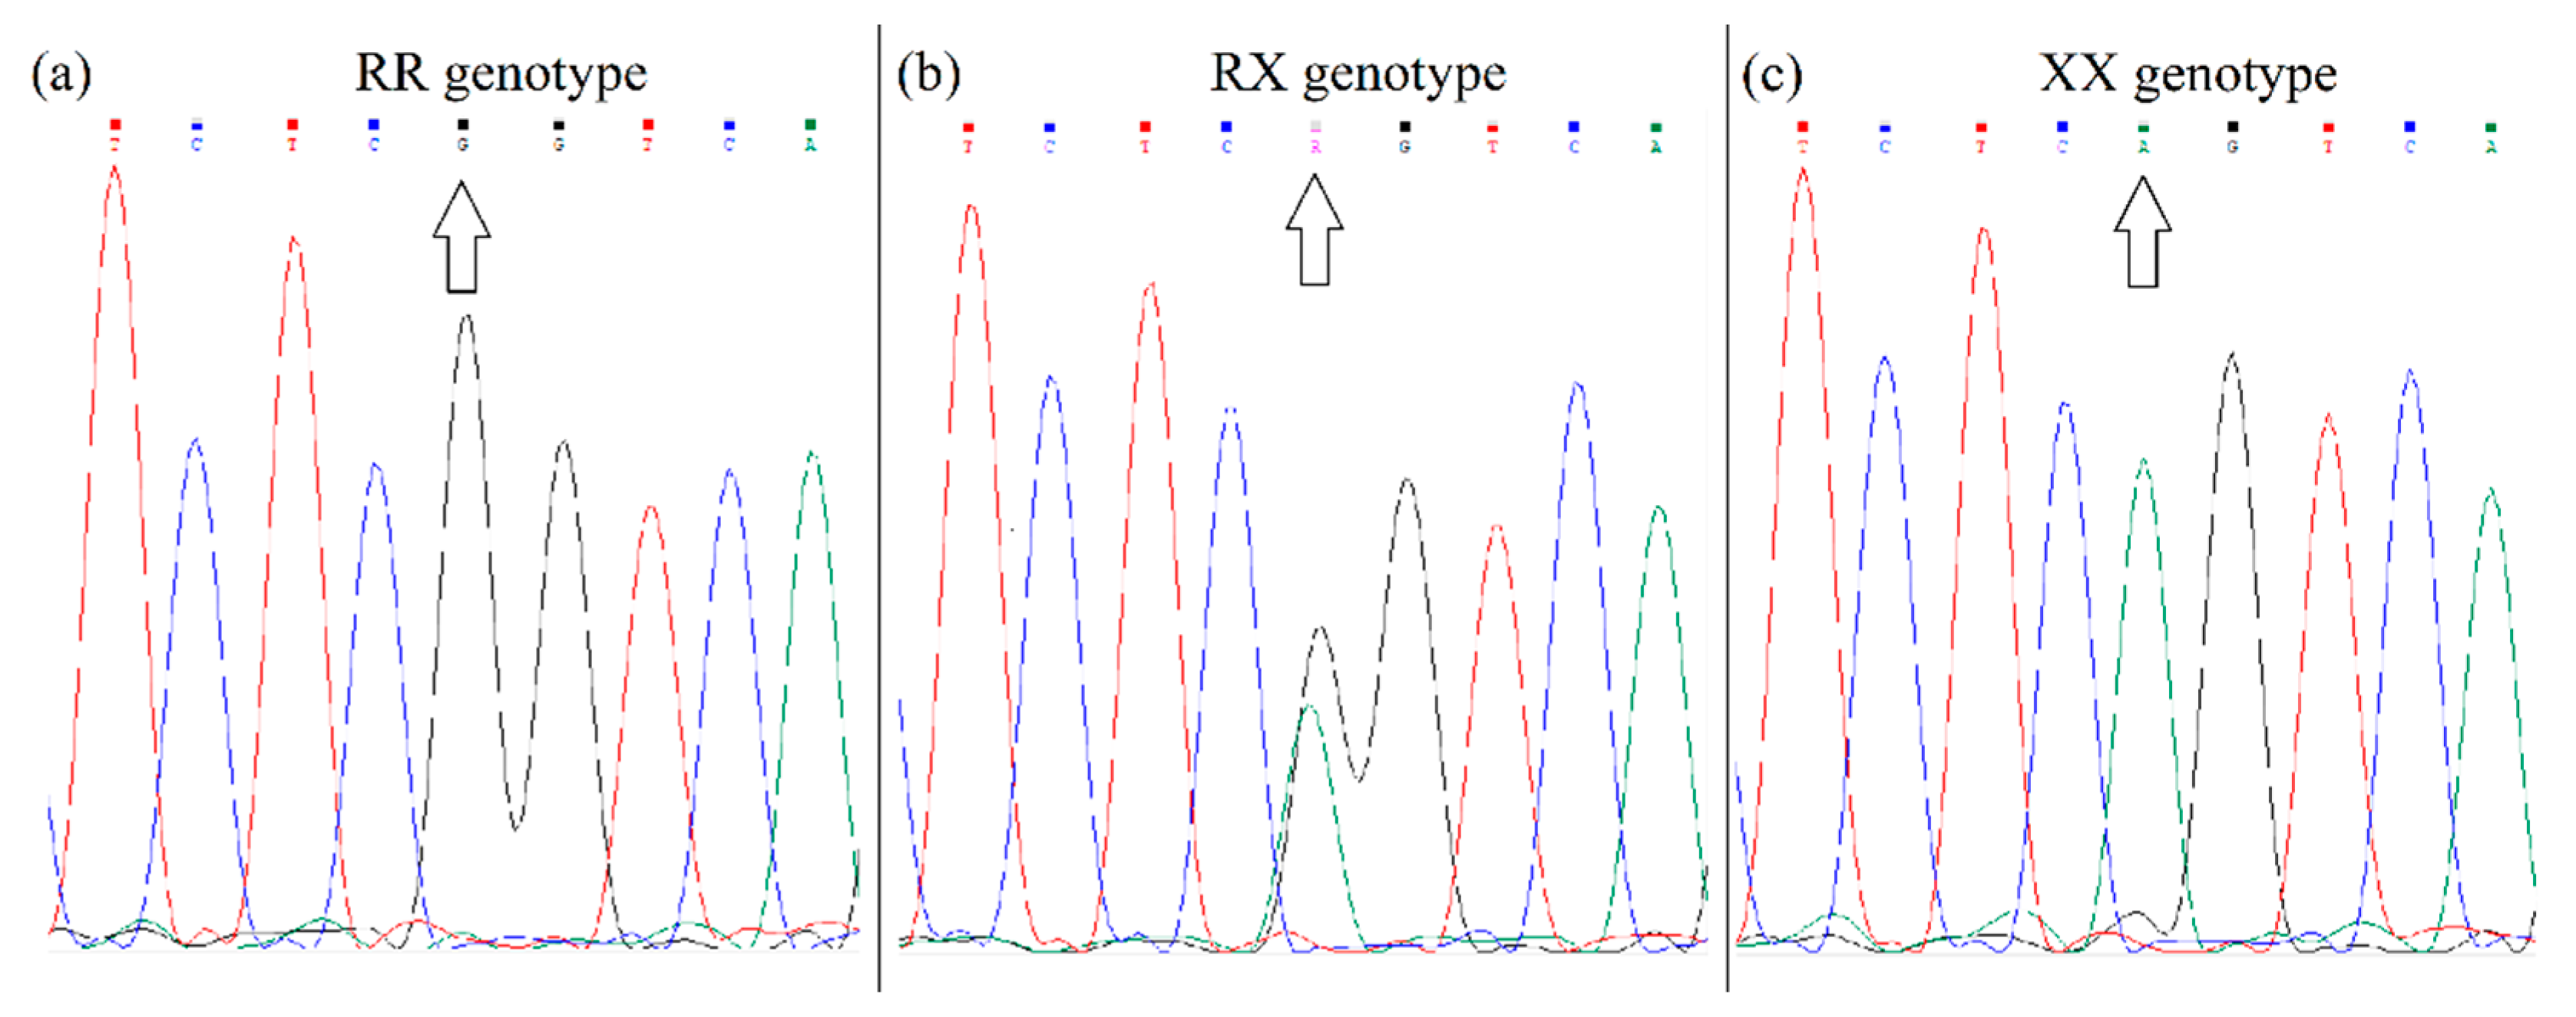
Genotyping of
ACTN3 R577X polymorphism (rs1815739) was performed using a PCR with primers: forward 5′-CAGCGCACGATCAGTTCAAG-3′ corresponding to a sequence in exon 15; and reverse 5′-AATCCCACGTGGAGTCTGTG-3′ corresponding to sequence in intron 15. The amplified products of 307 bp were sequenced (Microsynth). The fluorograms of the different alleles after sequencing are shown in
Figure 2.
A PCR was used to detect
PPARA gene polymorphism (rs4253778) according to the method described by Flavell et al. [
53] using PCR primers as follows: forward 5′-ACAATCACTCCTTAAATATGGTGG-3′; and reverse 5′-AAGTAGGGACAGACAGGACCAGTA-3′, generating a fragment of 266 bp. The PCR products were sequenced (Microsynth). The fluorograms of the different alleles after sequencing are shown in
Figure 3.
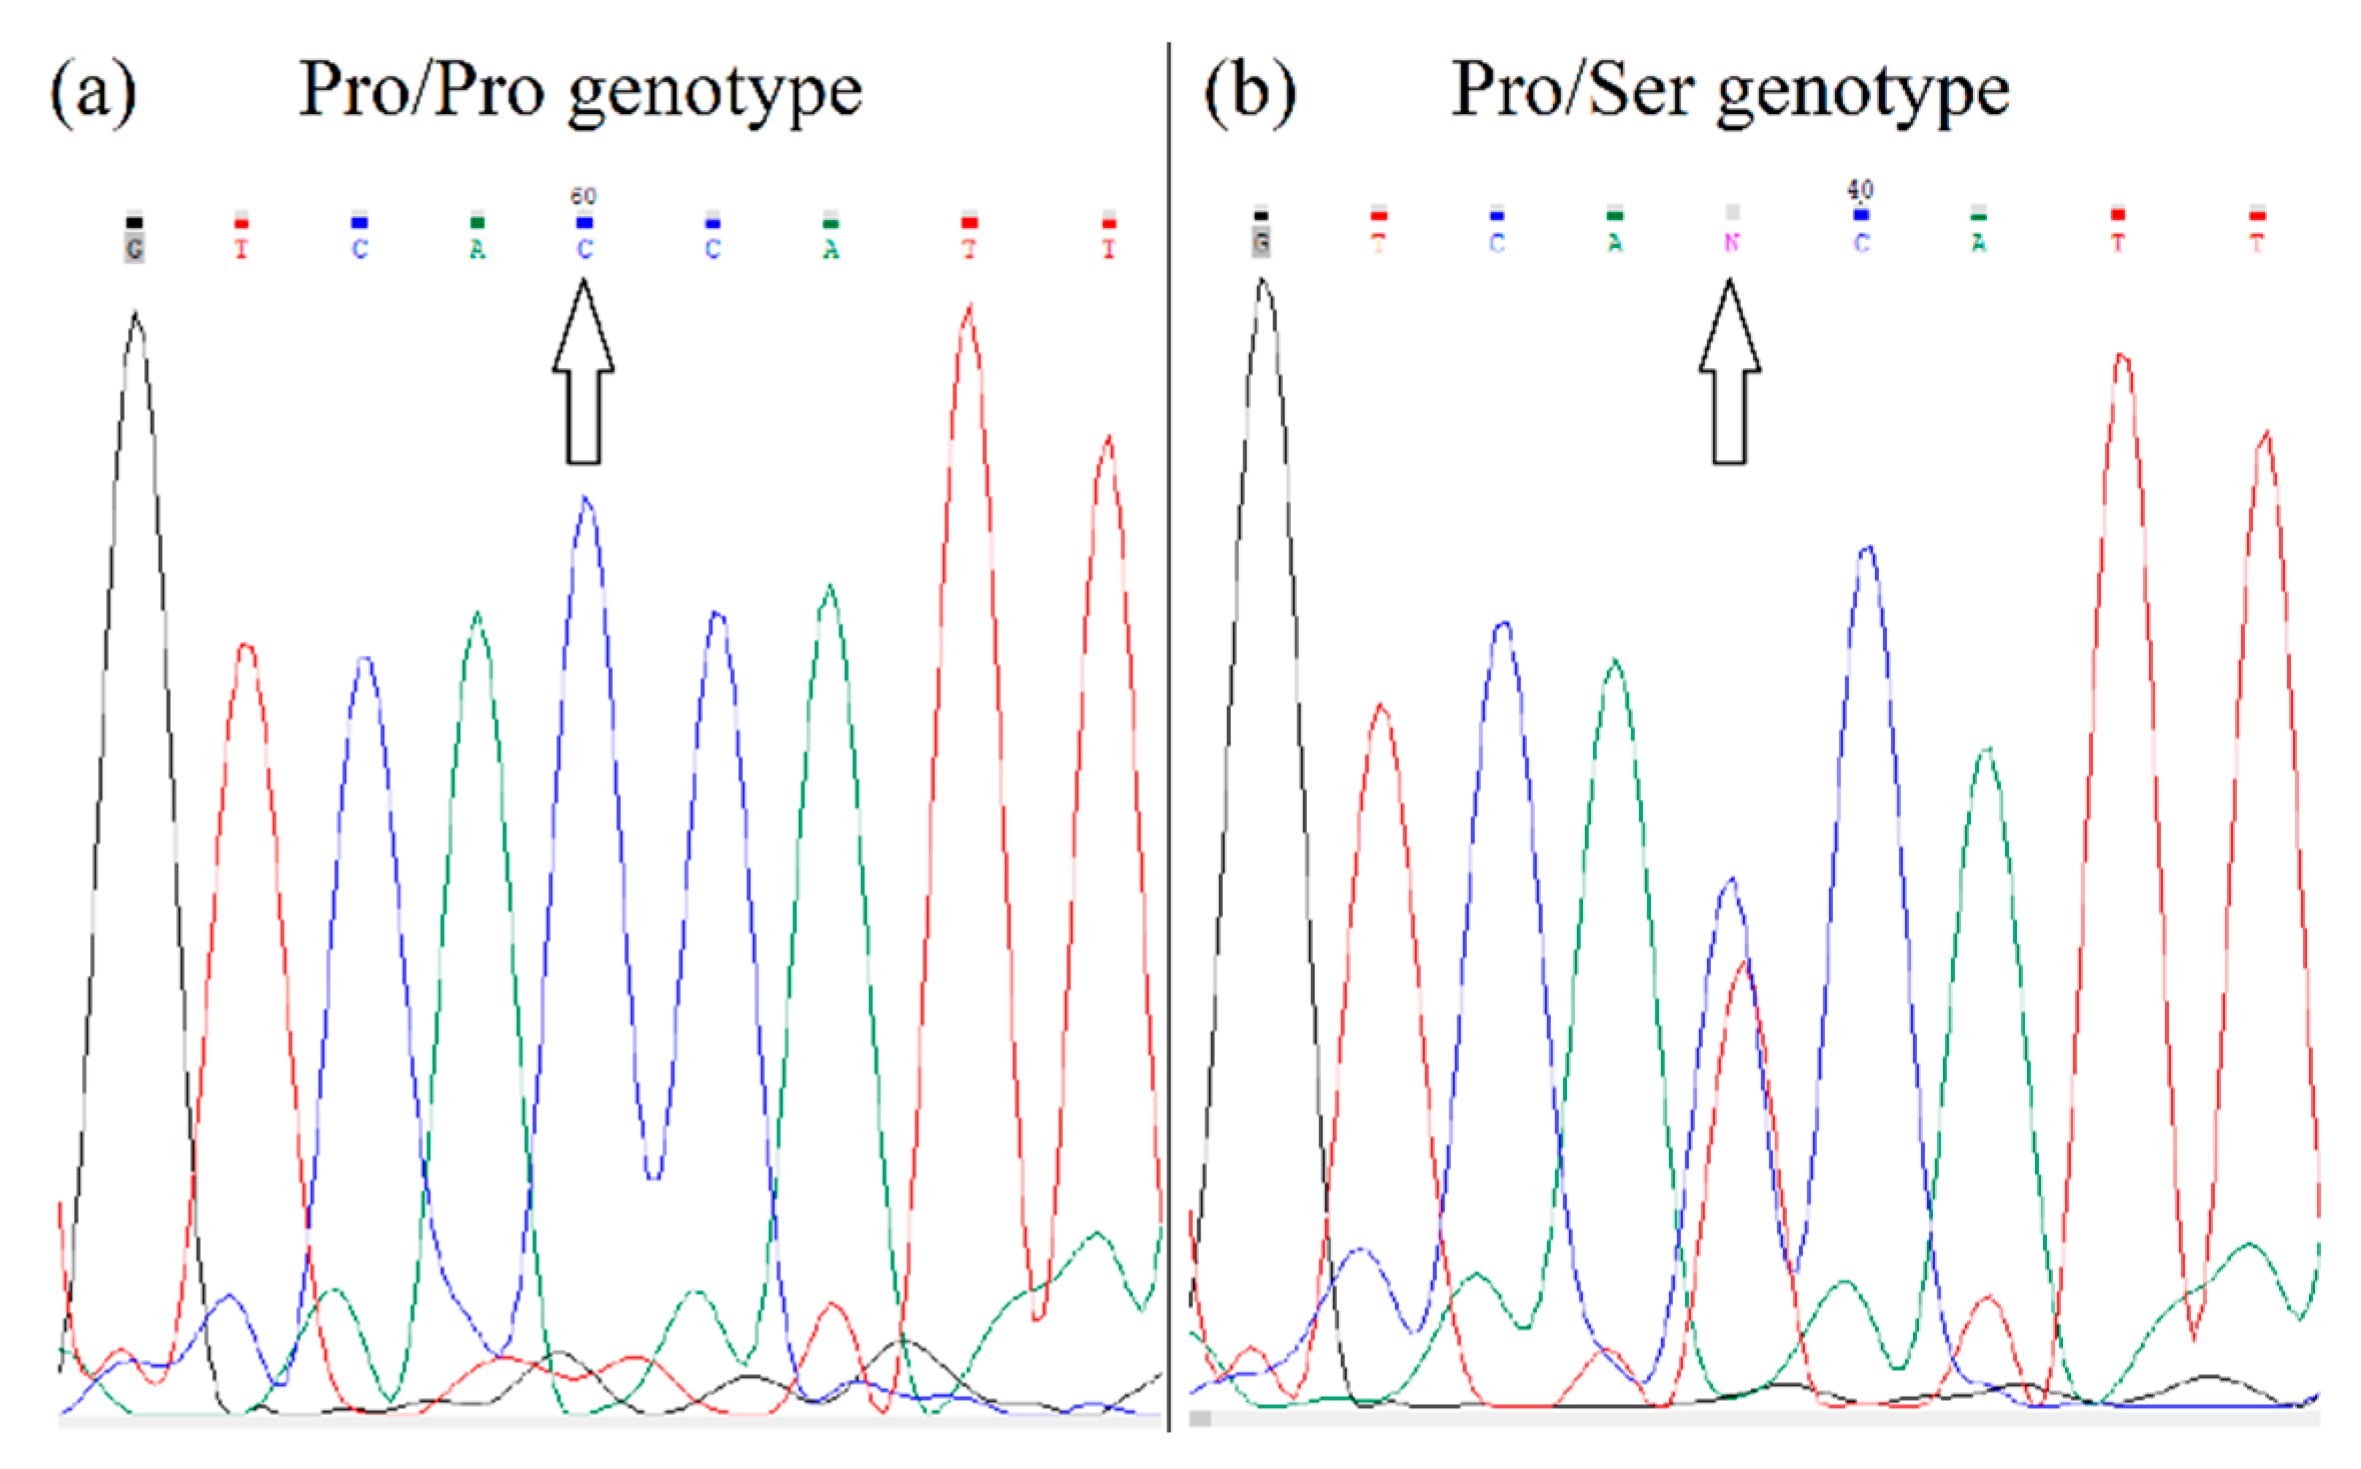
Genotyping of
HIF1A polymorphism (rs11549465) was performed using a PCR with primers: forward 5′-AGGTGTGGCCATTGTAAAAACT-3′ corresponding to sequence in intron 11; and reverse 5′-AATTCATCAGTGGTGGCAGTG-3′ corresponding to sequence in exon 12. The PCR products of 255 bp were sequenced (Microsynth). The fluorograms of the different alleles after sequencing are shown in
Figure 4.
Motor tests: The immediate supercompensation effect was evaluated based on the differences in the parameters of the 10 s continuous vertical jump test (CJ10) measured by Optojump (Bolzano, Italy). The probands performed their jumps with their legs outstretched and their hands on their hips, and they tried to jump as high and take off as fast as possible [
54]. By completing jumps with outstretched legs, we aimed to prevent the effect of the stretch-shortening cycle (SSC), in which the elastic abilities also play a crucial role, which we wanted to eliminate in our research due to the possibility of distorting the results [
55]. They completed the tests twice, once before the training unit and once after the training unit. Before the first measurement, the participants performed a standardised warm-up used in previous research—three minutes of running at an aerobic pace, followed by two sets of ten dynamic and jumping exercises [
56,
57]. After the warm-up, they had a 5 min passive recovery, after which they completed the first test [
56]. After the training, the probands took a second measurement after 15 min of rest. The recovery time was determined based on previous studies that observed the peak of the immediate supercompensation effect at the mentioned time after the training [
3,
5,
6]. The training unit represented a 1–1.5 h specific load, depending on the sports discipline of the experimental group. Football players completed specific football training, while endurance runners completed specific running training. The control group had general training, which they completed as part of compulsory physical education. In the CJ10 test, we measured the average time of contact with the mat—tc [s], the average height of vertical jumps—h [cm] and the average power in the active phase of the rebound—P [W·kg
−1]. We derived differences from the parameters of pre-training and post-training measurements—∆tc, ∆h and ∆P—based on which we evaluated the effect of immediate supercompensation.
Statistical analysis: Individual probands with different genotypes were compared with the results of the jump tests. Intragroup comparisons monitored differences based on individual genotype groups regarding ∆tc, ∆h and ∆P. To evaluate the selection pressure from the point of view of sports performance, we compared the frequency representation of individual genotypes of selected genes between the experimental and the control group. The Shapiro–Wilk test was used to verify the normality of data distribution. The chi-square (χ
2) statistical method was used to compare the frequency of monitored genotypes between the experimental and control groups. The results from the comparison of the genotypes with the jump test parameters were statistically evaluated using the parametric statistical method ANOVA (analysis of variance) with the Bonferroni post hoc test in the computer program IBM SPSS v23 [
58,
59]. Similarly, comparisons of combined genotypes with jump test parameters were statistically evaluated using a multivariate analysis of variance. The level of statistical significance was set as
p < 0.05.


