Article

Identification of Epigenetic Interactions between miRNA and Gene Expression as Potential Prognostic Markers in Bladder Cancer

1
Center of Excellence for Genome and Cancer Research, Urology and Nephrology Center, Mansoura University, Mansoura 35516, Egypt
2
Biochemistry Division, Chemistry Department, Faculty of Science, Port Said University, Port Said 42526, Egypt
3
Medical Biochemistry and Molecular Biology Department, Faculty of Medicine, Mansoura University, Mansoura 35516, Egypt
4
Medical Genetics Department, College of Medicine, Umm Al-Qura University, Makkah, Saudi Arabia
5
Biochemistry Division, Chemistry Department, Faculty of Science, Zagazig University, Zagazig 44519, Egypt
*
Author to whom correspondence should be addressed.
These authors contributed equally to this work.
Genes 2022, 13(9), 1629; https://doi.org/10.3390/genes13091629
Submission received: 7 August 2022 / Revised: 3 September 2022 / Accepted: 5 September 2022 / Published: 10 September 2022
(This article belongs to the Section Molecular Genetics and Genomics)

Abstract

:
Purpose: To identify the role of a set of microRNAs and their target genes and protein expression levels in the pathogenesis of bladder cancer with a muscular invasion (T2–T4) and non-muscular invasion (T1). Methods: In 157 patients, bladder specimen was examined for the expression of a set of miRNAs including let-7a-5p, miRNA-449a-5p, miRNA-145-3P, miRNA-124-3P, miRNA-138-5p, and miRNA-23a-5p and their targeted genes; β-catenin, WNT7A, IRS2, FZD4, SOS1, HDAC1, HDAC2, HIF1α, and PTEN using the qRT-PCR technique. The prognostic effect of miRNAs and their targeted genes on cancer-specific survival (CSS) was evaluated in pT2–pT4 stages. Results: pT1 was found in 40 patients while pT2–4 was found in 117 patients. The expression of let-7a-5P, miR-124-3P, miR-449a-5P, and miR-138-5P significantly decreased in pT2–4 compared with pT1 (p < 0.001), in contrast, miR-23a-5P increased significantly in pT2–pT4 compared with pT1 (p < 0.001). Moreover, the expression of miR-145 did not show a significant change (p = 0.31). Higher expression levels of WNT7A, β-catenin, IRS2, FZD4, and SOS1 genes were observed in pT2–pT4 compared with pT1, whereas HDAC1, HDAC2, HIF1α, and PTEN genes were downregulated in pT2–pT4 compared with pT1. Lower CSS was significantly associated with lower expression of let-7a-5P, miR-124-3P, miR-449a-5P, and miR-138-5P. Higher expression of β-catenin, FZD4, IRS2, WNT7a, and SOS1 was significantly associated with worse CSS. In contrast, lower levels of HDAC1, HDAC2, HIF1α, and PTEN were associated with lower CSS. Conclusion: Our results support let-7a-5P, miR-124-3P, miR-138-5P, and their target genes can be developed as accurate biomarkers for prognosis in bladder cancer with a muscular invasion.

1. Introduction

Bladder cancer (BC) is the sixth most common cancer in both men and women worldwide, and the fourth in men. The most frequent histologic type of BC is urothelial carcinoma (UC), which accounts for 90% of all cases [1]. The most widespread type of urothelial carcinoma of the bladder (UCB) is urothelial carcinoma (TCC), which is split into two groups: non-muscle invasive (NMIBC) and muscle-invasive (MIBC) bladder cancer. Intravesical therapies and transurethral resection are effective treatments for NMIBC (pTa and pT1), whereas chemo-radiotherapy or radical cystectomy are effective treatments for MIBC (T2–T4) [2].
Molecular insights into BC might allow more details to understand this complex disease. Therefore, studying the signaling pathways altered in BC such as the cell cycle pathway, DNA repair pathway, chromatin remodeling, angiogenesis, and histone modifications might have a significant impact on the BC prognosis [3].
The Wnt/β-catenin pathway is required for the normal urothelium regeneration in the bladder following injury; therefore, its role in the development of bladder cancer appears reasonable. Furthermore, β-catenin and Frizzled Class Receptor 4 (FZD4) are overexpressed in human bladder cancer, and Wnt/β-catenin signaling is activated by FZD4 stimulation, contributing to tumor progression. The increase in β-catenin in the nucleus has also been linked to worse effects in bladder cancer patients [4]. Wnt-targeted genes were linked to tumor grade and stage, indicating that they could be used as epigenetic biomarkers. HIF-1α and HIF-2α interact with β-catenin but at different locations. HIF-2 was revealed to be essential for β-catenin activation and proliferation in RCC cells. The interaction of β-catenin and HIF-2α opposes that of β-catenin on HIF1-α, suggesting that the HIF-1α/HIF2α ratio could influence cell growth [4]. In cancer, PI3K/Phosphatase/tensin homolog (PTEN) and Wnt/β-catenin signaling pathways correlate with each other as Wnt/β-catenin and PI3K being overexpressed with the inactivity/loss of PTEN [5]. In addition, insulin receptor substrate 2 (IRS2), which is elevated in insulin signaling pathways through let-7a, has recently gained wide attention in cancer development and progression [6]. Other biomarkers include Son of sevenless homolog 1 (SOS1) that is stimulated by ERK signaling activation, especially in higher stages of cancer. In addition, histone deacetylases (HADC1 and HADC2) inhibition increases apoptosis through p53 and p21cip1/WAF1 in cancer [7]. HDAC dysregulation plays a significant role in many human cancers. HDACs are regulated via a variety of methods, including posttranslational alterations. Reversible phosphorylation is a typical posttranslational modification of HDACs. Many HDAC phosphorylations have particular implications. Some of these alterations support disease development [8].
MicroRNAs (MiRNAs) are non-coding RNA sequences with a length of 19–25 nucleotides. Without being translated into proteins, they control gene expression and interfere with critical cellular pathways. MiRNAs have been implicated in a variety of cell functions, including cell growth, apoptosis, proliferation, and differentiation [4]. The expression of specific miRNAs which are related to bladder tumorigenesis was presented in several studies including prediction and progression [5,7,9]. MiRNAs have different expression patterns between the pathological subtypes of BC as their levels differ between the NMIBC and MIBC, suggesting that their determination is beneficial for gene and protein signatures [10]. However, interactions between miRNAs and their targeted genes are conflicting, and their physiological functions in BC cells are still unclear. This may be due to the variation in the specificity and sensitivity of the several platforms used to evaluate miRNA levels or the differences in the cohorts across studies [11].
Measuring protein expression represents a more accurate method to evaluate the activity of specific genes as it is the functional units that are derived from gene activity. Bastos et al. reported that miRNAs affected the expression of a great number of proteins, which could be a useful tool to clarify novel molecular mechanisms that promote the growth, development, and progression of BC [12]. Changes in mRNA levels induced by miRNAs indicated that the suppression of protein levels reflects transcript levels [13]. Therefore, measuring miRNA level and protein expression is necessary to understand miRNA complex activities [14].
In this study, we shed light on the expression of different miRNAs with their gene that could support the potential prognostic value in bladder cancer progression and expansion in different pathways, these pathways might be therapeutically targetable in the future which will improve the prognosis of bladder cancer. Immunohistochemistry (IHC) was selected too to study the altered proteins. We considered these to be the most practical methods to allow our findings to be easily translated into clinical practice for the management of treatment that may improve patient outcomes.

2. Patients and Methods

2.1. Patients and Sample Collection

This cohort study included 157 patients with different stages of BC who were treated at the Urology and Nephrology center. Among them, 40 of the patients were pT1 (NMIBC). The remaining 117 cases were MIBC and included 38 with pT2, 40 with pT3, and 39 with pT4. Patients with NMIBC were treated with transurethral resection (TURBT) and received intravesical treatment with BCG, while those with MIBC were treated by radical cystectomy. Samples of tissue were collected from the malignant tissue of each patient. If a patient underwent more than the TURBT procedures, we considered the first biopsy. The tissue samples were collected fresh from resection or radical cystectomy specimens then stored frozen at −80 °C for miRNA and mRNA gene expression analysis. The miRNA expression (let-7a-5p, miRNA-449a-5p, miRNA-145-3P, miRNA-124-3P, miRNA-138-5p, and miRNA-23a-5p) and target genes of miRNAs (WNT7A, β-catenin, IRS2, FZD4, SOS1, HDAC1, HDAC2, HIF1α, and PTEN) were assessed. All employed targets were enriched using an enricher online available tool, and network analysis was performed using the mirNet tool to predict direct and indirect miRNA to target gene correlation. The Institutional Review Board (IRB) of the Faculty of Medicine, Mansoura University, Egypt approved the protocol of the study (Mansoura UNC IRB #RP-17.12.301.R1).

2.2. Immunohistochemical Examination

One-half of a bladder biopsy from malignant tissues was frozen for PCR, while the other half was fixed in 10% buffered formalin. Immunohistochemistry was performed on three μm-thick sections. Deparaffinized sections were incubated with hydrogen peroxide and heated in citrate buffer. Then, the immunoperoxidase approach was carried out by monoclonal antibodies of β-catenin, SOS1, HDAC1, HDAC2, HIF1, and PTEN (monoclonal mouse anti-human antibody, Santa Cruz Biotechnology, Dallas, TX, USA). Immunostaining was performed using Power-Stain™ 1.0 Poly HRP AEC Kit (Genemed Biotechnologies, San Francisco, CA, USA) with (DAB) as a chromogen. The slides were examined using an Olympus CX51 light microscope, and the diagnosis was obtained using the WHO histological classification of BC [15].

2.3. Real-Time PCR for Studying Gene and Target miRNA

TRIzol (Invitrogen, Waltham, MA, USA) was used to extract total RNA from serial cryosections according to the manufacturer’s protocol. Following the manufacturer’s instructions, complementary DNA (cDNA) was generated from RNA using a cDNA reverse transcription kit (Applied Biosystems, Waltham, MA, USA). MiRNAs, and miScript Reverse Transcription kit (Qiagen, Hilden, Germany) were used to reverse transcribe to cDNA.
SYBER Green PCR Master Mix (Applied Biosystems, USA) was used for mRNA QRT-PCR analysis. (WNT7A, β-catenin, IRS2, FZD4, SOS1, HDAC2, FGFR3, HDAC1, and HIF1α) primers with housekeeping GAPDH were obtained from Applied Biosystems, USA. Table 1 lists all the primers for the genes. qPCR assays for miRNAs were performed using the miScript SYBR-Green PCR kit (Qiagen, Hilden, Germany) and miScript primer assay for let-7a-5p, miRNA-449a-5p, miRNA-145-3P, miRNA-124-3P, miRNA-138-5p, and miRNA-23a-5p and normalized to RUN6-2 (Qiagen, Hilden, Germany).
cDNA samples and primers were utilized in StepOnePlus real-time PCR (Applied Biosystems) for quantitative PCR. The procedure includes initial denaturation for 10 min at 95 °C, followed by 40 cycles of denaturation for 15 s at 95 °C, annealing for 1 min at 60 °C, and final extension for 1 min at 72 °C. Data analysis was carried out by Equation 2−ΔΔCT [16].

2.4. Outcome

The biological significance of the altered miRNAs and target gene expressions in BC was identified using miRDB-Base. Six miRNAs, namely, let-7a-5p, miRNA-449a-5p, miRNA-145-3P, miRNA-124-3P, miRNA-138-5p, and miRNA-23a-5p, and their nine target genes (WNT7A, β-catenin, IRS2, FZD4, SOS1, HDAC1, HDAC2, HIF1α, and PTEN were assessed by qRT-PCR, and a comparison between the gene expression levels was performed between pT1 and pT2–T4 stages.

2.5. Statistical Analysis

Quantitative data were given as means ± SD, whereas qualitative data were presented as numbers and percentages. Comparison between groups was carried out by student t-tests and correlation by Pearson’s correlation coefficient test. A strong positive correlation was considered with r values between 0.5 to 1.00 and a strong negative correlation was considered with r values between −1.00 to −0.5. For survival analysis, only patients with survival data were included (100 patients in T2–T4). The analysis was not performed for patients with T1 because of the low number. Cancer-specific survival (CSS) was defined based on the time the patient developed local recurrence and/or distant metastasis. The values of miRNA/gene expression were categorized into high/low based on a cut-off value calculated by the maximally selected rank statistics from the “maxstat” R package [17] (Supplementary Table S1). A Kaplan–Meier curve was constructed, and the log-rank test was used for statistical significance. SPSS version 16 (SPSS Inc., Chicago, USA) and R programming language version 3.6.3 with the “survminer” package were used for statistical analysis.

3. Results

3.1. Demographics

Of patients, 84.1% were males and the mean age was 57.77 with 88.53% less than 70 years. There was no significant difference between males and females regarding the median level of expression apart from miRNA23a-5p which was significantly expressed in females (p = 0.006). The levels of expression are displayed in Supplementary Figures S1 and S2.

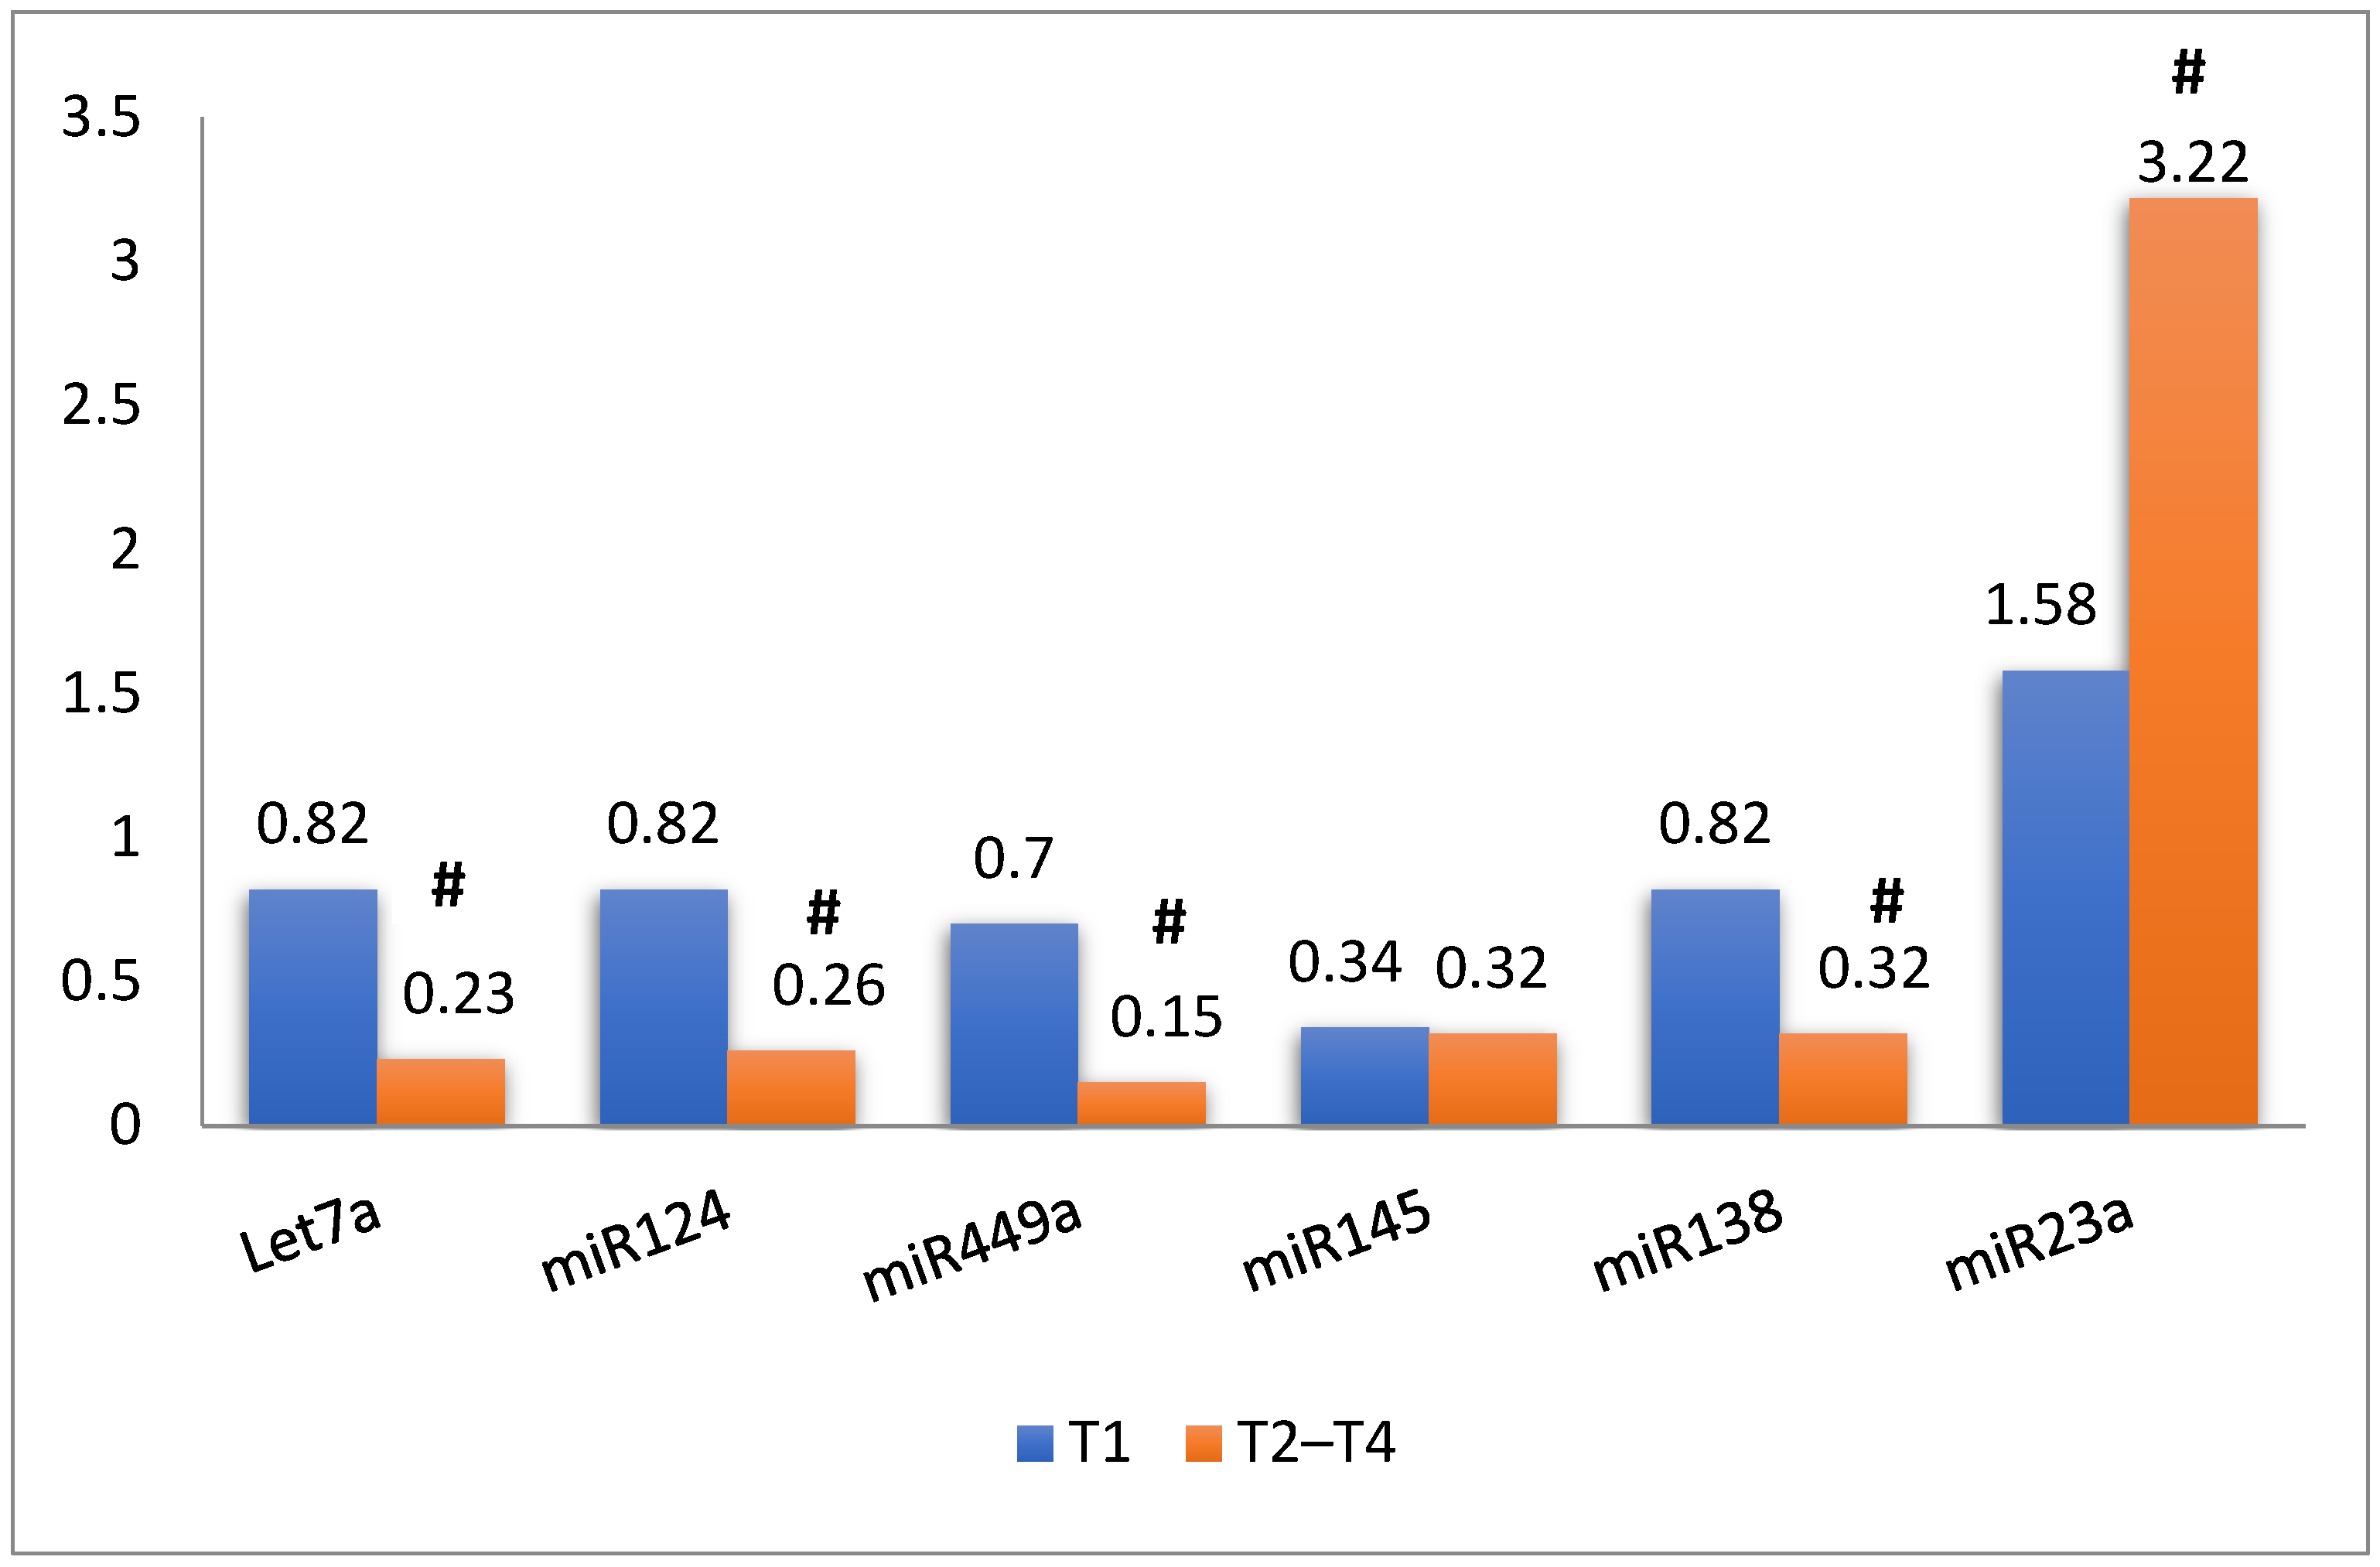
3.2. MiRNAs and Target mRNA Gene Expression

A significant decrease was observed in let-7a-5p, miRNA-449a-5p, miRNA-124-3P, and miRNA-138-5p expressions in pT2–T4 compared with pT1 (p < 0.001). However, the miRNA-145-3p expression did not show any significant difference between stages (p = 0.310), while miR-23a-5p showed a significant increase in its expression with muscle invasion (p < 0.001) (Figure 1).
Let-7a-5p target genes (WNT7A, β-catenin, IRS2, and FZD4) expression significantly increased in pT2–T4 compared with pT1 (p < 0.001). Similarly, the SOS1 gene targeted by miR-124-3p also showed a significant increase in its expression in pT2–T4 than pT1 (p < 0.001). In contrast, HDAC2 which is targeted by miR-145-3p, HDAC1 targeted by miR-449a-5p, HIF1α targeted by miR-138-5p, and PTEN targeted by miR-23a-5p showed a significant decrease in pT2–T4 compared to pT1 (p < 0.001) (Figure 2).

3.3. Correlation between miRNAs and Their Target Genes

The correlation between miRNAs and their target genes at pT1 and pT2–T4 stages using Pearson’s correlation coefficient was analyzed. Our results showed that miRNA let-7a-5p has a significantly strong negative correlation with only one gene (WNT7A) in both pT1 and pT2–T4 stages, while it showed a negative correlation with three genes (β-catenin, IRS2, and FZD4) in pT2–T4 stages, and low negative correlation with target gene SOS1 in pT2–T4 stages (Table 2).

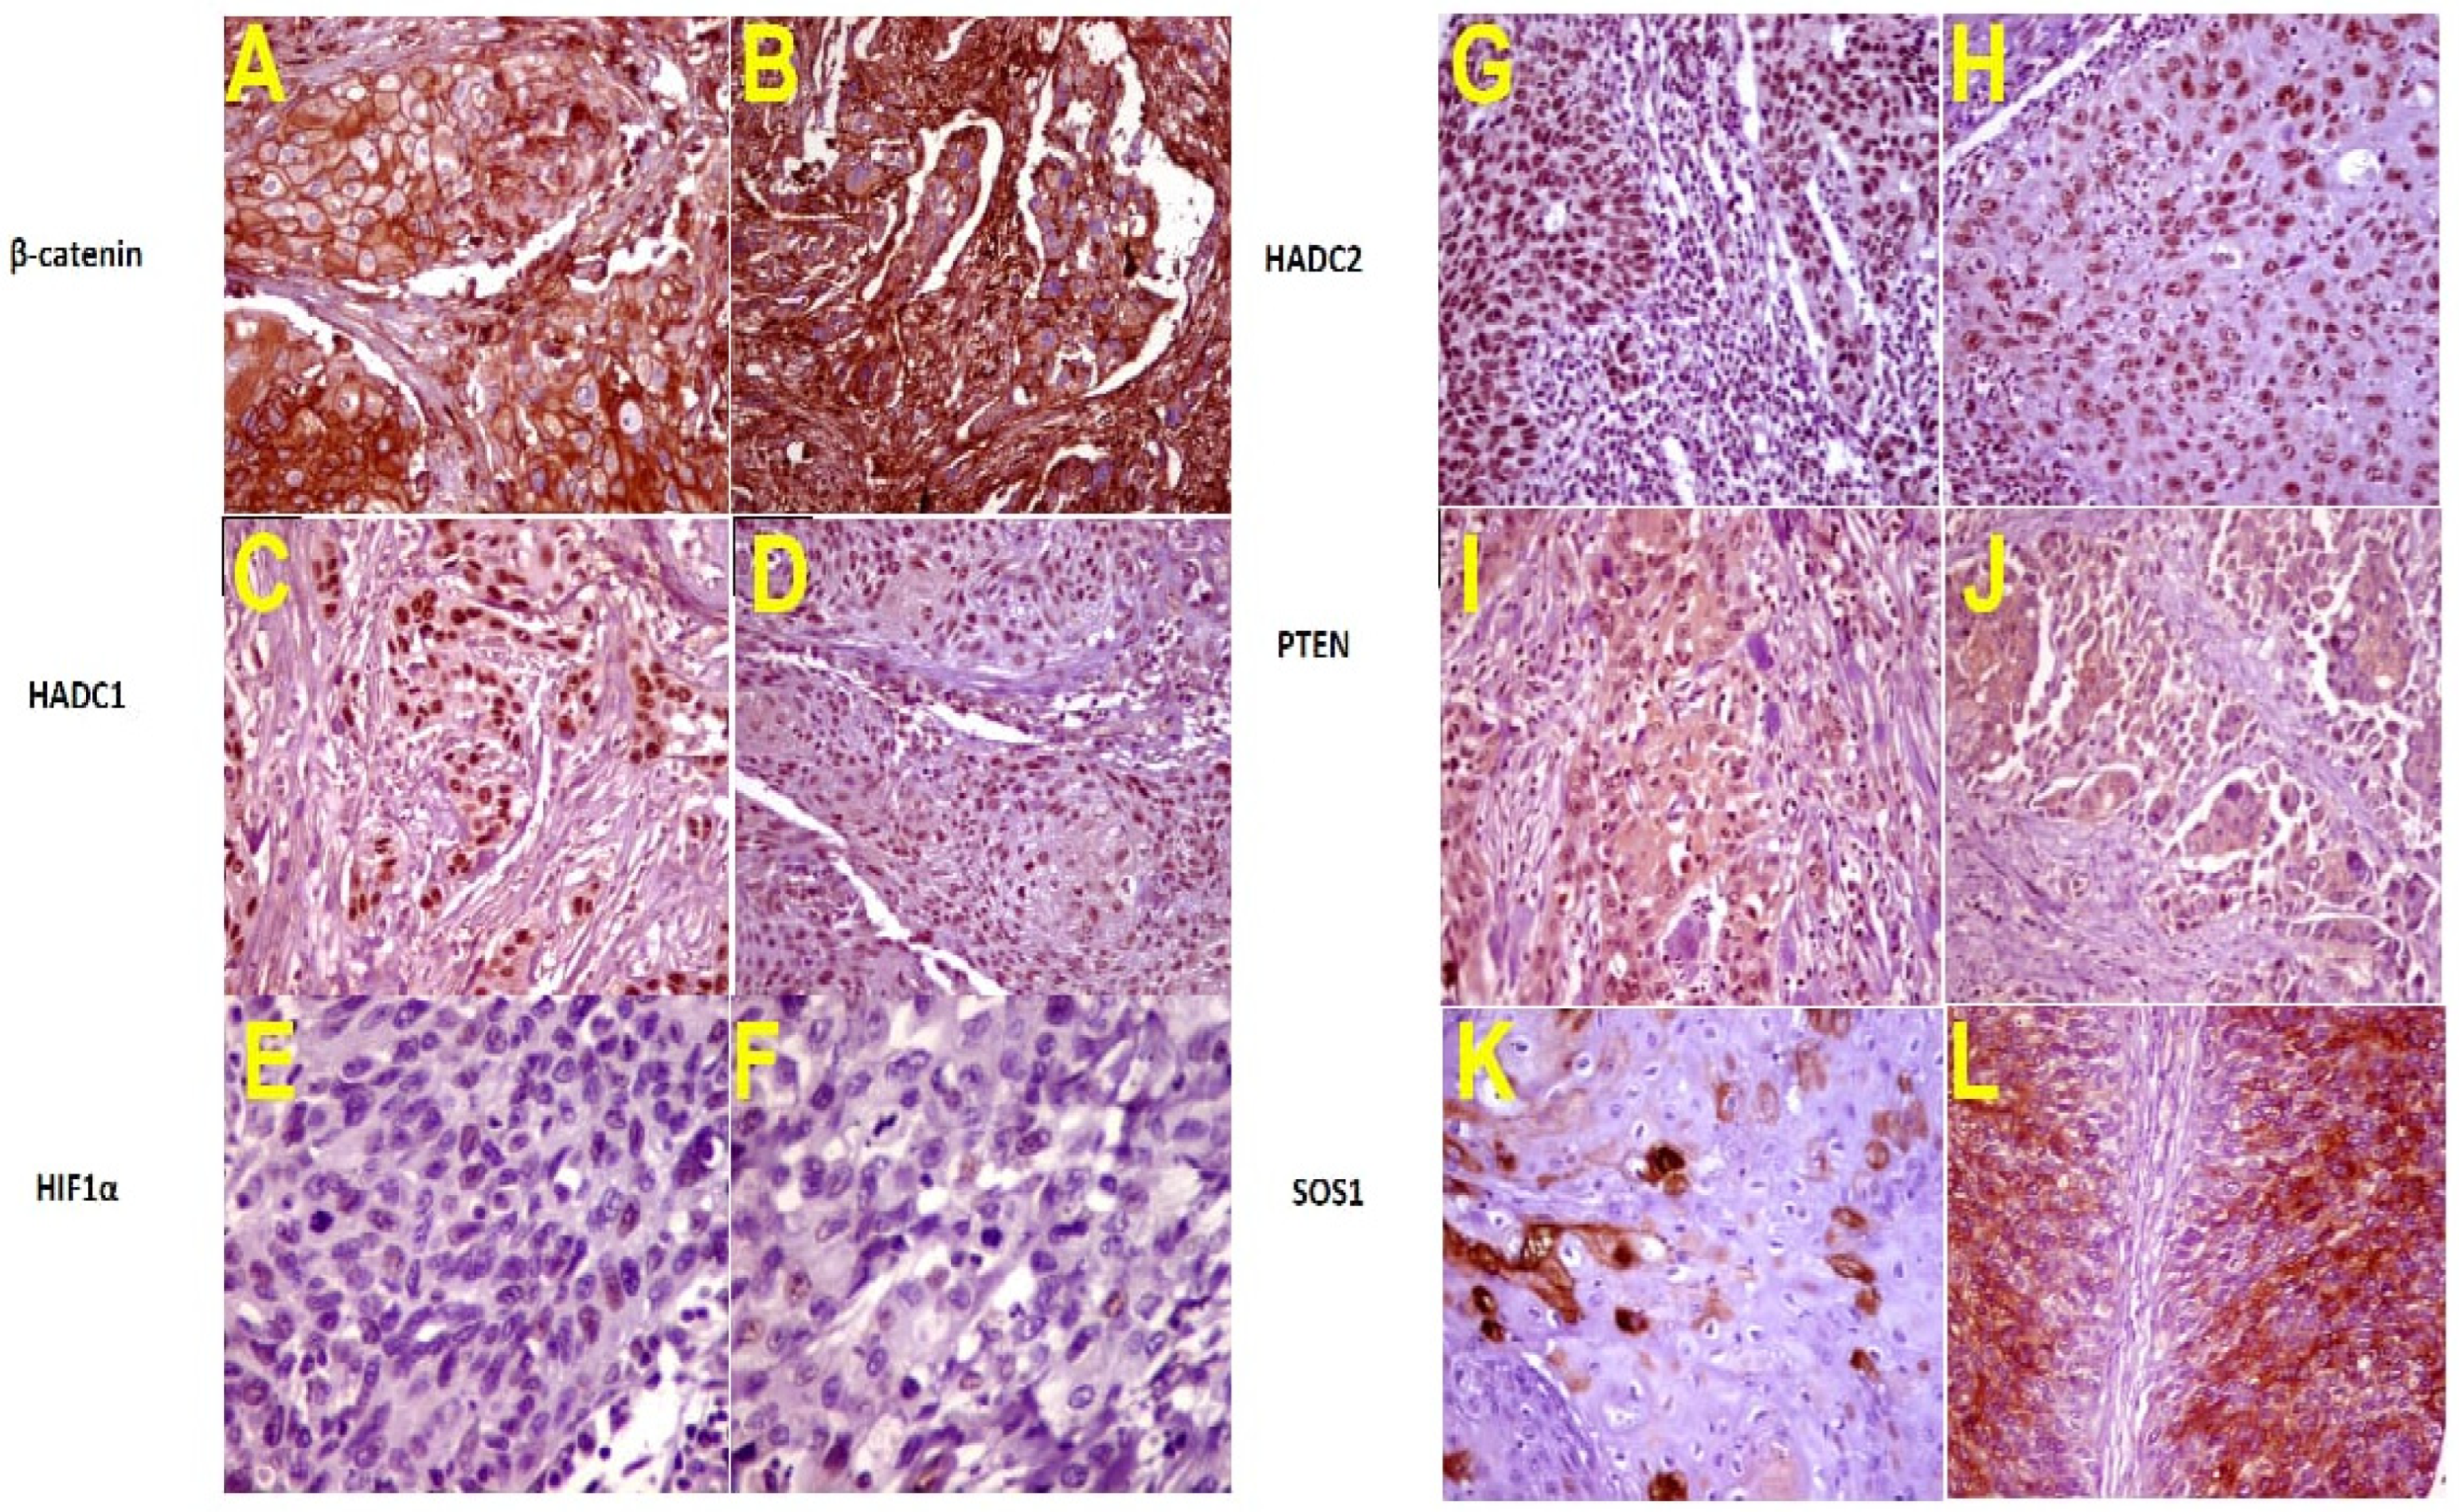
3.4. Immunohistochemistry

No significant differences were detected between levels of β-catenin, SOS1, HDAC1, HDAC2, HIF1, and PTEN expression with age and sex of patients (p > 0.05). A significant difference was detected between β-catenin and SOS1 expression and stage of BC. Their protein expression was significantly lower in T1 than in T2–T4 (p ≤ 0.05). In contrast, according to the mean percentage of positive cells, the HDAC1, and HDAC2 nuclear expression was significantly higher in pT1 than in T2–T4 (p ≤ 0.05). Moreover, HIF1 and PTEN showed lower expression in T2–T4 than pT1 (p ≤ 0.05) as presented in Table 3 and Figure 3A–L. Immunohistochemical staining data and the clinicopathological variables and their correlation with protein expression are summarized in Table 3.

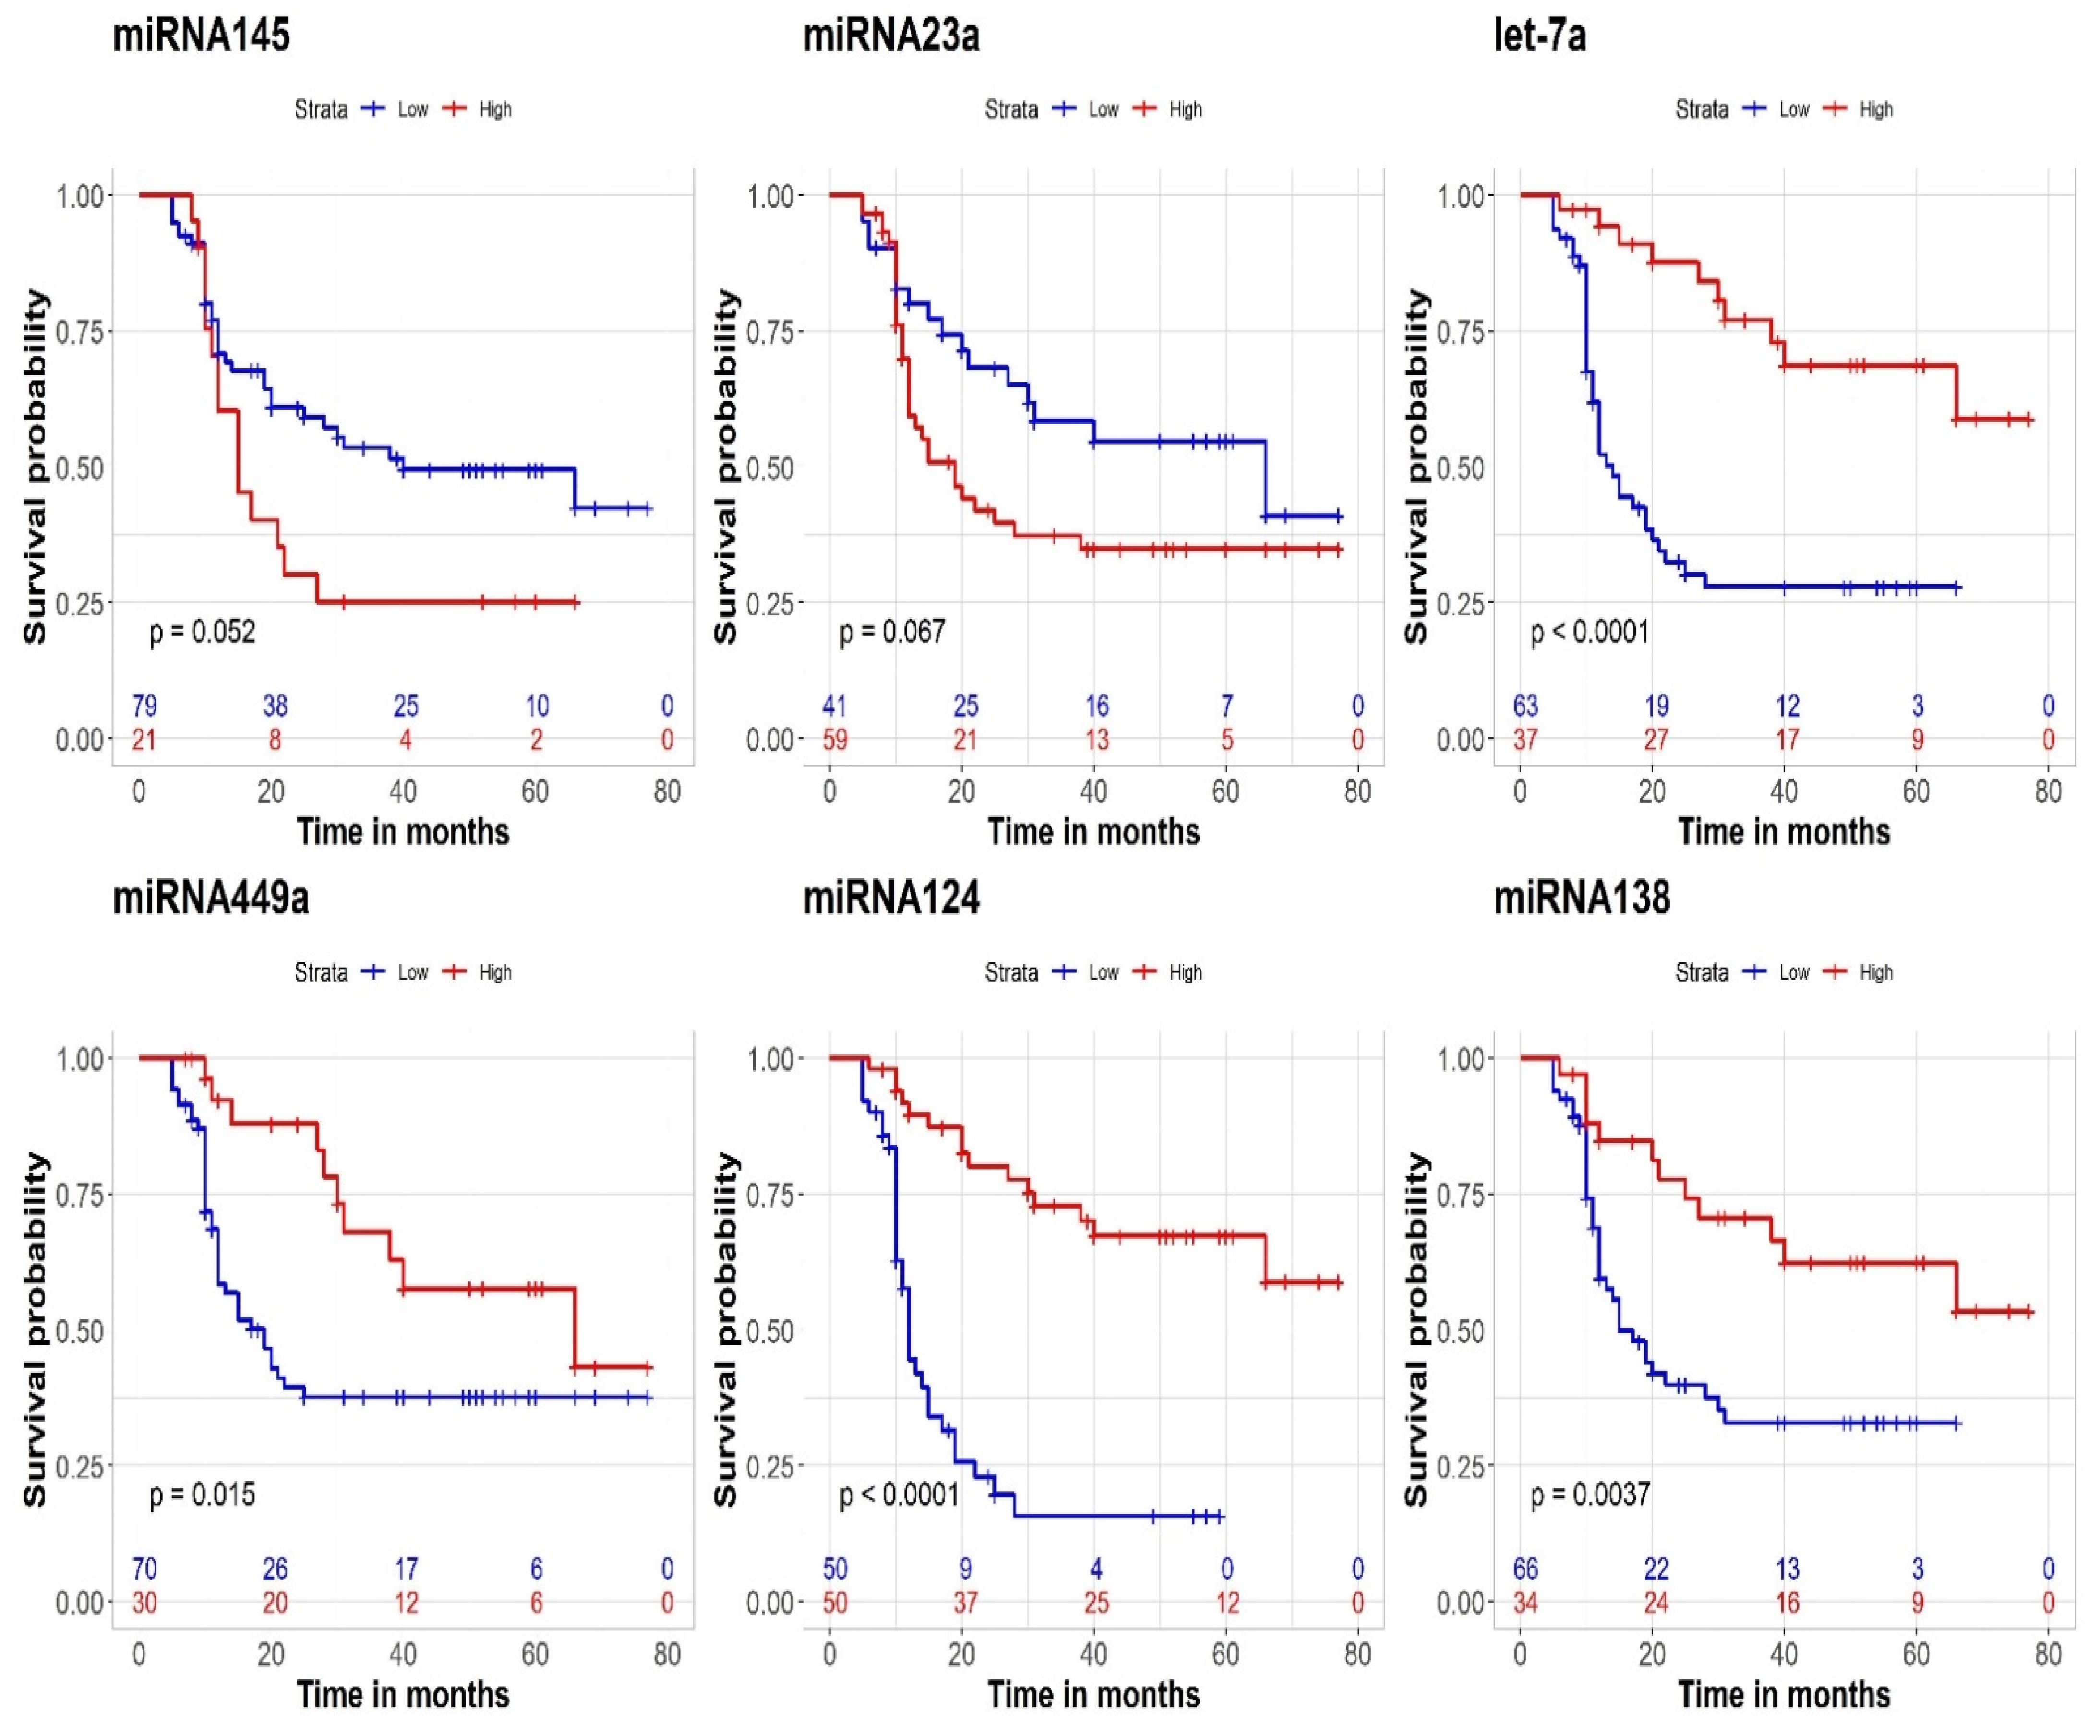
3.5. Prognostic Effect on CSS

Lower CSS was significantly related to lower expression of let-7a-5p (p < 0.001), miRNA-124-3p (p = 0.01), miRNA-499a-5p (p < 0.001), and miRNA-138-5p (p < 0.001). Conversely, the expression levels of miRNA-145-5p and miRNA-23a-5p did not reach statistical significance (Figure 4). For gene products, higher expression of β-catenin, FZD4, IRS2, WNT7a, and SOS1 was significantly associated with worse CSS. In contrast, lower levels of HDAC1, HDAC2, HIF1α, and PTEN were associated with lower CSS (Figure 5). The values of 1- and 5-year CSS are demonstrated in Table 4.

4. Discussion

MicroRNAs are directly involved in many vital processes, including cell proliferation, differentiation, apoptosis, migration, and metabolism, which are all cancer-related pathways. Studies have revealed the potential prognostic role of microRNAs in BC and that miRNAs are associated with progression and survival in patients initially presenting with disease [5,11,18,19].
In the current study, we identified six expressed miRNAs: four downregulated in MIBC, one upregulated in MIBC (miR-23a), and one showed no statistical difference between NMIBC and MIBC (miR-145). Most of these miRNAs were previously reported in regulating BC malignancy [20]. Several studies have established a link between miRNA let-7a expression and BC progression and/or survival [21]. Our results illustrated that let-7a-5p has a reverse correlation with the stage, its expression was downregulated in pT2–pT4 compared to pT1, in agreement with [22] who showed decreased let-7a expression was associated with pT2–pT4 with worse survival. On the other hand, miR-124 was reported as a tumor suppressor in the prostate and BC [23,24]. This finding agreed with our results that showed downregulation of miR-124-3p in high stages pT2–pT4.
Recent studies have indicated the downregulation of miR-449a in several malignant tumors [25,26]. Chen et al. [10] showed a decrease in miR-449 expression in the tumor tissue of BC patients and cell line. This outcome was parallel with our result that showed a significant reduction in miR-449-5p in pT2–pT4 compared to pT1.
Previous research has suggested that miR-145 suppresses tumors in humans through reducing the expression of oncogenic genes. MiR-145 manifested a lower level of expression in BC tissue compared to the normal control [27]. MiR-145 was downregulated in BC, but its expression with the histological grading and staging was not correlated [28]. Our data showed no statistical difference in miR-145-3p expression between different stages.
Earlier studies mentioned miR-138 as a tumor suppressor in human cancers, and upregulation of miR-138 was found to suppress the proliferation and invasion of cancer cells [29]. Our study supported this hypothesis and showed a significant decrease in miR-138-5p in the high stages of BC. MicroRNA-23a, which acts as an oncogene, was reported to be increased in renal cell carcinoma cell lines and associated with lower survival in renal cancer patients [30]. In our study, miRNA-23a-5p significantly increased with high stages BC.
With the application of negatively correlated coefficients in miRNA–mRNA identification, miRNA target gene pairs have been proposed to play a role in the progression of tumors [31]. Wnt/β-Catenin is implicated in cancer biology via several mechanisms. Wnts bind to members of seven transmembrane families to stimulate complex network events dependent on β-catenin (CTNNB1) (canonical pathway) or independent of β-catenin (non-canonical pathways) [32]. In addition, Wnt pathway alterations were detected in many kinds of cancer, confirming its importance during bladder carcinogenesis [33]; a finding compatible with our results that showed a significant elevation in WNT7A and CTNNB1 expression in high stages.
Low expression of let-7a in liver cancer cells because of its inhibitory effect on the Wnt signaling pathway by regulating Frizzled Class Receptor 4 (FZD4) gene at megakaryocyte development was indicated [34]. These findings confirm our results that downregulation of let-7a-5p expression was related to increasing FZD4 and CTNNB1 expression in high stages of BC. Through our results, let-7a-5p exhibited a strong negative correlation with its target gene WNT7A at low and high stages, and with CTNNB1and FZD4 at high stages of pT2–pT4.
In addition, it has been shown that IRS could be a potential diagnostic marker for urothelial carcinomas of the bladder in humans [35]. Our results revealed an upregulation of IRS2 expression in high stages of pT2–pT4 compared to low stage pT1. Furthermore, there was a strong negative correlation between let-7a-5p and its target gene IRS. IRS1/2 overexpression elevated the dishevelled2 (Dvl2) protein level and promoted Wnt/β-catenin signaling, as demonstrated by the increase in T cell-specific factor 4, CYCLIN D1, and c-MYC. IRS1/2 overexpression stimulated metastasis and tumor formation. Likewise, IRS1 downregulation by miRNA-145 inhibited tumor metastasis [35].
Son of sevenless homolog 1 (SOS1) gene, which is a stimulator of Ras/MAPK in intrauterine development, was found to be upregulated in bladder and prostate cancer by ERK signaling activation, which is linked to higher stages of cancer and is a factor for cancer aggressiveness [36]. This information agrees with our findings highlighting a significant increase in SOS1 expression with higher stages. On the other hand, miR-124-3p was stated as a suppressor of tumors in prostate and bladder cancer and was identified as a target of the SOS1 gene [23,24].
Histone deacetylases (HDACs) have a major role in regulating transcription and in cellular processes. HDAC-1 and HDAC-2 were found to be strongly related to pT1 high-grade papillary bladder tumors, and their high levels of expression were linked to a shorter progression-free survival [37]. These findings are in harmony with our results that showed a reduction in HDAC1 and HDAC2 genes level with high stages. MiR-449a, which has a growth suppressing activity thought to have an inhibitory activity on HDAC-1 expression, has been confirmed with the reduction in its levels with high stages [38]. Noonan et al. reported that miR-145 suppresses HDAC2 overexpression in hepatic cell carcinoma tumorigenesis [37]. On the other hand, miR145 was not significantly correlated with its target gene HDAC2 in T1 or T2–T4 diseases in our samples. This controversy might be because of our sample size and possibly other regulatory factors that affect gene expression but have not been studied. HDAC1 and HDAC2 are essential components of the transcriptional complexes SIN3A, NuRD, and CoREST, which are recruited to promoters by DNA binding proteins to induce gene-specific transcriptional suppression. HDAC1 and HDAC2 restrict the production of p21WAF1/CIP1 and p57KIP2, regulating the cell cycle’s transition from G1 to S. Interestingly, NLK serine/threonine kinase phosphorylation of HDAC1 at the critical serine 421 results in reduced β-Catenin/LEF1 promoter, indicating the ability of the NLK-HDAC1 axis to downregulate WNT signaling, which is critical for the prevention of aberrant proliferation of non-transformed, primary fibroblast cells. Similarly, the c-ABL (ABL1/ABL) protein kinase can stimulate tyrosine phosphorylation of HDAC2, which is the primary function of the oncogenic fusion protein BCR-ABL [8].
Blood vessel formation is essential in cancer development and progression. The correlation between the density of tumor microvascular architecture and tumor stage was described in many kinds of cancers [39,40]. Hypoxia-Inducible Factor (HIF-1) is activated by the hypoxic conditions in tumor development in the angiogenesis phase. Recently, it was pointed out that the HIF-1 pathway contributes highly to tumor growth and progression. Nevertheless, the relation between tumor stage and HIF1α in BC is unclear [41,42]. Our study showed an inverse relationship between HIF1α expression and tumor stage, with significantly lower HIF1α levels in high stages of pT2–pT4, a finding in agreement with [43]. Furthermore, miR-138 was found to suppress the proliferation and invasion of cancer cells by inhibiting HIF1α [29].
Phosphatase and tensin homolog (PTEN) is one of the most frequently deleted or mutated genes in tumors. Its functions in converting phosphatidylinositol-3, 4, 5-triphosphate (PIP3) into a diphosphate product (PIP2) slow tumor progression and prevent the development of many cancers [44]. Our results showed the downregulation of PTEN in high stages.
Besides the direct action of miRNAs on the target genes, miRNAs may be suppressed at the translational and protein transduction level [45] and can alter the expression levels of target proteins [46]. Our immunohistochemical study revealed six expressed proteins were interconnected, suggesting that miRNAs may regulate proteins in the same manner indicated by the mRNA expression profile.
The overexpression of CTNNB1 and SOS1 proteins was observed in higher stages (T2–T4). Some studies, in line with ours, recommended the use of CTNNB1 as a marker of tumor progression [47,48]. In contrast, HIF1 and PTEN showed marked expression in low-stage pT1, which was confirmed by the correlation between miRNA and mRNA. Moreover, HDAC1 and HDAC1 revealed lower protein expression in pT2–pT4 compared to low stage pT1, a finding compatible with Poyet et al. who found that HDAC1 and HDAC 2 have a rough prognostic relevance in pTa and pT1 tumors [37].
Let-7a target gene (WNT7A, β-catenin, IRS2, and FZD4) expression significantly increased in T2–T4 compared with pT1 as let-7a miRNA inhibition stimulates FZD4 and Wnt/β-catenin pathway in cancer cells. Similarly, the SOS1 gene targeted by miR-124 also showed a significant increase in its expression in pT2–T4 compared to pT1. In contrast, HDAC2 which is targeted by miR-145, HDAC1 targeted by miR-449a, HIF1α targeted by miR-138, and PTEN targeted by miR-23a, showed a significant decrease in pT2–T4 compared to pT1.

5. Conclusions

These results suggested that the link between let-7a-5p, miRNA124-3p, miRNA138-5p, and their target genes could be a promising tool in the prognosis of BC. The critical role of miRNA–mRNA correlations would be helpful to find specific biomarkers for BC prognosis.

Supplementary Materials

The following supporting information can be downloaded at: https://www.mdpi.com/article/10.3390/genes13091629/s1, Figure S1: Prognostic effect of miRNAs; let-7a-5p, miRNA-449a-5p, miRNA-145-3P, miRNA-124-3P, miRNA-138-5p, and miRNA-23a-5p on CSS in males and females; Figure S2: Prognostic effect of targeted genes; β-Catenin, WNT7A, IRS, FZD4, SOS1, HDAC1, HDAC2, HIF1α, and PTEN on CSS in males and females; Table S1: the cut-off values used to categorize the level of expression into low/high.

Author Contributions

Conceptualization, A.A., H.A.-E., A.A.S. and A.M.H.; methodology, A.A., E.T.H., A.E.A., S.M.K., S.A.M., M.A. and M.A.-R.; software, A.A., E.T.H., A.E.A., S.M.K., A.O.B. and A.M.H.; validation, A.A., E.T.H., A.E.A. and S.M.K.; formal analysis, A.A., E.T.H., A.E.A., S.M.K., M.A. and M.A.-R.; investigation, A.A., E.T.H., A.E.A., and S.M.K.; resources, A.A., H.A.-E., E.T.H., A.E.A., S.M.K., A.E.-A., S.A.M. and A.O.B.; data curation, A.A., E.T.H., A.E.A., S.M.K. and A.M.H.; writing—original draft preparation, A.A., E.T.H., A.E.A., S.M.K., A.E.-A. and A.M.H.; writing—review and editing, A.A., H.A.-E., E.T.H., A.E.A., S.M.K., A.E.-A., S.A.M., A.O.B., M.A., M.A.-R., A.A.S. and A.M.H.; visualization, A.A., H.A.-E., A.A.S. and A.M.H.; supervision, H.A.-E., A.A.S. and A.M.H.; project administration, H.A.-E. and A.A.S.; funding acquisition, A.A., H.A.-E., E.T.H., A.E.A., S.M.K., S.A.M., A.O.B. and A.A.S. All authors have read and agreed to the published version of the manuscript.

Funding

This research was funded by the Science and Technology Development Fund in Egypt (STDF) (Grant No 5236).

Institutional Review Board Statement

The study was conducted in accordance with the Declaration of Helsinki, and approved by the Institutional Review Board (IRB) of Faculty of Medicine, Mansoura University, Egypt that approved the protocol of the study (Mansoura UNC IRB #RP-17.12.301.R1). Date of approval: 31 December 2017.

Informed Consent Statement

Informed consent was obtained from all subjects involved in the study. Written informed consent has been obtained from the patient(s) to publish this paper.

Data Availability Statement

All data generated during this study are included in this published article (and its supplementary information files).

Acknowledgments

We would like to express our gratitude to the Science and Technology Development Fund in Egypt (STDF) for its financial support of this research (Grant No 5236).

Conflicts of Interest

The authors have no potential conflict of interest to declare.

References

  1. Antoni, S.; Ferlay, J.; Soerjomataram, I.; Znaor, A.; Jemal, A.; Bray, F. Bladder Cancer Incidence and Mortality: A Global Overview and Recent Trends. Eur. Urol. 2017, 71, 96–108. [Google Scholar] [CrossRef] [PubMed]
  2. Guo, C.C.; Czerniak, B. Bladder Cancer in the Genomic Era. Arch. Pathol. Lab. Med. 2019, 143, 695–704. [Google Scholar] [CrossRef] [PubMed]
  3. Robertson, A.G.; Kim, J.; Al-Ahmadie, H.; Bellmunt, J.; Guo, G.; Cherniack, A.D.; Hinoue, T.; Laird, P.W.; Hoadley, K.A.; Akbani, R.; et al. Comprehensive Molecular Characterization of Muscle-Invasive Bladder Cancer. Cell 2017, 171, 540–556.e25. [Google Scholar] [CrossRef] [PubMed]
  4. Braicu, C.; Cojocneanu-Petric, R.; Chira, S.; Truta, A.; Floares, A.; Achimas-Cadariu, P.; Berindan-Neagoe, I.; Petrut, B. Clinical and pathological implications of miRNA in bladder cancer. Int. J. Nanomed. 2015, 10, 791–800. [Google Scholar] [CrossRef] [PubMed]
  5. Veerla, S.; Lindgren, D.; Kvist, A.; Frigyesi, A.; Staaf, J.; Persson, H.; Liedberg, F.; Chebil, G.; Gudjonsson, S.; Borg, Å.; et al. MiRNA expression in urothelial carcinomas: Important roles of miR-10a, miR-222, miR-125b, miR-7 and miR-452 for tumor stage and metastasis, and frequent homozygous losses of miR-31. Int. J. Cancer 2009, 124, 2236–2242. [Google Scholar] [CrossRef]
  6. Zhu, H.; Ng, S.-C.; Segrè, A.V.; Shinoda, G.; Shah, S.P.; Einhorn, W.S.; Takeuchi, A.; Engreitz, J.M.; Hagan, J.P.; Kharas, M.G.; et al. The Lin28/let-7 Axis Regulates Glucose Metabolism. Cell 2011, 147, 81–94. [Google Scholar] [CrossRef]
  7. Catto, J.W.F.; Miah, S.; Owen, H.C.; Bryant, H.; Myers, K.; Dudziec, E.; Larré, S.; Milo, M.; Rehman, I.; Rosario, D.J.; et al. Distinct MicroRNA Alterations Characterize High- and Low-Grade Bladder Cancer. Cancer Res. 2009, 69, 8472–8481. [Google Scholar] [CrossRef]
  8. Giannopoulou, A.F.; Velentzas, A.D.; Konstantakou, E.G.; Avgeris, M.; Katarachia, S.A.; Papandreou, N.C.; Kalavros, N.I.; Mpakou, V.E.; Iconomidou, V.; Anastasiadou, E.; et al. Revisiting Histone Deacetylases in Human Tumorigenesis: The Paradigm of Urothelial Bladder Cancer. Int. J. Mol. Sci. 2019, 20, 1291. [Google Scholar] [CrossRef]
  9. Porkka, K.P.; Pfeiffer, M.J.; Waltering, K.K.; Vessella, R.L.; Tammela, T.L.; Visakorpi, T. MicroRNA Expression Profiling in Prostate Cancer. Cancer Res. 2007, 67, 6130–6135. [Google Scholar] [CrossRef]
  10. Chen, H.; Lin, Y.-W.; Mao, Y.-Q.; Wu, J.; Liu, Y.-F.; Zheng, X.-Y.; Xie, L.-P. MicroRNA-449a acts as a tumor suppressor in human bladder cancer through the regulation of pocket proteins. Cancer Lett. 2012, 320, 40–47. [Google Scholar] [CrossRef]
  11. Rosenberg, E.; Baniel, J.; Spector, Y.; Faerman, A.; Meiri, E.; Aharonov, R.; Margel, D.; Goren, Y.; Nativ, O. Predicting progression of bladder urothelial carcinoma using microRNA expression. Br. J. Urol. 2013, 112, 1027–1034. [Google Scholar] [CrossRef] [PubMed]
  12. Bastos, E.P.; Brentani, H.; Pereira, C.A.B.; Polpo, A.; Lima, L.; Puga, R.D.; Pasini, F.S.; Osorio, C.A.B.T.; Roela, R.A.; Achatz, M.I.; et al. A Set of miRNAs, Their Gene and Protein Targets and Stromal Genes Distinguish Early from Late Onset ER Positive Breast Cancer. PLoS ONE 2016, 11, e0154325. [Google Scholar] [CrossRef]
  13. Baek, D.; Villén, J.; Shin, C.; Camargo, F.D.; Gygi, S.P.; Bartel, D.P. The impact of microRNAs on protein output. Nature 2008, 455, 64–71. [Google Scholar] [CrossRef]
  14. Uhlmann, S.; Mannsperger, H.; Zhang, J.D.; Horvat, E.; Schmidt, C.; Küblbeck, M.; Henjes, F.; Ward, A.; Tschulena, U.; Zweig, K.; et al. Global microRNA level regulation of EGFR-driven cell-cycle protein network in breast cancer. Mol. Syst. Biol. 2012, 8, 570. [Google Scholar] [CrossRef] [PubMed]
  15. Epstein, J.I.; Amin, M.B.; Reuter, V.R.; Mostofi, F.K. The World Health Organization/International Society of Urological Pathology Consensus Classification of Urothelial (Transitional Cell) Neoplasms of the Urinary Bladder. Am. J. Surg. Pathol. 1998, 22, 1435–1448. [Google Scholar] [CrossRef]
  16. Barakat, L.A.; Barakat, N.; Zakaria, M.M.; Khirallah, S.M. Protective role of zinc oxide nanoparticles in kidney injury induced by cisplatin in rats. Life Sci. 2020, 262, 118503. [Google Scholar] [CrossRef]
  17. Delgado, J.; Pereira, A.; Villamor, N.; López-Guillermo, A.; Rozman, C. Survival analysis in hematologic malignancies: Recommendations for clinicians. Haematologica 2014, 99, 1410–1420. [Google Scholar] [CrossRef]
  18. Dyrskjøt, L.; Ostenfeld, M.S.; Bramsen, J.B.; Silahtaroglu, A.N.; Lamy, P.; Ramanathan, R.; Fristrup, N.; Jensen, J.L.; Andersen, C.L.; Zieger, K.; et al. Genomic Profiling of MicroRNAs in Bladder Cancer: miR-129 Is Associated with Poor Outcome and Promotes Cell Death In vitro. Cancer Res. 2009, 69, 4851–4860. [Google Scholar] [CrossRef]
  19. Wszolek, M.F.; Rieger-Christ, K.M.; Kenney, P.A.; Gould, J.J.; Neto, B.S.; LaVoie, A.K.; Logvinenko, T.; Libertino, J.A.; Summerhayes, I.C. A MicroRNA expression profile defining the invasive bladder tumor phenotype. Urol. Oncol. Semin. Orig. Investig. 2011, 29, 794–801.e1. [Google Scholar] [CrossRef]
  20. Vinall, R.L.; Tepper, C.G.; Ripoll, A.A.; Gandour-Edwards, R.F.; Durbin-Johnson, B.P.; Yap, S.A.; Ghosh, P.M.; White, R.W.D. Decreased expression of let-7c is associated with non-response of muscle-invasive bladder cancer patients to neoadjuvant chemotherapy. Genes Cancer 2016, 7, 86–97. [Google Scholar] [CrossRef] [Green Version]
  21. Xu, Z.; Yu, Y.-Q.; Ge, Y.-Z.; Zhu, J.-G.; Zhu, M.; Zhao, Y.-C.; Xu, L.-W.; Yang, X.-B.; Geng, L.-G.; Dou, Q.-L.; et al. MicroRNA expression profiles in muscle-invasive bladder cancer: Identification of a four-microRNA signature associated with patient survival. Tumor Biol. 2015, 36, 8159–8166. [Google Scholar] [CrossRef] [PubMed]
  22. Zhou, H.; Tang, K.; Xiao, H.; Zeng, J.; Guan, W.; Guo, X.; Xu, H.; Ye, Z. A panel of eight-miRNA signature as a potential biomarker for predicting survival in bladder cancer. J. Exp. Clin. Cancer Res. 2015, 34, 53. [Google Scholar] [CrossRef] [PubMed]
  23. Shi, X.-B.; Xue, L.; Ma, A.-H.; Tepper, C.G.; Gandour-Edwards, R.; Kung, H.-J.; White, R.W.D. Tumor suppressive miR-124 targets androgen receptor and inhibits proliferation of prostate cancer cells. Oncogene 2013, 32, 4130–4138. [Google Scholar] [CrossRef]
  24. Zhang, T.; Wang, J.; Zhai, X.; Li, H.; Li, C.; Chang, J. MiR-124 retards bladder cancer growth by directly targeting CDK4. Acta Biochim. Biophys. Sin. 2014, 46, 1072–1079. [Google Scholar] [CrossRef] [PubMed]
  25. Bou Kheir, T.; Futoma-Kazmierczak, E.; Jacobsen, A.; Krogh, A.; Bardram, L.; Hother, C.; Grønbæk, K.; Federspiel, B.; Lund, A.H.; Friis-Hansen, L. miR-449 inhibits cell proliferation and is down-regulated in gastric cancer. Mol. Cancer 2011, 10, 29. [Google Scholar] [CrossRef] [PubMed]
  26. Lizé, M.; Pilarski, S.; Dobbelstein, M.; Liz, M. E2F1-inducible microRNA 449a/b suppresses cell proliferation and promotes apoptosis. Cell Death Differ. 2010, 17, 452–458. [Google Scholar] [CrossRef]
  27. Friedman, J.M.; Liang, G.; Liu, C.-C.; Wolff, E.M.; Tsai, Y.C.; Ye, W.; Zhou, X.; Jones, P.A. The Putative Tumor Suppressor microRNA-101 Modulates the Cancer Epigenome by Repressing the Polycomb Group Protein EZH2. Cancer Res. 2009, 69, 2623–2629. [Google Scholar] [CrossRef] [PubMed]
  28. Sachdeva, M.; Mo, Y.-Y. miR-145-mediated suppression of cell growth, invasion and metastasis. Am. J. Transl. Res. 2010, 2, 170–180. [Google Scholar]
  29. Chen, Y.; Cao, K.; Wang, S.; Chen, J.; He, B.; He, G.; Chen, Y.; Peng, B.; Zhou, J. MicroRNA-138 suppresses proliferation, invasion and glycolysis in malignant melanoma cells by targeting HIF-1α. Exp. Ther. Med. 2016, 11, 2513–2518. [Google Scholar] [CrossRef]
  30. Zaman, M.S.; Thamminana, S.; Shahryari, V.; Chiyomaru, T.; Deng, G.; Saini, S.; Majid, S.; Fukuhara, S.; Chang, I.; Arora, S.; et al. Inhibition of PTEN Gene Expression by Oncogenic miR-23b-3p in Renal Cancer. PLoS ONE 2012, 7, e50203. [Google Scholar] [CrossRef]
  31. Li, X.; Yu, X.; He, Y.; Meng, Y.; Liang, J.; Huang, L.; Du, H.; Wang, X.; Liu, W. Integrated Analysis of MicroRNA (miRNA) and mRNA Profiles Reveals Reduced Correlation between MicroRNA and Target Gene in Cancer. BioMed Res. Int. 2018, 2018, 1972606. [Google Scholar] [CrossRef] [PubMed] [Green Version]
  32. Niehrs, C. The complex world of WNT receptor signalling. Nat. Rev. Mol. Cell Biol. 2012, 13, 767–779. [Google Scholar] [CrossRef] [PubMed]
  33. Huang, X.; Zhu, H.; Gao, Z.; Li, J.; Zhuang, J.; Dong, Y.; Shen, B.; Li, M.; Zhou, H.; Guo, H.; et al. Wnt7a activates canonical Wnt signaling, promotes bladder cancer cell invasion, and is suppressed by miR-370-3p. J. Biol. Chem. 2018, 293, 6693–6706. [Google Scholar] [CrossRef] [PubMed]
  34. Cai, H.; Chen, Y.; Yang, X.; Ma, S.; Wang, Q.; Zhang, Y.; Niu, X.; Ding, G.; Yuan, Y. Let7b modulates the Wnt/β-catenin pathway in liver cancer cells via downregulated Frizzled4. Tumor Biol. 2017, 39, 1010428317716076. [Google Scholar] [CrossRef]
  35. Yang, L.; Wang, Y.; Luo, H.; Li, Y.; Chen, T.; Wu, S. hsa-miR-96 up-regulates MAP4K1 and IRS1 and may function as a promising diagnostic marker in human bladder urothelial carcinomas. Mol. Med. Rep. 2012, 5, 260–265. [Google Scholar] [CrossRef]
  36. Sharif, T.; Martell, E.; Dai, C.; Kennedy, B.E.; Murphy, P.; Clements, D.R.; Kim, Y.; Lee, P.W.K.; Gujar, S.A. Autophagic homeostasis is required for the pluripotency of cancer stem cells. Autophagy 2016, 13, 264–284. [Google Scholar] [CrossRef]
  37. Poyet, C.; Jentsch, B.; Hermanns, T.; Schweckendiek, D.; Seifert, H.-H.; Schmidtpeter, M.; Sulser, T.; Moch, H.; Wild, P.J.; Kristiansen, G. Expression of histone deacetylases 1, 2 and 3 in urothelial bladder cancer. BMC Clin. Pathol. 2014, 14, 10. [Google Scholar] [CrossRef]
  38. Noonan, E.J.; Place, R.F.; Pookot, D.; Basak, S.; Whitson, J.M.; Hirata, H.; Giardina, C.; Dahiya, R. miR-449a targets HDAC-1 and induces growth arrest in prostate cancer. Oncogene 2009, 28, 1714–1724. [Google Scholar] [CrossRef]
  39. Saponaro, C.; Malfettone, A.; Ranieri, G.; Danza, K.; Simone, G.; Paradiso, A.; Mangia, A. VEGF, HIF-1α Expression and MVD as an Angiogenic Network in Familial Breast Cancer. PLoS ONE 2013, 8, e53070. [Google Scholar] [CrossRef]
  40. Cheng, S.-H.; Liu, J.-M.; Liu, Q.-Y.; Luo, D.-Y.; Liao, B.-H.; Li, H.; Wang, K.-J. Prognostic role of microvessel density in patients with renal cell carcinoma: A meta-analysis. Int. J. Clin. Exp. Pathol. 2014, 7, 5855–5863. [Google Scholar]
  41. Ioachim, E.; Michael, M.; Salmas, M.; Stavropoulos, N.; Malamou-Mitsi, V. Hypoxia-Inducible Factors HIF-1α and HIF-2α Expression in Bladder Cancer and Their Associations with Other Angiogenesis-Related Proteins. Urol. Int. 2006, 77, 255–263. [Google Scholar] [CrossRef] [PubMed]
  42. Chen, W.-T.; Hung, W.-C.; Kang, W.-Y.; Huang, Y.-C.; Su, Y.-C.; Yang, C.-H.; Chai, C.-Y. Overexpression of cyclooxygenase-2 in urothelial carcinoma in conjunction with tumor-associated-macrophage infiltration, hypoxia-inducible factor-1α expression, and tumor angiogenesis. APMIS 2009, 117, 176–184. [Google Scholar] [CrossRef] [PubMed]
  43. Fus, Ł.P.; Pihowicz, P.; Koperski, Ł.; Marczewska, J.M.; Górnicka, B. HIF-1α expression is inversely associated with tumor stage, grade and microvessel density in urothelial bladder carcinoma. Pol. J. Pathol. 2018, 69, 395–404. [Google Scholar] [CrossRef] [PubMed]
  44. Li, N.; Miao, Y.; Shan, Y.; Liu, B.; Li, Y.; Zhao, L.; Jia, L. MiR-106b and miR-93 regulate cell progression by suppression of PTEN via PI3K/Akt pathway in breast cancer. Cell Death Dis. 2017, 8, e2796. [Google Scholar] [CrossRef] [PubMed]
  45. Selbach, M.; Schwanhäusser, B.; Thierfelder, N.; Fang, Z.; Khanin, R.; Rajewsky, N. Widespread changes in protein synthesis induced by microRNAs. Nature 2008, 455, 58–63. [Google Scholar] [CrossRef]
  46. Östling, P.; Leivonen, S.-K.; Aakula, A.; Kohonen, P.; Mäkelä, R.; Hagman, Z.; Edsjö, A.; Kangaspeska, S.; Edgren, H.; Nicorici, D.; et al. Systematic Analysis of MicroRNAs Targeting the Androgen Receptor in Prostate Cancer Cells. Cancer Res. 2011, 71, 1956–1967. [Google Scholar] [CrossRef]
  47. Kazem, A.; El Sayed, K.; El Kerm, Y. Prognostic significance of COX-2 and β-catenin in colorectal carcinoma. Alex. J. Med. 2014, 50, 211–220. [Google Scholar] [CrossRef]
  48. Timofeeva, O.A.; Zhang, X.; Ressom, H.W.; Varghese, R.S.; Kallakury, B.V.S.; Wang, K.; Ji, Y.; Cheema, A.; Jung, M.; Brown, M.L.; et al. En-hanced expression of SOS1 is detected in prostate cancer epithelial cells from African-American men. Int. J. Oncol. 2009, 35, 751–760. [Google Scholar]
Figure 1. Expression of miRNAs based on BC stages. # p < 0.05.
Genes 13 01629 g001
Figure 2. Expression of target genes on different stages of BC. # p < 0.05.
Genes 13 01629 g002
Figure 3. Urothelial carcinoma showing moderate positive membranous staining for β-Catenin in T1 stage (A) and positive membranous staining for β-Catenin in T2–T4 stage patients (B) (400×). HADC1 shows marked nuclear staining of tumor cells in pT1; (C) and moderate nuclear staining of tumor cells in T2–T4 (D) (200×). HIF1 showing marked nuclear staining of tumor cells in pT1 (E) and mild nuclear staining of tumor cells in T2–T4 (F) (400×), HDAC2 showing strong positive nuclear staining of surface epithelium in pT1; (G) and moderate positive nuclear staining of tumor cells in T2–T4 (H) (200×). PTEN showed moderate positive nuclear staining of tumor cells in pT1 (I) and mild positive nuclear staining of tumor cells in T2–T4 (J) (200×). SOS1 showed moderate positive nuclear staining of tumor cells in pT1 (K) and marked positive nuclear staining of tumor cells in T2–T4 (L) (200×).
Genes 13 01629 g003
Figure 4. Prognostic effect of miRNAs; let-7a-5p, miRNA-449a-5p, miRNA-145-3P, miRNA-124-3P, miRNA-138-5p, and miRNA-23a-5p on CSS.
Genes 13 01629 g004
Figure 5. Prognostic effect of targeted genes; β-Catenin, WNT7A, IRS, FZD4, SOS1, HDAC1, HDAC2, HIF1α, and PTEN on CSS.
Genes 13 01629 g005
Table 1. Primer sequences used for quantitative RT-PCR.
Common NameSequenceAccession No.
WNT7aF-5′-ACTTAGGGGTAAGGAGGGGC-3′
R-5′-GCTGGACCCAAAGCAAAGTG-3′
NM_004625.4
β-cateninF-5′-CTGAGGAGCAGCTTCAGTCC-3′
R-5′-ATTGCACGTGTGGCAAGTTC-3′
NM_001098209.2
IRS2F-5′-CCACTGACAACGAGAGCCAT-3′
R-5′-CCCATGGCCCCAGTGTTTAT-3′
NM_005544.2
FZD4F-5′-CCAACTGGGCACTTTTTCGG-3′
R-5′-TCTAAACAGCAGACAGCGCA-3′
NM_012193.4
SOS1F-5′-TGTGCAAGGCCATGGATACC-3′
R-5′-CCTTGTCAGCACACATTGCC-3′
NM_001382394.1
HDAC1F-5′-ACTGCTAAAGTATCACCAGAGGG-3′
R-5′-CACACTTGGCGTGTCCTTTG-3′
NM_004964.3
HDAC2F-5′-GAGGTGGCTACACAATCCGT-3′
R-5′-TAGCCACTGAAACAAGACTTCA-3′
NM_001527.4
HIF1αF-5′-ACTTGGCAACCTTGGATTGGA-3′
R-5′-GCACCAAGCAGGTCATAGGT-3′
NM_001243084.1
PTENF-5′-AGCTGGAAAGGGACGAACTG-3′
R-5′-ACACACAGGTAACGGCTGAG-3′
NM_001304717.5
GAPDHF-5′-GAAGGTGAAGGTCGTAGTC-3′
R-5′-GAAGATGGTGATGGGATTTC-3′
NM_001357943.2
Table 2. The correlation between miRNAs and targeted genes at T1 and T2–T4 stages.
miRNAmiRNA Regulated StatusTarget GeneGene Regulation StatusPearson’s r (p-Value)
T1T2–T4
Let-7a-5pdownWNT7Aup−0.530 (p < 0.001)−0.687 (p < 0.001)
Let-7a-5pdownβ-cateninup0.418 (p = 0.007)−0.687 (p < 0.001)
Let-7a-5pdownIRS2up0.374 (p = 0.018)−0.664 (p < 0.001)
Let-7a-5pdownFZD4up−0.323 (p = 0.042)−0.733 (p < 0.001)
miR124-3pdownSOS1up−0.630 (p < 0.001)−0.579 (p < 0.001)
miR449a-5pdownHDAC1up−0.326 (p = 0.04)0.369 (p < 0.001)
miR145-3pdownHDAC2up0.271 (p = 0.091)−0.123 (p = 0.186)
miR138-5pdownHIF1αup−0.601 (p < 0.001)0.510 (p < 0.001)
miR23a-5pupPTENdown0.660 (p < 0.001)−0.513 (p < 0.001)
Table 3. Correlation between miRNAs target protein expressions with the clinicopathological characteristics of bladder cancer patients.
GenderAgeTumor Stage
MaleFemalep-Value<70 Years≥70 Yearsp-ValueT1T2–T4p-Value
β-CateninHigh96 (72.72%)17 (68%)0.46486 (61.87%)11 (61.11%)0.2399 (22.5%)88 (75.21%)0.003
Low36 (25.89%)8 (32%)53 (38.12%)7 (38.88%)31 (77.5%)29 (24.78)
HDAC1High72 (58.5%)11 (44%)0.18277 (57.5%)6 (42.9%)0.29534 (85%)45 (38.46%)0.001
Low51 (41.5%)14 (56%)57 (42.5%)8 (57.1%)6 (15%)72 (61.54%)
HIF1αHigh50 (37.9%)7 (28%)0.34654 (40.3%)3 (21.4%)0.16729 (72.5%)28 (23.9%)0.000
Low82 (62.1%)18 (72%)80 (59.7%)11 (78.6%)11 (27.5%)89 (76.1%)
SOS1High81 (61.4%)20 (80%)0.07494 (70.1%)7 (50%)0.12316 (40%)85 (72.6%)0.000
Low51 (38.6%)5 (20%)40 (29.9%)7 (50%)24 (60%)32 (27.4%)
PTENHigh46 (34.8%)7 (28%)0.50750 (37.3%)3 (21.4%)0.23828 (70%)25 (21.4%)0.000
Low86 (65.2%)18 (72%)84 (62.7%)11 (78.6%)12 (30%)92 (78.6%)
HDAC2High64 (48.5%)9 (36%)0.25167 (50%)67 (50%)0.30932 (80%)41 (35.04%)0.000
Low68 (51.5%)16 (64%)5 (35.7%)9 (64.3%)8 (20%)76 (64.95%)
Table 4. 1- and 5-yr cancer-specific survival (CSS) for miRNA and gene products expression.
Expression 1-Year CSS (%)5-Year CSS (%)p-Value
miRNA
Let-7a-5pLow 61.927.9<0.001
High94.368.9
miRNA-449a-5pLow 57.715.7<0.001
High89.567.2
miRNA-145-3PLow 7749.50.05
High70.425
miRNA-124-3PLow 68.537.60.01
High92.357.7
miRNA-138-5pLow 68.732.80.004
High84.762.3
miRNA-23a-5pLow 8054.70.06
High69.934.8
Gene products
β-cateninLow 86.554<0.001
High32-
FZDLow 8755<0.001
High41.9-
HDAC1Low 62.431<0.001
High9464
HDAC2Low 67.6320.004
High8766.6
HIFLow 71.937.40.02
High89.568
IRSLow 91.568.8<0.001
High64.827.9
PTENLow 58.3360.01
High8548
SOS-1Low 93.5570.01
High59.829.7
WNT7aLow 92.959.4<0.001
High50.719.7
Cut-off values were determined based on the maximally selected rank statistics method.
Publisher’s Note: MDPI stays neutral with regard to jurisdictional claims in published maps and institutional affiliations.

