Article

Transcriptomic Analysis Reveals CBF-Dependent and CBF-Independent Pathways under Low-Temperature Stress in Teak (Tectona grandis)

1
Research Institute of Tropical Forestry, Chinese Academy of Forestry, Guangzhou 510520, China
2
College of Forestry, Jiangxi Agricultural University, Nanchang 330045, China
*
Authors to whom correspondence should be addressed.
Genes 2023, 14(11), 2098; https://doi.org/10.3390/genes14112098
Submission received: 12 October 2023 / Revised: 6 November 2023 / Accepted: 11 November 2023 / Published: 18 November 2023
(This article belongs to the Special Issue Plant Genetic Diversity and Omics Research)

Abstract

:
Teak is a rare tropical tree with high economic value, and it is one of the world’s main afforestation trees. Low temperature is the main problem for introducing and planting this species in subtropical or temperate zones. Low-temperature acclimation can enhance the resistance of teak to low-temperature stress, but the mechanism for this is still unclear. We studied the gene expression of two-year-old teak seedlings under a rapid temperature drop from 20 °C to 4 °C using RNA-seq and WGCNA analyses. The leaves in the upper part of the plants developed chlorosis 3 h after the quick transition, and the grades of chlorosis were increased after 9 h, with the addition of water stains and necrotic spots. Meanwhile, the SOD and proline contents in teak leaves increased with the prolonged cold stress time. We also identified 36,901 differentially expressed genes, among which 1055 were novel. Notably, CBF2 and CBF4 were significantly induced by low temperatures, while CBF1 and CBF3 were not. Furthermore, WGCNA successfully identified a total of fourteen modules, which consist of three modules associated with cold stress response genes, two modules linked to CBF2 and CBF4, and one module correlated with the CBF-independent pathway gene HY5. The transformation experiments showed that TgCBF2 and TgCBF4 improved cold resistance in Arabidopsis plants.

1. Introduction

Tectona grandis, commonly known as teak, is a tree species in the Verbenaceae family that produces one of the finest hardwoods globally. The high demand for this hardwood has caused log prices to range from $ 600/m3 to 1000/m3 [1], and its cultivation area has expanded to over 50 countries and regions. Expanding the planting of teak will play a crucial role in the future because of the excessive felling of teak natural forests and increasing demand. However, teak, a wood commonly found in tropical regions, has encountered difficulties due to low temperatures in suboptimal areas.
Temperature is a critical element that significantly impacts the growth and distribution of plants [2]. Mild low-temperature stress triggers reversible changes in plants’ morphology, structure, physiology, and metabolism. On the other hand, severe stress causes irreversible changes that can result in plant death [3]. Due to their immobility, plants have developed various survival strategies for enduring low-temperature stress. When subjected to low-temperature stress, genes associated with osmotic adjustment, photosynthesis, antioxidation, and detoxification exhibit molecular-level responses, facilitating plant survival through the protection and restoration of cellular structure and function, as well as the induction of changes across various levels, from molecules to individuals [4]. Furthermore, following cold acclimation, plants significantly increase their resistance to low temperatures.
The transmission of signals triggered by cold stress is characterized by the participation of numerous gene responses, factors, and hormones, forming a complex network of interactions. The ICE-CBF-COR pathway has been extensively studied among these pathways [5]. The core gene in this pathway, CBFs (C-repeat binding factor), is induced by ICEs (inducer of CBF expression) to activate CORs (cold-responsive). Generally, in Arabidopsis, cold induces three CBFs (CBF1, CBF2, CBF3), while drought and salt stress activate CBF4 [6]. Additionally, the ICE possesses a MYC structure and functions as a basic helix–loop–helix (bHLH) transcription factor. Although ICE1 expression is constitutive, it rarely influences CBF3 expression [7]. However, it can enhance CBF3 expression under low-temperature conditions. Also, ICE2 and ICE1 show a high degree of homology and are involved in regulating CBF1 [8]. Generally, CBF1 and CBF3 take precedence over CBF2 in terms of expression, and CBF2 acts as a negative regulator for CBF1 and CBF3 during low-temperature stress. CBF1 has a limited impact on CBF3 expression, and there are a few feedback loops involving CBF1, CBF3, and CBF2 [9]. The CBF activates COR expression by binding to the cis-acting element DRE/CRT in the promoter, which has a core sequence ‘CCGAC.’ Two or three CBFs jointly regulate over two-thirds of CORs, while a single CBF controls the remaining CORs [10].
Additionally, several regulatory factors located upstream of CBFs are involved in regulating the ICE-CBF-COR pathway. One such factor is CAMTA, which positively influences the expression of CBF1 and CBF2 [11]. For instance, the expression of CBF1-3 can be regulated by CAMTA1 and CAMTA2, while CAMTA3 mediates CBF2 [12,13]. Additionally, the regulation of CBF1 expression by CAMTA3 and CAMTA5 is commonly seen during a rapid temperature drop, but their role is seldom observed during a gradual decrease [11]. In addition, MYB15 functions as a repressor of this pathway, preventing CBF expression. Surprisingly, ICE1 can also decrease MYB15 expression. Furthermore, ICE1 is degraded by the ubiquitin ligase HOS1 and the SUMO ligase SIZ1, resulting in its stability and limited degradation [14,15].
There are two ways in which plant hormones are involved in the response to cold stress. ABA (abscisic acid), JA (jasmonic acid), SA (salicylic acid), BR (brassinosteroid), and ET (ethylene) are involved in the plant response to cold stress by impacting CBF either individually or in combination. In contrast, the effects of Auxin and CK (cytokinin) are attributed to the modulation of hormone transporters under cold stress conditions, consequently impacting concentration gradients [16,17]. Moreover, downstream gene activation can be directly triggered by HY5 (enhanced hypocotyl 5), REV4 (reville4), REV8 (reville8), and CCA1 (circular clock associated 1) without the involvement of the CBF pathway [18,19].
Despite the importance of ICE-CBF-COR as a response pathway to cold stress, it is worth noting that CBFs only govern a mere 10–20% of CORs, and even triple mutants of CBFs still retain the ability to undergo cold acclimation [9]. In regions with temperate climates, plants can adapt to cold stress by regulating gene expression and metabolism at non-freezing temperatures, resulting in improved cold resistance. However, tropical plants rarely experience low temperatures throughout their lifespan, making them vulnerable to such conditions. The teak tree is a species that is typically found in tropical climates. It requires temperatures between 25 and 30 °C for optimal growth. It should be noted that they are prone to injury at temperatures of 15 °C and below. Seedlings and young forests can experience mortality due to short-term exposure to temperatures below 4.5 °C [20].
To comprehend the cold resistance mechanism of teak during rapid temperature drops, we employed RNA-seq and WGCNA methodologies to assess gene expression alterations in two-year-old teak seedlings at three distinct time intervals after a sudden temperature shift from 20 °C to 4 °C. Furthermore, we analyzed the hub gene and its corresponding regulatory network. The results offer data for studying the cold resistance mechanism of teak and serve as a reference for genetic breeding.

2. Materials and Methods

2.1. Materials and Treatments

Two-year-old teak variety 7514 was planted in a nursery located at the Institute of Tropical Forestry, Chinese Academy of Forestry in Guangzhou (Guangzhou, N 113°21′40″, E 23°7′28″). In late November 2015, the seedlings of teaks were transplanted into a greenhouse for treatment preparation. The conditions of the greenhouse were set at day/night temperatures of 20 °C/18 °C, a photoperiod of 16/8 h, and a light intensity of 90 μmol·m−2·s−1. After 14 days of transplanting, the plants were treated at 4 °C and then sampled at 0 h, 3 h, and 9 h, respectively. Each sample consisted of the functional leaves of at least three seedlings or more, and there were three biological repetitions. The samples were frozen with liquid nitrogen and stored in a −80 °C refrigerator. Next, the samples were used for the determination of the physiological index, transcriptomic library construction, and real-time quantitative PCR (qRT-PCR) validation.

2.2. Determination of Free Proline and Superoxide Dismutase

The free proline content was determined by sulfosalicylic acid-acidic ninhydrin, and the colorimetry was set at 520 nm. Additionally, the activity of SOD was measured using the tetrazolium blue (NBT) photochemical reduction. The colorimetry was performed at 560 nm, and the 50% inhibition of NBT photochemical reduction was implemented as an enzyme activity unit (U) [21]. All the measurements included three biological replicates. Finally, the SAS (V9.4) was conducted to analyze the variance and Duncan multiple comparisons.

2.3. Library Construction and Sequencing

Total RNA was extracted with an RNA Extraction Kit (Tiangen, Beijing, China). The library construction and sequencing were conducted by Novogene company (Novogen, Beijing, China). The libraries were constructed by using the NEBNext® UltraTM RNA Library Prep Kit (Illumina, San Diego, CA, USA) to build the library. The first strand of cDNA was synthesized in the M-MuLV reverse transcriptase system using fragmented mRNA as the template and random oligonucleotides as the primer. Then, the RNA chain was degraded by RNaseH. The second strand of cDNA was synthesized in the DNA polymerase I system using dNTPs as the raw material. Then, the purified double-stranded cDNA underwent end repair, the addition of A tail, and the sequencing connectors were connected. The cDNA of about 250~300 bp was screened with AMPure XP beans and amplified by PCR, and the PCR products were purified with AMPure XP beans again. Finally, the libraries were obtained. After the construction of the library, we used the Qubit2.0 Fluorometer for the preliminary quantification and diluted the library to 1.5 ng/μL. Then, the Agilent 2100 bioanalyzer was employed to detect the insert size of the library. After the insert size met the expectation, qRT-PCR was supposed to accurately quantify the effective concentration of the library (the effective concentration of the library was higher than 2 nM) to ensure that the library was of high quality. After the library passed the inspection, the Illumina HiSeqTM 2000 platform was used to perform next-generation sequencing.

2.4. Data Processing and Differential Gene Expression (DEG) Analysis

The raw data obtained from the sequencing were required to undergo quality control. Then, we removed the reads with adaptors and filtered the reads with base mass values less than or equal to 20 and an N ratio greater than 5%. In addition, the HISAT2 (v2.0.5) software was designated to compare clean reads with the teak genome as the reference [22] and use StringTie (1.3.3b) to splice new transcripts [23]. After the transcript was joined, the fragments per kilobase per million mapped reads (FPKM) value of each gene in each sample was calculated using featureCounts (1.5.0-p3) [24]. DEGs were analyzed using DESeq2 (1.16.1) [25], and the p-value generated from the original hypothesis test was corrected. padj < 0.05 and |log2 foldchange| > 1 were the judgment standard for significant differences. According to the obtained sequence, the NR and TAIR databases (www.arabidopsis.org) were annotated with blast results, and the E-value was set at 10−5. The GO enrichment analysis of DEGs and the statistical KEGG pathway enrichment of DEGs were estimated using clusterProfiler (3.4.4) [26] and with a p-value < 0.05, respectively.

2.5. Weighted Gene Correlation Network Analysis (WGCNA)

To further explore the interaction between DEGs, we analyzed all the samples using WGCNA. Counts below 60 in all samples were deleted, and the first 90% of genes with variance were screened for WGCNA [27]. The recommended stepwise method was used for analysis, and the minimum number of modular genes was 30. The clustering method identified the highly similar modules, and the digital labels were converted into colors. Then, the highly identical modules were identified via clustering, and the new modules were merged according to the module characteristic genes. MCODE screened the hub gene, and the co-expression network was displayed by Cytoscape (v3.10.1) [28].

2.6. qRT-PCR Validation of DEGs

The RNA extraction kit TAKARA MiniBEST Plant RNA Extraction Kit (No.9769), reverse transcription kit PrimeScript RT Master Mix (Perfect Real Time) (No. RR036A), and qRT-PCR kit TAKARA TB Green®Premix ExTM Taq (TLi RNaseH plus) (No. RR420A) were purchased from TAKARA company. The RNA extraction and reverse transcription followed the kit instructions. The cDNA product obtained by reverse transcription was standardly diluted to 500 ng for the template. All the qRT-PCR primers (Table 1) were designed by Oligo 7.0 [29], and the qRT-PCR program was carried out according to the manufacturer’s instructions with triplicates. Actin was used as an internal reference gene [30]. Moreover, the relative quantitative results of the genes were calculated by the 2−ΔΔCt method according to the Ct value, and the relative expression difference was analyzed by an amplification efficiency of 100% [31].

2.7. Transformation Verification of CBF Gene Function in Teak

In genome-wide identification, we found that two teak CBFs (Tg1g07960 and Tg06g13830) have low-temperature responsive cis-acting elements LTR, named TgCBF2 and TgCBF4, respectively. Due to the lack of an established transformation system for teak, we employed the Arabidopsis transformation system to verify the functionalities of these two genes. The CDS of TgCBF2 and TgCBF4 was cloned according to the gene sequence and inserted into the overexpression vector pCAMBIA1302 behind the CaMV 35S promoter through KpnI/SpeI restriction sites, respectively. Subsequently, the recombinant expression vector was introduced into wild-type Arabidopsis (Col-0) via the Agrobacterium GV3101 strain using the floral dip technique. The positive transformants were selected by MS medium containing 30 μg/mL kanamycin.
The Arabidopsis seeds were gathered, their surface was sterilized, and they were placed on a 0.8% agar-solidified MS medium. After a four-day treatment period at 4 °C in the absence of light, the seeds were moved to a long-day photoperiod of 16 h of light and 8 h of darkness at 20 °C. Finally, Arabidopsis thaliana was grown at 20 °C, stressed at −4 °C for 12 h, and recovered at 20 °C for 3 days during the rosette stage. The validation of the transformed plants was performed using fluorescence microscopy.

3. Results

3.1. Teak Exhibits Signs of Damage under Temporary Low Temperatures

  • The detrimental effect of cold stress on teak’s leaf morphology is evident from the observed damage at 4 °C (Figure 1). Firstly, the injured symptoms initially occurred at the top of the plant. After 3 h of 4 °C, the top leaves started to present brownish chlorosis spots sporadically, indicating freezing injury (Figure 1B). Subsequently, the top and bottom of the leaves were more injured, and the chlorosis spots increased and enlarged at 4 °C for 9 h (Figure 1C). These results indicate that teak is susceptible to temporary low-temperature stress, with young leaves being particularly vulnerable. These morphological alterations may be connected to secondary metabolites in the leaves.
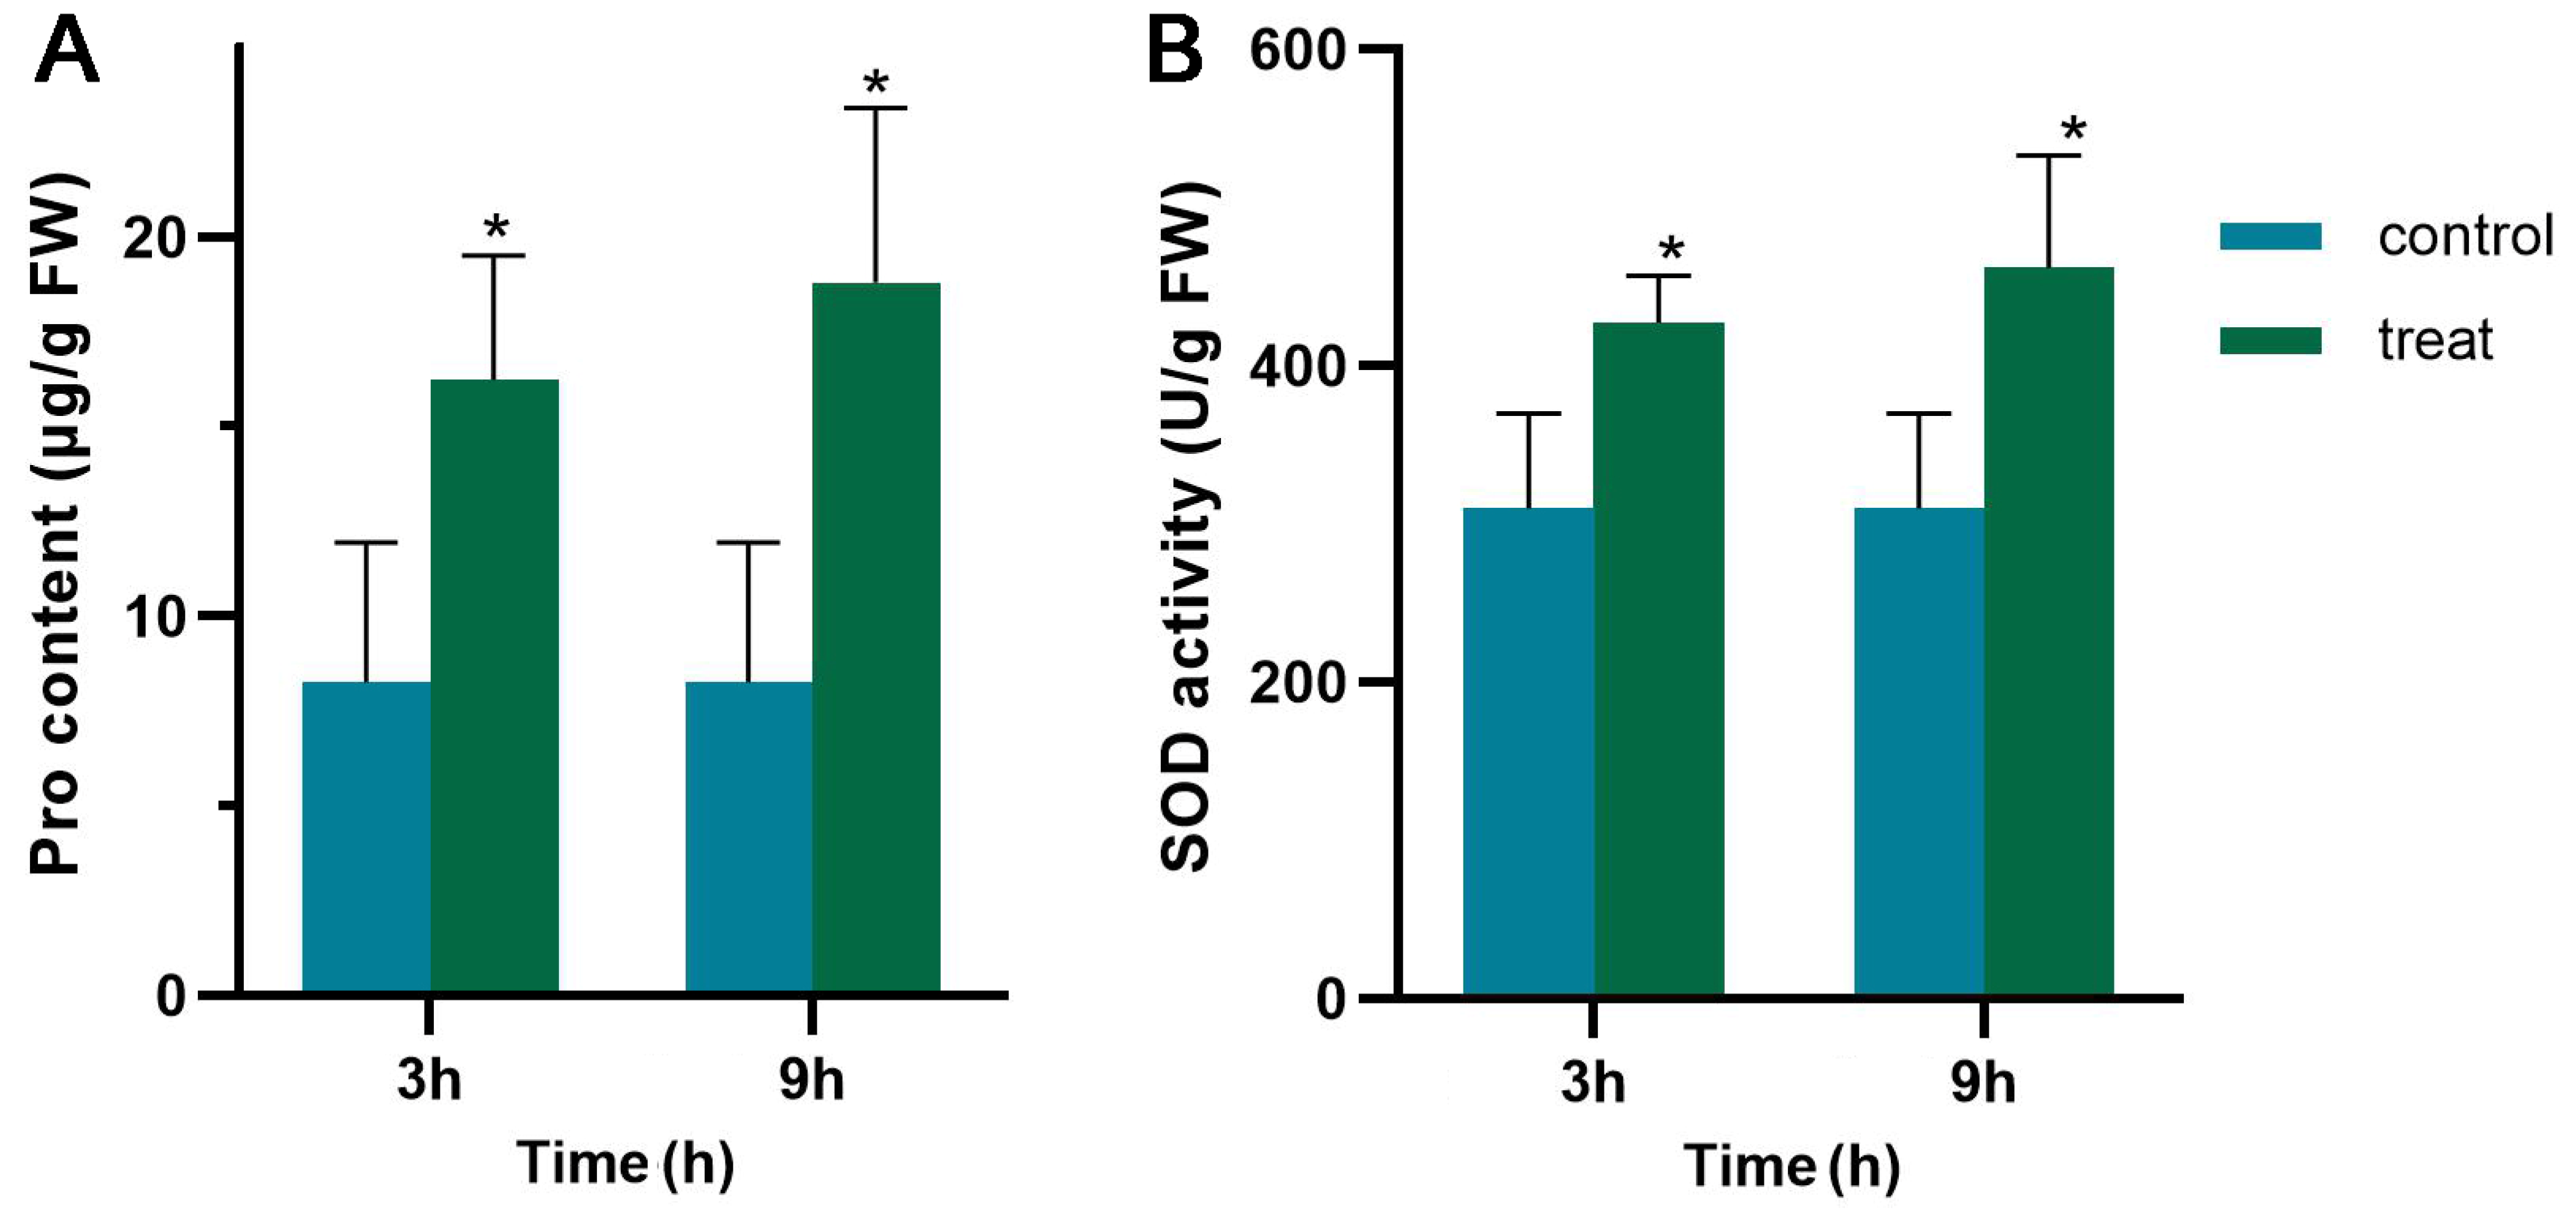
  • Teak showed injury symptoms at low temperatures, as described above, implying physiological and biochemical changes in teak (Figure 2). In this study, it was discovered that the osmotic adjustment index, specifically the free proline content, as well as the oxidative stress index and superoxide dismutase (SOD) content, exhibited a significant increase during short-term low-temperature stress. As a result, during the initial treatment (4 °C for 3 h), the free proline concentration substantially increased from 8.15 μg/g to 16.14 μg/g, representing a significant difference. Moreover, the activity of SOD experienced a noteworthy enhancement from 309.7 U/g to 427.117 U/g. After that, the content of free proline and SOD continuously increased. The content of free proline reached 18.7 μ g/g, and the content of SOD was 461.5 U/g in the second treatment (4 °C for 9 h).

3.2. A Total of 1055 Novel Genes Were Identified via Transcriptome Analysis

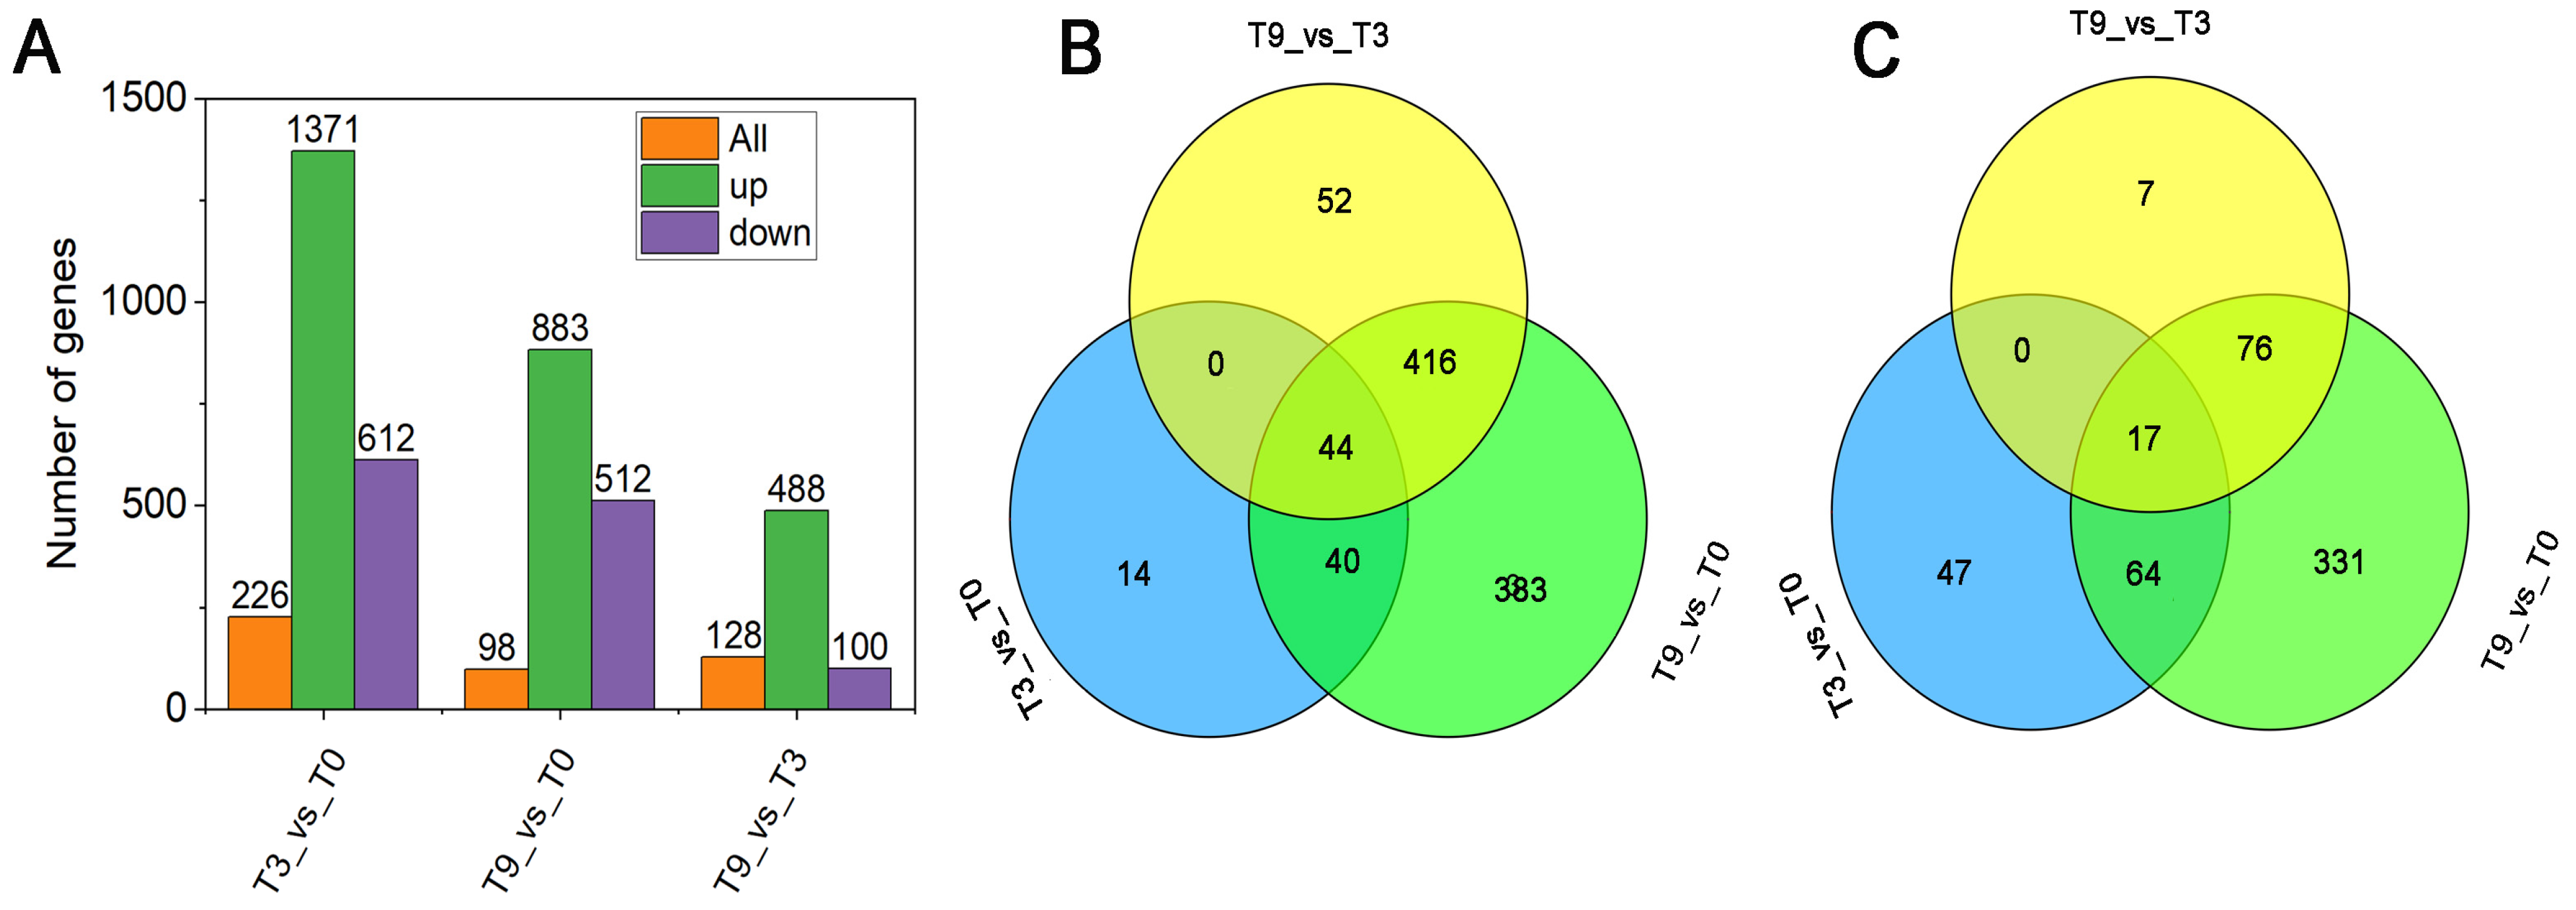
The high-throughput sequencing of nine samples at three stages generated 66.73 G of clean reads, with a minimum of 6.11 G obtained from each sample (Table 2). The reads were uniquely aligned with the teak reference genome (https://datadryad.org/stash/dataset/doi:10.5061/dryad.77b2422, accessed on 15 January 2020) [32] at an efficiency ranging from 84.22% to 89.33%. The reference-guided assembly of mapped reads using the Cufflinks/Cuffmerge pipeline identified 36,901 genes, of which 1055 were novel [33]. Firstly, there were 226 genes between T3 and T9, including 128 down-regulated and 98 up-regulated genes. Secondly, 1371 DEGs were in T9 vs. T0, in which 488 genes were down-regulated, and 883 were up-regulated. Thirdly, we generated 100 down-regulated genes and 512 up-regulated genes in the T3 vs. T0 group (Figure 3A). Among these genes, 44 up-regulated and 17 down-regulated genes were common in the three groups (Figure 3B). qRT-PCR results are shown in Supplementary Materials Figure S1.

3.3. Enrichment Characteristics of KEGG and GO of DEGs

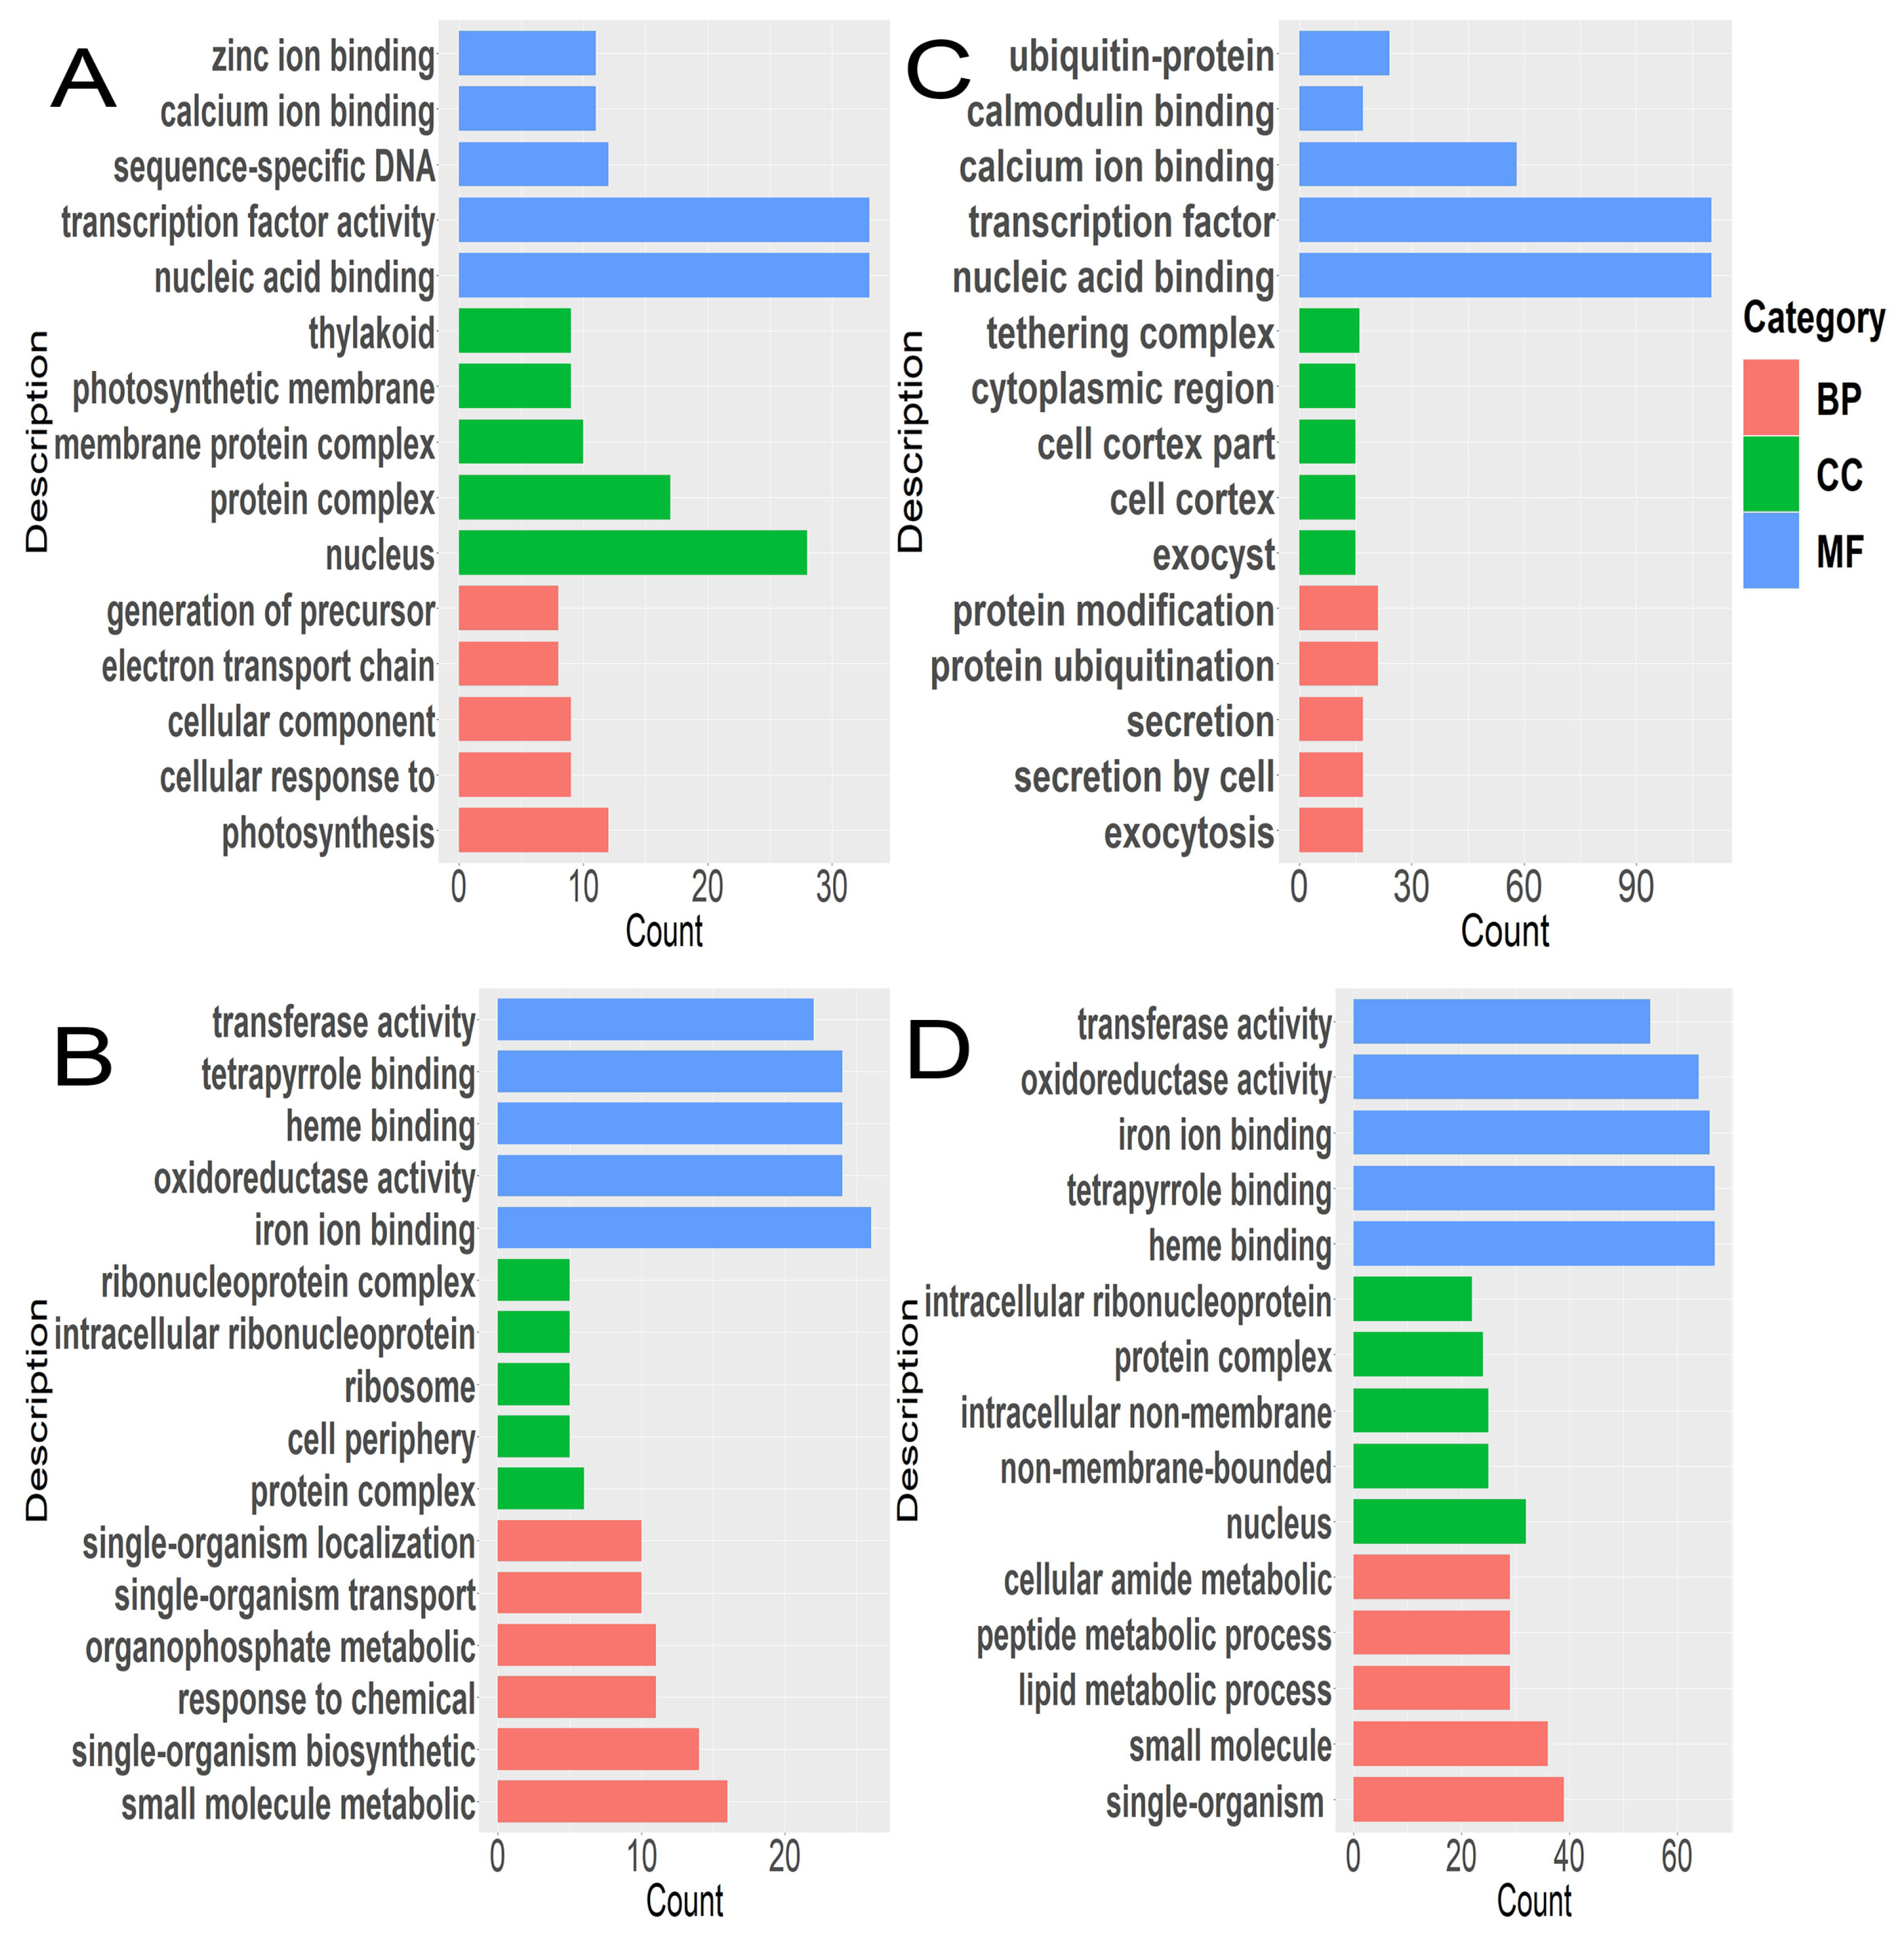
A total of 2684 and 13,126 DEGs were assigned GO terms in T3 vs. T0 and T9 vs. T0. After treatment for 3 h at 4 °C, the up-regulated DEGs were primarily enriched in the electronic transmission chain of the photosynthetic system and responded to internal stimuli in the biological process; in terms of cell composition, the enrichment mainly included the nucleus, photosynthetic membrane, and thylakoid and in terms of the molecular function, the enrichment mainly related to transcription factors (p < 0.05) (Figure 4A). After 3 h of treatment at 4 °C, the down-regulated DEGs were mainly enriched in the auxin response, hormone response, photosynthesis, and other aspects of the biological process. The cell wall, photosynthetic system, and oxidation–reduction were the most enriched in the cellular composition; this enrichment was mainly related to the oxidation–reduction enzyme activity and transferase activity in the molecular function category (Figure 4B).
After 9 h of treatment at 4 °C, the up-regulated DEGs were mainly enriched in protein ubiquitination, protein modification, exocytosis, etc., in the biological process; in cell composition, they were mainly enriched in cytoplasm, various perimembranes, etc., and in the molecular function, they were mainly enriched in the calcium-binding protein, ubiquitin transferases, etc. (p < 0.05) (Figure 4C). Furthermore, the down-regulated DEGs were mainly concentrated in cell homeostasis, redox homeostasis, protein folding, photosynthetic system, and the biological process; in the cell composition, they were mainly concentrated in the photosynthetic system complex, thylakoid, etc.; in the molecular function, they were mainly concentrated in oxidoreductase activity, transferase activity, etc. (Figure 4D).
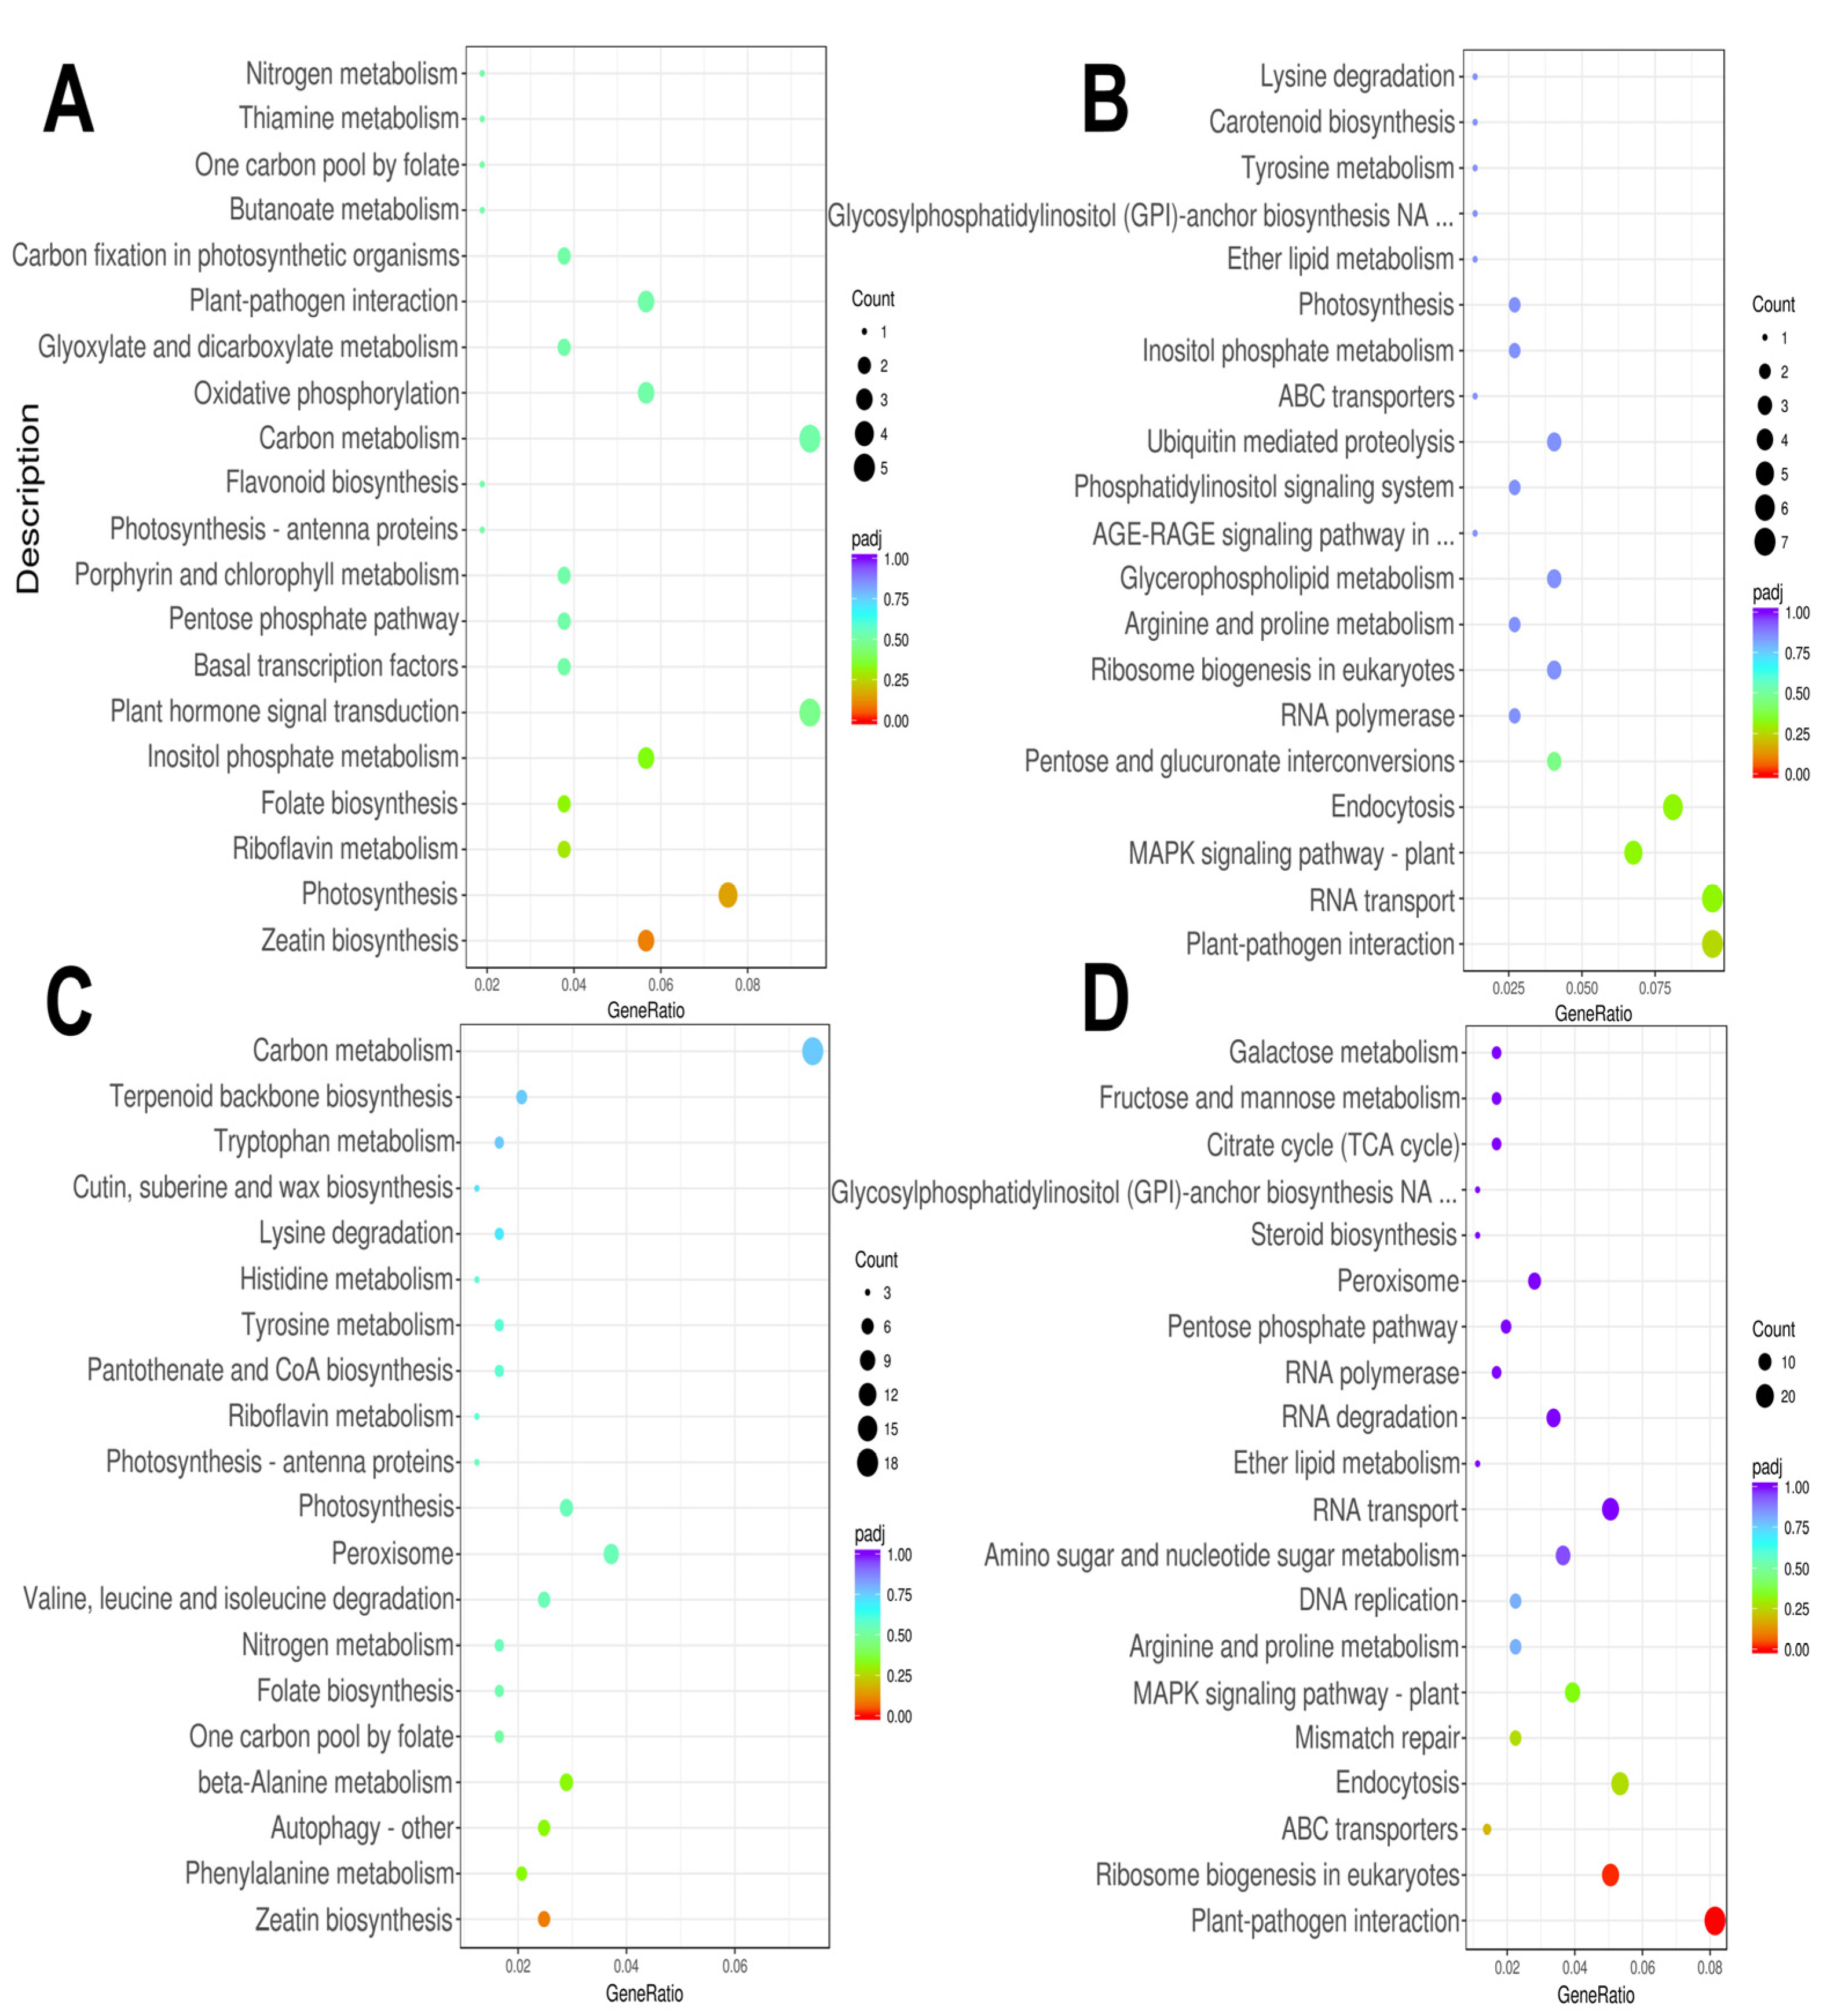
The KEGG enrichment analysis showed that the most significant down-regulated DEGs were enriched in photosynthesis, plant hormone signal transduction, oxidative phosphorylation, and other pathways (Figure 5A). In contrast, up-regulated DEGs were mainly enriched in the MAPK signal transduction pathway, mutual transformation between pentose and glucuronic acid, ubiquitin-mediated protein decomposition, and so on (Figure 5B). After 9 h of treatment at 4 °C, the DEGs were down-regulated and enriched in autophagy, photosynthesis, and nitrogen metabolism (Figure 5C), while up-regulated DEGs were enriched in plant–pathogen interactions, the MAPK signal transduction pathway, and arginine and proline metabolism (p < 0.05) (Figure 5D).

3.4. DEGs Involved in Osmoregulation Pathway

In total, 136 genes concerning osmoregulation were detected under low-temperature stress in teak leaves, including 98 genes involved in carbohydrate metabolism and 38 genes relevant to proline and LEA protein. Notable changes were observed in the genes involved in sucrose synthase, UDP-glycosyltransferase, α-Amylase, transporter, and branching enzyme concerning sugar metabolism. The expression of UGT73B4 (Tg12g12930) exhibited a significant 3-fold up-regulation after 3 h at low temperature and a remarkable 8.4-fold up-regulation after 9 h. Nevertheless, the expression of UGT73C1 (Tg13g10640) exhibited significant down-regulation following 3 h of cold stress, with a decrease of 1.27-fold and a further decrease of 2.15-fold after 9 h. Furthermore, following 3 h of treatment at low temperatures, the expression levels of PRP2 (Tg08g16790) and LEA27 (Tg17g07560) exhibited a 7-fold and 1-fold increase, respectively. After 9 h, the expression levels increased by 8-fold and 2.7-fold, respectively (Figure 6).
Proline and soluble sugar are usually indicators of plant cold resistance and the accumulation of the above substances in plants with cold resistance under cold stress is relatively high. We found that only a few proline-synthesis-related genes and LEAs changed significantly, which might be related to their role in the osmoregulation of teak (Figure 6).

3.5. DEGs Involved in Antioxidant Enzyme Genes under Low-Temperature Stress

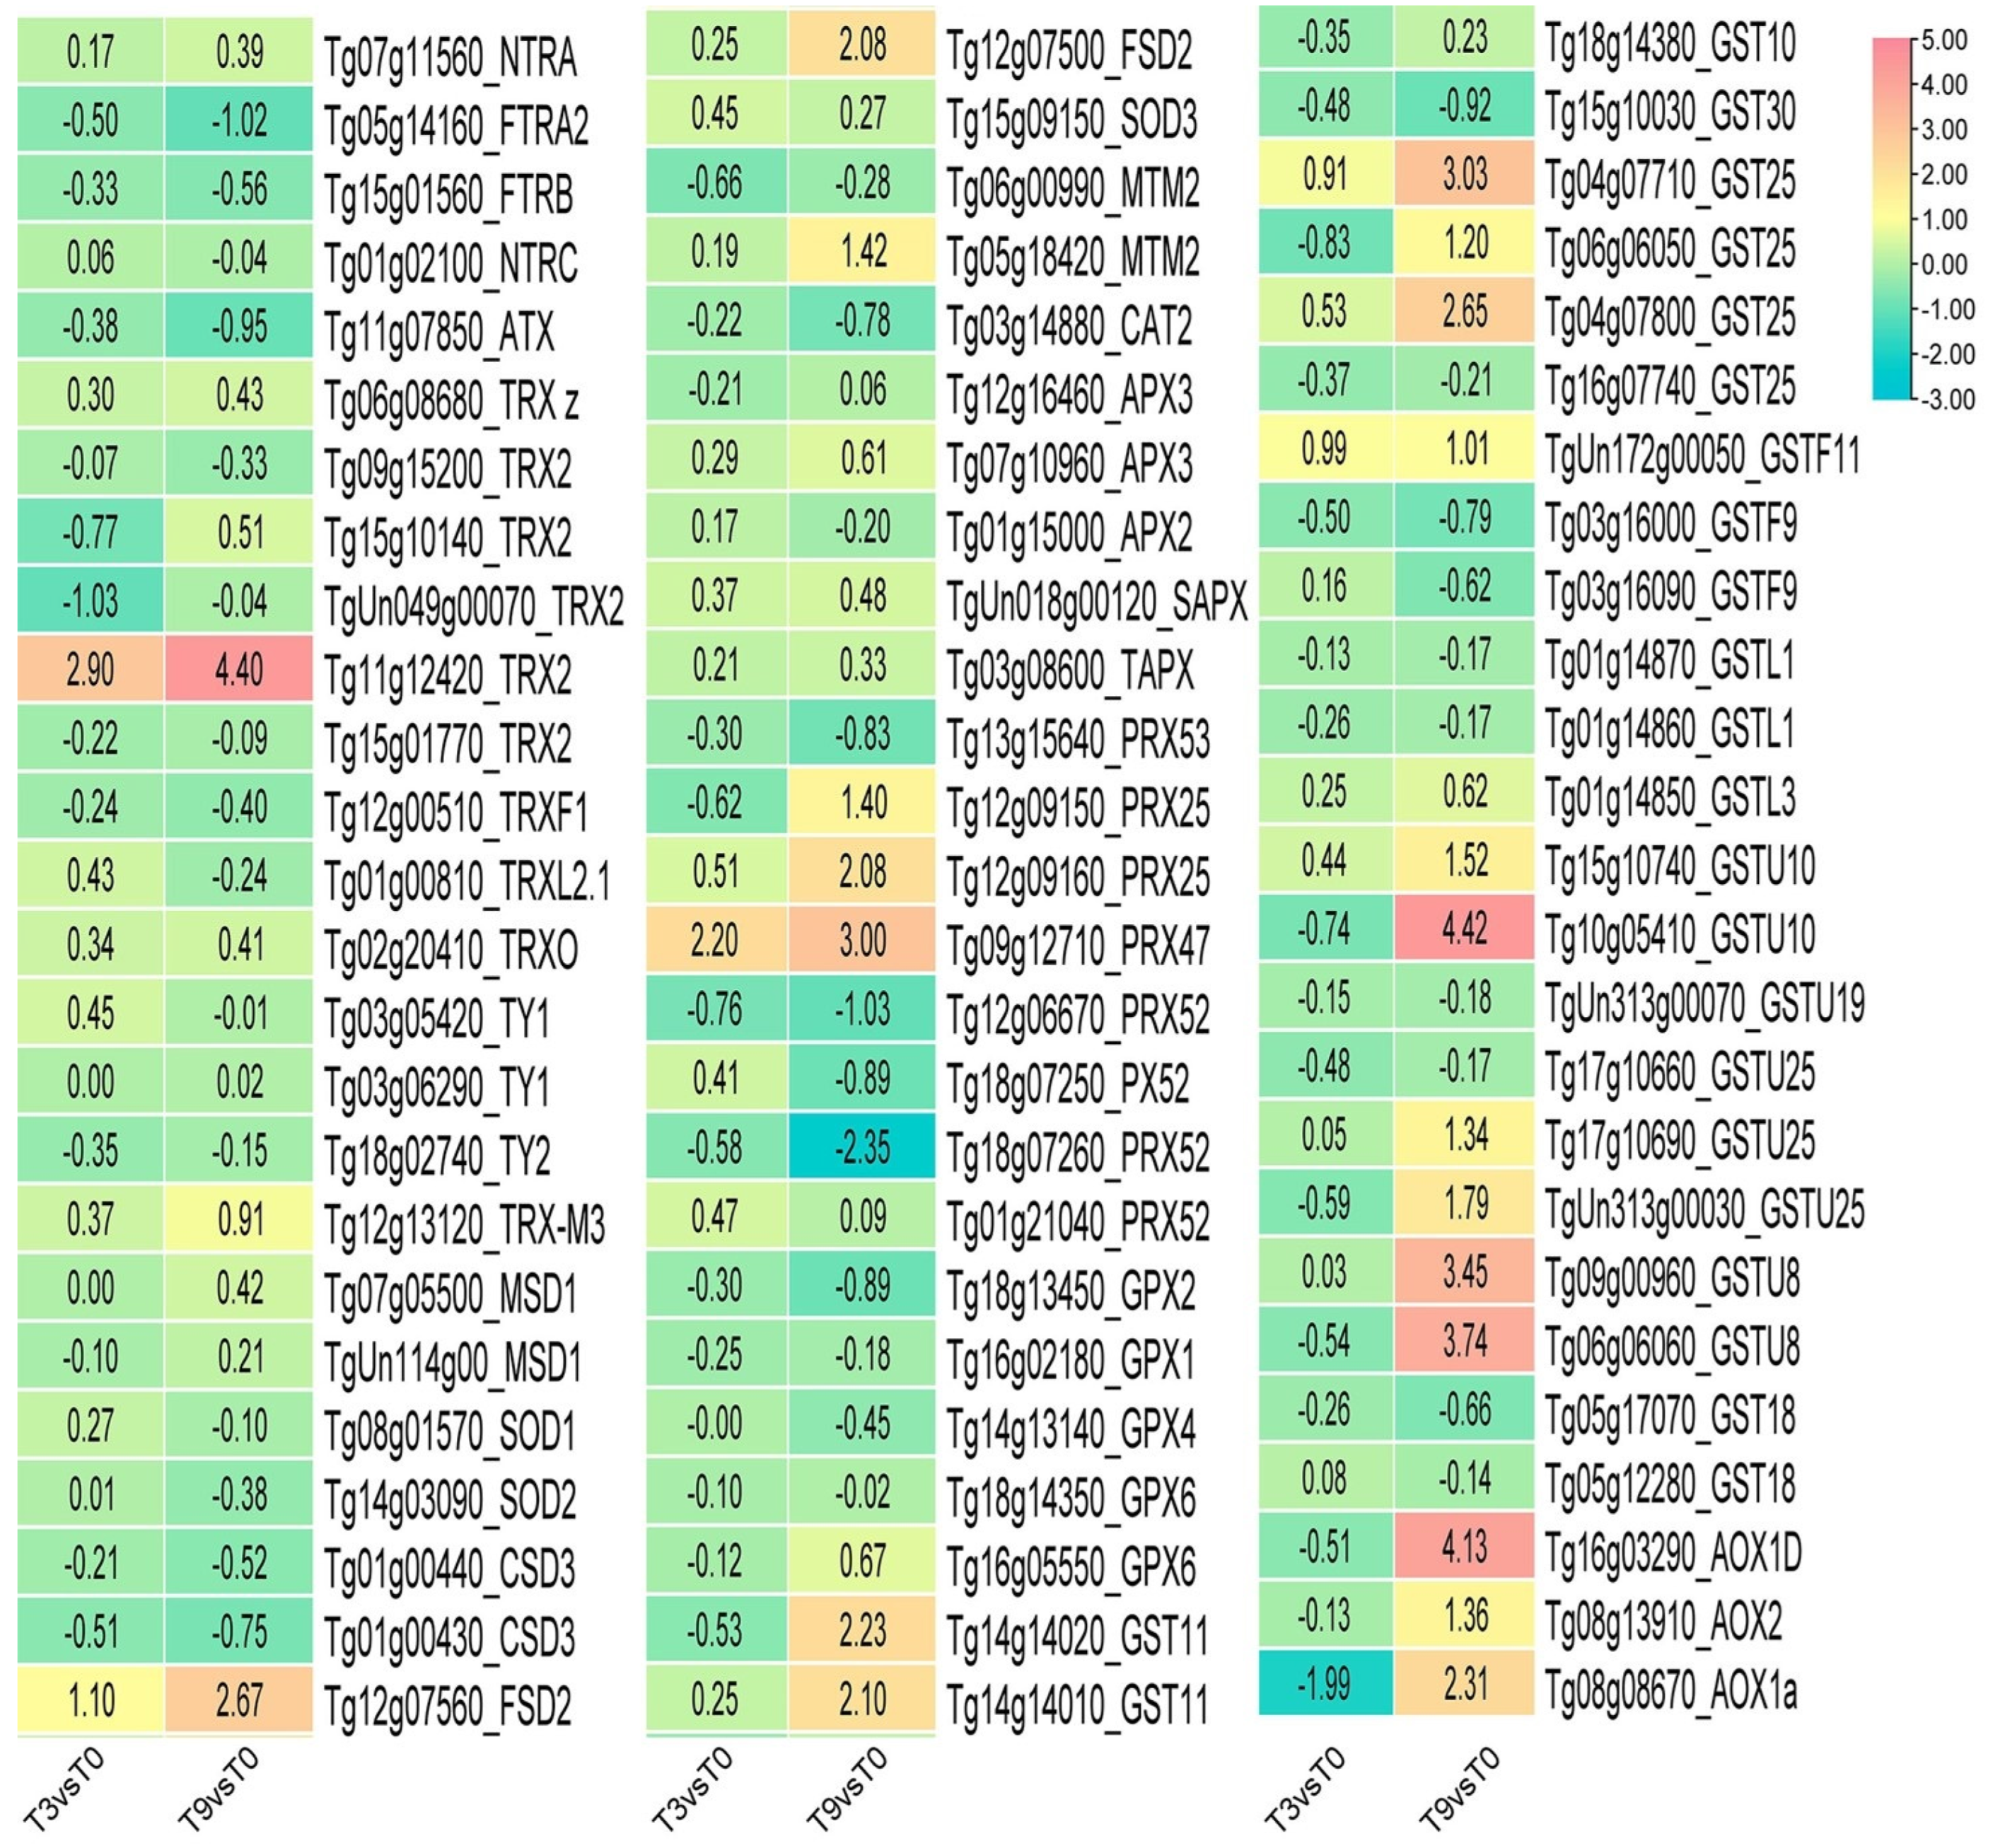
Under low-temperature stress, 167 antioxidant enzyme genes were detected in teak leaves. The DEGs showed that the expressions of Trx2 (TG1G12420) and Prx47 (Tg09g12710) were most significantly up-regulated after 3 and 9 h of low temperatures. The expression of PRX52 (Tg18g07260) was not considerably down-regulated after 3 h of cold stress but significantly down-regulated after 9 h (Figure 7).
The results of our research demonstrate that teak leaves experience considerable changes in the expression of antioxidant enzyme genes when exposed to cold stress. Compared to 3 h of cold stress, a significantly higher expression of antioxidant enzyme genes was observed after 9 h. This suggests a prolonged duration of cold stress, increased ROS accumulation, and aggravated cell damage. In teak, detecting nearly all the significant genes responsible for antioxidant enzymes under cold stress highlights the highly conserved regulation of antioxidant genes in evolution.

3.6. DEGs Involved in PSI and PSII under Low-Temperature Stress

After 3 h of cold stress, the teak leaves showed chlorosis symptoms, indicating that the photosynthetic system of teak was affected by cold stress. Fifty-six related genes were detected in teak leaves under transient cold stress, involving Photosystem I and Photosystem II core protein, peripheral protein, and antenna protein genes. The analysis of differentially expressed genes revealed significant changes in the expression of several Photosystem II genes in teak after a 3-h exposure to low temperatures. Notably, the expression of PsbB (TgUn002g01810) was up-regulated by a factor of 2.79, while the expression of PsbC (TgUn002g01720) was up-regulated by a factor of 2.69, representing the most pronounced changes observed. Following 9 h of cold stress, the expression of these two genes experienced a slight decline, with up-regulation rates remaining at 2.68 and 2.63 times, respectively. The expression of the Photosystem I gene PsaB (TgUn002g01730) exhibited a 1.4-fold increase following 3 h of cold stress and a 1.8-fold increase after 9 h of cold stress (Figure 8).
According to our research findings, a low-temperature exposure of 3 h resulted in a significant up-regulation of the core protein gene of photosystem I, as well as the up-regulation of the core protein, peripheral protein, and antenna protein genes of photosystem II. These results support the conclusion that PSI exhibits more excellent stability than PSII under low-temperature conditions. Furthermore, it is worth noting that the core protein gene of PSI experienced notable alterations after 3 h, potentially linked to the cold sensitivity of teak.

3.7. CBF Expression Pattern under Low-Temperature Stress

The ICE1 gene in teak remains relatively stable when exposed to low temperatures, indicating that low temperatures do not significantly impact the ICE gene. CBF2 (TgUn004g00050) and CBF4 (Tg06g13830) exhibited up-regulation following 3 h of exposure to low temperatures, although the increase in the CBF2 expression was relatively modest. The up-regulation of the CBF4 expression was significant, with a 3.66-fold increase. The expression of CBF2 showed minimal change after 9 h, whereas the expression of CBF4 was significantly up-regulated by 7.2 times (Figure 9). These results demonstrate that low temperature led to the induction of CBF2 and CBF4 genes in teak, resulting in significant changes in the expression of CBF4.
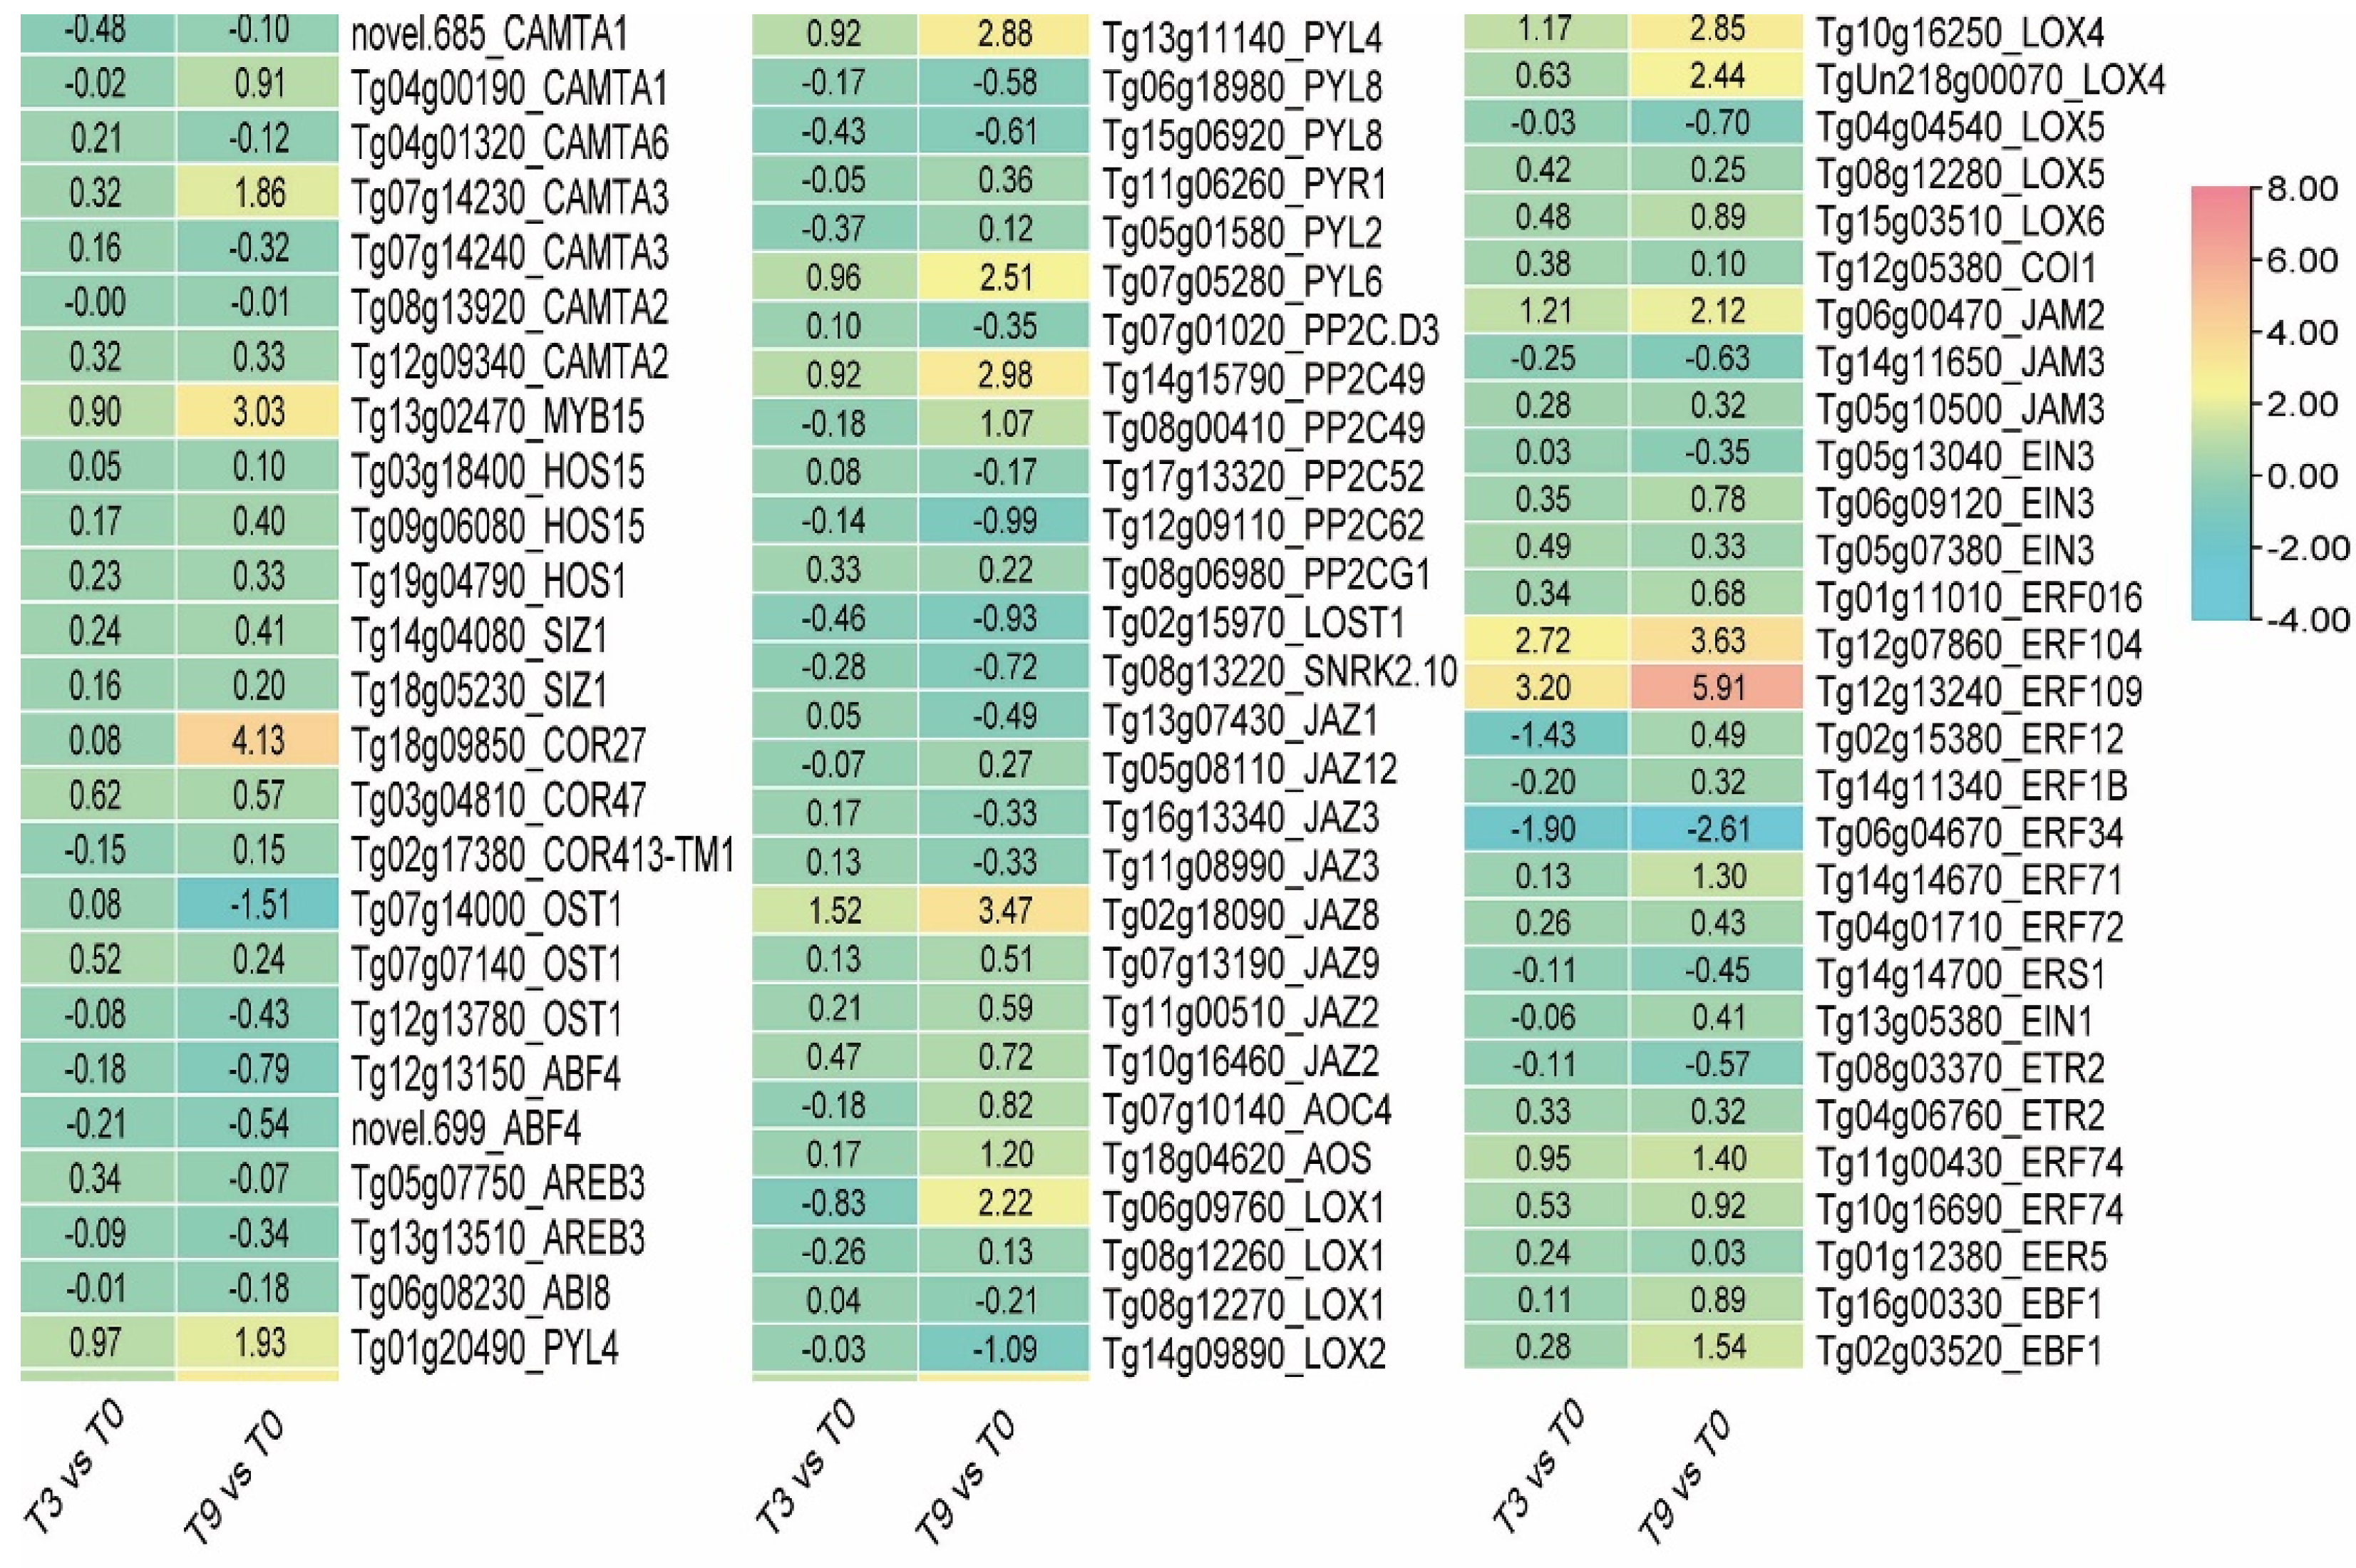
In terms of hormonal regulation pathways, after 3 h of exposure to low temperatures, the expressions of JAZ8 (Tg02g18090), LOX4 (Tg10g16250), and JAM2 (Tg06g00470), which are essential genes of the jasmonic acid pathway in teak, were significantly up-regulated by 1.52, 1.17, and 1.21 times, respectively. Nevertheless, the expression levels of ERF34 (Tg06g04670) and ERF12 (Tg02g15380), which are crucial genes in the ethylene pathway, exhibited significant down-regulation. Following 9 h of exposure to cold stress, the expression levels of JAZ8 (Tg02g18090), LOX4 (Tg10g16250), JAM2 (Tg06g00470), ERF104 (Tg12g07860), and ERF109 (Tg12g13240) exhibited significant up-regulation by 3.47-, 2.85-, 2.12-, 3.63-, and 5.91-fold, respectively, while ERF34 (Tg06g04670) showed a decrease of 2.61-fold. Following a period of 9 h of exposure to cold stress, the expressions of the genes involved AOS (Tg18g04620), PP2C49 (Tg14g15790, Tg08g00410), PYL4 (Tg01g20490, Tg13g11140), PYL6 (Tg07g05280), and EBF1 (Tg02g03520) were significantly up-regulated by 1.20, 2.98, 1.07, 1.93, 2.88, 2.51, and 1.54 times, respectively (Figure 9). Additionally, the expression levels of HOS1, EGR2, ABI1, BTF3, and MYBS, which are the genes that regulate the CBF pathway, exhibited minimal alteration in teak under cold stress. However, OST1 (Tg07g14000) displayed minimal change after 3 h of cold stress but experienced a significant down-regulation after 9 h. After 3 h of exposure to low-temperature stress, no notable alterations were observed in the CAMTA gene. Subsequently, after 9 h of stress, the expression of CAMTA3 (Tg07g14230) exhibited a significant up-regulation of 1.86-fold (Figure 10). The findings of this study support the conclusions of previous research in that ABA, ET, SA, JA, and GA play a role in the response of plants to cold stress either independently or through an interaction. Simultaneously, the situation above also suggests that the ABA, JA, and ethylene pathways assume a pivotal function in teak’s response to low-temperature stress.

3.8. The Expression of CBF-Independent Genes HY5 and REV5 in Teak Changed Dramatically in Response to Cold Stress

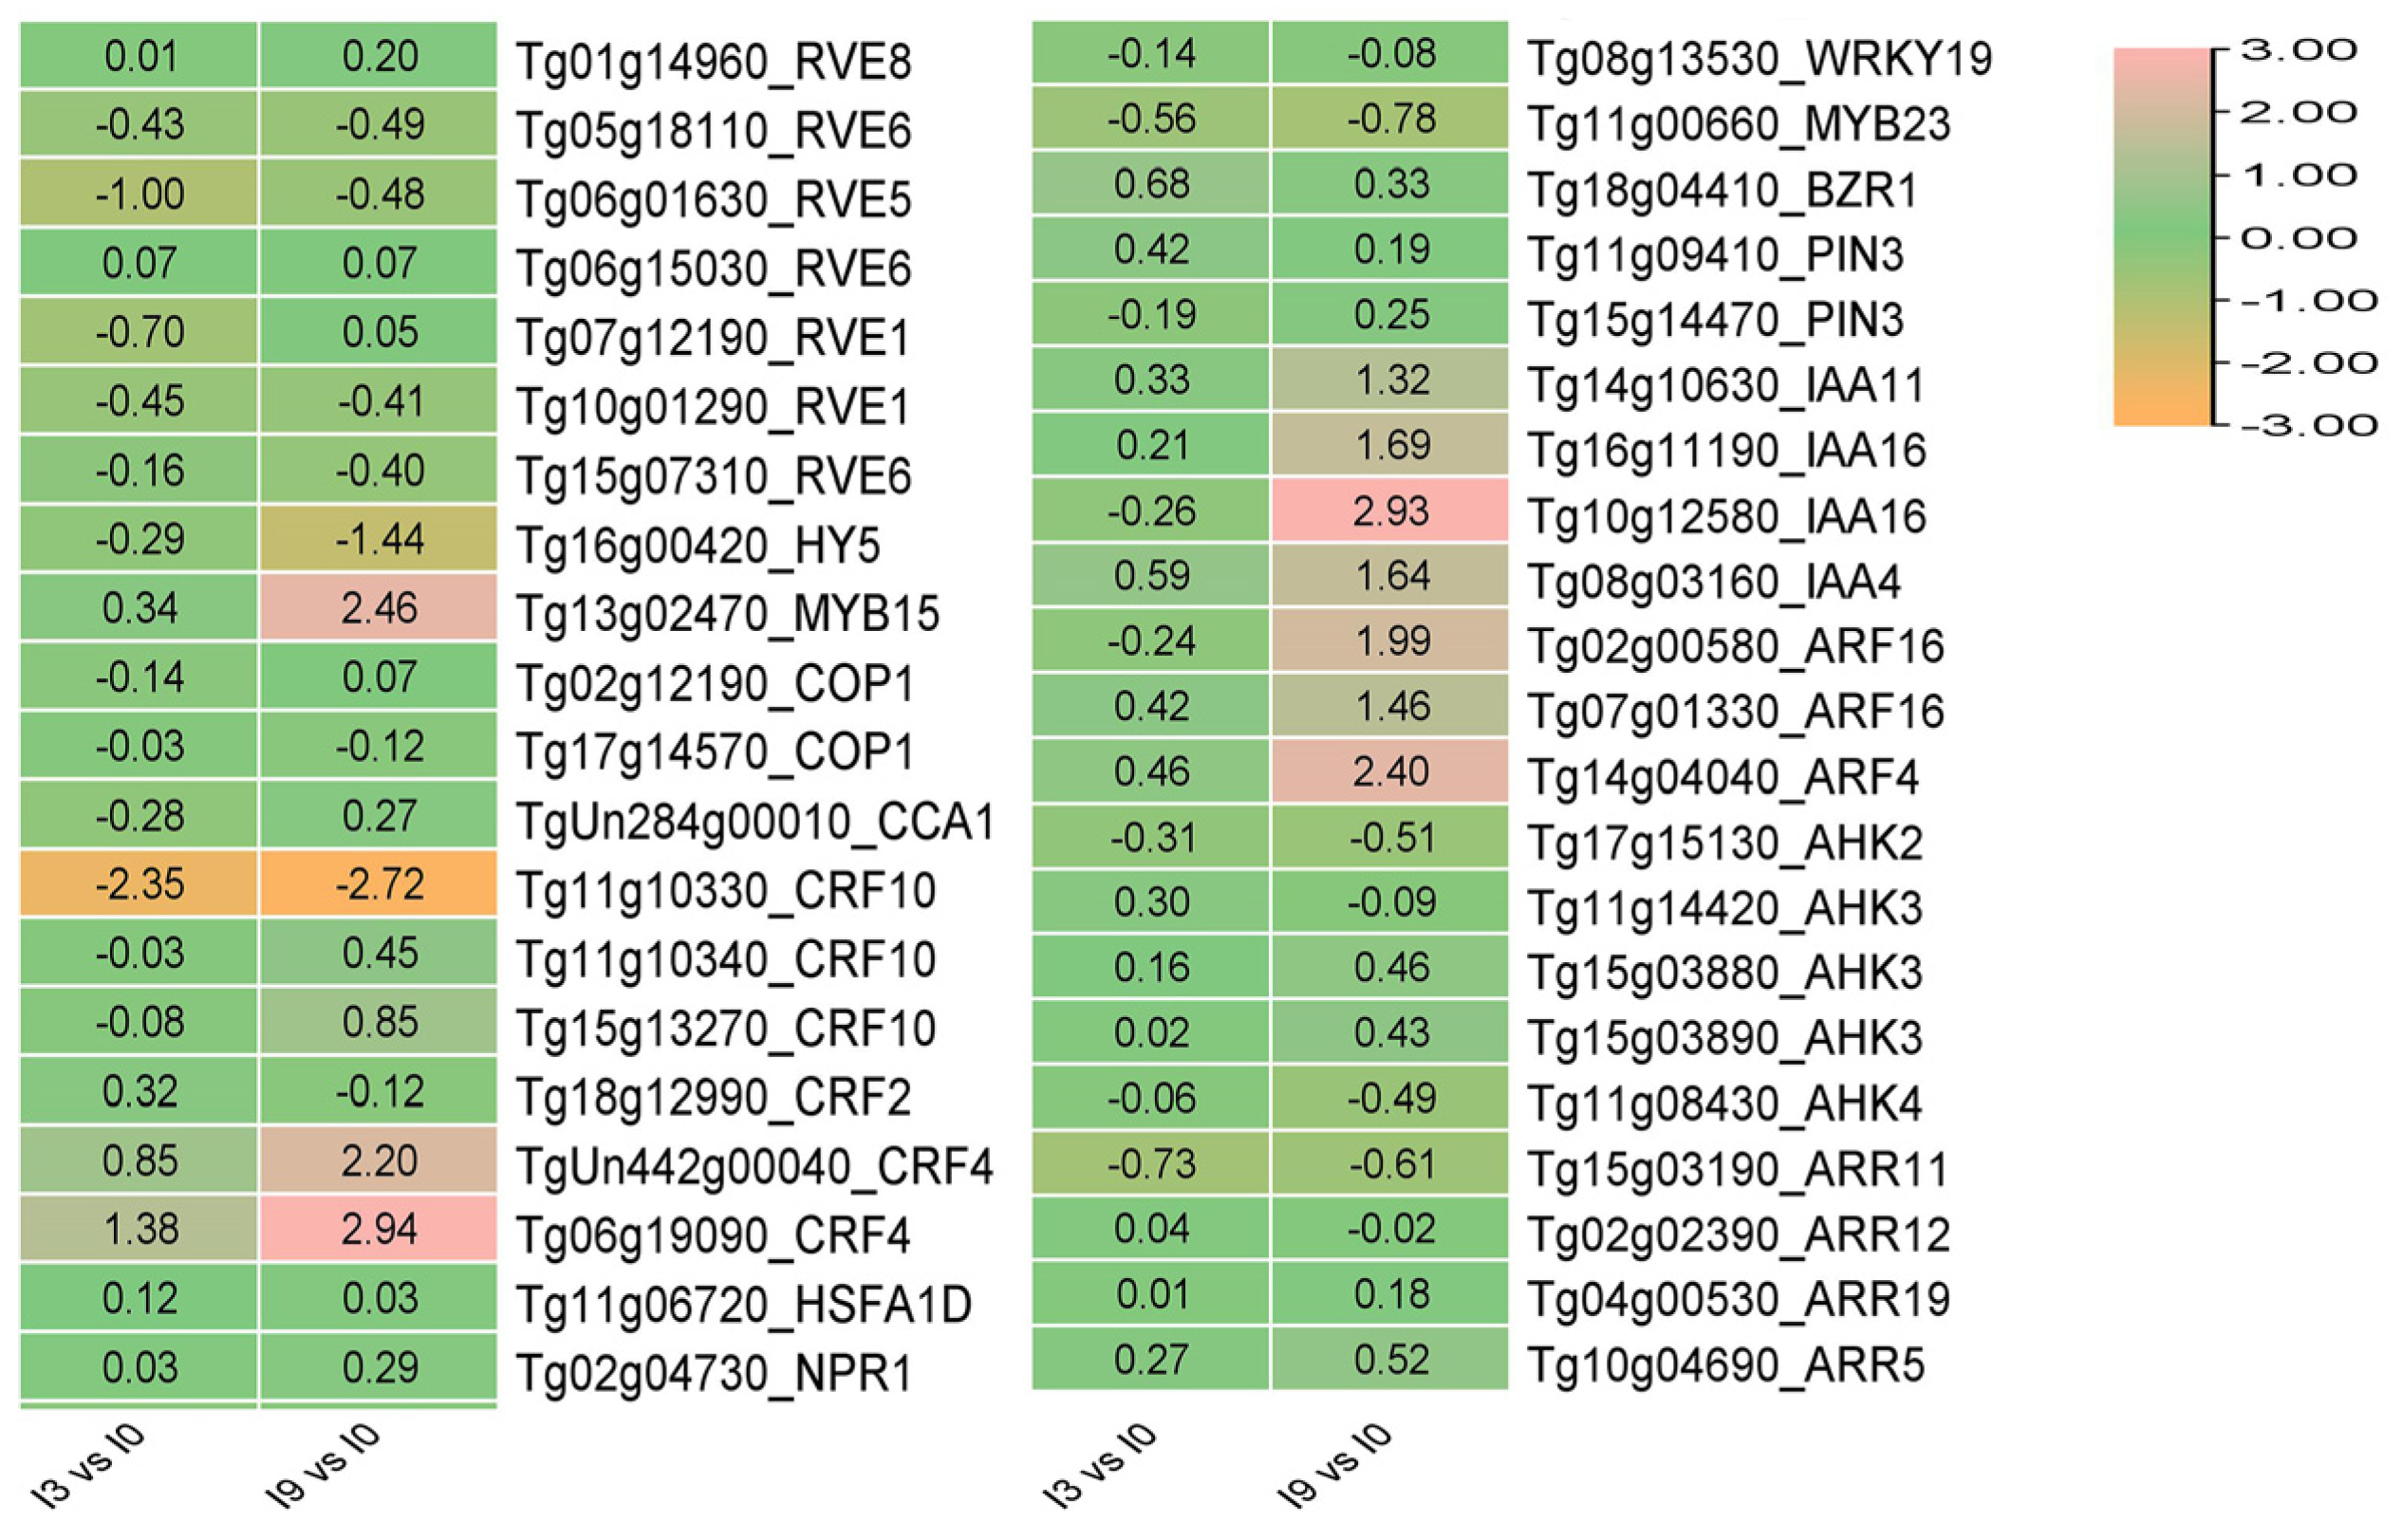
In addition to CBF genes, there were other CBF-independent pathway genes involved in the plant response to cold stress, such as HY5, REV4, REV8, CCA1, and so on. After 3 h of low-temperature stress, the expression of CRF4 (Tg06g19090), an essential gene in the cytokinin pathway of teak, was significantly increased, while the expression of REV5 (Tg06g01630) was significantly decreased by 1.0 times, respectively. After 9 h of low-temperature stress, the expression of HY5 (Tg16g00420) decreased significantly by −1.44 times (Figure 10). The expression of the HY5 and REV5 genes in teak changed significantly, indicating that they may play an essential role in teak’s response to low-temperature stress.

3.9. Calcium Signal Transduction in Teak Cells under Low-Temperature Stress

Cold sensing is initial for plant genes reacting to cold stress. In rice, the perception and transmission of cold stress signals are related to G protein regulators COLD1 (chilling tolerance divergence 1), RGA1 (rice G-protein α subunit 1), and OSCIPK7 (CBL-interacting protein kinase 7) [34,35]. However, the COLD1 homologous gene was not detected in teak, and the expression of RGA1 homologous genes (Tg05g00750) and CIPK7 (Tg04g06110) in teak rarely changed after 3 or 9 h of stress. It is probable that the cold sensor of teak was different from that of rice, or this finding might be related to the sampling period.
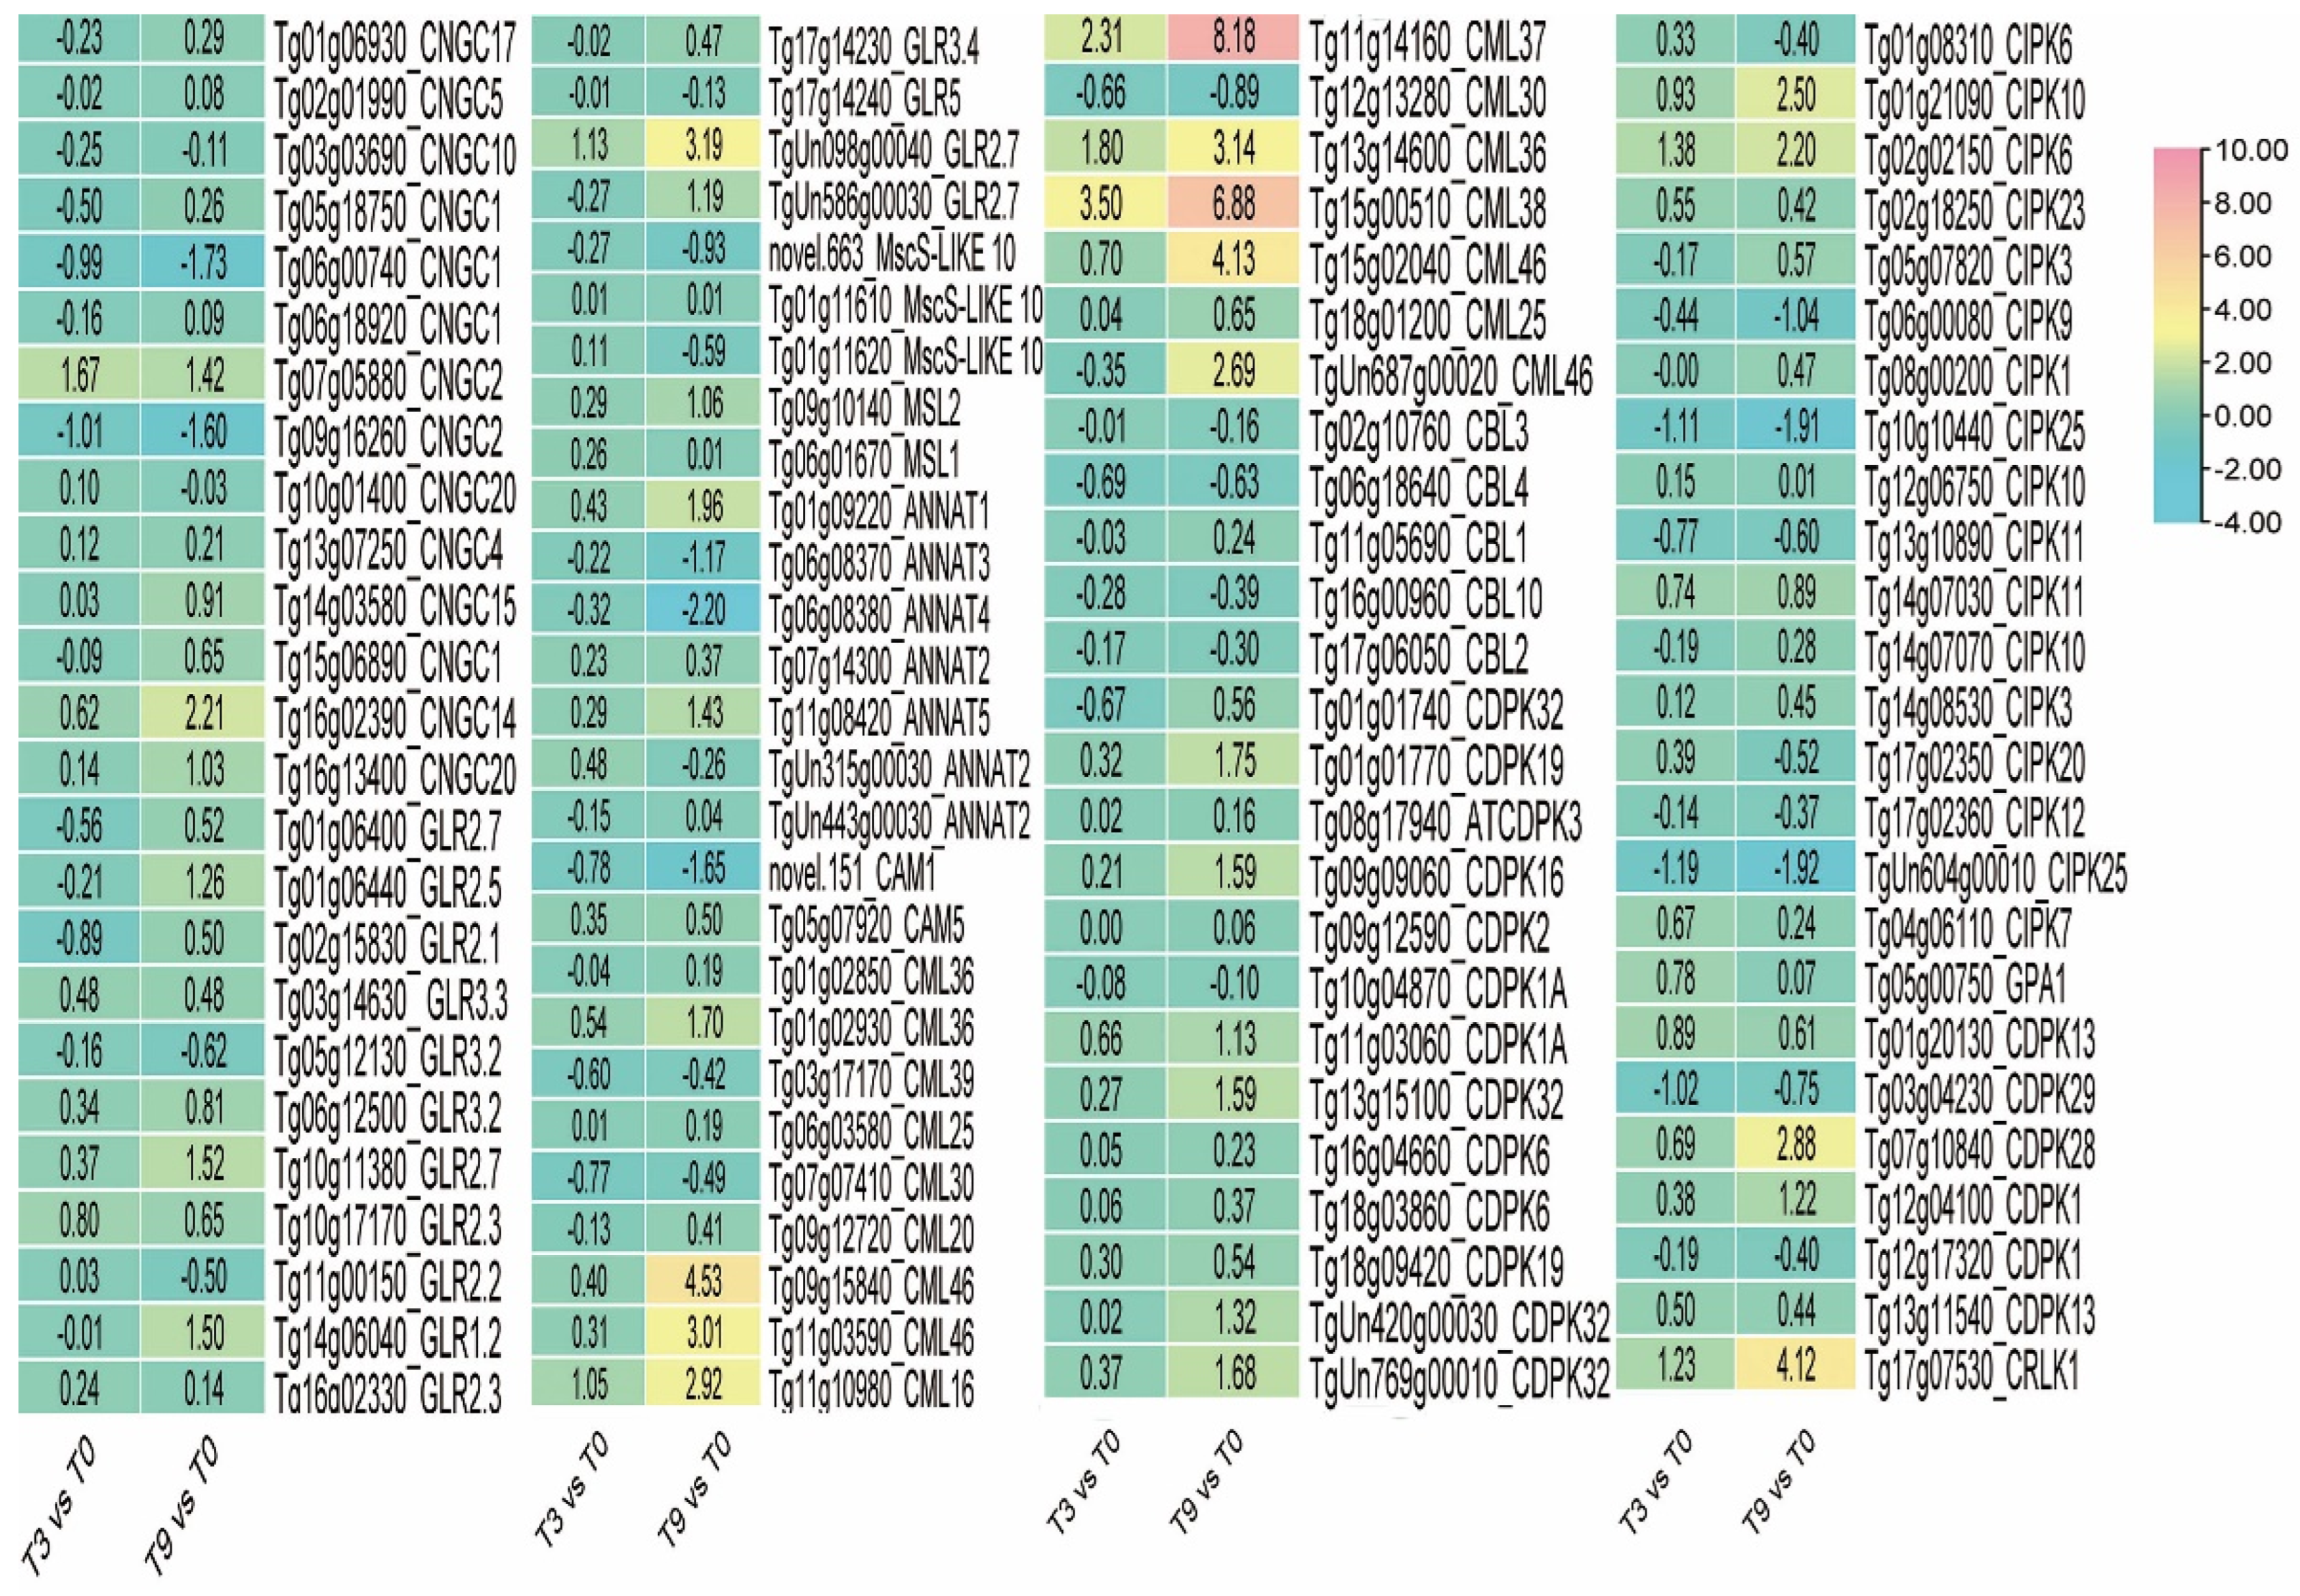
In addition, Ca2+ is a vital messenger in plant cells. After 3 h of cold stress, CNGC2 (Tg07g05880) and GLR2.7 (TgUn098g00040) had the largest up-regulated amplitude, by 1.67 and 1.13 times, respectively, and CNGC2 (Tg09g16260) had the largest down-regulation amplitude, by −1.01 times. After 9 h of cold stress, the up-regulation of the expression of GLR2.7 (TgUn098g00040) was the largest, by 3.19 times, while the down-regulation of CNGC1 (Tg06g00740) was the largest, by −1.73 times. The above results show that most of the protein genes involved in the Ca2+ influx are detectable, and the gene expression was significantly up-regulated or down-regulated, indicating that Ca2+ influx occurred in teak cells under cold stress. Furthermore, it was observed that there were no notable alterations in the CBL gene, thus suggesting that the calcium signaling and interpretation in teak differ from those in other plant species (Figure 11).

3.10. WGCNA and Hub Genes of DEGs Identified Three CBF-Dependent and CBF-Independent Regulatory Networks

WGCNA identified gene clusters that co-expressed under cold stress in teak. In total, 49 7726 DEGs were clustered into 14 modules; each module contained 45 to 1640 genes (Figure 12). Among these modules, the orange module was highly correlated with the CBF2 pathway, the palevioletred module was highly correlated with the CBF4 pathway, and the cornflower blue module was relatively associated with the HY5 pathway.
In the orange module, there were 937 genes, and the sub-network of CBF2 included 576 genes, where 311 genes were annotated and 31 hub genes were screened out to form a co-expression network (Figure 13A). These hub genes include four membrane channel protein genes (ANN, CNGC) and 10 calcium-binding protein genes (CML, CPK, GLR), which mediate calcium influx. Only CBF2 was included in the CBF pathway. In addition, the network also comprises three antioxidant genes (GST) and 13 hormone-related genes (ARF, IAA, CRF, ERF, JAI1). The co-expression network showed that the CBF2 of teak was induced by a low temperature and interacted with many hormones.
In the palevioletred module, there were 1640 genes, including 852 annotated genes and 69 hub genes; their co-expression network is outlined in Figure 13B. These hub genes include six channel protein genes (CNGC, GLR, MCA, MSL) and 13 calcium-binding protein genes (CPK, CML, CBP) that mediate calcium influx, including CBF pathway genes, including the core gene CBF4, its upstream regulator CAMTA1, and its downstream gene COR27. The co-expression network also generated five osmotic adjustment genes (LEA, OSM, G6PD6), 10 antioxidant genes (AOX1a, GAUT, GST), six photosystem I genes, and two photosystem II genes. Five hormones participated in the co-expression network, namely four auxin response genes (ARF, IAA), two cytokinin response genes (CRF), three ethylene response genes (ERF), two jasmonate-related genes (JAZ), and an abscisic acid pathway gene (SNRK). The co-expression network showed that the CBF4 of teak was induced by a low temperature and regulated COR27 and was held by CAMTA1 upstream.
In the cornflower blue module, the sub-network of CBF, which is independent of the pathway gene HY5, included seven genes, of which only four were annotated (Figure 13C). This suggested that the HY5 gene directly interacted with the osmoregulation gene OSM34, and HY5 of teak never interacted with CBF, but it can participate in cold stress response.

3.11. Morphologies of OE-TgCBF2 and OE-TgCBF4 under Low-Temperature Treatment

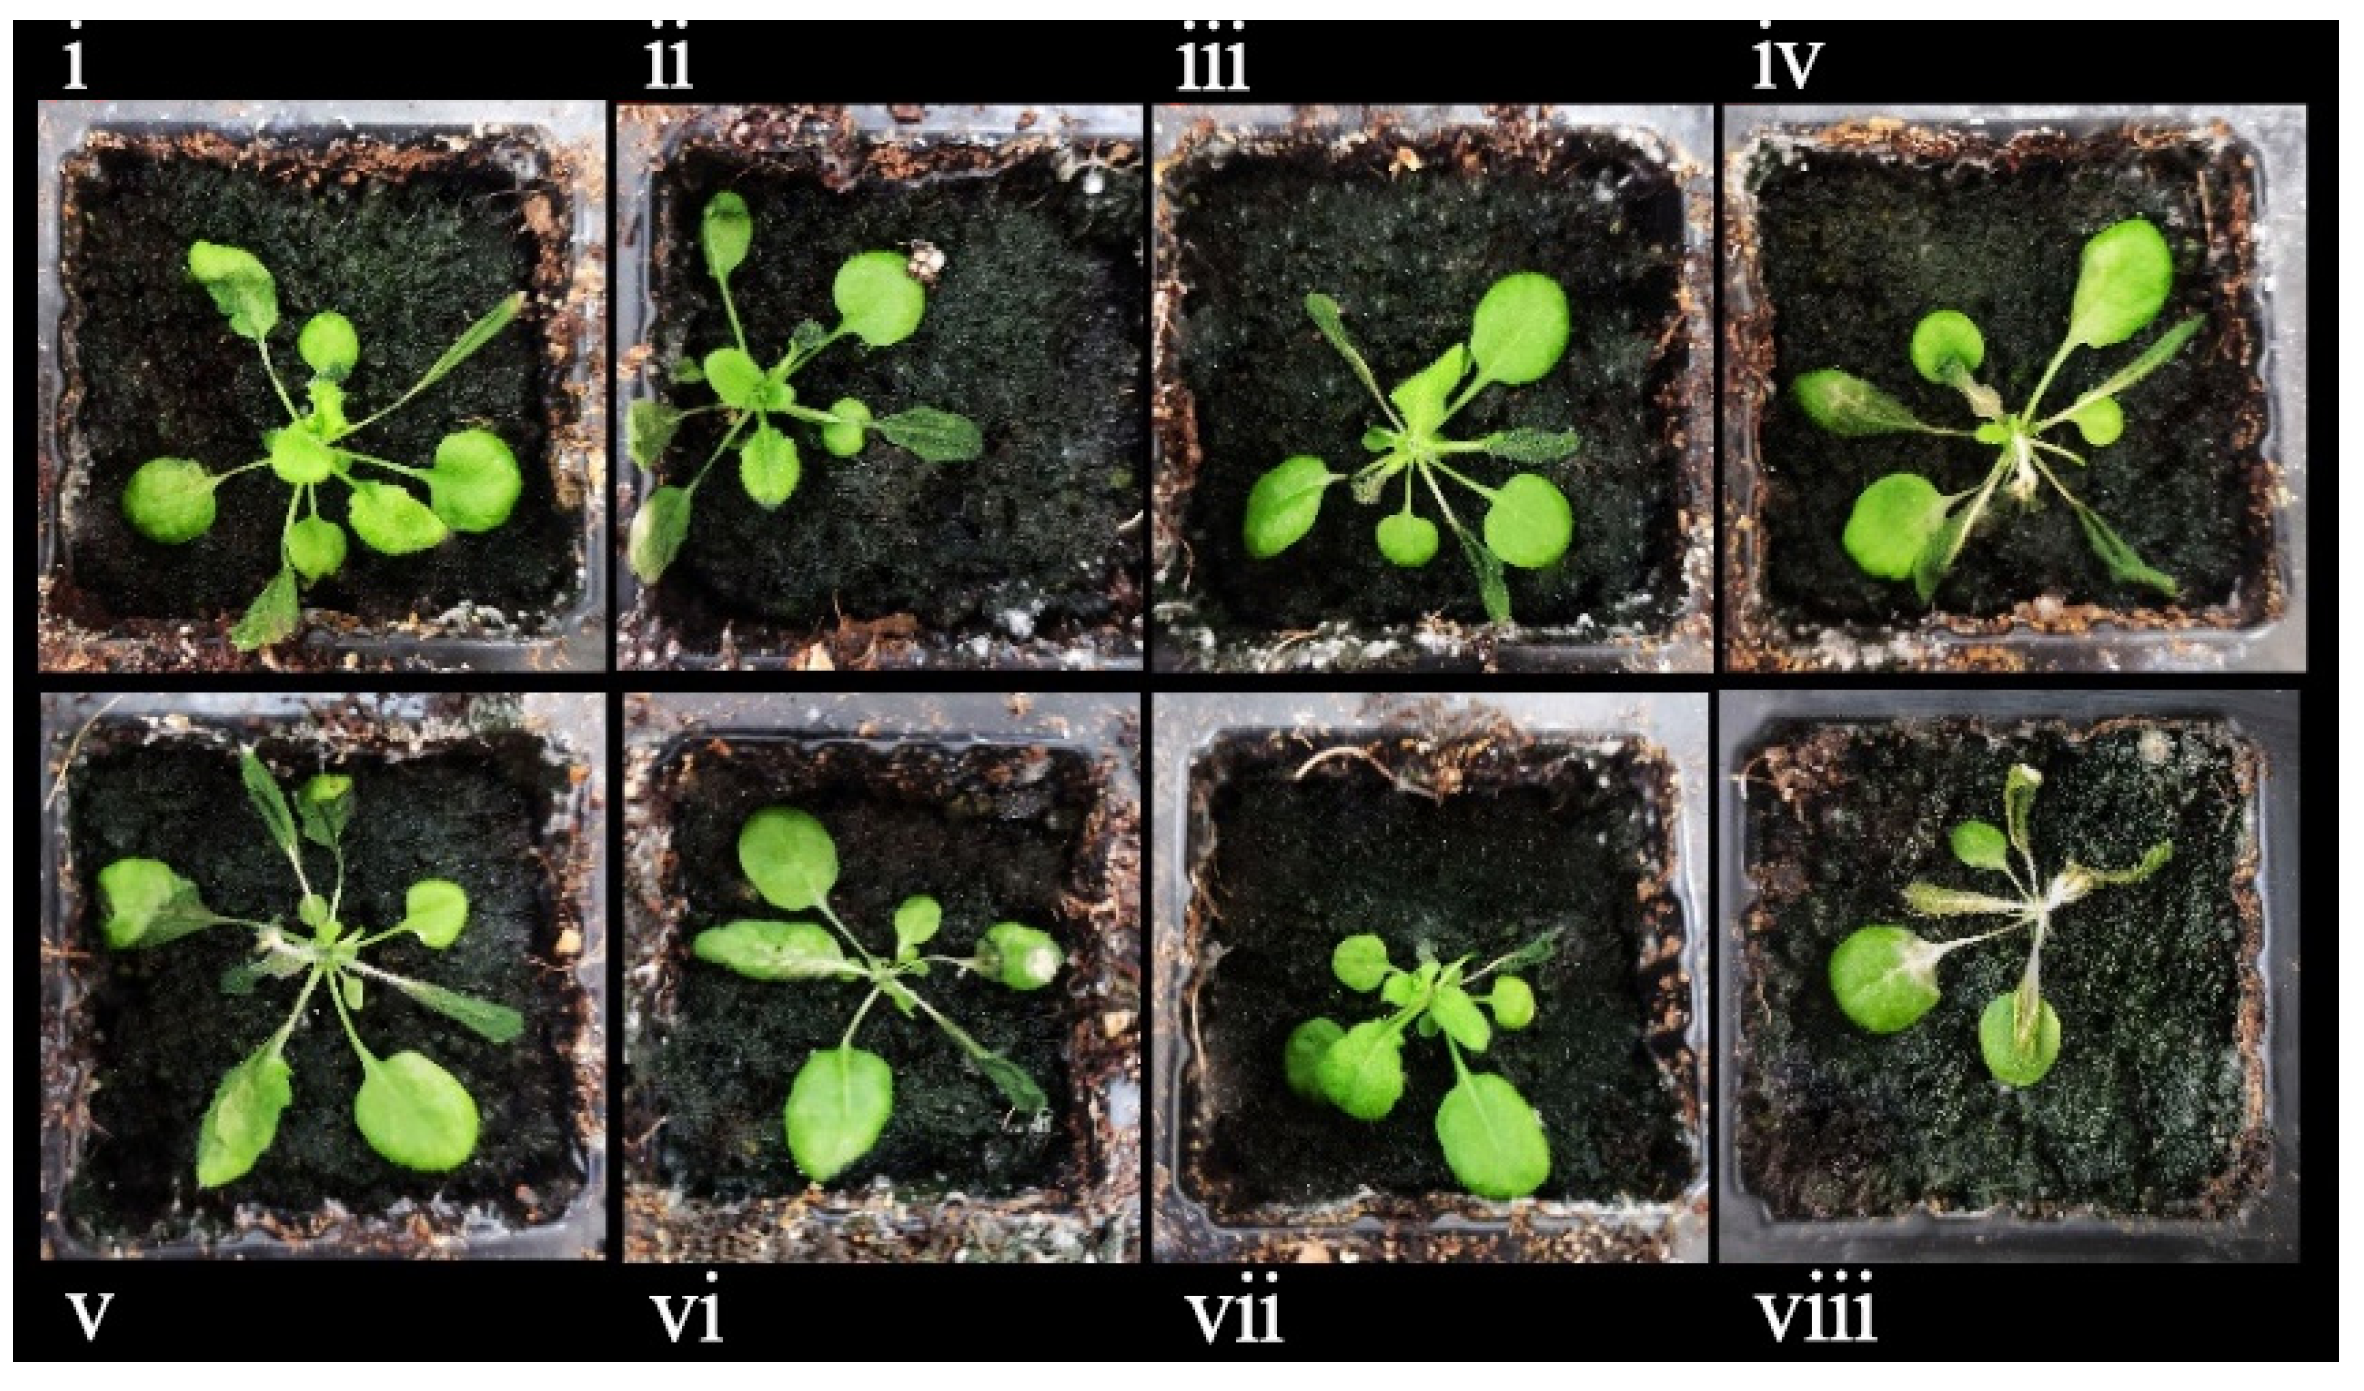
The cold resistance test was carried out in the rosette stage of A.thaliana (Figure 14). The survival rate of OE-TgCBF2 was about 70%, and that of OE-TgCBF4 was about 30% (Figure 14). Eight representatives of Arabidopsis, which performed well in the cold resistance test, were observed by fluorescence, and all the plants were detected with fluorescence signals, indicating the normal expression of the genes (Figure 15 and Figure 16). These results show that the survival rate of transformants was significantly higher than that of wild-type under low-temperature stress. Also, both TgCBF2 and TgCBF4 genes boosted the cold resistance, and OE-TgCBF2 displayed better cold resistance.

4. Discussion

Given the sensitivity of the tropical plant teak to cold stress, it is imperative to thoroughly investigate the molecular mechanisms underlying its response to cold stress to facilitate a genetic improvement through breeding. This study elucidated that the induction of CBF2 and CBF4 in the CBF-dependent teak pathway occurred due to a rapid drop in temperature, thereby contributing to its cold resistance mechanism. Moreover, it was observed that HY5 was also activated in response to a swift drop in temperature. This discovery demonstrates the existence of both CBF-dependent and CBF-independent mechanisms for teak’s resistance to cold stress.

4.1. Teak CBFs and Their Regulation Exhibit Conservation and Differentiation

Previous research has demonstrated the pivotal role played by CBFs in plant resistance to cold stress, with the signal pathway of CBF dependence being particularly well-defined. The expression of CBF1, CBF2, and CBF3 among the four CBFs in Arabidopsis thaliana was induced by the low temperature, but among the three CBFs of tomato, only CBF1 was induced by the low temperature [36]. According to our findings, teak CBF1 and CBF3 do not exhibit low-temperature induction, whereas CBF2 and CBF4 are induced by low temperatures. Functional redundancy and differentiation among CBF members in various plants may represent the distinct strategies different plants employ to mitigate multiple environmental stresses. Regarding CBF regulation, it is worth noting that while the ICE1 gene was identified in teak, its expression level was notably low. ICE1 is constitutive and enhances the expression of CBF3 under low temperatures; whether the absence of the expression of CBF3 is due to the lack of the induction of ICE1 or other reasons requires further discussion. The role of the regulatory factor HOS1 is to degrade ICE1. The expression of HOS1 (Tg19g04790) in teak was slightly up-regulated under cold stress, but its expression was deficient. A previous study suggested that CAMTA3 regulates the expression of CBF2 and also regulates the expression of CBF1 when the temperature decreases rapidly [11]. Our study showed that the expression of CAMTA3 (Tg07g14230) had little change after 3 h of cold stress, and then the expression of CAMTA3 (Tg07g14230) was significantly up-regulated after 9 h of cold stress. Moreover, the expression of CBF2 was continuously up-regulated under cold stress, but the expression of the CBF1 gene was not affected. The CAMTA3 barely participated in the regulation of CBF1 when the temperature decreased rapidly from 20 °C to 4 °C, indicating different cold regulation mechanisms in teak. The results show the presence of diverse regulatory pathways involving ICE-CBF-COR.

4.2. The Signal Transduction of Cold Stress in Teak Also Exhibits Conservation and Diversity

The transduction of the cold stress signal is conservative in plants and differentiated in different plants. For instance, rice’s COLD1, RGA1, and CIPK7 proteins were related to the perception of the cold stress signal [34,35]. However, the COLD1 homologous genes were not discovered in teak. Although RGA1 and CIPK7 genes could be found in teak, the expression of these two genes exhibited no significant difference, whether after 3 h or 9 h of low-temperature stress. It is thought that they perhaps play a role in the early stage of cold stress, and it is impossible to determine whether they participate in the perception of a cold signal according to the data of 3 h of cold stress. Additionally, the cold stress perception of teak could perhaps differ from other plants and may also be related to the sampling period. The gene expression of calcium channel proteins GCNC, GLR, MSL, ANN, and MCA that mediate the Ca2+ influx changed significantly after 3 h of cold stress, and the gene expression of the cytoplasmic calcium-binding proteins CaM, CML, CDPK, and CIPK also changed significantly, which fully shows that Ca2+ influx caused the change in the intracellular Ca2+ concentration. However, it is noteworthy that the expression of CBL does not change significantly under cold stress. After binding with Ca2+, CIPK phosphorylates CBL, and CBL activates the downstream gene cascade response [37]. The change in CBL under cold stress was insignificant, which reflected that the signal transduction pathway of teak under cold stress was different from that of other plants. Under cold stress, there were changes in the expression of multiple members of OST1 and PP2C in the ABA pathway of teak, but downstream ABI3 and ABI5 were not detected. Although ABI8 was highly expressed, the change was not significant. The MYC2 gene in the JA pathway of teak was significantly up-regulated after 3 h and 9 h of cold stress, but COI1 and JAZ did not change much under cold stress. Ethylene seems to depend on species to participate in the cold stress response, which positively regulates the cold tolerance of apples and oranges and negatively regulates the cold tolerance of Medicago truncatula and A. thaliana [38,39]. The expression of several ethylene pathway genes in teak changed significantly, but how they work under the cold stress of teak deserves further discussion.

4.3. The CBF-Independent Pathway Also Influences the Resistance of Teak against Cold Stress

A low temperature positively regulates the expression of HY5 at transcription and post-translation levels [40,41,42], but the expression of HY5 (Tg16g00420) in teak was down-regulated under cold stress, and the gene expression was down-regulated after 3 h of cold stress. Still, it did not reach a significant level. After 9 h of cold stress, the expression was significantly down-regulated by −1.44 times. In addition, the expression of RVE5 was significantly down-regulated under cold stress. The above situation not only reflects the complexity of the response of teak to cold stress. Under cold stress, the expression of HSFA1 was slightly up-regulated, while NPR1 and COP1 were slightly down-regulated, and the changes were insignificant. Perhaps independent CBF pathways such as HY5 and RVE5 played an essential role in the response of teak to cold stress.

5. Conclusions

Teak, a tropical plant, seldom encounters low temperatures throughout its growth and development. Despite the lack of clarity regarding the mechanism of its resistance to cold stress, some genes, namely CBF and HY5, exhibit resistance to cold stress. Furthermore, the process of genetic transformation demonstrates the capacity of teak CBF2 and CBF4 to enhance the survival rate of teak seedlings when subjected to sudden temperature decreases. Consequently, it can be excavated and utilized to improve cold resistance, thereby contributing to the genetic enhancement of teak. The conservative nature of CBF genes also implies that introducing CBF genes from cold-resistant plants could improve the cold resistance of teak. Additional investigations into the regulatory mechanism of teak CBF in response to cold stress will facilitate the development of cold-tolerant teak using gene editing techniques.

Supplementary Materials

The following supporting information can be downloaded at: https://www.mdpi.com/article/10.3390/genes14112098/s1, Figure S1: Validation of DEGs by qPCR.

Author Contributions

Conceptualization, G.H. and G.Y.; methodology, M.L., G.Y. and J.W.; investigation, G.Y. and M.L.; analysis, M.L., G.Y. and J.W.; writing—original draft preparation, M.L. and J.W.; writing—review and editing, J.W., G.H., W.Z., X.W. and Q.H.; supervision and funding, G.H. All authors have read and agreed to the published version of the manuscript.

Funding

This research was funded by the National Extension Project of Forestry and Grassland Scientific and Technological Achievements (2020133113).

Institutional Review Board Statement

Not applicable.

Informed Consent Statement

Not applicable.

Data Availability Statement

Data are contained within the article and Supplementary Materials.

Conflicts of Interest

The authors declare no conflict of interest.

References

  1. Food and Agriculture Organization of the United Nations. Global Teak Trade in the Aftermath of Myanmar’s Log ExportBan. 2015. Available online: http://www.fao.org/3/a-i5023e.pdf (accessed on 15 January 2020).
  2. Zhu, J.-K. Abiotic stress signaling and responses in plants. Cell 2016, 167, 313–324. [Google Scholar] [CrossRef] [PubMed]
  3. Agarwal, P.K.; Gupta, K.; Lopato, S.; Agarwal, P. Dehydration responsive element binding transcription factors and their applications for the engineering of stress tolerance. J. Exp. Bot. 2017, 68, 2135–2148. [Google Scholar] [CrossRef] [PubMed]
  4. Wang, W.; Vinocur, B.; Altman, A. Plant responses to drought, salinity and extreme temperatures: Towards genetic engi-neering for stress tolerance. Planta 2003, 218, 1–14. [Google Scholar] [CrossRef] [PubMed]
  5. Wang, D.-Z.; Jin, Y.-N.; Ding, X.-H.; Wang, W.-J.; Zhai, S.-S.; Bai, L.-P.; Guo, Z.-F. Gene Regulation and Signal Transduction in the ICE-CBF-COR Signaling Pathway during Cold Stress in Plants. Biochemistry 2017, 82, 1103–1117. [Google Scholar] [CrossRef] [PubMed]
  6. Gilmour, S.J.; Zarka, D.G.; Stockinger, E.J.; Salazar, M.P.; Houghton, J.M.; Thomashow, M.F. Low temperature regulation of the Arabidopsis CBF family of AP2 transcriptional activators as an early step in cold-induced COR gene expression. Plant J. 1998, 16, 433–442. [Google Scholar] [CrossRef]
  7. Thomashow, M.F. Molecular basis of plant cold acclimation: Insights gained from studying the CBF cold response pathway. Plant Physiol. 2010, 154, 571–577. [Google Scholar] [CrossRef]
  8. Kurbidaeva, A.; Ezhova, T.; Novokreshchenova, M. Arabidopsis thaliana ICE 2 gene: Phylogeny, structural evolution and functional diversification from ICE1. Plant Sci. 2014, 229, 10–22. [Google Scholar] [CrossRef]
  9. Jia, Y.; Ding, Y.; Shi, Y.; Zhang, X.; Gong, Z.; Yang, S. The cbfs triple mutants reveal the essential functions of CBFs in cold acclimation and allow the definition of CBF regulons in Arabidopsis. New Phytol. 2016, 212, 345–353. [Google Scholar] [CrossRef]
  10. Shi, Y.; Huang, J.; Sun, T.; Wang, X.; Zhu, C.; Ai, Y.; Gu, H. The precise regulation of different COR genes by individual CBF transcription factors in Arabidopsis thaliana. J. Integr. Plant Biol. 2017, 59, 118–133. [Google Scholar] [CrossRef]
  11. Kidokoro, S.; Yoneda, K.; Takasaki, H.; Takahashi, F.; Shinozaki, K.; Yamaguchi-Shinozaki, K. Different Cold-Signaling Pathways Function in the Responses to Rapid and Gradual Decreases in Temperature. Plant Cell 2017, 29, 760–774. [Google Scholar] [CrossRef]
  12. Doherty, C.J.; Van Buskirk, H.A.; Myers, S.J.; Thomashow, M.F. Roles for Arabidopsis CAMTA transcription factors in cold-regulated gene expression and freezing tolerance. Plant Cell 2009, 21, 972–984. [Google Scholar] [CrossRef] [PubMed]
  13. Kim, Y.; Park, S.; Gilmour, S.J.; Thomashow, M.F. Roles of CAMTA transcription factors and salicylic acid in configuring the low-temperature transcriptome and freezing tolerance of Arabidopsis. Plant J. 2013, 75, 364–376. [Google Scholar] [CrossRef] [PubMed]
  14. Dong, M.; Zhang, Y.; Xu, C.; Wang, C.; Liu, M.; Zhang, Z.; Wu, H.; Yuan, Z.; Zhou, J. Interferon-γ decreases ATP-binding cassette subfamily G member 1-mediated cholesterol efflux through small ubiquitin-like modifier/ubiquitin-dependent liver X receptor-α degradation in macrophages. Biotechnol. Appl. Biochem. 2020, 68, 1412–1420. [Google Scholar] [CrossRef]
  15. Miura, K.; Jin, J.B.; Hasegawa, P.M. Sumoylation, a post-translational regulatory process in plants. Curr. Opin. Plant Biol. 2007, 10, 495–502. [Google Scholar] [CrossRef] [PubMed]
  16. Shibasaki, K.; Uemura, M.; Tsurumi, S.; Rahman, A. Auxin response in Arabidopsis under cold stress: Underlying molecular mechanisms. Plant Cell 2009, 21, 3823–3838. [Google Scholar] [CrossRef]
  17. Ashraf, M.A.; Rahman, A. Cellular Protein Trafficking: A New Player in Low-Temperature Response Pathway. Plants 2022, 11, 933. [Google Scholar] [CrossRef]
  18. Xing, H.; Wang, P.; Cui, X.; Zhang, C.; Wang, L.; Liu, X.; Yuan, L.; Li, Y.; Xie, Q.; Xu, X. LNK1 and LNK2 recruitment to the evening element require morning expressed circadian related MYB-like transcription factors. Plant Signal. Behav. 2015, 10, e1010888. [Google Scholar] [CrossRef]
  19. Kidokoro, S.; Shinozaki, K.; Yamaguchi-Shinozaki, K. Transcriptional regulatory network of plant cold-stress responses. Trends Plant Sci. 2022, 27, 922–935. [Google Scholar] [CrossRef]
  20. Duan, M.; Ma, N.-N.; Li, D.; Deng, Y.-S.; Kong, F.-Y.; Lv, W.; Meng, Q.-W. Antisense-mediated suppression of tomato thylakoidal ascorbate peroxidase influences anti-oxidant network during chilling stress. Plant Physiol. Biochem. 2012, 58, 37–45. [Google Scholar] [CrossRef]
  21. Giannopolitis, C.N.; Ries, S.K. Superoxide Dismutases: II. Purification and Quantitative Relationship with Water-soluble Protein in Seedlings. Plant Physiol. 1977, 59, 315–318. [Google Scholar] [CrossRef]
  22. Kim, D.; Paggi, J.M.; Park, C.; Bennett, C.; Salzberg, S.L. Graph-based genome alignment and genotyping with HISAT2 and HISAT-genotype. Nat. Biotechnol. 2019, 37, 907–915. [Google Scholar] [CrossRef] [PubMed]
  23. Pertea, M.; Kim, D.; Pertea, G.M.; Leek, J.T.; Salzberg, S.L. Transcript-level expression analysis of RNA-seq experiments with HISAT, StringTie and Ballgown. Nat. Protoc. 2016, 11, 1650–1667. [Google Scholar] [CrossRef] [PubMed]
  24. Liao, Y.; Smyth, G.K.; Shi, W. feature Counts: An efficient general purpose program for assigning sequence reads to genomic features. Bioinformatics 2014, 30, 923–930. [Google Scholar] [CrossRef] [PubMed]
  25. Love, M.I.; Huber, W.; Anders, S. Moderated estimation of fold change and dispersion for RNA-seq data with DESeq2. Genome Biol. 2014, 15, 550. [Google Scholar] [CrossRef]
  26. Yu, G.; Wang, L.-G.; Han, Y.; He, Q.-Y. clusterProfiler: An R package for comparing biological themes among gene clusters. OMICS J. Integr. Biol. 2012, 16, 284–287. [Google Scholar] [CrossRef]
  27. Langfelder, P.; Horvath, S. WGCNA: An R package for weighted correlation network analysis. BMC Bioinform. 2008, 9, 559. [Google Scholar] [CrossRef]
  28. Shannon, P.; Markiel, A.; Ozier, O.; Baliga, N.S.; Wang, J.T.; Ramage, D.; Amin, N.; Schwikowski, B.; Ideker, T. Cytoscape: A software environment for integrated models of biomolecular interaction networks. Genome Res. 2003, 13, 2498–2504. [Google Scholar] [CrossRef]
  29. Rychlik, W. OLIGO 7 primer analysis software. Methods Mol. Biol. 2007, 402, 35–60. [Google Scholar] [CrossRef] [PubMed]
  30. Yin, Y.-X.; Wang, S.-B.; Xiao, H.-J.; Zhang, H.-X.; Zhang, Z.; Jing, H.; Zhang, Y.-L.; Chen, R.-G.; Gong, Z.-H. Overexpression of the CaTIP1-1 pepper gene in tobacco enhances resistance to osmotic stresses. Int. J. Mol. Sci. 2014, 15, 20101–20116. [Google Scholar] [CrossRef]
  31. Fu, J.; Huang, S.; Qian, J.; Qing, H.; Wan, Z.; Cheng, H.; Zhang, C. Genome-wide identification of Petunia HSF Genes and potential function of PhHSF19 in benzenoid/phenylpropanoid biosynthesis. Int. J. Mol. Sci. 2022, 23, 2974. [Google Scholar] [CrossRef]
  32. Zhao, D.; Hamilton, J.P.; Bhat, W.W.; Johnson, S.R.; Godden, G.T.; Kinser, T.J.; Boachon, B.; Dudareva, N.; Soltis, D.E.; Soltis, P.S. Data from: A chromosomal-scale genome assembly of Tectona grandis reveals the importance of tandem gene duplication and enables discovery of genes in natural product biosynthetic pathways. Gigascience 2019, 8, 1–10. [Google Scholar] [CrossRef] [PubMed]
  33. Ghosh, S.; Chan, C.-K.K. Analysis of RNA-Seq Data Using TopHat and Cufflinks. Methods Mol. Bioinform. 2016, 1374, 339–361. [Google Scholar] [CrossRef]
  34. Ma, Y.; Dai, X.; Xu, Y.; Luo, W.; Zheng, X.; Zeng, D.; Pan, Y.; Lin, X.; Liu, H.; Zhang, D.; et al. COLD1 confers chilling tolerance in rice. Cell 2015, 160, 1209–1221. [Google Scholar] [CrossRef] [PubMed]
  35. Zhang, D.; Guo, X.; Xu, Y.; Li, H.; Ma, L.; Yao, X.; Weng, Y.; Guo, Y.; Liu, C.; Chong, K. OsCIPK7 point-mutation leads to conformation and kinase-activity change for sensing cold response. J. Integr. Plant Biol. 2019, 61, 1194–1200. [Google Scholar] [CrossRef]
  36. Zhang, X.; Fowler, S.G.; Cheng, H.; Lou, Y.; Rhee, S.Y.; Stockinger, E.J.; Thomashow, M.F. Freezing-sensitive tomato has a functional CBF cold response pathway, but a CBF regulon that differs from that of freezing-tolerant Arabidopsis. Plant J. 2004, 39, 905–919. [Google Scholar] [CrossRef]
  37. Li, Y.; Liu, Y.; Jin, L.; Peng, R. Crosstalk between Ca2+ and Other Regulators Assists Plants in Responding to Abiotic Stress. Plants 2022, 11, 1351. [Google Scholar] [CrossRef]
  38. Zhao, M.; Liu, W.; Xia, X.; Wang, T.; Zhang, W.-H. Cold acclimation-induced freezing tolerance of Medicago truncatula seedlings is negatively regulated by ethylene. Physiol. Plant. 2014, 152, 115–129. [Google Scholar] [CrossRef]
  39. Shi, Y.T.; Tian, S.W.; Hou, L.Y.; Huang, X.Z.; Zhang, X.Y.; Guo, H.W.; Yang, S.H. Ethylene signaling negatively regulates freezing tolerance by repressing expression of CBF and Type-A ARR genes in Arabidopsis. Plant Cell 2012, 24, 2578–2595. [Google Scholar] [CrossRef]
  40. Catalá, R.; Medina, J.; Salinas, J. Integration of low temperature and light signaling during cold acclimation response in Arabidopsis. Proc. Natl. Acad. Sci. USA 2011, 108, 16475–16480. [Google Scholar] [CrossRef]
  41. Toledo-Ortiz, G.; Johansson, H.; Lee, K.P.; Bou-Torrent, J.; Stewart, K.; Steel, G.; Rodríguez-Concepción, M.; Halliday, K.J. The HY5-PIF regulatory module coordinates light and temperature control of photosynthetic gene transcription. PLoS Genet. 2014, 10, e1004416. [Google Scholar] [CrossRef]
  42. Zhang, L.; Jiang, X.; Liu, Q.; Ahammed, G.J.; Lin, R.; Wang, L.; Shao, S.; Yu, J.; Zhou, Y. The HY5 and MYB15 transcription factors positively regulate cold tolerance in tomato via the CBF pathway. Plant Cell Environ. 2020, 43, 2712–2726. [Google Scholar] [CrossRef] [PubMed]
Figure 1. Leaf morphology of teak under cold stress. (A): Stress for 0 h; (B): Stress for 3 h; (C): Stress for 9 h; Arrow: the injured symptoms.
Genes 14 02098 g001
Figure 2. Physiological changes of teak under cold stress. (A): SOD content under cold stress; (B): Proline content under cold stress. All data are means ± SDs (n = 3). **: p < 0.01; *: p < 0.05.
Genes 14 02098 g002
Figure 3. DEGs were identified from 9 samples and venn diagram of DEGs among the three groups. (A) DEGs were identified from 9 samples; (B,C) venn diagram of DEGs among the three groups.T0: Cold stress for 0 h; T3: Cold stress for 3 h; T9: Cold stress for 9 h.
Genes 14 02098 g003
Figure 4. GO analysis of DEGs in teak. (A): 3 h up, (B): 3 h down; (C): 3 h up, (D): 3 h down.
Genes 14 02098 g004
Figure 5. KEGG analysis of DEGs in teak. (A): 3 h down, (B): 3 h up, (C): 9 h down, (D): 9 h up.
Genes 14 02098 g005
Figure 6. The expression of osmotic regulation genes in teak leaves under cold stress.
Genes 14 02098 g006
Figure 7. The expression of antioxidant enzyme genes in teak leaves under cold stress.
Genes 14 02098 g007
Figure 8. The expression of photosynthetic genes in teak leaves under low-temperature stress.
Genes 14 02098 g008
Figure 9. The expression of CBF-dependent genes involving cold stress response in teak.
Genes 14 02098 g009
Figure 10. The expression of CBF-independent genes involving cold stress response in teak.
Genes 14 02098 g010
Figure 11. The expression of Ca2+ signal transduction pathway genes in teak.
Genes 14 02098 g011
Figure 12. The module identification from WGCNA Networks.
Genes 14 02098 g012
Figure 13. Co-expression networks of Teak hub genes under cold stress. (A): Co-expression network of Teak hub genes in the orange module; (B): Co-expression network of Teak hub genes in the palevioletred module; (C): Co-expression network of Teak hub genes in the cornflowerblue module.
Genes 14 02098 g013
Figure 14. The morphology of transformants (top) and wild type (bottom) before low-temperature treatment. (i):OE-TgCBF2; (ii): OE-TgCBF4; (iii): Control.
Genes 14 02098 g014
Figure 15. The morphology of transformants and wild type after 3 days of recovery from low-temperature stress. (iiv): OE-TgCBF2; (vviii): OE-TgCBF4.
Genes 14 02098 g015
Figure 16. The fluorescence verification of transgenic Arabidopsis. (iviii): OE-TgCBF2 transformants fluorescence verification. (ixxvi): OE-TgCBF4 transformants fluorescence verification. (i,iii,v,vii,ix,xi,xiii,xv): Fluorescence image; (ii,iv,vi,viii,x,xii,xiv,xvi): Bright-field image.
Genes 14 02098 g016
Table 1. Genes and primers used in qRT-PCR.
Gene IDForword PrimersReverse PrimersTAIR Description
Tg01g18270AATCTGACGATTCGCAACCCCGAGCAGTACAATCCTCTCCCNDR1/HIN1-like 2
Tg07g05280AGAGCTGCCACGTCATCCTTGCCACCACGCTGAAACTCGTCRCAR9, regulatory components of ABA receptor 9
Tg09g03150AGACTTCTAGATAAAGCTCGTTTTCTCTATCCGCCACCGTASAUR30, small auxin upregulated rna 30
Tg09g12620TCACTTTCCACAGAAGGCATCGAACACGACATCGCTCCACAATP1, AAA-ATPase 1
Tg16g05170TGCTGGTCTACCTATTGACAGTCCAAATCGGAGAACTTCACCACBRH1, brassinosteroid-responsive RING-H2
TgUn002g01760TTTGACTGATCCTGCCCCTGTGTTCCTCACCAACGATCCGAATPB, ATP synthase subunit beta
TgUn195g00060TGGTATATCTCTTCCGGTGTTCATCGCCATCAAAATCTCCCBP60a, Calmodulin-binding protein 60a
Tg06g13830CGTCATCGGATCCTAAGGACACCTCCTCATCCATAAAGCACACCBF4
Tg16g06080GAGCTACGTGAGCCAACCCAAGCAACCGCCATACAGAGTCCDDF1, Dwarf and delayed flowering 1
TgUn466g00010AGGTCAGCAACAATTACACGGATTTCTCGGCAATTCCAGGTTWRKY6
Tg03g16060TCCAGGCTCAATATCCACCACGCCACCCATTTTCCCCAGTWIND1, wound induced dedifferentiation 1
Tg09g10240TCCGCCAGACTCTTTACTCCACCGAACCATTGCGACATCAGCAGDIC2, dicarboxylate carrier 2
Tg03g10220GCCTTTGGAGCTTCAGCAACCCCGAGAGAGCAAAACACGATSUT1, SUCROSE TRANSPORTER 1
Tg13g10760TTCTGCCAAGACAAACACCAGATTCCGCCATCTATTTCACCACFER, FERONIA
Tg05g13790GTTGAACATGCTGCTACTCACTAGCTTTGCCCAAAATTCCACbZIP 23
Tg06g00470TGTTCCCAAGATTTTCGGACATGTAGCGCCATGAAAACCAJAM2, Jasmonate Associated MYC2 LIKE 2
Tg01g19010TGAATTTAGCCTGCAGCCAATCAAATCCCCGTACATCCACLHW, LONESOME HIGHWAY
Tg18g02580TTGAGACCTTCAACGTGCCATAATCAGTGAGATCCCGACCAActin
Table 2. Assembly statistics for the teak transcriptome.
SampleRaw_ReadsClean_Reads Clean_Bases Q30 (%)Total_MapSplice Reads(%)GC (%)
T0_142,258,92040,712,0726.11 G93.436,128,928 (88.74%)12,002,426 (29.48%)44.82
T0_245,101,94044,351,0946.65 G93.3239,455,647 (88.96%)13,123,149 (29.59%)44.53
T0_352,698,33050,794,1627.62 G93.1645,374,885 (89.33%)15,642,780 (30.8%)44.90
T3_161,704,65659,371,0248.91 G93.3752,288,275 (88.07%)17,879,136 (30.11%)44.29
T3_259,390,99057,148,6948.57 G93.2250,258,279 (87.94%)15,592,721 (27.28%)43.93
T3_347,792,66245,960,5926.89 G93.0440,063,421 (87.17%)13,199,390 (28.72%)43.72
T9_153,340,15051,332,8807.70 G93.2444,434,695 (86.56%)13,681,417 (26.65%)43.77
T9_255,819,21253,679,4508.05 G93.1946,979,435 (87.52%)14,590,252 (27.18%)44.13
T9_343,179,07241,514,0786.23 G93.4134,961,459 (84.22%)10,024,613 (24.15%)44.35
Disclaimer/Publisher’s Note: The statements, opinions and data contained in all publications are solely those of the individual author(s) and contributor(s) and not of MDPI and/or the editor(s). MDPI and/or the editor(s) disclaim responsibility for any injury to people or property resulting from any ideas, methods, instructions or products referred to in the content.