Article

Comparative Transcriptome Analysis of Galeruca daurica Reveals Cold Tolerance Mechanisms

1
College of Horticulture and Plant Protection, Inner Mongolia Agricultural University, Hohhot 010019, China
2
Research Center for Grassland Entomology, Inner Mongolian Agricultural University, Hohhot 010019, China
3
Key Laboratory of Grassland Resources, Ministry of Education, Hohhot 010010, China
4
College of Grassland, Resources and Environment, Inner Mongolia Agricultural University, Hohhot 010020, China
5
Inner Mongolia Academy of Agricultural & Animal Husbandry Sciences, Hohhot 010031, China
*
Author to whom correspondence should be addressed.
These authors contributed equally to this work.
Genes 2023, 14(12), 2177; https://doi.org/10.3390/genes14122177
Submission received: 23 October 2023 / Revised: 17 November 2023 / Accepted: 21 November 2023 / Published: 4 December 2023
(This article belongs to the Special Issue Molecular Mechanism of Insect Response to Abiotic and Biotic Stress)

Abstract

:
Galeruca daurica (Joannis) is a pest species with serious outbreaks in the Inner Mongolian grasslands in recent years, and its larvae and eggs are extremely cold-tolerant. To gain a deeper understanding of the molecular mechanism of its cold-tolerant stress response, we performed de novo transcriptome assembly of G. daurica via RNA-Seq and compared the differentially expressed genes (DEGs) of first- and second-instar larvae grown and developed indoors and outdoors, respectively. The results show that cold tolerance in G. daurica is associated with changes in gene expression mainly involved in the glycolysis/gluconeogenesis pathway, the fatty acid biosynthesis pathway and the production of heat shock proteins (HSPs). Compared with the control group (indoor), the genes associated with gluconeogenesis, fatty acid biosynthesis and HSP production were up-regulated in the larvae grown and developed outdoors. While the changes in these genes were related to the physiological metabolism and growth of insects, it was hypothesized that the proteins encoded by these genes play an important role in cold tolerance in insects. In addition, we also investigated the expression of genes related to the metabolic pathway of HSPs, and the results show that the HSP-related genes were significantly up-regulated in the larvae of G. daurica grown and developed outdoors compared with the indoor control group. Finally, we chose to induce significant expression differences in the Hsp70 gene (Hsp70A1, Hsp70-2 and Hsp70-3) via RNAi to further illustrate the role of heat stress proteins in cold tolerance on G. daurica larvae. The results show that separate and mixed injections of dsHSP70A1, dsHsp70-2 and dsHsp70-3 significantly reduced expression levels of the target genes in G. daurica larvae. The super-cooling point (SCP) and the body fluid freezing point (FP) of the test larvae were determined after RNAi using the thermocouple method, and it was found that silencing the Hsp70 genes significantly increased the SCP and FP of G. daurica larvae, which validated the role of heat shock proteins in the cold resistance of G. daurica larvae. Our findings provide an important theoretical basis for further excavating the key genes and proteins in response to extremely cold environments and analyzing the molecular mechanism of cold adaptation in insects in harsh environments.

1. Introduction

Organisms living in cold regions are threatened by low temperatures in winter every year. For insects, chilling injuries result from complex physiological alterations such as loss of ions and water homeostasis, which participate in the disruption of neuromuscular functions, leading to chill coma [1]. Temperature is a key factor affecting the distribution and performance of insects [2], and low temperatures in winter are a threat to the occurrence and persistence of insect populations. Insects’ temperature adaptability is a key factor in determining their survival as well as their development, reproduction and spread and consequent crop loss in the following season [3]. Insects exposed to temperature stress may display alterations in physiology, morphology, behavior and life history [4]. Therefore, the survival strategies and adaptive mechanisms of insects in the harshest climates have been the focus of entomologists’ research [5].
Transcriptomics techniques (RNA-Seq) have been widely used to characterize gene expression changes in insects in response to a variety of environmental stresses, which is helpful not only to identify candidate genes for stress response but also to predict putative functions through the association of co-expressed or differentially expressed genes [6]. The rapid development of RNA-Seq technology has provided technical support for studying relevant gene expression in various species under adverse conditions [7]. Dunning et al. (2013) [8] used RNA-Seq to identify cold-responsive genes in the New Zealand alpine stick Micrarchus hystriculeus and then further compared the transcriptional profile expression levels of highland and lowland species populations to low temperatures, suggesting that cuticle modification may be associated with the colonization and development of cold-tolerant phenotypes in highland populations in low-temperature environments [9]. Liu et al. (2022) analyzed the transcriptome of Calliptamus italicus and found that hypothermia can induce the up-regulated expression of a large number of genes in eggs to alleviate hypothermia damage. Tusong et al. (2017) [10] analyzed the transcriptome of naturally adapted Microdera punctipennis, showing that most genes were up-regulated in eggs and indicating that the signaling and metabolic pathways associated with these genes play an important role in the overwintering process. Govaere et al. (2019) [11] reported that Leptinotarsa decemlineata can overcome unfavorable winter conditions by increasing keratin and HSP70 expression and adjusting transcription-related processes. Currently, RNA-Seq technology is widely used to study gene expression changes in response to low-temperature stress in multiple insect species, such as Solenopsis japonica [12], Tamarixia radiata [13], Anoplophora glabripennis [14], Calliptamus italicus, Gomphocerus sibiricus [15], Liriomyza trifolii, Liriomyza sativae [16], Callosobruchus chinensis [17], Plutella xylostella [18] and Nysius groenlandicus [19]. These studies have shown that temperature alterations can lead to changes in the expression levels of a range of genes involved in transcription, metabolism, development and especially heat shock proteins.
The larvae of Galeruca daurica (Joannis), living in Mongolia, Russia (Siberia), Korea, Inner Mongolia, Xinjiang and Gansu Province in China [20,21], mainly feed on onion plants such as Allium mongolicum, A. polyrhizum and A. ramosum [22,23]. Since 2009, the extensive outbreaks of this pest have caused significant economic losses to rangelands and grasslands in Inner Mongolia [24]. G. daurica occurs in one generation each year and overwinters as eggs, and the larvae emerge as early as April, when the temperature fluctuates acutely and even the lowest temperature decreases below −10 °C in its natural habitats [25]. The overwintering eggs are strongly tolerant to extremely low temperatures, with a lower median lethal temperature (LT50) of −33.08 °C [26], and the larvae in spring are also highly tolerant to low temperatures, with an LT50 of −10.1 °C [27]. Rapid cold induction can significantly enhance the super-cooling capacity of G. daurica larvae [28]. Tan et al. (2017b, 2018) [29,30] reported that GdHSP10, GdHSP60 and GdHsp70 were associated with the growth and development of this insect and could be induced by both heat and cold stress; thus, these genes have important roles in the response of G. daurica to high- and low-temperature stress. Zhang et al. (2022) [31] showed that silencing GdHSP60 and GdHsp70 significantly reduced the cold tolerance of G. daurica larvae and also found that the expression levels of GdHSP70-2 and GdHSP70-3 varied at different developmental stages and in different tissues of G. daurica, therefore suggesting that different HSP70 genes play different roles at different developmental stages (Zhang et al., 2023) [32]. Based on the previous reports, it was hypothesized that the proteins encoded by these genes play an important role in the cold tolerance of insects. However, so far, few systemic studies have been conducted on the underlying molecular mechanisms of cold tolerance in G. daurica.
To further explore the research related to cold tolerance and development, high-throughput RNA-seq technology was employed to conduct transcriptomic sequencing on larvae developed in different growth environments, and the obtained unigenes were analyzed with GO functional annotation, KOG annotation and the KEGG metabolic pathway. Specifically, we discovered that the differentially expressed genes were mainly enriched in the glycolysis/gluconeogenesis pathway, fatty acid biosynthesis pathway and the production of heat shock proteins (HSPs), which we proposed to be the possible main mechanism of G. daurica in responding to low temperatures. Finally, we applied RNA interference technology and determined the super-cooling point and body fluid freezing point of the G. daurica larval population after knocking down several key HSP genes. Exploring genes related to cold tolerance at the transcriptional levels also provides an important theoretical basis for further research on the biological function of related genes and the molecular mechanisms of low-temperature adaptation.

2. Materials and Methods

2.1. Collecting of G. daurica Larvae and Indoor and Outdoor Rearing

The G. daurica eggs, collected from the grassland of XiIingol Xianghuang Banner, Inner Mongolia (44°62′ N, 115°80′ E), were divided into an experimental group (outdoor incubation) and a control group (indoor incubation); they were fed from October 2020 to March 2021 until they developed into the first- and second-instar, respectively. The outdoor incubation was carried out on the farm of Inner Mongolia Agricultural University (40° 48′ N, 111°43′ E) with iron pot containers covered with soil and egg masses encased under the topsoil layer. The indoor incubation was carried out in a biomedical refrigerator at the Grassland Insect Research Laboratory of the Inner Mongolia Agricultural University (40°48′ N, 111°42′ E) at 4 °C. At the end of March 2021, the eggs of the two groups were transferred to an artificial climate chamber at 25 ± 1 °C, a relative humidity of 70 ± 5% and photoperiod of 14 L:10 D for incubation. They were moved indoors and outdoors again after hatching in 10 days, respectively. After hatching, the larvae were fed fresh Allium mongolicum leaves grown in a greenhouse; healthy and developmentally consistent first- and second-instar live insects incubated for 1 day were treated with liquid nitrogen and stored in a −80 °C refrigerator.

2.2. Indoor and Outdoor Temperature and Humidity Data Collection

The overwintering eggs of G. daurica were maintained in an artificial climate incubator (PRX-350C, Ningbo HaiShuSaiFu experimental instrument Co., Ltd., Ningbo, China) (25 ± 1 °C, RH = 70 ± 10%, L14:D10); the outdoor incubation was carried out in the farm of Inner Mongolia Agricultural University. The temperature and humidity data were collected and recorded using a Digital Data Track Intelligent Temperature and Humidity Recorder (179-TH, Shanghai Apresys Optoelectronics Co., Ltd., Shanghai, China), and the detailed recording information is shown in Table S1.

2.3. RNA Extraction, cDNA Library Construction and Transcriptome Sequencing

The total RNA was extracted from 20 mg of first- and second-instar larvae samples of G. daurica. Each treatment had three independent biological replicates, according to the instructions of the RNAiso Plus (9108Q, TaKaRa, Kyoto, Japan) kit, and the concentration and quality of total RNA were detected via an ultra-micro spectrophotometer and 1% agarose gel electrophoresis. The RNA was reverse-transcribed into cDNA using a PrimeScriptTM RT Reagent Kit with gDNA Eraser (6210A, TaKaRa, Kyoto, Japan) and stored at −20 °C for later use. The conserved samples were sent to Guangzhou Kidio Biotechnology Co. (Gene De novo Biotechnology Co., Ltd., Guangzhou, China). The transcriptome sequencing included first- and second-instar indoor-reared and outdoor-reared larvae, and three replicates were set for each treatment; a total of 12 larval cDNA libraries were constructed. After repairing the cDNA double ends with the addition of junctions, 200 bp cDNA sequences were screened with AMPure XP beads, PCR-amplified and purified, and then transcriptome sequencing was carried out using the Illumina NovaSeq 6000 high-throughput sequencing platform. After filtering the raw reads, checking the sequencing error rate and checking the GC content distribution, the clean reads were obtained and used for all downstream analyses. The clean reads were assembled using Trinity Release 2.13.1 software to obtain unigenes, N50 value and sequence length, and the Benchmarking Universal Single-Copy Orthologs (BUSCO) online platform (http://busco.ezlab.org/) (accessed on 10 March 2021) was utilized to evaluate transcriptome quality. The raw data were submitted to the NCBI Sequence Read Archive with accession number: PRJNA1017636.

2.4. Quantitative qRT-PCR for Verification

Quantitative real-time PCR (qRT-PCR) was performed to confirm DEGs in cDNA libraries constructed from indoor and outdoor first- and second-instar larvae, respectively. We selected 8 DEGs in the pathways related to the metabolism and heat shock proteins of G. daurica for qRT-PCR to verify the expression of these genes in G. daurica larvae. Quantitative PCR primers were designed with Primer-BLAST (https://www.ncbi.nlm.gov/tools/primer-blast/index.cgi) (accessed on 13 April 2023) (Table 1) and the succinate dehydrogenase (SDHA) gene was selected as the internal reference gene [33]. The qRT-PCR reaction system was performed according to the GoTaq® qPCR Master Mix (A6001, Promega, Madison, WI, USA) instructions for configuration. A qRT-PCR instrument (FTC-3000, Funglyn Biotech, Toronto, ON, Canada) was used for the assay. The reaction program consisted of pre-denaturation at 95 °C for 10 min, denaturation at 95 °C for 15 s, annealing at 60 °C for 1 min and extension at 72 °C for 30 s for 40 cycles. A relative quantitative analysis was performed using the 2−ΔΔCt method, and the experimental data were analyzed for the comparative significance of differences using Graph Prism 9.0 software.

2.5. dsRNA Synthesis

Based on the sequences of HSP70A1 (Genebank Accession No: M76613.1), HSP70-2 (Genebank Accession No: MZ853083) and HSP70-3 (Genebank Accession No: OK585088) from the transcriptome database, specific primers were designed for PCR amplification (Table 1). The PCR reaction system (25 μL) consisted of 1 μL of cDNA template, 1 μL of each upstream and downstream primer (10 pmol/L), 12.5 μL of Premix TaqTM and 9.5 μL of RNase-Free ddH2O. The reaction program consisted of 94 °C for 3 min; 94 °C for 30 s; 58 °C for 60 s; 72 °C for 2 min, cycling 30 times; and 72 °C for 10 min. The test target genes verified via sequencing were entered into the online website http://www.flyrnai.org/cgi-bin/RNAi_find_primers.pl (accessed on 15 April 2023) and dsRNA primers containing the T7 promoter sequence at the 5′ end were designed (Table 1). The dsRNA was synthesized according to the instructions of the T7 Ribo MAXTM Express RNAi System and the concentration was measured, after which 1% agarose gel electrophoresis was used to detect whether the molecular weight size of the synthesized dsRNA was consistent with the expected one. Subsequently, the dsRNA was stored at −80 °C. Based on the results of Zhang et al. (2022) [31], when the concentration of dsRNA was 1000 ng/μL, the inference effect was best.

2.6. Microinjection of RNAi

The second-instar larvae with the same developmental stage (first day of molting) were selected, and soil and dust were brushed from their epidermis with a brush and temporarily fastened in clean slides with solid adhesive. The 0.4 μL (1000 ng/μL) dsRNA was injected into the 8th abdominal segment of the larvae using a microinjector (SHTMADZU, Kyoto, Japan), the larvae were placed into centrifuge tubes with air holes to be reared individually after injection, and their mortality was observed [33,34]. Two or more target genes interfering with the injected dsRNA were mixed in a 1:1 ratio and sampled at treatment 0, 24, 48, 72 and 96 h, with injections of sterilized water and dsGFP serving as blank and negative controls, respectively.

2.7. Relative Expression of HSP70A1, Hsp70-2 and Hsp70-3 after RNAi

Based on the sequencing of the HSP70A1, Hsp70-2 and Hsp70-3 cDNA, specific primers were designed for qPCR detection (Table 1). The qPCR reaction system (10 μL) consisted of 1 μL of cDNA template, 0.2 μL each of forward and reverse primers (10 μmol/L), 5 μL of SYBR Green Real-time PCR Master Mix Reaction Solution, and 3.6 μL of sterilized water. The internal reference genes were the same as in 2.6, and the primers are shown in Table 1. Three replicates were treated in each section of 2.6, with 20 individuals in each replicate. A q-PCR instrument (FTC-3000, Funglyn Biotech, Canada) was used for determination. The reaction program consisted of 95 °C pre-denaturation for 10 min; 95 °C denaturation for 15 s; 60 °C annealing for 1 min; and 72 °C extension for 30 s, 40 cycles.

2.8. Determination of Super-Cooling Point and Freezing Point

In order to test the silencing effects of GdHsp70A1, GdHsp70-2 and GdHsp70-3 on the cold tolerance of second-instar larvae of G. daurica, the thermocouple method was used to determine the super-cooling point (SCP) and freezing point (FP). A low-temperature incubator (LRH-100C, Shanghai Yiheng Instrument Co., Ltd., Shanghai, China) and multi-circuit automatic temperature recorder (TP9024U, Shenzhen Topray Electronics Co., Ltd., Shenzhen, China) were used. The test larvae were placed in a pipette gun tip stuffed with a small amount of degreased cotton, and the thermometer thermal probe was inserted so that the thermal probe could be fixed in the gun tip, precisely close to the larval body after 24 h of treatment in the abdominal segment, after which they were placed in a low-temperature incubator. We set a program to reduce the temperature in the incubator from room temperature to −40 °C at a rate of about 1 °C/min, during which the changes in body temperature were recorded [28,35]. Each treatment was replicated three times with 20 larvae per replication.

2.9. Gene Functional Annotation

To annotate the G. daurica transcriptome, we performed a BLAST search against the non-redundant (NR) database in NCBI, SWISS-PROT, KEGG and COG with an E-value cut-off of 10−5. We annotated the motifs and domains using InterPro [36]. Gene Ontology terms were assigned using Blast2GO [37] through a search of the NR database [38]. Several public protein databases were used, such as UniProt/Swiss-Prot [39], Cluster of Orthologous Groups of Proteins [40] and the Kyoto Encyclopedia of Genes and Genomes [41].

2.10. Normalization of Gene Expression Levels and Analysis of DEGs

Analyzing differential gene expression requires quantifying the expression levels of different expression genes (DEGs). Therefore, gene expression was normalized using reads per kilobase per million mapped exonic regions (FPKM) [42]. The FDR values were adjusted based on the method of Benjamini and Hochberg [43,44] after which the p values were derived. Genes were indicated as DEGs when the adjusted p value was <0.05 and |log2 (fold change)| ≥ 1.

2.11. Enrichment and Analysis of DEGs by GO and KEGG

The GO classification system was used to clarify the potential roles of all DEGs. The results are represented by three separate hierarchies, “Biological Process” (BP), “Cellular Component” (CC), and “Molecular Function” (MF). Pathway enrichment analysis was performed using the KEGG database to further assess significantly enriched metabolic or signaling pathways, and pathways with p value < 0.05 were defined as significantly enriched DGEs [45,46].

3. Results

3.1. Gene Annotation Results and Bioinformatics Analysis

There were four groups of tested G. daurica larvae, namely indoor first-instar larvae (GdIn1), outdoor first-instar larvae (GdOut1), indoor second-instar larvae (GdIn2) and outdoor second-instar larvae (GdOut2), reared in the lab at constant temperature and outdoors in variable natural temperature conditions, respectively. The indoor and outdoor rearing groups were regarded as the control and experimental groups, respectively. The samples were sequenced and filtered to obtain clean data (Table S2); the results show that the proportion of Q30 was more than 93% in all cases (the base quality value Q30 corresponds to a base recognition accuracy of 99.9%), and the proportion of unrecognized bases (N) was 0, indicating that the sequencing data were reliable.
The clean data reads were mixed and assembled, and 103,788 unigenes were obtained with an average length of 874 bp and an N50 length of 1611 (Table S3). Among them, there were a total of 30,588 with a length of 200–300 bp (accounting for about 29.30% of the total unigenes), a total of 28,169 with a length of 300–500 bp (25.99%), a total of 21,959 with a length of 500–1000 bp (20.03%), a total of 12,577 with lengths between 1000 and 2000 bp (13.20%) and 10,495 with lengths greater than 2000 bp (11.48%) (Figure S1).
The assembled unigene sequences of G. daurica were compared with the Nr, KEGG, SWISS-PROT and KOG databases, the predicted amino acid sequences of the unigenes were compared with the Pfam database, and, finally, 37,446 unigenes with annotations were obtained (Table S4). Among them, there were 37,020, 31,632, 16,994 and 15,419 unigenes annotated in the Nr, KEGG, SWISS-PROT and KOG databases, respectively, accounting for 98.86%, 84.47%, 45.38% and 41.18%, respectively. Through the annotating information from the Nr library, we obtained the similarity between unigene sequences of G. daurica larvae and homologous sequences of related genera, among which the most matched sequences were homologous sequences of Diabrotica virgifera, accounting for 27.2% with a total of 10,053 sequences and the homologous sequences of Mus musculus, Anoplophora glabripera, L. decemlineata and other matching species, with less than 3000 homologous sequences (Figure S2).

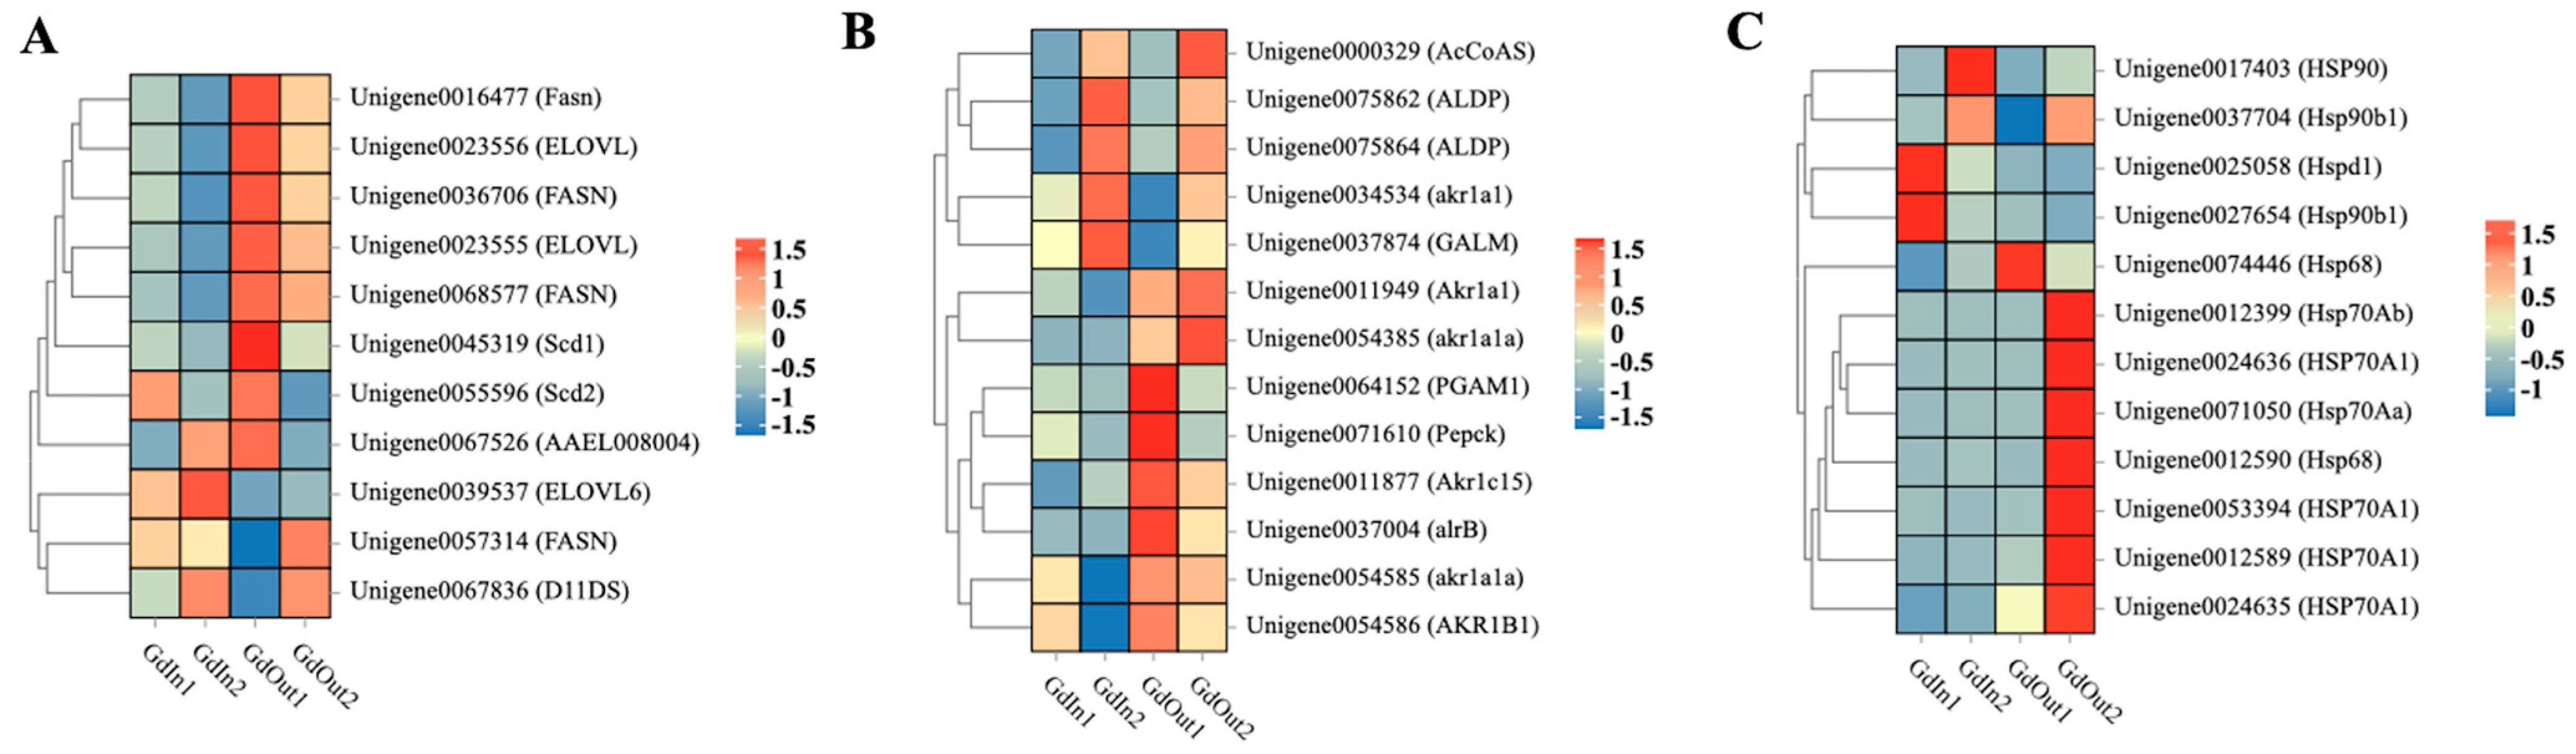
3.2. Analysis of the Expression of Biosynthesis-Related and HSP-Related Genes in G. daurica

By analyzing the KEGG pathway enrichment of G. daurica larvae, we found that many pathways related to biosynthesis reactions were enriched, including lipid synthesis, glycometabolism and biosynthesis, amino acid metabolism, and so on. There are three main ways to protect insects from ambient cold temperatures: the fatty acid biosynthesis pathway, the glycolysis/gluconeogenesis pathway, and the HSP pathway. Among them, the glycolysis pathway stands out as glycogen is one of the major sources of energy for biological survival. Zhu et al. (2016) found that energy metabolism in insects increases with prolonged cold exposure; in particular, glycometabolism was sensitive to cold [47]. In 2017 year, they continued to report that carbohydrates in Spodoptera litura were rapidly depleted at low temperatures [48]. It is reported that long-chain fatty acid elongases (ELOs) play an important role in fatty acid metabolism in insects [49]. Duell et al. (2022) found that Agrilus planipennis can prevent internal ice formation by accumulating lipid content in the body, thereby increasing its own super-cooling point (SCP) [50]. Therefore, we selectively studied the pathways related to glycolysis/gluconeogenesis and fatty acid biosynthesis of G. daurica. After homogenizing the FPKM values of each unigene expression, the produced heatmaps show that the number of up-regulated genes was significantly more in the GdOut1 and GdOut2 groups than in the GdIn1 and GdIn2 treatment groups in the fatty acid biosynthesis pathway (Figure 1A). In the glycolysis/gluconeogenesis pathway (Figure 1B), some genes were highly expressed in GdIn1 and GdIn2 while expression in GdOut1 and GdOut2 was at low levels, but the number of up-regulated genes in GdOut1 and GdOut2 was still significantly more than that in GdIn1 and GdIn2, which is consistent with the lipid biosynthesis pathway. We also investigated the genes related to the HSP pathway; the heatmap shows (Figure 1C) that many HSP-related genes were significantly up-regulated in the GdOut2 treatment group compared with GdIn1, GdIn2 and GdOut1, such as HSP68, HSP70A1, HSP70Aa and HSP70Ab. Based on the heatmap results of gene expression, three HSP70 genes were chosen for RNAi study.

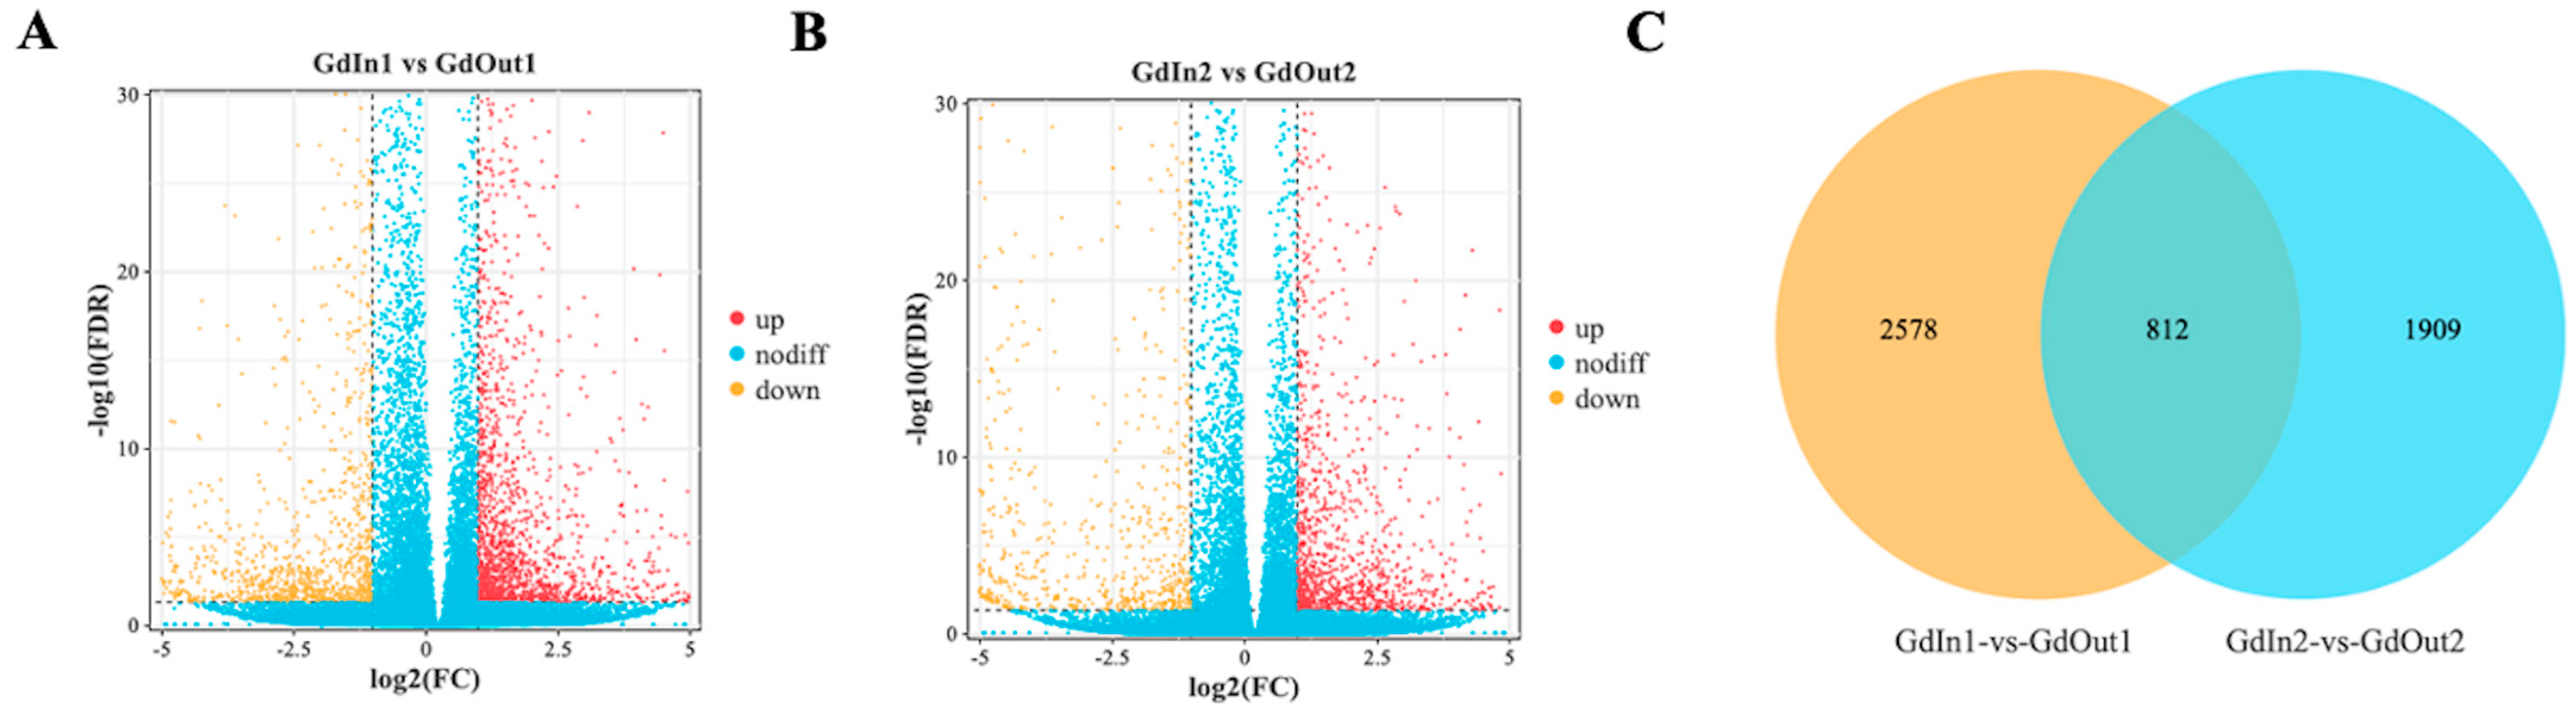
3.3. Identification and Analysis of DEGs

To identify DEGs in different treatment groups, we used DESeq2 software (1.20.0) to differentially analyze the read counts obtained in the gene expression level analysis. We defined GdIn1 as the first-instar control group and outdoor-feeding GdOut1 as the first-instar treatment group; meanwhile, GdIn2 was defined as the second-instar control group and outdoor-feeding GdOut2 was defined as the second-instar treatment group. In the GdIn1 vs. the GdOut1 group, there were a total of 3390 DEGs, of which 1958 were up-regulated for expression and 1432 were down-regulated for expression (Figure 2A). In the GdIn2 vs. the GdOut2 group, there were a total of 2721 DEGs, of which 1327 DEGs were up-regulated and 1394 DEGs were down-regulated for expression (Figure 2B). In addition, the identification of DEGs via Venn diagram (Figure 2C) revealed that 2578 genes were differentially expressed in the comparison of groups GdIn1 vs. GdOut1 and 1909 genes were differentially expressed in the comparison of groups GdIn2 vs. GdOut2, while there were a total of 812 DEGs in both groups.

3.4. GO Functional Enrichment of DEGs

Compared with the indoor and outdoor first-instar (Figure 3), for biological processes, the top three GO terms with the highest enrichment were cellular process, metabolic process and single-organism process, with the number of differentially expressed genes (DEGs) being 1516, 1345 and 1323, respectively. In molecular function, the top two GO terms with the highest enrichment were binding and catalytic activity, with 1296 and 938 DEGs in the two pathways, respectively. In the cellular component, the top three GO terms with the highest enrichment were cell, cell part and organelle, with 1107, 1106 and 851 DEGs, respectively. In contrast, the indoor and outdoor second-instar comparison groups (Figure 3), whose enrichments were consistent with that of the first-instar comparison groups, had a lower number of DEGs in each pathway than that of the first-instar larval comparison groups. However, the number of DEGs in each pathway was less than that in the first-instar larval group, and the number of DEGs in the top 3 GO terms in the biological process were 1128, 1032 and 919, respectively. In terms of molecular function, the numbers of DEGs for binding and catalytic activity were 964 and 784, respectively. In the cellular component, there were 789, 789 and 584 genes differentially expressed in the cell, cell part and organelle, respectively.

3.5. KOG Annotation Analysis of DEGs

KOG homology classification of the G. daurica larval transcriptome unigenes yielded 19,665 gene annotations. In the larval taxonomic annotations, the categories with most gene annotations were general function prediction only in stage R and signal transduction mechanisms in stage T. The number of annotations were 4348 and 2387, respectively. Posttranslational modification, protein turnover and chaperones were the next largest categories in stage O, with 1662 annotations. There were also translation, ribosomal structure and biogenesis in stage J with 970 entries, and transcription in stage K with 1010 entries in the larval annotations (Figure 4).

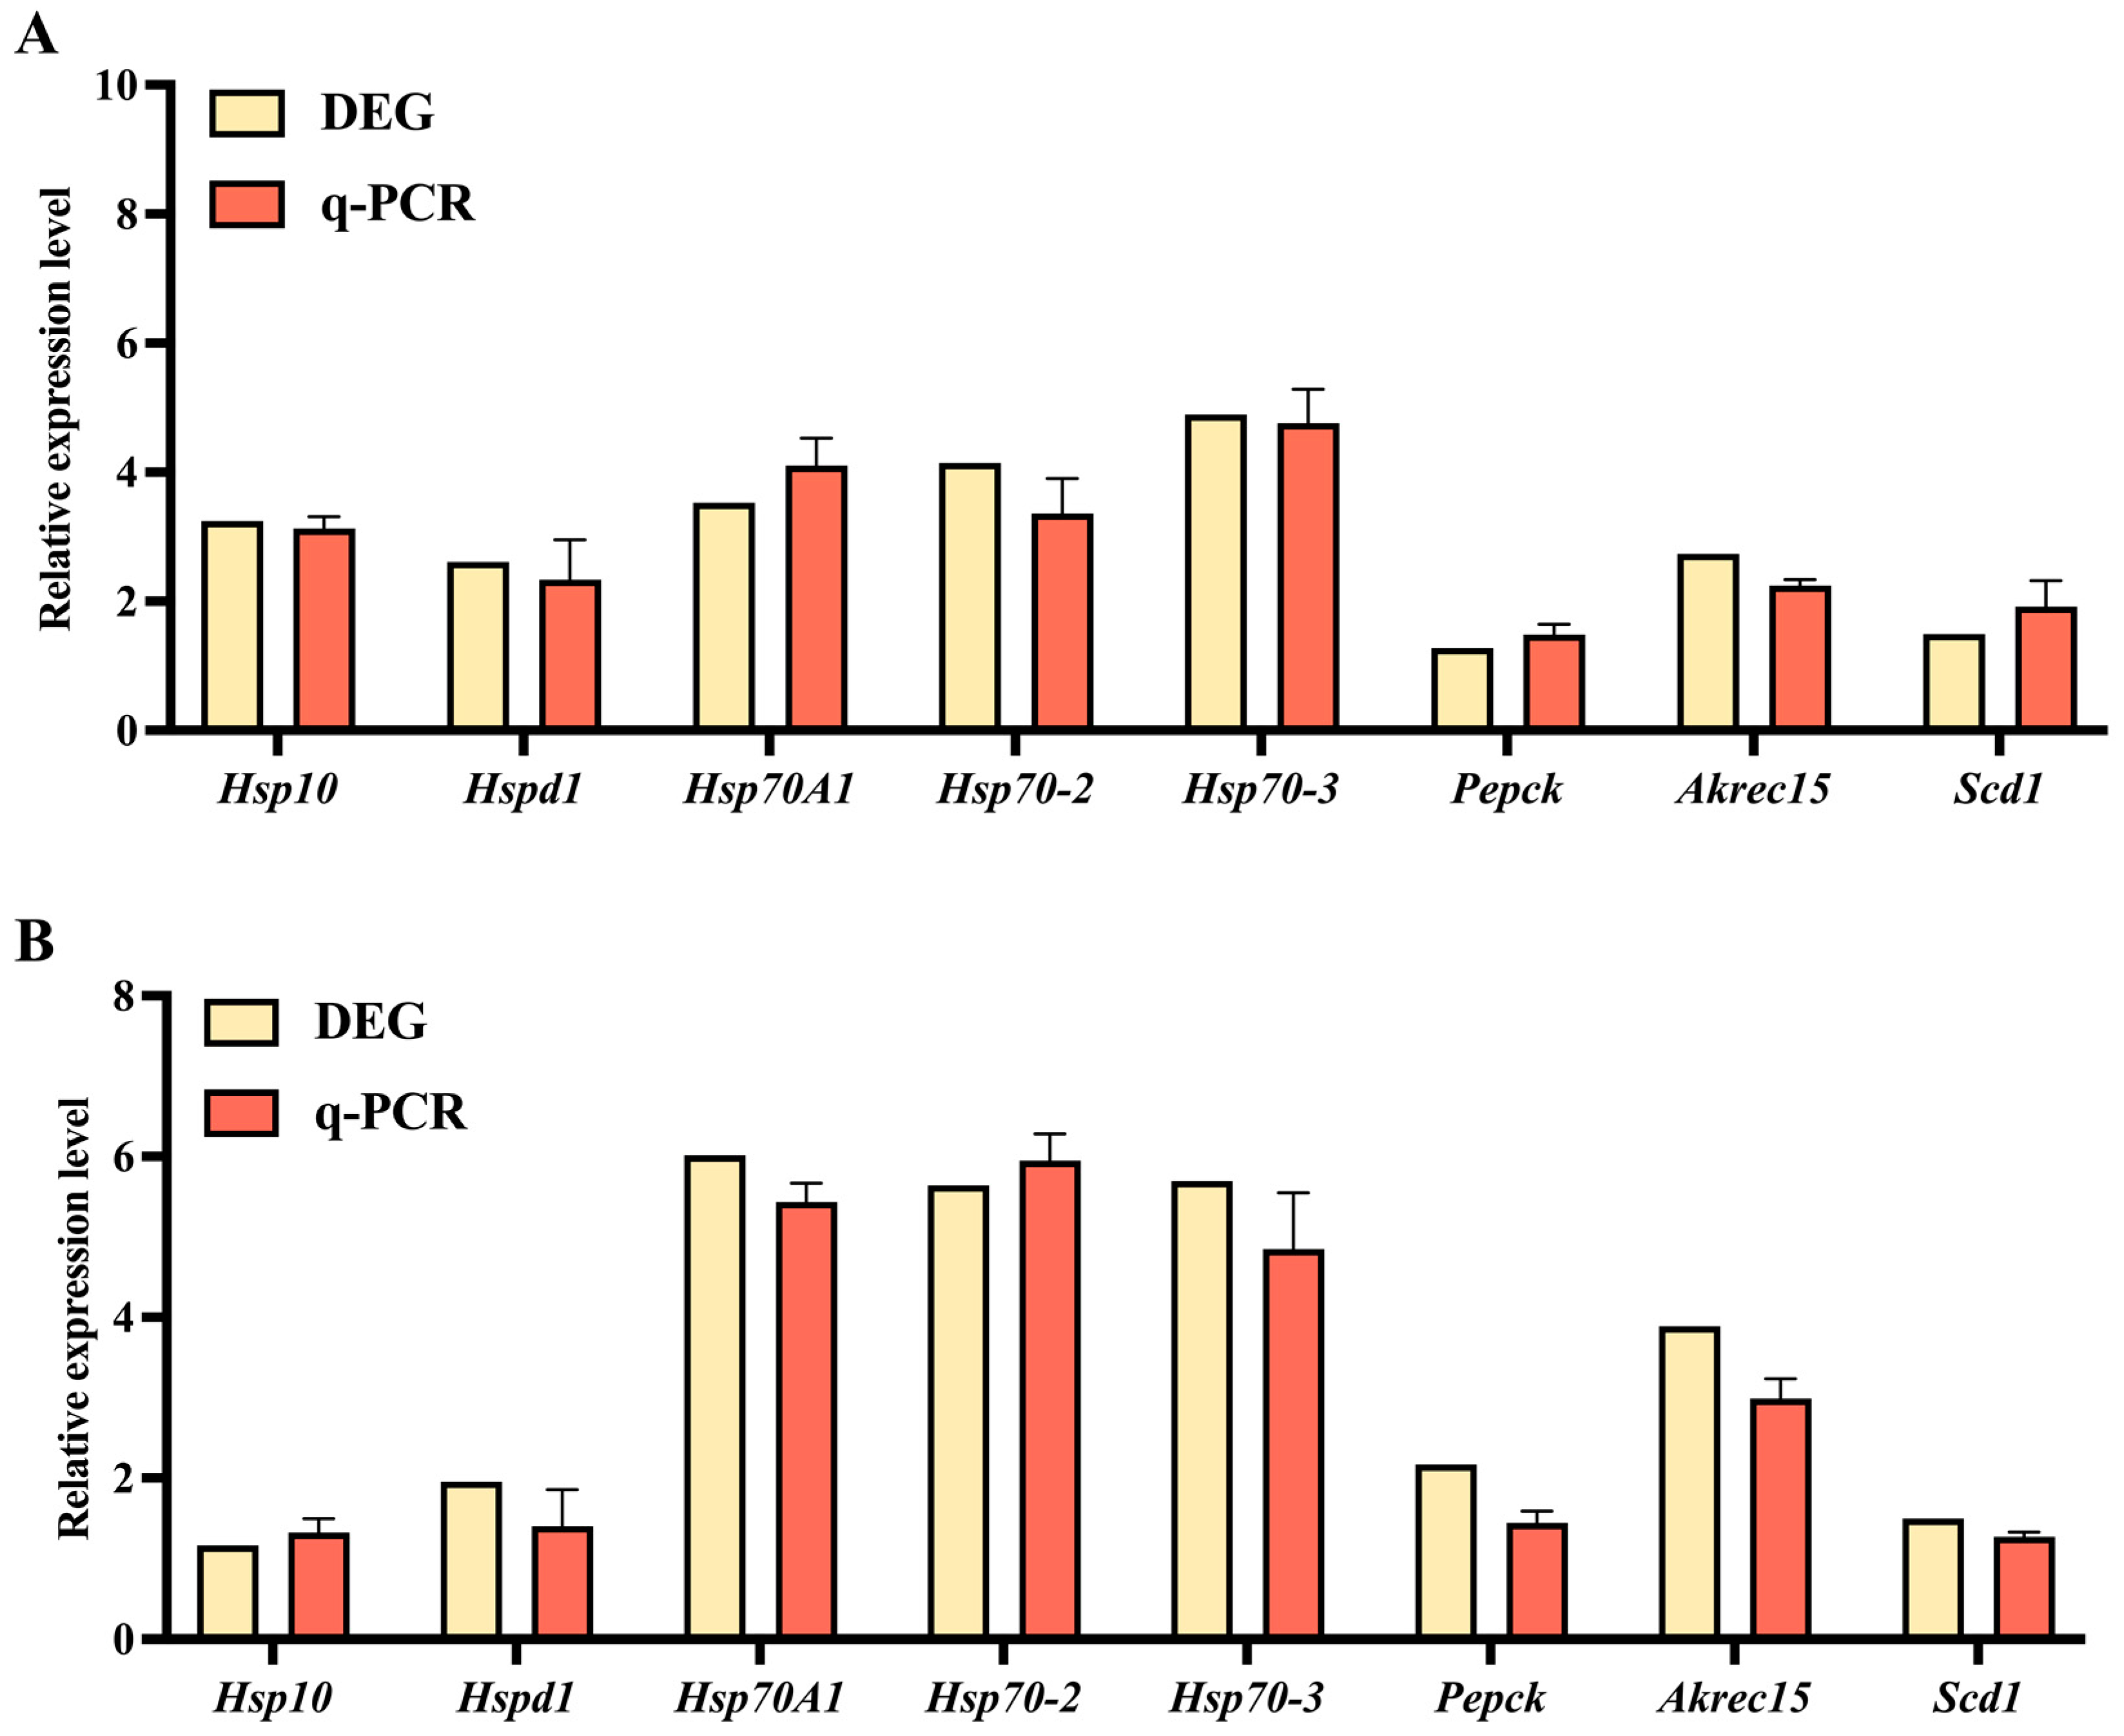
3.6. The qPCR Validation of DEGs

To confirm the reliability of the RNA-seq data, we performed qRT-PCR on eight DEGs selected from glycolysis/gluconeogenesis, lipid biosynthesis and HSP-associated pathways, which have the functions of regulating the metabolism, development, cold resistance and so on of G. daurica. These genes include heat shock proteins (HSPs), such as Hspd1, Hsp10, HSP70A1, Hsp70-2 and Hsp70-3; they also include genes related to glycolysis/gluconeogenesis and lipid biosynthesis, such as alcohol dehydrogenase (Akr1c15), phosphoenolpyruvate carboxykinase (Pepck) and stearoyl-CoA desaturase (Scd1). The gene expression trends from the qRT-PCR results were consistent with the RNA-Seq deep sequencing data (Figure 5); therefore, the expression of these genes via qRT-PCR confirmed the direction of change detected via DGE analysis.

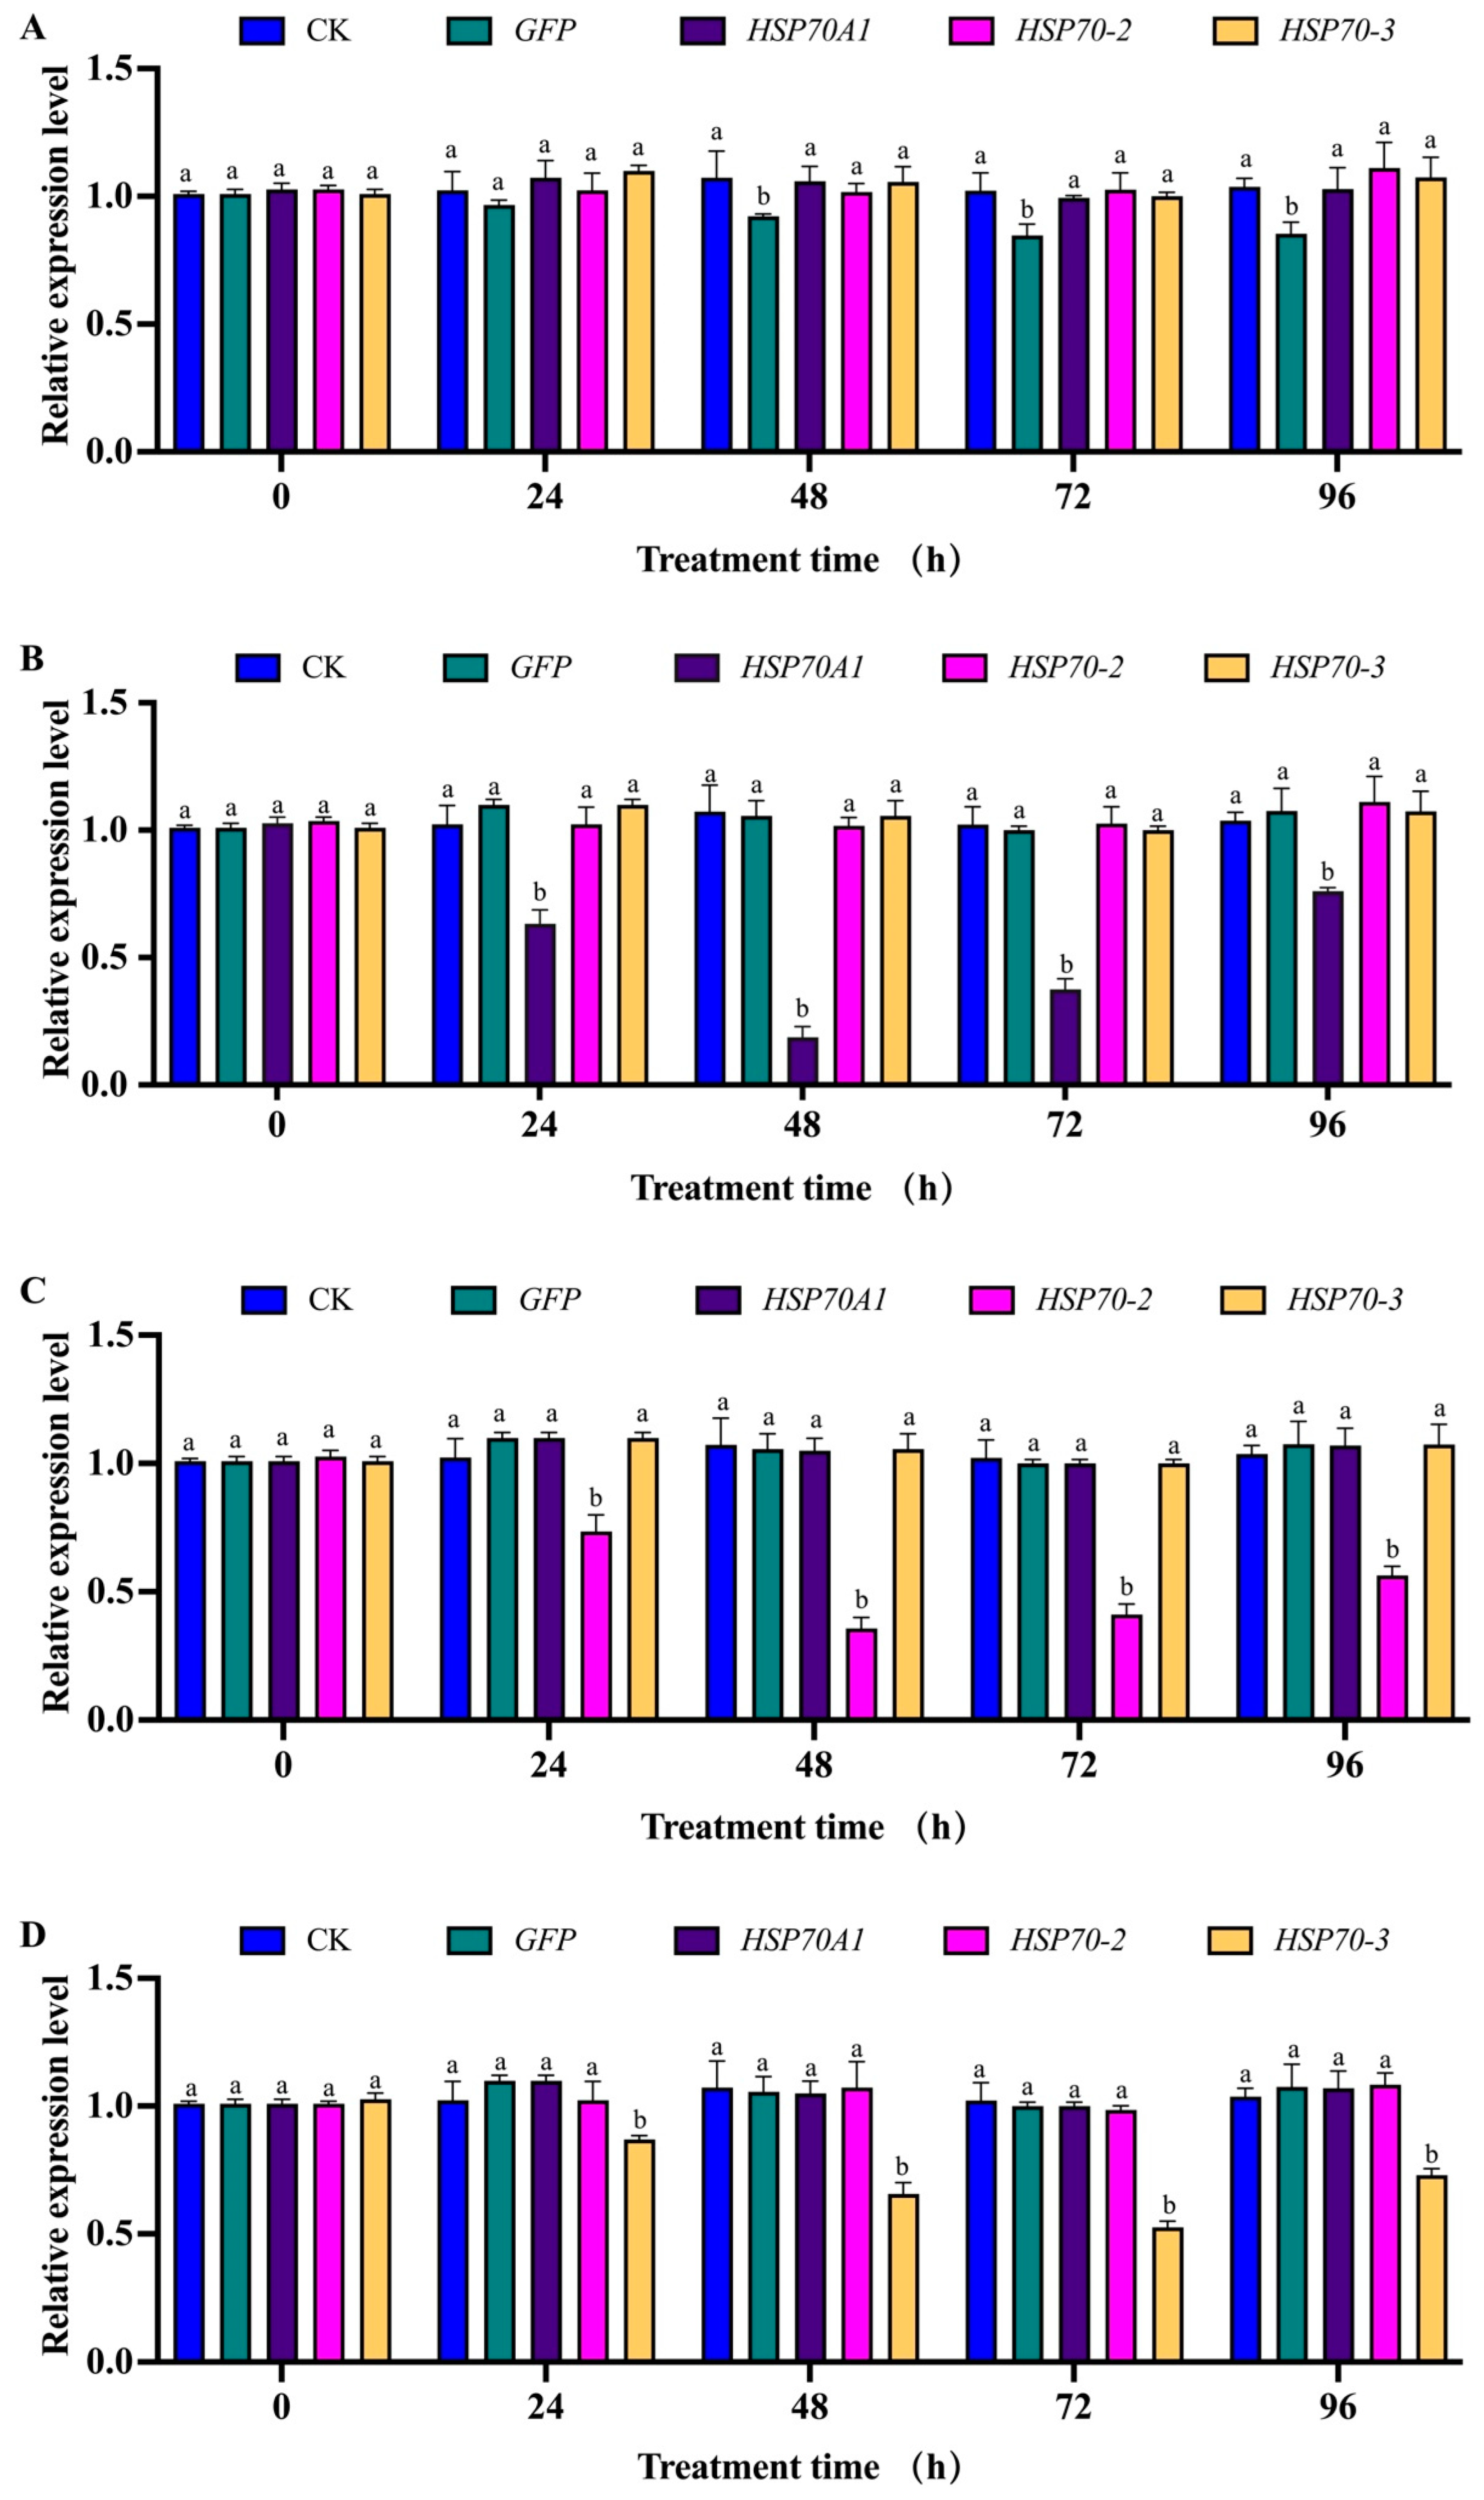
3.7. Expression Levels of Hsp70A1, Hsp70-2 and Hsp70-3 in Second-Instar Larvae of G. daurica after RNAi Using Microinjection Method

Compared with the dsGFP injection group (Figure 6A), the expression levels of Hsp70A1, Hsp70-2 and Hsp70-3 in the second-instar larvae of G. daurica significantly decreased after 24 h of injection (Figure 6B–D) and decreased to the lowest levels at 48 h and 72 h, with the expression levels decreased by 81.8% (p < 0.01), 65.3% (p < 0.01) and 48.7% (p < 0.01), respectively. The expression levels of these three genes still differed significantly after 96 h compared to the control (p < 0.01). We then mixed dsRNAs of two different genes for interference injection, such as dsHsp70A1 and dsHsp70-2, dsHspA1 and dsHsp-3, and dsHsp70-2 and dsHsp70-3 (Figure 6E–G, respectively). In the group injected with dsHsp70A1 and dsHsp70-2 (Figure 6E), the expression levels of the Hsp70A1 and Hsp70-2 genes decreased significantly at 24 h, 48 h, 72 h and 96 h (p < 0.01), and the expression levels of the Hsp70-3 gene differed significantly at 48 h, 72 h and 96 h (p < 0.01). In the group injected with dsHsp70A1 and dsHsp70-3 (Figure 6F), the expression levels of Hsp70A1, Hsp70-2 and Hsp70-3 genes were significantly decreased within 96 h (p < 0.01). In the group injected with dsHsp70-2 and dsHsp70-3 (Figure 6G), the expression levels of Hsp70A1, Hsp70-2 and Hsp70-3 genes decreased significantly at four test intervals (p < 0.01). Finally, we injected the dsRNAs of three genes in a 1:1:1 mixing interference (Figure 6H), and the results show that the expression of Hsp70A1, Hsp70-2 and Hsp70-3 decreased to their lowest levels after 48 h of dsRNAs injection (p < 0.01), and the difference was still significant after 96 h (p < 0.01).

3.8. Super-Cooling Point and Body Fluid Freezing Point of G. daurica Larvae after RNAi

The super-cooling point (SCP) and freezing point (FP) of G. daurica second-instar larvae were significantly elevated (p < 0.05) after 24 h following injection of dsHsp70A1, dsHsp70-2 and dsHsp70-3 (Figure 7). The SCP and FP of the second-instar larvae were −14.51 ± 0.21 °C and −14.07 ± 0.18 °C, respectively, after dsGFP injection, which was not significant (p > 0.05) compared with the control. The SCP of the second-instar larvae after injection of dsHsp70A1, dsHsp70-2 and dsHsp70-3 were −10.42 ± 0.41 °C, −9.53 ± 0.09 °C and −10.19 ± 0.45 °C, respectively. The FP of the second-instar larvae after RNAi of Hsp70A1, Hsp70-2, and Hsp70-3 were −9.87 ± 0.12 °C, −9.21 ± 0.25 °C and −9.51 ± 0.31 °C, respectively, which were significantly higher compared with the control (p < 0.01). After injecting mixed dsRNAs of Hsp70A1 and Hsp70-2 genes, the SCP and FP of the second-instar larvae were −9.32 ± 0.53 °C and −8.51 ± 0.61 °C, respectively, which were significantly higher compared with the control (p < 0.01). After injecting mixed dsRNAs of Hsp70A1 and Hsp70-3 genes, the SCP and FP were −8.61 ± 0.71 °C and −7.86 ± 0.41 °C, respectively, which were significantly higher compared with the control (p < 0.01). After injecting mixed dsRNAs of Hsp70-2 and Hsp70-3 genes, the SCP and FP were −8.52 ± 0.72 °C and −7.35 ± 0.64 °C, respectively, which were significantly higher compared with the control (p < 0.01). After injecting mixed dsRNAs of three genes, Hsp70A1, Hsp70-2, and Hsp70-3, the SCP and FP were −7.52 ± 0.72 °C and −6.97 ± 0.84 °C, respectively, which were significantly higher compared with the control (p < 0.01) (Figure 7). In conclusion, the results show that separate and mixed injections of dsHsp70A1, dsHsp70-2 and dsHsp70-3 significantly reduced the super-cooling point and body fluid freezing point of second-instar G. daurica larvae.

4. Discussion

Temperature adaptation is an important factor in insect response to environmental change [51]; insects can adjust their own physiological and biochemical mechanisms by changing their cellular activity and metabolism to respond to changes in the external environment [52]. Cold stress is diverse, and different insect species have evolved different metabolic and physiological adaptations [53]. Maintaining cellular homeostasis, preserving cell viability and enhancing cellular tolerance by adjusting their metabolic status are the most important means of maintaining vital signs in insects at low temperatures [54]. Fatty acid biosynthesis plays a key role in the development of insects, not only in resisting environmental stresses in harsh environments but also in acting as an important antifreeze in low-temperature conditions [55], which is helpful in maintaining the stability of cell membranes, prevent cell freezing and rupture. This leads to the production and accumulation of fatty acids in insects at low temperatures and the development of cold tolerance [56]. On this basis, fatty acid biosynthesis is crucial for the survival of insects during the cold season [57]. A heat map related to lipid biosynthesis in G. daurica larvae (Figure 1B) shows that the fatty-acid-biosynthesis-related genes are expressed differently for indoor-reared and naturally developed G. daurica larvae. When G. daurica is alive in a thermostable environment, it synthesizes fewer fatty acids for growth and development because it does not have to cope with severe environmental stresses. On the contrary, when faced with environmental stresses, G. daurica larvae increase the intensity of lipid biosynthesis to improve their resistance to stresses.
The glycolysis/gluconeogenesis pathway plays a key role in the physiological processes of insects, especially in growth and development, flight energy supply, insect molting, metamorphosis and response to external environmental stresses. Through the heat map of glycolysis/gluconeogenesis in G. daurica larvae (Figure 1A), it can be concluded that certain genes may be highly expressed in an adverse environment to increase glycogen biosynthase and energy production to support the normal growth and development of G. daurica larvae. Regarding external environmental stress, other genes can also be induced to adjust the metabolism of larvae and reduce the energy consumption required for metabolic activities. Genes related to glycolysis/glycogenesis in G. daurica larvae perform different functions in different environments. This pattern of gene regulation provides G. daurica larvae with a strong adaption ability to the environment.
Insects surviving in cold environments exhibit cold tolerance due to the induction of heat shock proteins (HSPs) [58]. Cold stress can also cause denatured or misfolded proteins, leading to harmful aggregates and impaired function [59]. For G. daurica, the conformation and activity of their proteins and enzymes are easily damaged in severe and low-temperature environments on the grasslands, which causes rapid production of reactive oxygen species (ROS) in organisms [60]. HSPs play a key role in repairing and stabilizing these physiologically-active molecules [61]. When exposed to low temperatures, the expression levels of HSPs are up-regulated accordingly in response to physiological damage caused by cold [62]. The heat map reveals (Figure 1C) that these HSP-related genes have different expression patterns during the development of G. daurica. For example, the HSP90 gene (Unigene0017403) was expressed at a higher level in second-instar larvae reared indoors, while it was down-regulated in second-instar larvae reared outdoors. The HSP90b1 gene (Unigene0037704) tended to be up-regulated in second-instar larvae reared indoors and outdoors. In comparison, the HSP70 gene showed high expression levels in second-instar larvae reared outdoors and low or no expression in larvae under other rearing conditions, which means that different types of HSPs have different expression patterns in insects, which is similar with the conclusion of Yang et al. (2021) [63], Zhang et al. [64] and Ruan et al. (2022) [65]. The results show that HSPs were sensitive to temperature in the growth and development process of G. daurica. HSPs also can respond to environmental changes promptly to maintain normal physiological state in insects [66]. This suggests that different types of HSP genes may have different roles and regulatory mechanisms in cold tolerance in insects [67]. The expression levels of HSP-related genes in G. daurica were significantly increased in cold environmental conditions and decreased in warm environments. These changes in HSP gene expression patterns not only reflect the perception intensity of G. daurica to low-temperature environments at different developmental stages but also reflect that it can adapt to low-temperature stress by regulating HSP expression [68].
The DEG volcano plots (Figure 2A,B) and Venn diagrams (Figure 2C) revealed that the number of DEGs in the first-instar larvae comparison group was significantly higher than in the second-instar larvae comparison group, which is because G. daurica first-instar larvae tend to occur in the colder early April [25]. During this period, although the temperature is gradually increasing, it is still relatively low. More genes are up-regulated to adapt to the lower environmental temperature for G. daurica larvae. These DEGs participate in various biological processes crucial for growth and development, contributing to the larvae’s ability to survive and thrive in cold environments. However, as the temperature continues to rise, G. daurica first-instar larvae gradually develop into second-instar larvae. At this stage, different genes are expressed to adapt to relatively mild late April. This is consistent with the results of GO functional enrichment analysis (Figure 3). In the KOG annotation analysis (Figure 4), it was found that a large number of genes in the G. daurica larvae were related to signal transduction, post-translational modification, protein turnover and molecular chaperones. This is consistent with the conclusion reported by Li et al. (2018) that heat shock proteins serve as highly conserved molecular chaperones, which can enhance the tolerance of organisms to stress [69]. However, the expression patterns and functional annotations of these DEGs can be influenced by various factors. Therefore, future studies need to combine new technological approaches to deeply investigate the influence of different ecological environment factors (such as climate, photoperiod, food source, etc.) on gene expression.
For insects living in low-temperature environments, the transient expression and regulation of HSPs are critical for maintaining their physiological functions and adaptive capacity [70]. The induced expression of HSPs in insects under stress is a natural defense mechanism against adverse environments, ensuring that insects can survive and develop better in cold environments [71]. Although many studies have reported that HSPs play a key role in the environmental adaptation of insects, only a limited number have employed RNAi to explore the impact of target genes associated with insect HSPs on insect cold tolerance. We used microinjection to introduce targeted dsRNAs into second-instar larvae, and the results show that RNAi can significantly reduce the expression level of HSP genes in insects. In addition, we determined the super-cooling point and freezing point of the larvae after silencing the target genes, and it was found that HSP gene interference can significantly reduce the cold tolerance of insects. This research result further confirms the important role of HSPs in insect environmental adaptation and reveals the potential application value of RNAi in studying the physiological and biochemical fields of insects. These findings provide new ideas and approaches for pest control.

5. Conclusions

In this paper, de novo transcriptome assembly of G. daurica by RNA-Seq were performed and the DEGs of first- and second-instar larvae grown and developed indoors and outdoors, respectively, were compared. The results show that the genes associated with glyconeogenesis, fatty acid biosynthesis and HSP production were up-regulated in the larvae grown and developed outdoors. In addition, significant expression differences in the Hsp70 gene (Hsp70A1, Hsp70-2, Hsp70-3) were conducted for RNAi to further illustrate the role of heat stress proteins in cold tolerance on G. daurica larvae. The separate and mixed injections of dsHSP70A1, dsHsp70-2 and dsHsp70-3 significantly reduced expression levels of the target genes in G. daurica larvae, and the super-cooling point (SCP) and the body fluid freezing point (FP) of the test larvae significantly increased, which validated the role of heat shock proteins in the cold resistance of G. daurica larvae.

Supplementary Materials

The following supporting information can be downloaded at: https://www.mdpi.com/article/10.3390/genes14122177/s1, Figure S1: Unigene length distribution of G. daurica larvae; Figure S2: Annotation information of transcriptome data of G. daurica larvae and other species in Nr database; Table S1: The outdoor temperature and humidity data collection; Table S2: Summary of the RNA-Seq data from transcriptomes of first- and second-instar G. daurica larvae; Table S3: Transcriptome assembly results of G. daurica larvae; Table S4: Functional annotation of the unigene transcriptome of G. daurica larvae.

Author Contributions

Conceptualization, Y.T.; methodology, Y.T.; software, F.S.; validation, H.Z., F.S. and Y.T.; formal analysis, W.Z., H.Z. and F.S.; investigation, W.Z., X.G., Y.L., L.L. and B.P.; resources, L.D., X.Y. and B.P.; data curation, H.Z. and F.S.; writing—original draft preparation, H.Z. and F.S.; writing—review and editing, H.Z., F.S. and Y.T.; project administration, Y.T.; funding acquisition, Y.T. All authors have read and agreed to the published version of the manuscript.

Funding

This research was funded by the Research Start-up Funds for High-level Researchers of Inner Mongolia Agricultural University, grant number NDYB2019-02 and the Inner Mongolian Science and Technology Key Project-2021 grant funded by the Inner Mongolian Chamber of Science and Technology, grant number 2021GG0108.

Institutional Review Board Statement

Not applicable.

Informed Consent Statement

Not applicable.

Data Availability Statement

Data are contained within the article or Supplementary Materials.

Conflicts of Interest

The authors declare no conflict of interest.

References

  1. Enriquez, T.; Colinet, H. Cold acclimation triggers major transcriptional changes in Drosophila suzukii. BMC Genom. 2019, 20, 413. [Google Scholar] [CrossRef]
  2. Khurshid, A.; Ali, S.; Inayat, R.; Tamkeen, A.; Tahir, M.B.; Niaz, Y.; Haq, I.; Ghramh, H.A.; Boamah, S.; Zhang, K.; et al. Effect of short-term heat stress on life table parameters of green peach aphid [Myzus persicae (Sulzer) (Hemiptera: Aphididae)]. J. King Saud. Univ. Sci. I 2022, 34, 102342. [Google Scholar] [CrossRef]
  3. Mutamiswa, R.; Machekano, H.; Chidawanyika, F.; Nyamukondiwa, C. Life-stage related responses to. combined effects of acclimation temperature and humidity on the thermal tolerance of Chilo partellus (Swinhoe) (Lepidoptera: Crambidae). J. Therm. Biol. 2019, 79, 85–94. [Google Scholar] [CrossRef] [PubMed]
  4. Chang, Y.W.; Zhang, X.X.; Lu, M.X.; Gong, W.R.; Du, Y.Z. Transcriptome analysis of Liriomyza trifolii (Diptera: Agromyzidae) in response to temperature stress. Comp. Biochem. Phys. D 2020, 34, 100677. [Google Scholar] [CrossRef]
  5. Bale, J.S.; Hayward, S.A. Insect overwintering in a changing climate. J. Exp. Biol. 2010, 213, 980–994. [Google Scholar] [CrossRef] [PubMed]
  6. Hayward, S.A. Application of functional ‘Omics’ in environmental stress physiology: Insights, limitations, and future challenges. Curr. Opin. Insect Sci. 2014, 4, 35–41. [Google Scholar] [CrossRef] [PubMed]
  7. Zhang, Y.; Wu, H.; Xie, J.; Jiang, R.; Deng, C.; Pang, H. Transcriptome responses to heat- and cold-stress in ladybirds (Cryptolaemus montrouzieri Mulasnt) analyzed by deep-sequencing. Biol. Res. 2015, 48, 66. [Google Scholar] [CrossRef] [PubMed]
  8. Dunning, L.T.; Dennis, A.B.; Park, D.; Sinclair, B.J.; Newcomb, R.D.; Buckley, T.R. Identification of cold-responsive genes in a New Zealand alpine stick insect using RNA-Seq. Comp. Biochem. Phys. D 2013, 8, 24–31. [Google Scholar] [CrossRef]
  9. Dunning, L.T.; Dennis, A.B.; Sinclair, B.J.; Newcomb, R.D.; Buckley, T.R. Divergent transcriptional responses to low temperature among populations of alpine and lowland species of New Zealand stick insects (Micrarchus). Mol. Ecol. 2014, 23, 2712–2726. [Google Scholar] [CrossRef]
  10. Tusong, K.; Guo, X.; Meng, S.; Liu, X.; Ma, J. Comparative analysis of the transcriptome of the overwintering desert beetle Microdera punctipennis. Cryobiology 2017, 78, 80–89. [Google Scholar] [CrossRef]
  11. Govaere, L.; Morin, M.D.; Frigault, J.J.; Boquel, S.; Cohen, A.; Lamarre, S.G. Transcriptome and proteome analyses to investigate the molecular underpinnings of cold response in the Colorado potato beetle, Leptinotarsa decemlineata. Cryobiology 2019, 88, 54–63. [Google Scholar] [CrossRef] [PubMed]
  12. Vatanparast, M.; Park, Y. Comparative RNA-Seq analyses of Solenopsis japonica (Hymenoptera: Formicidae) reveal gene in response to cold stress. Genes 2021, 12, 1610. [Google Scholar] [CrossRef] [PubMed]
  13. Ashraf, H.J.; Ramos, A.L.C.; Ahmed, S.; Haq, I.U.; Ali, H.; Ilyas, M.; Gu, S.; Wang, L. Comparative transcriptome analysis of Tamarixia radiata (Hymenoptera: Eulophidae) reveals differentially expressed genes upon heat shock. Comp. Biochem. Phys. Part D 2022, 41, 100940. [Google Scholar] [CrossRef] [PubMed]
  14. Xu, Y.; Shi, F.; Li, Y.; Zong, S.; Tao, J. Genome-wide identification and expression analysis of the Hsp gene superfamily in Asian long-horned beetle (Anoplophora glabripennis). Int. J. Biol. Macromol. 2022, 200, 583–592. [Google Scholar] [CrossRef]
  15. Luo, D.; Liu, Q.; Wang, J.; Jashenko, R.; Ji, R. Transcriptome analysis of the differentially expressed heat-resistant genes between Calliptamus italicus and Gomphocerus sibiricus. Environ. Entomol. 2023, 52, 129–137. [Google Scholar] [CrossRef]
  16. Iqbal, J.; Zhang, X.X.; Chang, Y.W.; Du, Y.Z. Comparative transcriptome analysis of Liriomyza trifolii (Burgess) and Liriomyza sativae (Blanchard) (Diptera: Agromyzidae) in response to rapid cold hardening. PLoS ONE 2022, 17, e0279254. [Google Scholar] [CrossRef]
  17. Zhang, C.; Wang, H.; Zhuang, G.; Zheng, H.; Zhang, X. Comparative transcriptome analysis of Callosobruchus chinensis (L.) (Coleoptera: Chrysomelidae-Bruchinae) after heat and cold stress exposure. J. Therm. Biol. 2023, 112, 103479. [Google Scholar] [CrossRef]
  18. Wang, L.; Etebari, K.; Walter, G.H.; Furlong, M.J. Sex dependent transcriptome responses of the diamondback moth, Plutella xylostella L. to cold stress. Comp. Biochem. Phys. D 2023, 45, 101053. [Google Scholar] [CrossRef]
  19. Noer, N.K.; Nielsen, K.L.; Sverrisdóttir, E.; Kristensen, T.N.; Bahrndorff, S. Temporal regulation of temperature tolerances and gene expression in an arctic insect. J. Exp. Biol. 2023, 226, jeb245097. [Google Scholar] [CrossRef]
  20. Yang, X.K.; Huang, D.C.; Ge, S.Q.; Bai, M.; Zhang, R.Z. One million mu of meadow in Inner Mongolia suffer from the harm of breaking out of Galeruca daurica (Joannis). Chin. Bull. Entomol. 2010, 47, 812. (In Chinese) [Google Scholar]
  21. Zhou, X.R.; Shan, Y.M.; Tan, Y.; Zhang, Z.R.; Pang, B.P. Comparative analysis of transcriptome responses to cold stress in Galeruca daurica (Coleoptera: Chrysomelidae). J. Insect Sci. 2019, 19, 8. [Google Scholar] [CrossRef] [PubMed]
  22. Hao, X.; Zhou, X.R.; Pang, B.P.; Zhang, Z.R.; Ma, C.Y. Effects of host plants on feeding amount, growth and development of Galeruca daurica Joannis larvae (Coleoptera: Chrysomelidae). Acta Agrestia Sin. 2014, 22, 854–858. (In Chinese) [Google Scholar]
  23. Wang, H.C.; Li, L.; Li, Y.Y.; Tan, Y.; Pang, B.P. Evaluation of reference genes for miRNA expression analysis in Galeruca daurica (Coleoptera: Chrysomelidae) using qRT-PCR. Entomol. Res. 2021, 51, 393–402. [Google Scholar] [CrossRef]
  24. Zhou, X.R.; Gao, J.C.; Pang, B.P. Effects of temperature on the termination of egg diapause and post-diapause embryonic development of Galeruca daurica (Coleoptera: Chrysomelidae). Environ. Entomol. 2016, 45, 1076–1080. [Google Scholar] [CrossRef] [PubMed]
  25. Hao, X.; Zhou, X.R.; Pang, B.P.; Zhang, Z.R.; Bao, X. Morphological and biological characteristics of Galeruca daurica Joannis (Coleoptera: Chrysomelidae). Acta Agrestia Sin. 2015, 23, 1106–1108. (In Chinese) [Google Scholar]
  26. Gao, J.C.; Zhou, X.R.; Pang, B.P.; Bao, X.; Luo, J.P. Erdengqimuge. Effects of low temperature on the survivorship and development of overwintering eggs of Galeruca daurica (Coleoptera: Chrysomelidae). Acta Entomol. Sin. 2015, 58, 881–886. (In Chinese) [Google Scholar]
  27. Li, H.; Zhou, X.R.; Pang, B.P.; Chang, J. Supercooling capacity and cold hardiness of Galeruca daurica (Coleoptera: Chrysomelidae). Acta Entomol. Sin. 2014, 57, 212–217. (In Chinese) [Google Scholar]
  28. Li, H.; Zhou, X.R.; Pang, B.P.; Zhang, Z.R.; Chang, J.; Shan, Y.M. Effects of low-temperature stress on the supercooling capacity and development of Galeruca daurica (Joannis) larvae (Coleoptera: Chrysomelidae). Chin. J. Appl. Entomol. 2015, 52, 434–439. (In Chinese) [Google Scholar]
  29. Tan, Y.; Zhou, X.R.; Pang, B.P. Reference gene selection and evaluation for expression analysis using qRT-PCR in Galeruca daurica (Joannis). Bull. Entomol. Res. 2017, 107, 359–368. [Google Scholar] [CrossRef]
  30. Tan, Y.; Zhang, Y.; Huo, Z.J.; Zhou, X.R.; Pang, B.P. Molecular cloning of heat shock protein 10 (Hsp10) and 60 (Hsp60) cDNAs from Galeruca daurica (Coleoptera: Chrysomelidae) and their expression analysis. Bullet. Entomol. Res. 2018, 108, 510–522. [Google Scholar] [CrossRef]
  31. Zhang, H.L.; Ren, H.; Li, K.X.; Tian, Y.; Zhang, H.; Li, Y.Y.; Li, L.; Pang, B.P.; Tan, Y. Effects of RNAi-mediated silencing of GdHsp60 and GdHsp70 genes on the cold hardiness in Galeruca daurica (Coleoptera: Chrysomelidae). Acta Entomol. Sin. 2022, 65, 807–817. (In Chinese) [Google Scholar]
  32. Zhang, H.L.; Ren, H.; Tian, Y.; Shan, Y.M.; Wang, Y.; Li, L.; Li, Y.Y.; Pang, B.P.; Tan, Y. Cloning, identification and expression profiling analysis of GdHsp70-2, GdHsp70-3 genes in Galeruca daurica (Coleoptera: Chrysomelidae). Acta Agrestia Sin. 2023, 31, 61–72. (In Chinese) [Google Scholar]
  33. Gurusamy, D.; Mogilicherla, K.; Palli, S.R. Chitosan nanoparticles help double-stranded RNA escape from endosomes and improve RNA interference in the fall armyworm, Spodoptera frugiperda. Arch. Insect Biochem. Physiol. 2020, 104, e21677. [Google Scholar] [CrossRef] [PubMed]
  34. You, L.; Zhang, F.; Huang, S.; Merchant, A.; Zhou, X.; Li, Z. Over-expression of RNA interference (RNAi) core machinery improves susceptibility to RNAi in silkworm larvae. Insect Mol. Biol. 2020, 29, 353–362. [Google Scholar] [CrossRef] [PubMed]
  35. Shi, C.H.; Hu, J.R.; Li, C.R.; Zhang, Y.J. Research progress in the cold tolerance mechanism of insects under environmental stress. Plant Prot. 2016, 42, 21–28. [Google Scholar]
  36. Hunter, S.; Apweiler, R.; Attwood, T.K.; Bairoch, A.; Bateman, A. InterPro: The integrative protein signature database. Nucleic Acids Res. 2009, 37, D211–D215. [Google Scholar] [CrossRef] [PubMed]
  37. Aparicio, G.; Gotz, S.; Conesa, A.; Segrelles, D.; Blanquer, I.; García, J.M.; Hernandez, V.; Robles, M.; Talon, M. Blast2GO goes. grid: Developing a grid-enabled prototype for functional genomics analysis. Stud. Health Technol. Inform. 2006, 120, 194–204. [Google Scholar] [PubMed]
  38. Deng, Y.Y.; Li, J.Q.; Wu, S.F.; Zhu, Y.P.; Chen, Y.W.; He, F.C. Integrated nr database in protein annotation system and its localization. Comput. Eng. 2006, 32, 71–74. [Google Scholar]
  39. Apweiler, R.; Bairoch, A.; Wu, C.H.; Barker, W.C.; Boeckmann, B.; Ferro, S.; Gasteiger, E.; Huang, H.; Lopez, R.; Magrane, M.; et al. UniProt: The universal protein knowledge base. Nucleic Acids Res. 2004, 32, D115–D119. [Google Scholar] [CrossRef]
  40. Tatusov, R.L.; Galperin, M.Y.; Natale, D.A.; Koonin, E.V. The COG database: A tool for genome-scale analysis of protein functions and evolution. Nucleic Acids Res. 2000, 28, 33–36. [Google Scholar] [CrossRef]
  41. Kanehisa, M.; Goto, S.; Kawashima, S.; Okuno, Y.; Hattori, M. The KEGG resource for deciphering the genome. Nucleic Acids Res. 2004, 32, D277–D280. [Google Scholar] [CrossRef] [PubMed]
  42. Meng, X.; Dong, F.; Qian, K.; Miao, L.; Yang, X.; Ge, H.; Wu, Z.; Wang, J. Transcriptome analysis reveals global gene expression changes of Chilo suppressalis in response to sublethal dose of chlorantraniliprole. Chemosphere 2019, 234, 648–657. [Google Scholar] [CrossRef] [PubMed]
  43. Benjamini, Y.; Yekutieli, D. The control of the false discovery rate in multiple testing under dependency. Ann. Stat. 2001, 29, 1165–1188. [Google Scholar] [CrossRef]
  44. Xue, B.; Li, F.; Hu, J.; Tian, J.; Li, J.; Cheng, X.; Hu, J.; Li, B. Differentially expressed genes in the silk gland of silkworm (Bombyx mori) treated with TiO2 NPs. Gene 2017, 611, 21–26. [Google Scholar] [CrossRef] [PubMed]
  45. Kanehisa, M.; Araki, M.; Goto, S.; Hattori, M.; Hirakawa, M.; Itoh, M.; Katayama, T.; Kawashima, S.; Okuda, S.; Tokimatsu, T.; et al. KEGG for linking genomes to life and the environment. Nucleic Acids Res. 2008, 36, 480–484. [Google Scholar] [CrossRef] [PubMed]
  46. Mao, X.; Cai, T.; Olyarchuk, J.G.; Wei, L. Automated genome annotation and pathway identification. using the KEGG orthology (KO) as a controlled vocabulary. Bioinformatics 2005, 21, 3787–3793. [Google Scholar] [CrossRef]
  47. Zhu, W.; Zhang, H.; Li, X.; Meng, Q.; Shu, R.; Wang, M.; Zhou, G.; Wang, H.; Miao, L.; Zhang, J.; et al. Cold adaptation mechanisms in the ghost moth Hepialus xiaojinensis: Metabolic regulation and thermal compensation. J. Insect Physiol. 2016, 85, 76–85. [Google Scholar] [CrossRef]
  48. Zhu, W.; Zhang, H.; Meng, Q.; Wang, M.; Zhou, G.; Li, X.; Wang, H.; Miao, L.; Qin, Q.; Zhang, J. Metabolic insights into the cold survival strategy and overwintering of the common cutworm, Spodoptera litura (Fabricius) (Lepidoptera: Noctuidae). J. Insect Physiol. 2017, 100, 53–64. [Google Scholar] [CrossRef]
  49. Chen, J.; Wu, Y.C.; Chen, J.K.; Zhu, X.J.; Merkler, D.; Liao, C.H.; Han, Q. Elongases of Long-Chain Fatty Acids ELO2 and ELO9 Are Involved in Cuticle Formation and Function in Fecundity in the Yellow Fever Mosquito, Aedes aegypti. Insects 2023, 14, 189. [Google Scholar] [CrossRef]
  50. Duell, M.E.; Gray, M.T.; Roe, A.D.; MacQuarrie, C.J.K.; Sinclair, B.J. Plasticity drives extreme cold tolerance of emerald ash borer (Agrilus planipennis) during a polar vortex. Curr. Res. Insect Sci. 2022, 3, 100031. [Google Scholar] [CrossRef]
  51. Muluvhahothe, M.M.; Joubert, E.; Foord, S.H. Thermal tolerance responses of the two-spotted. stink bug, Bathycoelia distincta (Hemiptera: Pentatomidae), vary with life stage and the sex of adults. J. Therm. Biol. 2023, 111, 103395. [Google Scholar] [CrossRef] [PubMed]
  52. Kuo, Y.; Lu, Y.H.; Lin, Y.H.; Lin, Y.C.; Wu, Y.L. Elevated temperature affects energy. metabolism and behavior of bumblebees. Insect Biochem. Mol. Biol. 2023, 155, 103932. [Google Scholar] [CrossRef] [PubMed]
  53. Lebenzon, J.E.; Overgaard, J.; Jørgensen, L.B. Chilled, starved or frozen: Insect mitochondrial. adaptations to overcome the cold. Curr. Opin. Insect Sci. 2023, 58, 101076. [Google Scholar] [CrossRef] [PubMed]
  54. Wang, N.; Ji, A.; Masoudi, A.; Li, S.; Hu, Y.; Zhang, Y.; Yu, Z.; Wang, H.; Wang, H.; Liu, J. Protein regulation mechanism of cold tolerance in Haemaphysalis longicornis. Insect Sci. 2023, 30, 725–740. [Google Scholar] [CrossRef]
  55. Mikucki, E.E.; Lockwood, B.L. Local thermal environment and warming influence. supercooling and drive widespread shifts in the metabolome of diapausing Pieris rapae butterflies. J. Exp. Biol. 2021, 224, jeb243118. [Google Scholar] [CrossRef] [PubMed]
  56. Kojić, D.; Popović, Ž.D.; Orčić, D.; Purać, J.; Orčić, S.; Vukašinović, E.L.; Nikolić, T.V.; Blagojević, D.P. The influence of low temperature and diapause phase on sugar and polyol content in the European corn borer Ostrinia nubilalis (Hbn.). J. Insect Physiol. 2018, 109, 107–113. [Google Scholar] [CrossRef] [PubMed]
  57. Enriquez, T.; Teets, N.M. Lipid Metabolism in Response to Cold. 2023. Available online: https://ecoevorxiv.org/repository/view/5092/ (accessed on 13 April 2023).
  58. Li, Y.J.; Ma, C.S.; Yan, Y.; Renault, D.; Colinet, H. The interspecific variations in molecular responses to various doses of heat and cold stress: The case of cereal aphids. J. Insect Physiol. 2023, 147, 104520. [Google Scholar] [CrossRef]
  59. Tonione, M.A.; Bi, K.; Tsutsui, N.D. Transcriptomic signatures of cold adaptation and heat. stress in the winter ant (Prenolepis imparis). PLoS ONE 2020, 15, e0239558. [Google Scholar] [CrossRef]
  60. Liu, X.; Fu, Z.X.; Kang, Z.W.; Li, H.; Liu, T.X.; Wang, D. Identification and characterization of antioxidant enzyme genes in parasitoid Aphelinus asychis (Hymenoptera: Aphelinidae) and expression profiling analysis under temperature stress. Insects 2022, 13, 447. [Google Scholar] [CrossRef]
  61. Yuan, J.W.; Song, H.X.; Chang, Y.W.; Yang, F.; Xie, H.F.; Gong, W.R.; Du, Y.Z. Identification, expression analysis and functional verification of two genes encoding small heat shock proteins in the western flower thrips, Frankliniella occidentalis (Pergande). Int. J. Biol. Macromol. 2022, 211, 74–84. [Google Scholar] [CrossRef]
  62. Ashraf, H.; Qamar, A. A review on heat stress altering the insect life history strategies and underlying mechanisms: Special reference to an economically important Lepidoptera, Bombyx mori (Linnaeus, 1758) (Lepidoptera: Bombycidae). Shilap-Rev. Lepidopt. 2023, 51, 339–357. [Google Scholar] [CrossRef]
  63. Yang, C.L.; Meng, J.Y.; Zhou, L.; Yao, M.S.; Zhang, C.Y. Identification of five small heat. Shock protein genes in Spodoptera frugiperda and expression analysis in response to different environmental stressors. Cell Stress Chaperones 2021, 26, 527–539. [Google Scholar] [CrossRef] [PubMed]
  64. Zhang, J.; Miano, F.N.; Jiang, T.; Peng, Y.; Zhang, W.; Xiao, H. Characterization of Three Heat Shock Protein Genes in Pieris melete and Their Expression Patterns in Response to Temperature Stress and Pupal Diapause. Insects 2022, 13, 430. [Google Scholar] [CrossRef] [PubMed]
  65. Ruan, H.Y.; Meng, J.Y.; Yang, C.L.; Zhou, L.; Zhang, C.Y. Identification of six small heat shock protein genes in Ostrinia furnacalis (Lepidoptera: Pyralidae) and analysis of their expression patterns in response to environmental stressors. J. Insect Sci. 2022, 22, 7. [Google Scholar] [CrossRef] [PubMed]
  66. Jin, J.; Liu, Y.; Liang, X.; Pei, Y.; Wan, F.; Guo, J. Regulatory mechanism of transcription. factor AhHsf modulates AhHsp70 transcriptional expression enhancing heat tolerance in Agasicles hygrophila (Coleoptera: Chrysomelidae). Int. J. Mol. Sci. 2022, 23, 3210. [Google Scholar] [CrossRef] [PubMed]
  67. Yi, J.; Wu, H.; Liu, J.; Lai, X.; Guo, J.; Li, D.; Zhang, G. Molecular characterization and expression of six heat shock protein genes in relation to development and temperature in Trichogramma chilonis. PLoS ONE 2018, 13, e0203904. [Google Scholar] [CrossRef] [PubMed]
  68. Seddigh, S. Proteomics analysis of two heat shock proteins in insects. J. Biomol. Struct. Dyn. 2019, 37, 2652–2668. [Google Scholar] [CrossRef] [PubMed]
  69. Li, M.; Li, X.J.; Lü, J.H.; Huo, M.F. The effect of acclimation on heat tolerance of Lasioderma serricorne (Fabricius) (Coleoptera: Anobiidae). J. Therm. Biol. 2018, 71, 153–157. [Google Scholar] [CrossRef]
  70. Liu, J.; Liu, Y.; Li, Q.; Lu, Y. Heat shock protein 70 and Cathepsin B genes are involved in the thermal tolerance of Aphis gossypii. Pest. Manag. Sci. 2023, 79, 2075–2086. [Google Scholar] [CrossRef]
  71. Chen, K.; Tang, T.; Song, Q.; Wang, Z.; He, K.; Liu, X.; Song, J.; Wang, L.; Yang, Y.; Feng, C. Transcription Analysis of the Stress and Immune Response Genes to Temperature Stress in Ostrinia furnacalis. Front. Physiol. 2019, 10, 1289. [Google Scholar] [CrossRef]
Figure 1. Heatmap of metabolism pathway in G. daurica larvae at different developmental periods indoors and outdoors. (A) Fatty acid biosynthesis pathway; (B) glycolysis/gluconeogenesis pathway; (C) heat shock protein pathway.
Genes 14 02177 g001
Figure 2. Volcano plot of DEGs between groups. (A) GdIn1 vs. GdOut1; (B) GdIn2 vs. GdOut2; (C) Venn diagram of shared DEGs between two comparing groups. Note: The horizontal ordinate represents the fold change of gene expression, and the vertical ordinate represents the statistical significance of the change. Each point represents a gene: the yellow points and red points represent differentially up-regulated and down-regulated genes, respectively, and the blue points represent a gene that does not show differential expression.
Genes 14 02177 g002
Figure 3. GO functional annotation of DEGs in larvae of G. daurica in different environmental conditions. DEGs of GO enrichment of the G. daurica transcriptome in groups. Note: tbhe Y-axis correlates to various gene functions, and the X-axis depicts the number of DEGs.
Genes 14 02177 g003
Figure 4. KOG annotation of DEGs in G. daurica larvae.
Genes 14 02177 g004
Figure 5. The qRT-PCR analysis of eight DEGs based on RNA-Seq analysis. (A) The DEGs in GdIn1 vs. GdOut1; (B) the DEGs in GdIn2 vs. GdOut12.
Genes 14 02177 g005
Figure 6. Relative expression levels of Hsp70A1, Hsp70-2 and Hsp70-3 in second-instar larvae of G. daurica after microinjection of dsRNAs. (A) Injection of dsGFP; (B) injection of dsHsp70A1; (C) injection of dsHsp70-2; (D) injection of dsHsp70-3; (E) injection of dsHsp70A1 and dsHsp70-2; (F) injection of dsHspA1 and dsHsp-3; (G) injection of dsHsp70-2 and dsHsp70-3; (H) injection of dsHsp70A1, dsHsp70-2 and dsHsp70-3. Note: Data in the figure are mean ± SE (n = 25). Letters above bars indicate significant differences among different treatments (p < 0.01) via ANOVA, LSD.
Genes 14 02177 g006aGenes 14 02177 g006b
Figure 7. (A) The super-cooling point (SCP) and (B) freezing point (FP) of second-instar larvae of G. daurica after 24 h of RNAi of GdHsp70A1, GdHsp70-2 and GdHsp70-3. Note: Data in the figure are mean ± SE (n = 20). Letters above bars indicate significant differences among different treatments (p < 0.01) via ANOVA, LSD.
Genes 14 02177 g007
Table 1. List of primers used in this study.
Gene IDGene NamePrimer SequencesProduct SizePurpose
NM_010477.4Hspd1F: CGCTCTGCTTCGGTGCAT275q-PCR
R: CAGCAGCATCCAGTAAGGCA
KY460464.1Hsp10F: GGCAACTACGAAAACGAAAGG126
R: CCGCATTGTCTTCGAGGTTT
KY460462.1Hsp70A1F: ACACTGGCCGTTTAAGGTGG276
R: GCTGCTGCTGTTGGTTCATT
MZ853083.1Hsp70-2F: GGAACCATTGCTGGTCTTGT214
R: CGAAATCTTCACCTCCCAAA
KO585088Hsp70-3TTCAACACTGGCCATTCAAA 218
TTTTGTAGCTTGTCTCTGTG
NM_001109900.1Akr1c15F: GGAAGTAGATGCAGGTCGAGT259
R: AACACCTGGCAGCTTGTGAT
AY776138.1PepckF: CGGTTTCTTCGGTGTTGCTC243
R: TCCGCAGGAGTGCAAAATCT
ON054187.1Scd1F: ATGCTGATCCTCACAACGCT212
R: TAAATACATTGGGGCGGCGA
KU240575.1SDHAF: GGGAGACCACAATCTCCTCA192
R: AGCTGGTGCTCCTAAGTCCA
dsHsp70-1F: taatacgactcactatagggGGTTCGACTCGTATTCCCAA435RNAi
R: taatacgactcactatagggCCTTGGTCATTGGACGTTCT
dsHsp70-2F: taatacgactcactatagggGGTTCGACTCGTATTCCCAA334
R: taatacgactcactatagggCCTTGGTCATTGGACGTTCT
dsHsp70-3F: taatacgactcactatagggAAGGAAGAGGATGAACGCCAGA323
R: taatacgactcactatagggAATCCACCTGCTTGTTGACC
dsGFPF: taatacgactcactatagggGGAGAAGAACTTTTCACTGG560
R: taatacgactcactatagggAGTTGAACGGATCCATCTTC
Note: lowercase letters stand for T7 promoter sequence.
Disclaimer/Publisher’s Note: The statements, opinions and data contained in all publications are solely those of the individual author(s) and contributor(s) and not of MDPI and/or the editor(s). MDPI and/or the editor(s) disclaim responsibility for any injury to people or property resulting from any ideas, methods, instructions or products referred to in the content.

