Article

Epigenetic Profiling of Type 2 Diabetes Mellitus: An Epigenome-Wide Association Study of DNA Methylation in the Korean Genome and Epidemiology Study

Korea Food Research Institute, Wanju-gun 55365, Jeollabuk-do, Republic of Korea
*
Author to whom correspondence should be addressed.
Genes 2023, 14(12), 2207; https://doi.org/10.3390/genes14122207
Submission received: 31 October 2023 / Revised: 8 December 2023 / Accepted: 12 December 2023 / Published: 13 December 2023
(This article belongs to the Section Epigenomics)

Abstract

:
Diabetes is characterized by persistently high blood glucose levels and severe complications and affects millions of people worldwide. In this study, we explored the epigenetic landscape of diabetes using data from the Korean Genome and Epidemiology Study (KoGES), specifically the Ansung–Ansan (AS–AS) cohort. Using epigenome-wide association studies, we investigated DNA methylation patterns in patients with type 2 diabetes mellitus (T2DM) and those with normal glucose regulation. Differential methylation analysis revealed 106 differentially methylated probes (DMPs), with the 10 top DMPs prominently associated with TXNIP, PDK4, NBPF20, ARRDC4, UFM1, PFKFB2, C7orf50, and ABCG1, indicating significant changes in methylation. Correlation analysis highlighted the association between the leading DMPs (e.g., cg19693031 and cg26974062 for TXNIP and cg26823705 for NBPF20) and key glycemic markers (fasting plasma glucose and hemoglobin A1c), confirming their relevance in T2DM. Moreover, we identified 62 significantly differentially methylated regions (DMRs) spanning 61 genes. A DMR associated with PDE1C showed hypermethylation, whereas DMRs associated with DIP2C, FLJ90757, PRSS50, and TDRD9 showed hypomethylation. PDE1C and TDRD9 showed a strong positive correlation between the CpG sites included in each DMR, which have previously been implicated in T2DM-related processes. This study contributes to the understanding of epigenetic modifications in T2DM. These valuable insights can be utilized in identifying potential biomarkers and therapeutic targets for effective management and prevention of diabetes.

1. Introduction

Diabetes is a chronic disease that affects the ability of the body to produce or utilize insulin, which is necessary for regulating blood sugar levels. Over time, high blood sugar levels can lead to serious, life-threatening complications that can affect different body parts, including the eyes, kidneys, nerves, and cardiovascular system [1]. The International Diabetes Federation has reported that approximately 537 million adults aged between 20–79 years were affected by diabetes in 2021, accounting for approximately 9.3% of the total global population. The prevalence of diabetes is increasing at a significant pace, and the number of people with diabetes will reach 700 million by 2045 [2].
An epigenome-wide association study (EWAS) is a study that aims to identify epigenetic changes associated with a particular trait or disease. Epigenetic changes refer to the modifications of DNA and associated proteins that do not involve changes in the underlying genetic code [3]. EWAS has several applications, including identification of epigenetic changes associated with complex diseases and environmental exposure, discovery of epigenetic biomarkers, identification of potential therapeutic targets, and understanding the mechanisms underlying complex diseases. A genome-wide association study (GWAS), which is a study that tests the associations of a plethora of single nucleotide polymorphisms (SNPs) that encompass the entire genome with a specific trait [4], has been applied to identify genetic risk factors for T2DM, and, to date, more than 120 genetic variants have been found to be associated with T2DM risk [5]. However, epigenomic profiling studies have been less performed for T2DM in humans.
An EWAS strives to identify epigenomic variants associated with a phenotype of interest, which provides complementary information to a GWAS. So far, most EWASs have applied DNA methylation microarrays such as the Illumina Infinium HumanMethylation BeadChip arrays. Although genomic variations are static, epigenomic variations tend to be dynamic, and interindividual epigenetic variabilities could play a critical role in disease pathogenesis. Rather than studying rare changes in the epigenome, currently, an EWAS mainly studies common DNA methylation variations in the population, which could be a powerful approach in unraveling risk-associated epigenetic biomarkers [6]. Several EWASs have identified epigenetic changes associated with both type 1 and type 2 diabetes mellitus and complications such as diabetic nephropathy and retinopathy. Furthermore, the potential of EWAS has been leveraged to investigate the impact of environmental factors on the risk of having diabetes and explore potential targets of intervention for preventing and treating diabetes [7,8].
EWASs have been used in several cohorts to identify epigenetic changes associated with diabetes. For instance, an EWAS conducted in the EPIC-Norfolk Study has identified changes in DNA methylation associated with T2DM, which were linked to the expression of genes involved in insulin signaling and glucose metabolism [9]. In addition, a meta-analysis of four European cohorts has identified 227 differentially methylated positions associated with T2DM, many of which were located in genes involved in glucose metabolism and insulin signaling pathways [10].
The Korean Genome and Epidemiology Study (KoGES) is a large-scale and population-based investigation aimed at exploring the genetic and environmental factors underlying common diseases in the Korean population. KoGES has generated an extensive dataset on DNA methylation from the Ansung–Ansan (AS–AS) cohort, which is valuable for exploring the impact of epigenetic modifications on various health outcomes [11]. Ko et al. (2022) examined the correlation between fatty liver index (FLI) and DNA methylation patterns in the Korean population using the Illumina Infinium HumanMethylation 450k (HM450k) data and observed that FLI is linked to alterations in DNA methylation of genes involved in lipid metabolism, inflammation, and insulin resistance [12]. Kim et al. (2023) have demonstrated an association between DNA methylation patterns across approximately 400,000 CpG sites and development of chronic kidney disease in KoGES [13]. Although the AS–AS cohort within KoGES encompasses the Illumina Infinium HumanMethylation 850k (HM850k) data for more than 1000 participants, HM450k has been commonly utilized for EWAS in this cohort.
In this study, we examined the distinct methylation patterns between participants with T2DM and those with normal glucose regulation using the extensive HM850k dataset from the AS–AS cohort to identify DMPs and assessed their correlation with key blood markers of diabetes, including fasting plasma glucose (FPG) and hemoglobin A1c (HbA1c). Additionally, we identified DMRs in individuals with T2DM compared to those in individuals with normal glucose regulation and conducted further analyses to explore co-methylation patterns.

2. Materials and Methods

2.1. Participants and Data Source
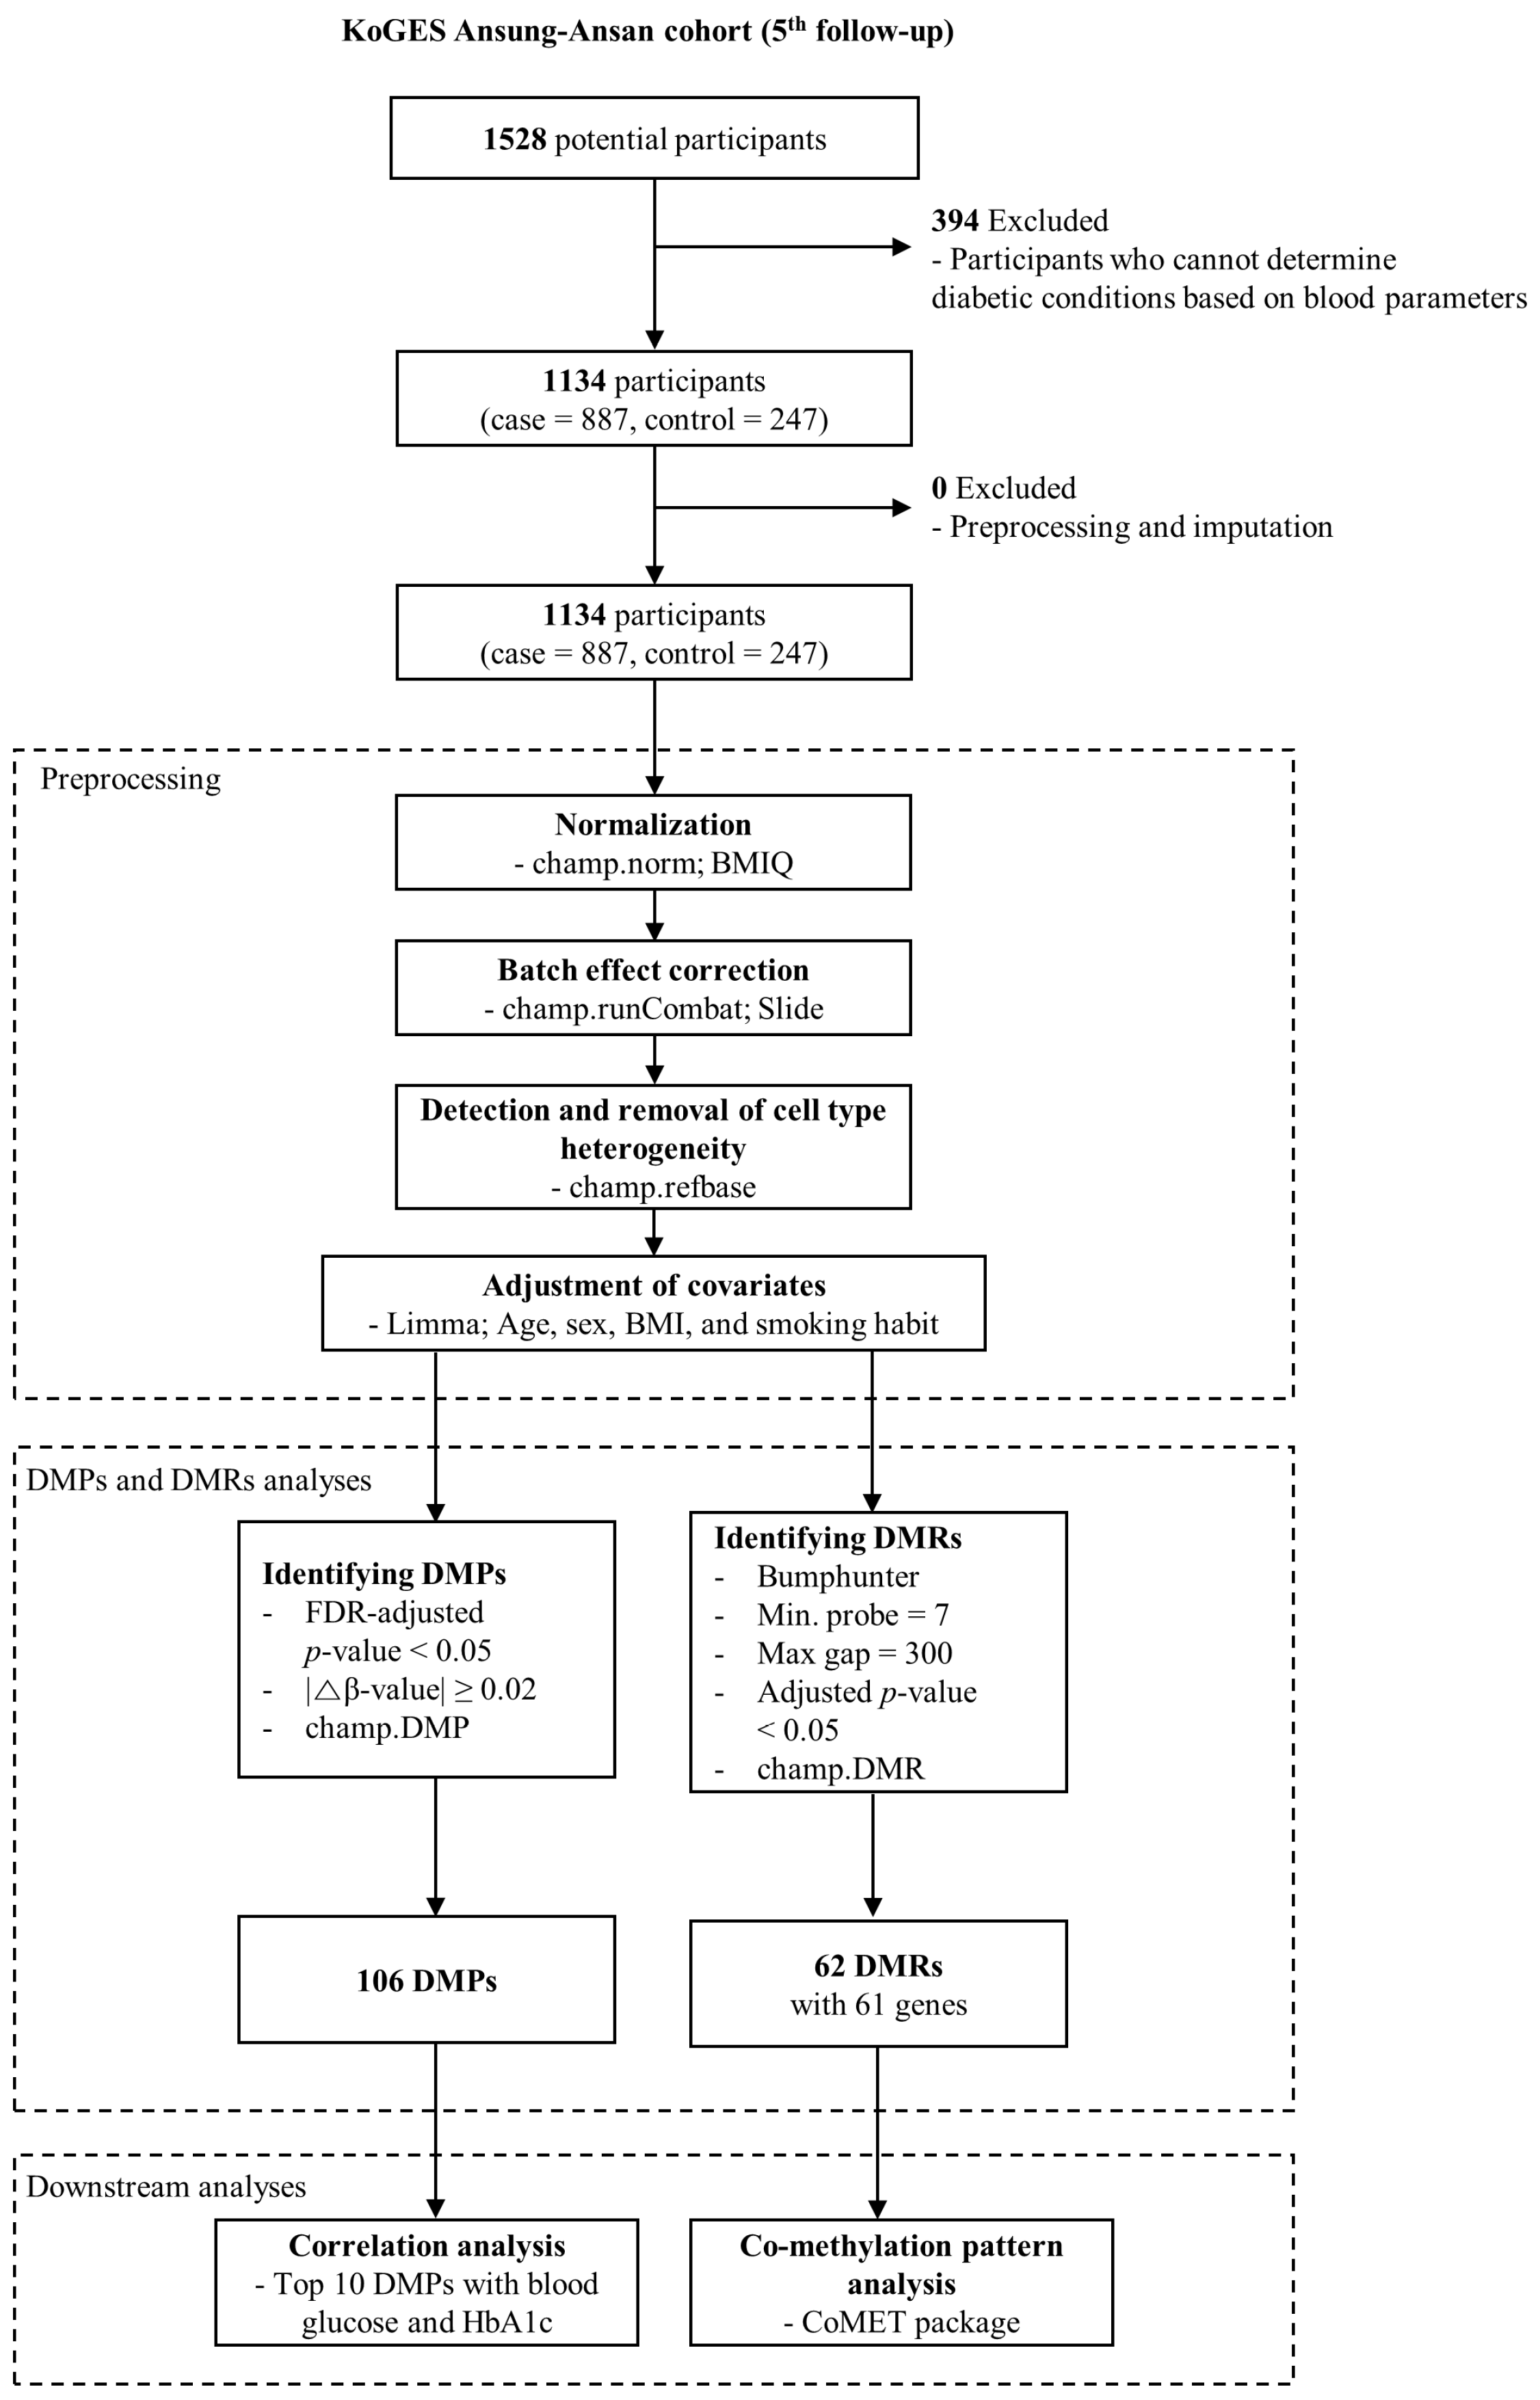
Clinical, epidemiological, and DNA methylation array datasets were obtained from the AS–AS cohort of the KoGES, facilitated by the Korea Center for Disease Control and Prevention [11]. Participants’ ages ranged between 40 and 69 years. For this study, data from the HM850k array were utilized, specifically from the 5th follow-up cohort, which encompassed 1528 samples with 865,918 CpG probes. This study was ethically approved by the Institutional Review Board (IRB) of the Korea Food Research Institute (Approval No.: 2022-01-002-001).

2.2. Study Design

The study design is depicted in Figure 1. T2DM cases were identified based on abnormal levels of FPG and HbA1c and plasma glucose level after 2 h (2 h PG) levels. Specifically, abnormalities were defined as FPG level ≥ 126 mg/dL, HbA1c level ≥ 6.5%, or 2 h PG ≥ 200 mg/dL. For an individual to be classified as having T2DM, two or more of these conditions needed to be simultaneously fulfilled [1]. Individuals with undetermined T2DM or normal status were excluded from the analysis. After processing the data of DNA methylation for normalization, correction for technical batch effects, adjustment for covariates (age, sex, body mass index (BMI), and smoking habit), and corrections of cell type heterogeneity, DMPs, and DMRs were identified. We selected the 10 top DMPs and subjected them to correlation analyses with FPG and HbA1c levels (p < 0.05; Spearman correlation). Additionally, we focused on DMRs that exhibited significant CpG probes numbering over three and performed an in-depth analysis of their co-methylation patterns using the “CoMET” package v.1.34.0 in Bioconductor [14].

2.3. Data Preprocessing and Adjustment of Confounding Effects

The HM850k data for a cohort of 1134 participants (887 with T2DM and 247 classified as normal) were imported using champ.load function of the “ChAMP” Bioconductor package v.2.26.0 [15]. Following this, a filtration process (Supplementary Figure S1) resulted in the selection of 723,301 CpG probes from an initial pool of 865,918 probes. Discrepancies between the two types of probes, probe I and probe II, were addressed through the BMIQ method [16], using the champ.norm function. To counteract batch effects stemming from different slides, the champ.SVD function was used for detection of Principal Components, the components correlated with the covariates, followed by correction using champ.runcombat function, both integral to the ChAMP package (Supplementary Figure S2). Additionally, confounding factors, specifically age, sex, BMI, and smoking habit were accounted for by adjustments using the limma Bioconductor package [17]. The Q-Q plot, assessing the model fit, is presented in Supplementary Figure S3.

2.4. Identification of DMPs

The DMPs distinguishing individuals with T2DM from normal individuals were identified using champ.dmp function within the ChAMP Bioconductor package. To qualify as DMPs, the CpG probes had to satisfy two criteria: a false discovery rate (FDR) also called a multiplicity-adjusted p-value < 0.05 and an absolute β-value ≥ 0.02. The DMPs meeting these criteria were graphically represented using a volcano plot employing EnhancedVolcano Bioconductor package for visualization [18].

2.5. Identification of DMRs

The DMRs were identified using champ.dmr function from ChAMP package, and Bumphunter algorithm with maximum gap of 300 bp, minimum seven probes, and an adjusted p-value < 0.05 was used for identifying DMRs.

2.6. Statistical Analyses

Statistical analyses were performed using R v.4.2.1. Student’s t-test was employed to determine the significant differences in means of β-values between two groups (p < 0.05). Furthermore, the correlation coefficient (R) between β-values of the identified DMPs and blood parameters, such as FPG or HbA1c, was calculated using Spearman’s correlation analysis (p < 0.05).

3. Results

3.1. Clinical Characteristics of the Study Participants

In the KoGES cohort study, the participants with normal glycemic status (n = 247) and those with T2DM (n = 887) were compared. Fasting glucose levels were significantly higher in the T2DM group (161.05 mg/dL) than in the normal group (89.26 mg/dL). Similarly, HbA1c levels were elevated in participants with T2DM (7.56%) compared to those in the normal group (5.35%). The 2 h PG levels were higher in participants with T2DM (261.96 mg/dL) than in those in the normal group (105.49 mg/dL). Additionally, individuals with T2DM had a higher mean BMI (25.31 kg/m2) than had the normal individuals (23.64 kg/m2). The normal group comprised 50.20% males, whereas the T2DM group comprised 57.50% males. The mean age of participants in the normal group was 57.77 years (standard deviation (SD), 8.38), whereas that in the T2DM group was 62.45 years (SD, 8.22). The difference in the mean age between the two groups was statistically significant (p < 0.001). Additionally, the prevalence of smoking was higher in the T2DM group (47.30%) compared to the normal group (37.80%) (Table 1). These findings underscore the significant impact of T2DM on glycemic control and associated metabolic parameters while highlighting age, sex, BMI, and smoking habit as potential confounders within the KoGES cohort.

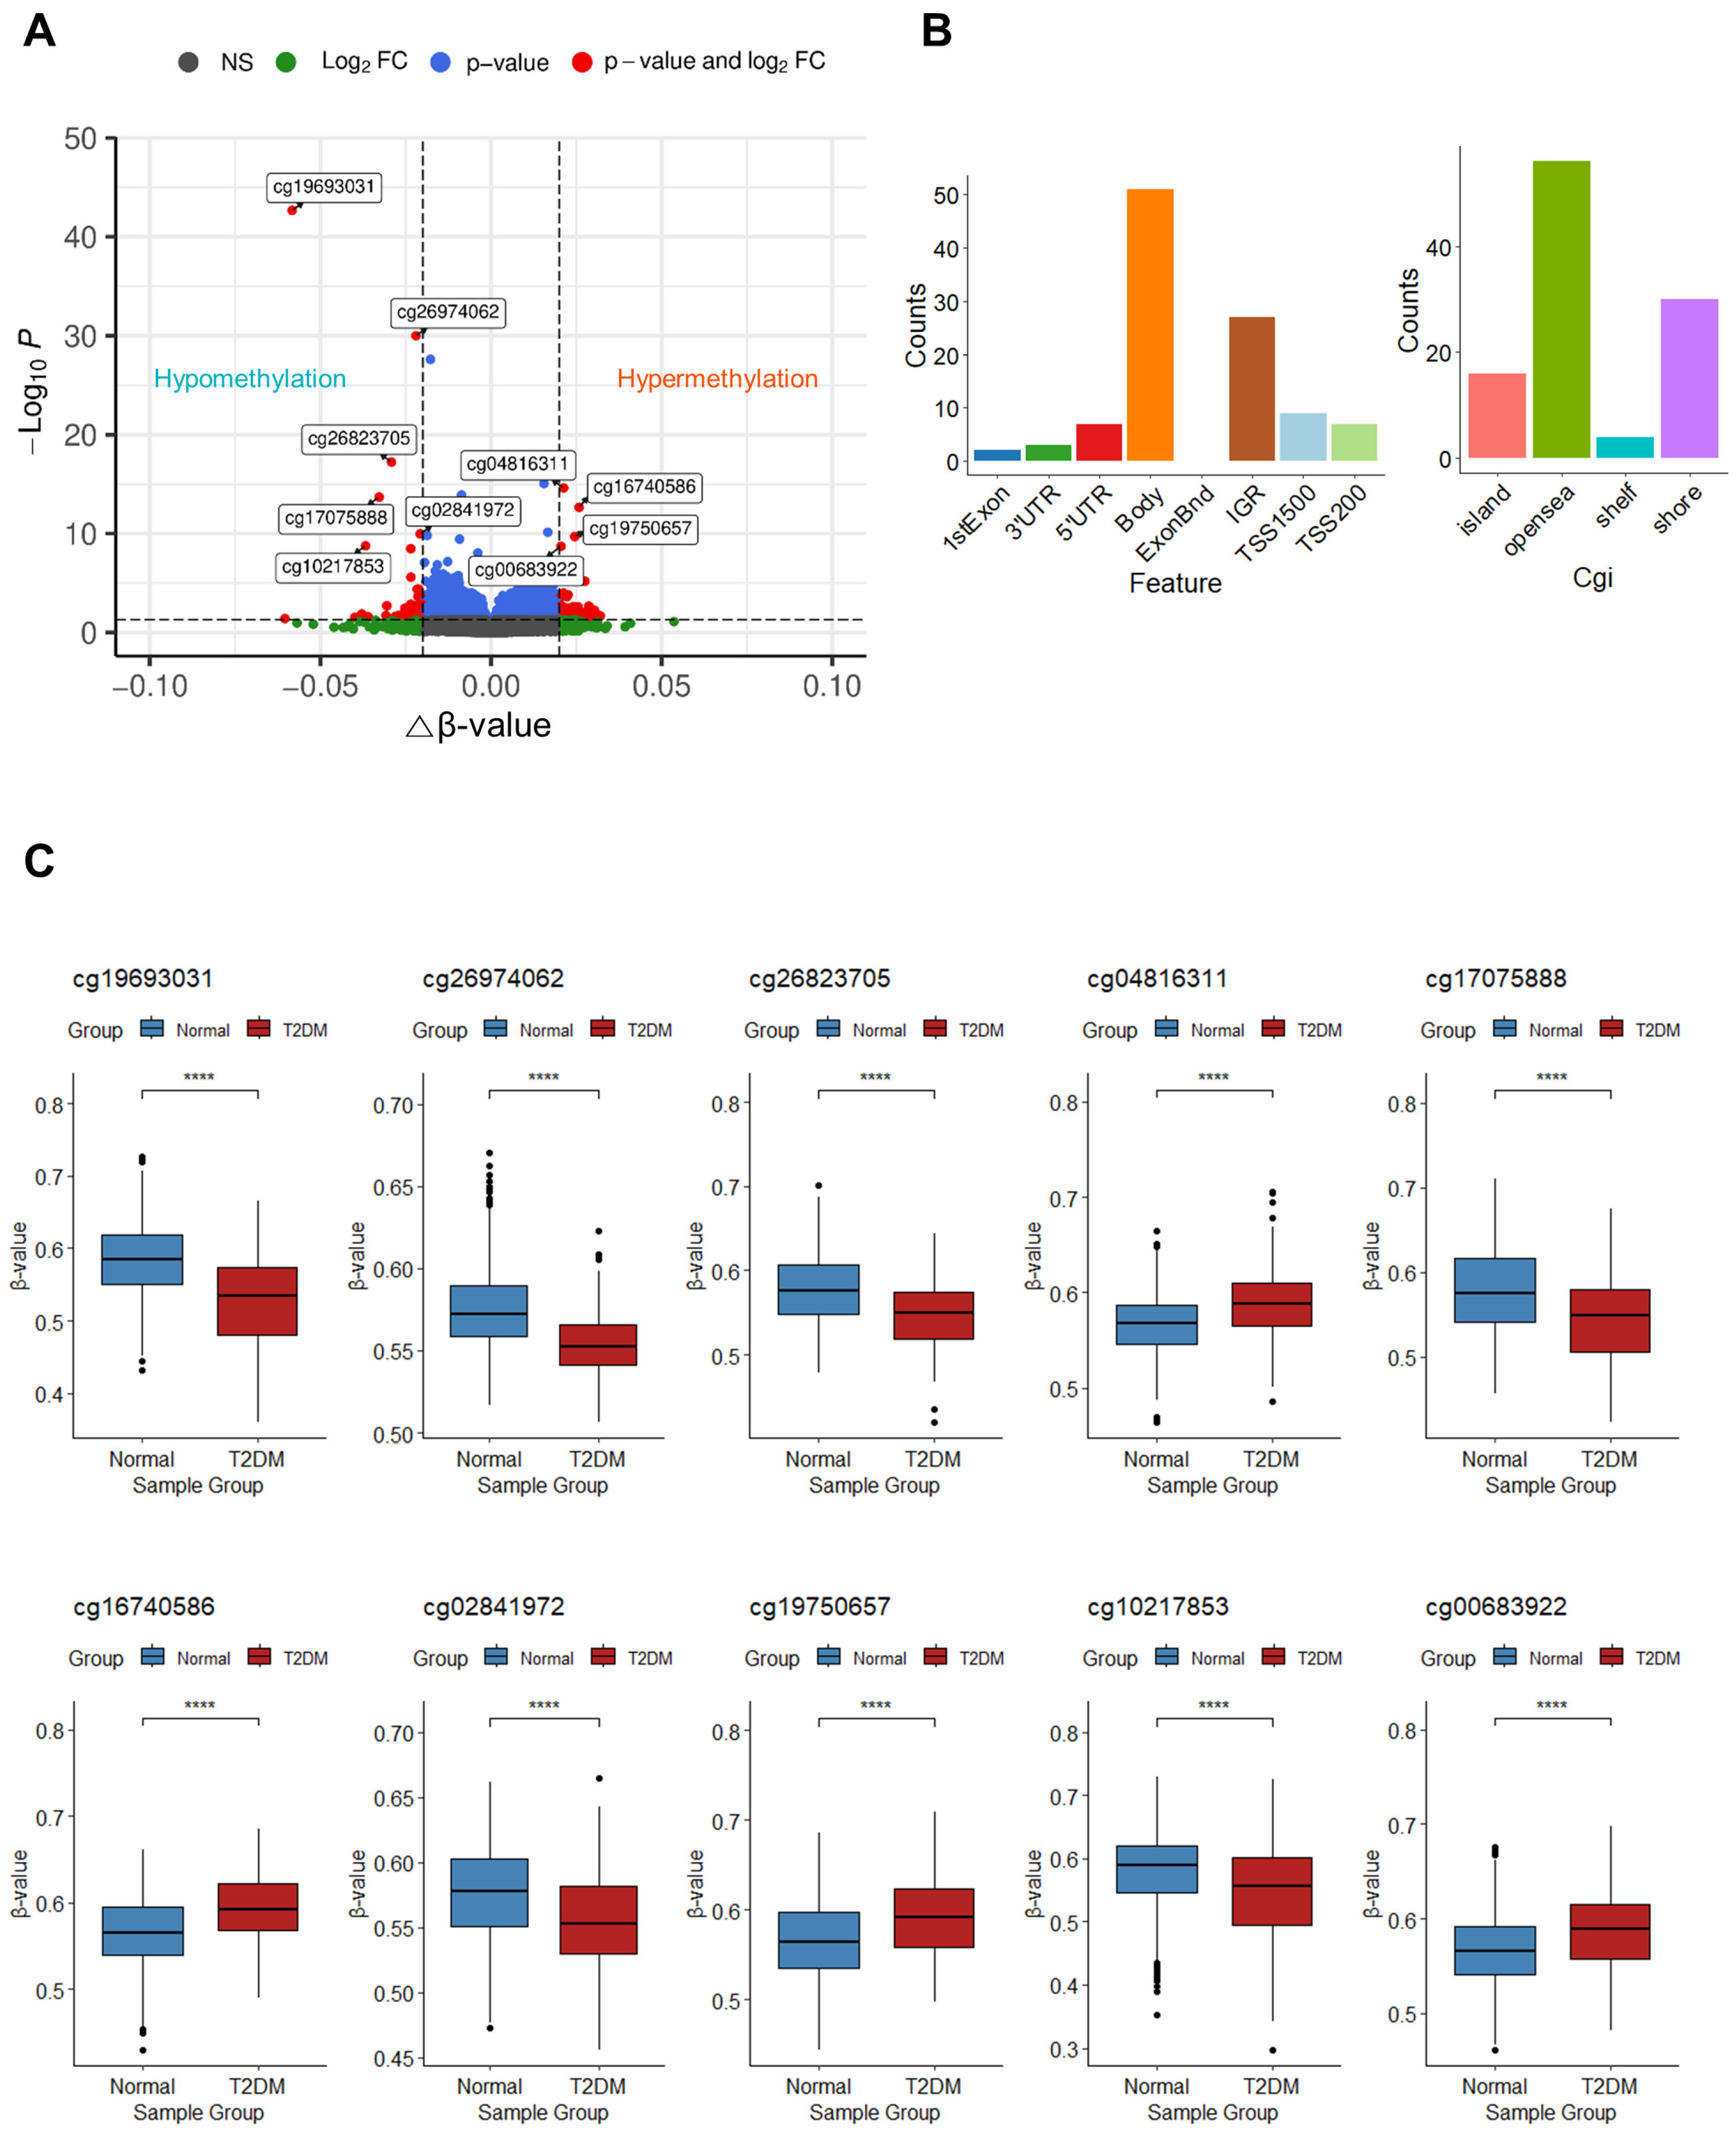
3.2. Identification of DMPs

To identify the features of DNA methylation associated with T2DM, we analyzed DMPs between the T2DM and normal groups. A total of 106 DMPs were detected with an adjusted p-value < 0.05 and an absolute change in β-value ≥ 0.02. Among these, 61 DMPs exhibited hypermethylation, whereas 45 DMPs displayed hypomethylation in patients with T2DM (Figure 2A). Within these 106 DMPs, CpG sites were predominantly enriched in the gene body (51 CpGs; 48.11%), followed by the intergenic region (IGR; 27 CpGs; 25.47%), transcription start site 1500 (TSS1500; 9 CpGs; 8.49%), 5′ untranslated region (5′UTR; 7 CpGs; 6.60%), transcription start site 200 (TSS200; 7 CpGs; 6.60%), 3′ untranslated region (3′UTR; 3 CpGs; 2.83%), and the first exon (2 CpGs; 1.89%) (Figure 2B, left panel). The majority of CpG sites were located in open sea regions (56 CpGs; 52.83%), followed by shore (30 CpGs; 28.30%), island (16 CpGs; 15.09%), and shelf (4 CpGs; 3.77%) (Figure 2B, right panel). The 10 top DMPs are documented in Table 2, with the two highest-ranked DMPs (cg19693031 and cg26974062) found within the 3′UTR or body of TXNIP. These two DMPs exhibited significant hypomethylation in patients with T2DM (p < 0.05). Similarly, cg17075888, cg26823705, and cg10217853 within PDK4, NBPF20, and ARRDC4, respectively, showed significant hypomethylation, whereas cg04816311, cg16740586, cg19750657, and cg00683922 located within C7orf50, ABCG1, UFM1, and PFKFB2 displayed significant hypermethylation in patients with T2DM, respectively. Additionally, substantial hypomethylation of one of the 10 top DMPs, cg02841972, which are found in the intergenic region of chromosome 2, was noticed (p < 0.05) (Figure 2C).

3.3. Correlation between Methylation Levels of Top DMPs and Glycemic Markers (FPG and HbA1c)

To validate the link between the previously identified DMPs and T2DM, a correlation analysis was performed between the methylation levels of the 10 top DMPs and markers associated with T2DM, including FPG and HbA1c. Spearman’s correlation coefficient (R) was calculated for each CpG probe and the diabetic markers. Three DMPs (cg19693031, cg26974062, and cg26823705) exhibited significant negative correlations (Figure 3A). For HbA1c, two DMPs (cg19693031 and cg26974062) demonstrated significant negative correlations (Figure 3B). Notably, the β-values of cg19693031 and cg26974062 were significantly correlated with FPG and HbA1c.

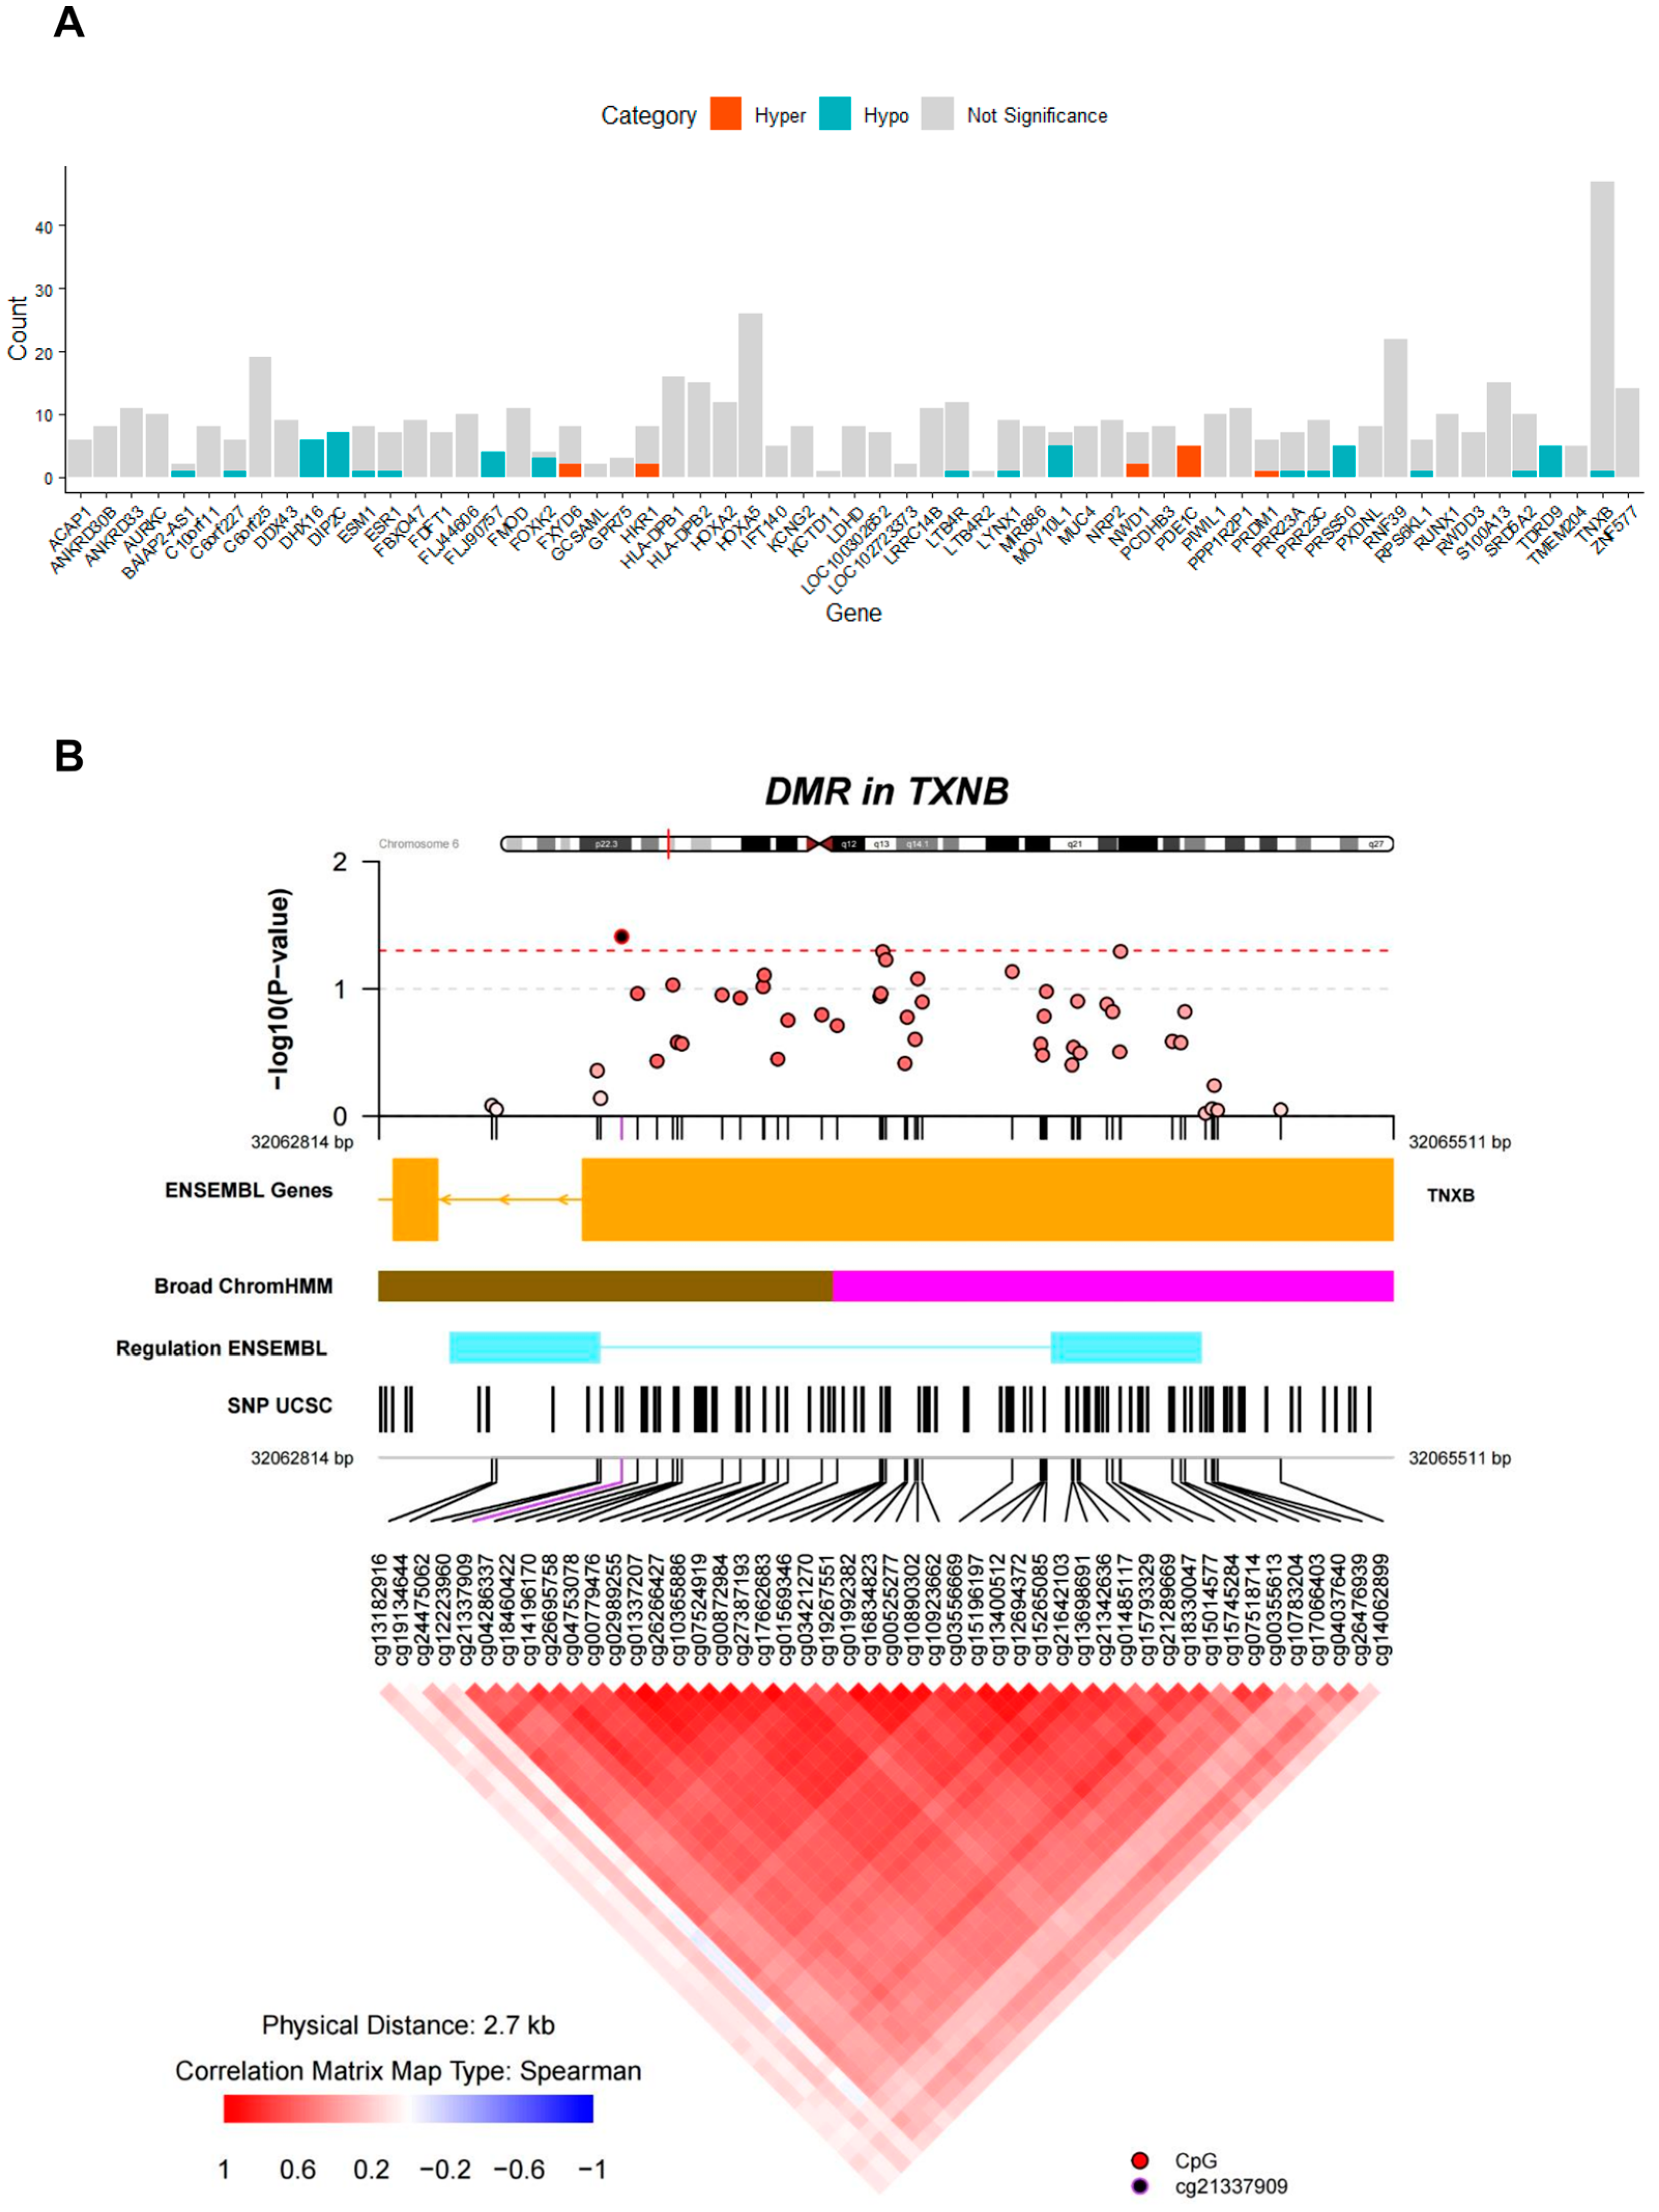
3.4. Identification of DMRs

Subsequently, we identified the genomic regions exhibiting divergent patterns of DNA methylation between the diabetic and normal groups. We identified 62 significant DMRs (p < 0.05). Further enrichment analysis revealed the involvement of 61 genes in this process (Figure 4A). The 10 highest-ranked DMRs are listed in Table 3. Remarkably, DMR_1 situated within TXNB had the highest impact. Additionally, the 10 top DMRs encompassed annotations for genes such as RNF39, MIR886, DIP2C, S100A13, HLA-DPB1, and C6orf25 (Table 3). Upon delving into co-methylation pattern analysis within TXNB, we observed a tendency towards positive correlation in the methylation levels of individual CpG sites within the genomic region containing the CpG island of TXNB. However, 47 out of the 48 CpG sites within the DMR for TXNB was not significant as a differentially methylated probe (adjusted p-value < 0.05) (Figure 4B). For DMRs related to PDE1C, more than 50% CpG sites within each DMR exhibited significant hypermethylation. Conversely, for DIP2C, FLJ90757, PRSS50, and TDRD9, we observed significant hypomethylation (adjusted p-value < 0.05) (Figure 4A). Furthermore, co-methylation pattern analysis of the DMRs for PDE1C and TDRD9 showed a pronounced positive correlation among the CpG sites encompassed within each DMR, respectively (Supplementary Figures S4 and S5, respectively).

4. Discussion

In this study, we performed DNA methylome analysis of approximately 850,000 CpG sites from blood samples of 247 patients with T2DM and 887 normal subjects included in the AS–AS cohort of KoGES and identified potential DNA methylation sites, regions, and genes associated with diabetes in the Korean population. In previous cohort studies, several diabetes- or diabetic marker-related DMPs have been reported using EWAS. In particular, the cg19693031 region located in the 3′UTR of TXNIP has been reported to be highly associated with diabetic markers [19,20,21]. Thioredoxin-interacting protein (TXNIP), encoded by TXNIP, plays a crucial role in cellular processes, including redox regulation, metabolism, and cell growth. TXNIP is associated with diabetes mellitus, specifically T2DM, and regulates diabetes-related cellular functions such as glucose homeostasis, insulin resistance, and pancreatic β cell function [22]. Intervention with TXNIP represents a new strategy for treating diabetes mellitus [23,24]. Our DMP analysis identified cg19693031 as the most significant DMP associated with diabetes, and cg26964062, located within TXNIP, was sequentially identified as an important CpG site. Collectively, hypomethylation of the two CpG sites in TXNIP identified through EWAS analysis suggests that it may play an important role in the pathogenesis of diabetes mellitus in the Korean population.
CpG sites located within PDK4, ABCG1, NBPF20, UFM1, PFKFB2, and ARRDC4 were identified within the 10 top DMPs. Pyruvate dehydrogenase kinase 4, encoded by PDK4, plays an important role in glucose metabolism and oxidation of fatty acids, and its upregulation is a factor in developing diabetes [25,26]. Consistent with the results of our DMP analysis, the cg17075888 CpG site of PDK4 has been found to be significantly hypomethylated in patients with T2DM (n = 1534) [27]. ABCG1 is also related to insulin resistance [28], and the association of a related CpG site cg06500161 identified by DMP analysis with diabetic markers has been reported [29]. The relationship between cg16740586 (located within ABCG1) and diabetes has not yet been reported; however, this is a novel DMP associated with obesity [30]. A direct relationship between NBPF Member 20 and pathogenesis of diabetes has not yet been reported; however, hypomethylation in the diabetic group through EWAS analysis of cg26823705 located within NBPF20 has been reported, which is consistent with our study [31]. PFKFB2, identified in this study of T2DM mechanisms using 1026 Qatar BioBank samples, showed causal associations with HbA1c. Analysis of 66 T2D-CpG associations and whole-genome SNP associations implicated PFKFB2 in metabolic networks related to T2DM [32]. UFM1, identified in a study of MKR mice modeling T2DM, is associated with endoplasmic reticulum-associated degradation in islet dysfunction, revealing its potential role in T2DM development [33]. cg10217853, located within ARRDC4, has been identified as a novel CpG site in this study, and arrestin domain–containing protein 4 is associated with diabetes by regulating insulin resistance and lipid metabolism in β cells in response to glucose [28,34]. Collectively, the DMP analysis in this EWAS suggests that relationships may exist between genes related to the top DMPs with high significance and the pathogenesis of diabetes mellitus.
By analyzing DMRs between diabetic and healthy individuals, we identified five genes that were hypomethylated (DIP2C, FLI90757, PRSS50, and TDRD9) or hypermethylated (PDE1C) in the diabetic group compared to those in the normal group. Notably, the mRNA expression of TDRD9 increases in the visceral adipose tissue of patients with T2DM [35]. The enzyme phosphodiesterase 1C is encoded by PDE1C and regulates the levels of cAMP and cGMP in cells. It is also involved in the molecular pathway that regulates insulin secretion from pancreatic β cells [36]. Collectively, the results of DMR analysis suggest the potential significance of the DMR-annotated genes in the context of diabetes, indicating their involvement in various cellular processes and relevance to diabetes-related mechanisms.
In conclusion, the DNA methylation markers found through EWAS in the AS–AS cohort of KoGES hold significant value for future research on diagnostic markers of diabetes and may indicate the pathogenesis of diabetes through changes in DNA methylation. There are several limitations of the present study. First, the findings are based on a single cohort using a case–control design, which lack replications from an independent cohort, and, therefore, the results of the current study are hypothesis-generating in nature, which need to be corroborated in other independent studies. Second, the study participants are of Korean ethnicity, and the results may not be generalizable to other ethnic populations. Third, additional analyses could be necessary for separate EWASs with FPG, HbA1c, and 2 h PG levels as outcome variables. We further suggest exploring different pathways associated with DNA methylation by performing EWAS analyses with individual glycemic markers and future research directions, including the construction of regression models and the application of machine learning algorithms to interpret feature importance. Integrating these advances into our study could provide comprehensive insights into the intricate relationships between DNA methylation patterns and glycemic markers, thereby increasing the robustness and applicability of our findings. In addition, SNPs are the most prevalent type of genetic variant, and multiple linked SNPs in the same chromosomal region can be phased to haplotypes [37]. Third-generation sequencing such as Oxford Nanopore Technologies (ONT) and Pacific Biosciences (PacBio) single-molecule real-time sequencing are major long-read sequencing technologies that can be applied to determine DNA sequence and to detect DNA methylation simultaneously. Such long reads could cover more than several kilobases, thus helping resolve haplotype phases in genomic regions with low contents of SNPs. Recently, a software program called NanoMethPhase has been developed that can perform DNA methylation phasing at Mb scale based on the long reads generated by nanopore sequencing technologies [38]. In the future, such third-generation sequencing technologies could be applied to perform methylome sequencing for identifying DMPs and DMRs with haplotype phase information, which can facilitate identification of genetically imprinted regions.

Supplementary Materials

The following supporting information can be downloaded at: https://www.mdpi.com/article/10.3390/genes14122207/s1, Figure S1: Filtration process of HM850k probes; Figure S2: Singular value decomposition (SVD) analysis before (A) and after (B) batch effect correction. The labels “PC-1” to “PC-20” correspond to the Principal Components showing the top components correlated with the detected covariates (age, sex, Array, Slide, and Sample_Group), with the number of PCs determined using Random Matrix Theory; Figure S3: Normal Q-Q plot. The x-axis displays the theoretical quantiles expected under a normal distribution, whereas the y-axis represents the observed quantiles from the dataset. A straight line indicates conformity to a normal distribution; Figure S4: Co-methylation pattern analysis for the DMR surrounding the PDE1C. The upper panel displays a regional Manhattan plot of the DMR surrounding the PDE1C gene. The y-axis represents −log10(p-value) for each CpG probe in the DMR, and the x-axis represents the genomic location of each CpG site. In the middle panel, annotation tracks for gene, CpG Island, Broad ChromHMM, Regulation, and SNPs are presented. Within the Broad ChromHMM track, the pink track corresponds to heterochromatin/low signal regions, and the sky blue and yellow tracks correspond to CTCF binding site and predicted weak enhancer/Cis-regulatory element within the regulation ENSEMBL track, respectively, as defined in the coMET user guide (https://www.bioconductor.org/packages/devel/bioc/vignettes/coMET/inst/doc/coMET.pdf; accessed on 30 November 2023). In the lower panel, the co-methylation pattern of CpG probes within the DMR is depicted, displaying a heatmap of Spearman correlation coefficients (R). In this heatmap, red indicates a positive correlation with higher “R” values, whereas blue indicates a negative correlation with lower “R” values; Figure S5: Co-methylation pattern analysis for the DMR surrounding the TDRD9. The upper panel displays a regional Manhattan plot of the DMR surrounding the TDRD9 gene. The y-axis represents -log10(p-value) for each CpG probe in the DMR, and the x-axis represents the genomic location of each CpG site. In the middle panel, annotation tracks for gene, Broad ChromHMM, Regulation, and SNP are presented. Within the Broad ChromHMM track, the brown track corresponds to repressed regions, as defined in the coMET user guide (https://www.bioconductor.org/packages/devel/bioc/vignettes/coMET/inst/doc/coMET.pdf; accessed on 30 November 2023). In the lower panel, the co-methylation pattern of CpG probes within the DMR is depicted, displaying a heatmap of Spearman correlation coefficients (R). In this heatmap, red indicates a positive correlation with higher “R” values, whereas blue indicates a negative correlation with lower “R” values.

Author Contributions

Conceptualization, J.L.; data curation, H.S. and S.-H.P.; formal analysis, H.S.; funding acquisition, J.-H.P. and H.-K.C.; Methodology, J.-T.H.; project administration, J.-H.P. and S.-H.P.; resources, J.-H.P.; software, H.S. and J.L.; supervision, J.L.; validation, J.-T.H. and H.-K.C.; Visualization, J.L.; writing—original draft, H.S. and J.L.; writing—review and editing, H.-K.C. All authors have read and agreed to the published version of the manuscript.

Funding

This research was supported by the Main Research Program (E0210601 and E0210400) of the Korea Food Research Institute (KFRI), funded by the Ministry of Science and ICT.

Institutional Review Board Statement

This study was ethically approved by the Institutional Review Board (IRB) of the Korea Food Research Institute (Approval No.: 2022-01-002-001).

Informed Consent Statement

Informed consent was obtained from all subjects involved in the study.

Data Availability Statement

The data presented in this study are available in the article.

Conflicts of Interest

The authors declare no conflict of interest.

References

  1. American Diabetes Association Professional Practice Committee. 2. Classification and Diagnosis of Diabetes: Standards of Medical Care in Diabetes—2022. Diabetes Care 2022, 45, S17–S38. [Google Scholar] [CrossRef]
  2. Sun, H.; Saeedi, P.; Karuranga, S.; Pinkepank, M.; Ogurtsova, K.; Duncan, B.B.; Stein, C.; Basit, A.; Chan, J.C.; Mbanya, J.C. IDF Diabetes Atlas: Global, regional and country-level diabetes prevalence estimates for 2021 and projections for 2045. Diabetes Res. Clin. Pract. 2022, 183, 109119. [Google Scholar] [CrossRef]
  3. Smith, Z.D.; Meissner, A. DNA methylation: Roles in mammalian development. Nat. Rev. Genet. 2013, 14, 204–220. [Google Scholar] [CrossRef]
  4. Zeng, P.; Zhao, Y.; Qian, C.; Zhang, L.; Zhang, R.; Gou, J.; Liu, J.; Liu, L.; Chen, F. Statistical analysis for genome-wide association study. J. Biomed. Res. 2015, 29, 285. [Google Scholar]
  5. Prasad, R.B.; Groop, L. Genetics of type 2 diabetes—Pitfalls and possibilities. Genes 2015, 6, 87–123. [Google Scholar] [CrossRef] [PubMed]
  6. Verma, M. Genome-wide association studies and epigenome-wide association studies go together in cancer control. Future Oncol. 2016, 12, 1645–1664. [Google Scholar] [CrossRef] [PubMed]
  7. Arpon, A.; Milagro, F.I.; Ramos-Lopez, O.; Mansego, M.L.; Santos, J.L.; Riezu-Boj, J.-I.; Martínez, J.A. Epigenome-wide association study in peripheral white blood cells involving insulin resistance. Sci. Rep. 2019, 9, 2445. [Google Scholar] [CrossRef] [PubMed]
  8. Reddy, M.A.; Zhang, E.; Natarajan, R. Epigenetic mechanisms in diabetic complications and metabolic memory. Diabetologia 2015, 58, 443–455. [Google Scholar] [CrossRef]
  9. Cardona, A.; Day, F.R.; Perry, J.R.; Loh, M.; Chu, A.Y.; Lehne, B.; Paul, D.S.; Lotta, L.A.; Stewart, I.D.; Kerrison, N.D. Epigenome-wide association study of incident type 2 diabetes in a British population: EPIC-Norfolk study. Diabetes 2019, 68, 2315–2326. [Google Scholar] [CrossRef] [PubMed]
  10. Juvinao-Quintero, D.L.; Marioni, R.E.; Ochoa-Rosales, C.; Russ, T.C.; Deary, I.J.; Van Meurs, J.B.; Voortman, T.; Hivert, M.-F.; Sharp, G.C.; Relton, C.L. DNA methylation of blood cells is associated with prevalent type 2 diabetes in a meta-analysis of four European cohorts. Clin. Epigenet. 2021, 13, 40. [Google Scholar] [CrossRef] [PubMed]
  11. Kim, Y.; Han, B.-G.; Group, K. Cohort profile: The Korean genome and epidemiology study (KoGES) consortium. Int. J. Epidemiol. 2017, 46, e20. [Google Scholar] [CrossRef] [PubMed]
  12. Ko, Y.K.; Kim, H.; Lee, Y.; Lee, Y.S.; Gim, J.A. DNA Methylation Patterns According to Fatty Liver Index and Longitudinal Changes from the Korean Genome and Epidemiology Study (KoGES). Curr. Issues Mol. Biol. 2022, 44, 1149–1168. [Google Scholar] [CrossRef] [PubMed]
  13. Kim, J.-E.; Jo, M.-J.; Cho, E.; Ahn, S.-Y.; Kwon, Y.-J.; Gim, J.-A.; Ko, G.-J. The Effect of DNA Methylation in the Development and Progression of Chronic Kidney Disease in the General Population: An Epigenome-Wide Association Study Using the Korean Genome and Epidemiology Study Database. Genes 2023, 14, 1489. [Google Scholar] [CrossRef]
  14. Martin, T.C.; Yet, I.; Tsai, P.-C.; Bell, J.T. coMET: Visualisation of regional epigenome-wide association scan results and DNA co-methylation patterns. BMC Bioinform. 2015, 16, 131. [Google Scholar] [CrossRef] [PubMed]
  15. Tian, Y.; Morris, T.J.; Webster, A.P.; Yang, Z.; Beck, S.; Feber, A.; Teschendorff, A.E. ChAMP: Updated methylation analysis pipeline for Illumina BeadChips. Bioinformatics 2017, 33, 3982–3984. [Google Scholar] [CrossRef]
  16. Teschendorff, A.E.; Marabita, F.; Lechner, M.; Bartlett, T.; Tegner, J.; Gomez-Cabrero, D.; Beck, S. A beta-mixture quantile normalization method for correcting probe design bias in Illumina Infinium 450 k DNA methylation data. Bioinformatics 2013, 29, 189–196. [Google Scholar] [CrossRef] [PubMed]
  17. Ritchie, M.E.; Phipson, B.; Wu, D.; Hu, Y.; Law, C.W.; Shi, W.; Smyth, G.K. limma powers differential expression analyses for RNA-sequencing and microarray studies. Nucleic Acids Res. 2015, 43, e47. [Google Scholar] [CrossRef]
  18. Blighe, K.; Rana, S.; Lewis, M. EnhancedVolcano: Publication-Ready Volcano Plots with Enhanced Colouring and Labeling; R Package Version; Bioconductor: Boston, MA, USA, 2019; Volume 1. [Google Scholar]
  19. Meeks, K.A.; Henneman, P.; Venema, A.; Addo, J.; Bahendeka, S.; Burr, T.; Danquah, I.; Galbete, C.; Mannens, M.M.; Mockenhaupt, F.P. Epigenome-wide association study in whole blood on type 2 diabetes among sub-Saharan African individuals: Findings from the RODAM study. Int. J. Epidemiol. 2019, 48, 58–70. [Google Scholar] [CrossRef]
  20. Chilunga, F.P.; Meeks, K.A.; Henneman, P.; Agyemang, C.; Doumatey, A.P.; Rotimi, C.N.; Adeyemo, A.A. An epigenome-wide association study of insulin resistance in African Americans. Clin. Epigenet. 2022, 14, 88. [Google Scholar] [CrossRef]
  21. Dawes, K.; Philibert, W.; Darbro, B.; Simons, R.L.; Philibert, R. Additive and interactive genetically contextual effects of HbA1c on cg19693031 methylation in type 2 diabetes. Genes 2022, 13, 683. [Google Scholar] [CrossRef] [PubMed]
  22. Mohammad Alhawiti, N.; Al Mahri, S.; Azhar Aziz, M.; Shafi Malik, S.; Mohammad, S. TXNIP in metabolic regulation: Physiological role and therapeutic outlook. Curr. Drug Targets 2017, 18, 1095–1103. [Google Scholar]
  23. Basnet, R.; Basnet, T.B.; Basnet, B.B.; Khadka, S. Overview on thioredoxin-interacting protein (TXNIP): A potential target for diabetes intervention. Curr. Drug Targets 2022, 23, 761–767. [Google Scholar] [CrossRef] [PubMed]
  24. Thielen, L.; Shalev, A. Diabetes pathogenic mechanisms and potential new therapies based upon a novel target called TXNIP. Curr. Opin. Endocrinol. Diabetes Obes. 2018, 25, 75. [Google Scholar] [CrossRef]
  25. Moon, S.-S.; Lee, J.-E.; Lee, Y.-S.; Kim, S.-W.; Jeoung, N.H.; Lee, I.-K.; Kim, J.-G. Association of pyruvate dehydrogenase kinase 4 gene polymorphisms with type 2 diabetes and metabolic syndrome. Diabetes Res. Clin. Pract. 2012, 95, 230–236. [Google Scholar] [CrossRef]
  26. Sugden, M.; Holness, M. Therapeutic potential of the mammalian pyruvate dehydrogenase kinases in the prevention of hyperglycaemia. Curr. Drug Targets-Immune Endocr. Metab. Disord. 2002, 2, 151–165. [Google Scholar] [CrossRef]
  27. Lee, K.; Moon, S.; Park, M.-J.; Koh, I.-U.; Choi, N.-H.; Yu, H.-Y.; Kim, Y.J.; Kong, J.; Kang, H.G.; Kim, S.C. Integrated analysis of tissue-specific promoter methylation and gene expression profile in complex diseases. Int. J. Mol. Sci. 2020, 21, 5056. [Google Scholar] [CrossRef]
  28. Ling, C. Epigenetic regulation of insulin action and secretion–role in the pathogenesis of type 2 diabetes. J. Intern. Med. 2020, 288, 158–167. [Google Scholar] [CrossRef]
  29. Ochoa-Rosales, C.; Portilla-Fernandez, E.; Nano, J.; Wilson, R.; Lehne, B.; Mishra, P.P.; Gao, X.; Ghanbari, M.; Rueda-Ochoa, O.L.; Juvinao-Quintero, D. Epigenetic link between statin therapy and type 2 diabetes. Diabetes Care 2020, 43, 875–884. [Google Scholar] [CrossRef]
  30. Koh, I.-U.; Choi, N.-H.; Lee, K.; Yu, H.-Y.; Yun, J.H.; Kong, J.-H.; Kim, H.J.; Lee, S.; Kim, S.C.; Kim, B.-J. Obesity susceptible novel DNA methylation marker on regulatory region of inflammation gene: Results from the Korea Epigenome Study (KES). BMJ Open Diabetes Res. Care 2020, 8, e001338. [Google Scholar] [CrossRef]
  31. Kim, H.; Bae, J.H.; Park, K.S.; Sung, J.; Kwak, S.H. DNA methylation changes associated with type 2 diabetes and diabetic kidney disease in an East Asian population. J. Clin. Endocrinol. Metab. 2021, 106, e3837–e3851. [Google Scholar] [CrossRef] [PubMed]
  32. Yousri, N.A.; Albagha, O.M.; Hunt, S.C. Integrated epigenome, whole genome sequence and metabolome analyses identify novel multi-omics pathways in type 2 diabetes: A Middle Eastern study. BMC Med. 2023, 21, 347. [Google Scholar] [CrossRef] [PubMed]
  33. Lu, H.; Yang, Y.; Allister, E.M.; Wijesekara, N.; Wheeler, M.B. The identification of potential factors associated with the development of type 2 diabetes: A quantitative proteomics approach. Mol. Cell. Proteom. 2008, 7, 1434–1451. [Google Scholar] [CrossRef] [PubMed]
  34. Richards, P.; Rachdi, L.; Oshima, M.; Marchetti, P.; Bugliani, M.; Armanet, M.; Postic, C.; Guilmeau, S.; Scharfmann, R. MondoA is an essential glucose-responsive transcription factor in human pancreatic β-cells. Diabetes 2018, 67, 461–472. [Google Scholar] [CrossRef] [PubMed]
  35. Carruthers, N.J.; Strieder-Barboza, C.; Caruso, J.A.; Flesher, C.G.; Baker, N.A.; Kerk, S.A.; Ky, A.; Ehlers, A.P.; Varban, O.A.; Lyssiotis, C.A. The human type 2 diabetes-specific visceral adipose tissue proteome and transcriptome in obesity. Sci. Rep. 2021, 11, 17394. [Google Scholar] [CrossRef]
  36. Daniel, P.V.; Kamthan, M.; Thakur, S.; Mondal, P. Molecular pathways dysregulated by Pb2+ exposure prompts pancreatic beta-cell dysfunction. Toxicol. Res. 2022, 11, 206–214. [Google Scholar] [CrossRef]
  37. Niu, T.; Qin, Z.S.; Xu, X.; Liu, J.S. Bayesian haplotype inference for multiple linked single-nucleotide polymorphisms. Am. J. Hum. Genet. 2002, 70, 157–169. [Google Scholar] [CrossRef]
  38. Akbari, V.; Garant, J.-M.; O’Neill, K.; Pandoh, P.; Moore, R.; Marra, M.A.; Hirst, M.; Jones, S.J. Megabase-scale methylation phasing using nanopore long reads and NanoMethPhase. Genome Biol. 2021, 22, 68. [Google Scholar] [CrossRef]
Figure 1. Flowchart of this study. Among the initial 1528 potential participants from the AS-AS cohort in KoGES at the 5th follow-up, individuals were categorized into either the T2DM (case) or normal (control) groups based on blood parameters, including FPG, HbA1c, and 2 h PG, as described in the Section 2. This process resulted in 1134 remaining participants (T2DM = 887, normal = 247) eligible for DNA methylation analysis. Subsequently, the HM850k data for these 1134 samples underwent preprocessing, involving normalization using the β-mixture quantile normalization (BMIQ) method, technical batch effect correction for slides using the Combat algorithm, and adjustment for covariates (utilizing the limma package; confounders = age, sex, BMI, and smoking habit), and removal of cell type heterogeneity using the champ.refbase function. The β-value matrix resulting from the preprocessing of raw idat files was then employed for analyses of DMPs and DMRs. The identified DMPs were subjected to correlation analysis with FPG or HbA1c. Additionally, selected DMRs from the pool of identified DMRs underwent co-methylation pattern analysis using the CoMET Bioconductor package.
Genes 14 02207 g001
Figure 2. DMP analysis results. (A) Volcano plot of the DMPs. The 10 top DMPs are labeled with the names of their CpG probes, and all DMPs are depicted as red dots. The x-axis represents △β-values between T2DM and normal groups, whereas the y-axis indicates FDRs, also called multiplicity-adjusted p-values. A total of 723,301 CpG probes are depicted as dots. Dark grey, green, blue, and red dots correspond to not significant (n.s.), |△β-values| ≥ 0.02 and adjusted p-value ≥ 0.05, |△β-values| < 0.02 and adjusted p-value < 0.05, and |△β-values| ≥ 0.02 and adjusted p-value < 0.05, respectively. (B) Distribution of the locations of CpG sites in DMPs. The left-panel histogram displays the distribution of CpG sites in various regions, including the first exon, 3′ untranslated region (UTR), 5′UTR, gene body, intergenic region, transcription start site (TSS) 1500, and TSS200. The y-axis represents the count of each region. The right-panel histogram illustrates the distribution of CpG sites in different locations including CpG island, open sea, shelf, and shore. The y-axis represents the count of each CpG location. (C) Box plots for 10 top DMPs. The x-axis represents the sample groups, and the y-axis represents β-values for each group. Outliers are depicted as dots. Asterisks (****) indicate significant differences between the normal and diabetes groups (p < 0.0001; Student’s t-test).
Genes 14 02207 g002
Figure 3. Correlation between methylation levels of DMPs and diabetic markers of the blood. (A) Correlation analysis between FPG and DMPs with p < 0.05; |R| ≥ 0.2 (Spearman correlation). The x-axis indicates β-values for individuals, and the y-axis indicates FPG levels (mg/dL). Individuals in the T2DM and normal groups are indicated by red and blue dots, respectively. The red line represents the regression line. (B) Correlation analysis between HbA1c and DMPs with p < 0.05; |R| ≥ 0.2 (Spearman correlation). The x-axis indicates β-values for individuals, and the y-axis indicates HbA1c (%). Individuals in the T2DM and normal groups are indicated by red and blue dots. The red line represents the regression line.
Genes 14 02207 g003
Figure 4. Results of DMR analysis. (A) Bar graph illustrating counts of hypermethylated or hypomethylated DMPs in each DMR. Dark orange, cyan, and light grey sections in the bar graph indicate the count of hypermethylated, hypomethylated, and not significant probes, respectively. (B) Analysis of co-methylation pattern for the DMR surrounding TXNB. The upper panel displays a regional Manhattan plot of the DMR surrounding TXNB. The y-axis represents −log10(p-value) for each CpG probe in the DMR, and the x-axis represents the genomic location of each CpG site. In the middle panel, annotation tracks for gene, broad ChromHMM, regulation, and SNPs are presented. Within the broad ChromHMM track, pink and brown tracks correspond to repressed and heterochromatin/low signal regions, respectively, and, within the regulation ENSEMBL track, sky blue track corresponds to CTCF binding site, as defined in the coMET user guide (https://www.bioconductor.org/packages/devel/bioc/vignettes/coMET/inst/doc/coMET.pdf; accessed on 30 November 2023). In the lower panel, the co-methylation pattern of CpG probes within the DMR is depicted, displaying a heatmap of the Spearman correlation coefficients (R). In this heatmap, red indicates a positive correlation with relatively high R values, whereas blue indicates a negative correlation with relatively low R values.
Genes 14 02207 g004
Table 1. Comparisons of Clinical and Biochemical Parameters in the KoGES Cohort Participants with Different Glycemic Status.
KoGES Cohort (n = 1134)Normal (n = 887)T2DM (n = 247)p Value a
MeanSDnMeanSDn
Sex (% male)50.20 88757.50 247-
Age (years)57.778.3888762.458.22247***
BMI (kg/m2)23.642.7788725.312.79247***
Smoking habit (%)37.80 88747.30 247-
Fasting glucose (mg/dL)89.265.64887161.0540.97247***
HbA1c (%)5.350.218877.561.05247***
2-h plasma glucose (mg/dL)105.4921.25887261.9658.3856***
Fasting insulin (µIU/mL)7.633.0488713.5718.69247***
2-h plasma insulin (µIU/mL)28.6927.6888736.6829.0456***
Newly detected DM (n, %) 215, 87.0 247-
DM treatment (n, %) 191, 88.8 215-
Oral DM medication (n, %) 180, 83.7 215-
Insulin treatment, (n, %) 20, 9.3 215-
BUN (mg/dL)15.263.9488716.435.89247*
Creatinine (mg/dL)0.930.158870.990.38247*
AST(SGOT) (IU/L)25.289.1988726.4711.88247n.s.
ALT(SGPT) (IU/L)22.1612.6088627.9016.19247***
Total Cholesterol (mg/dL)191.8732.92887188.0136.08247n.s.
HDL-Cholesterol (mg/dL)44.6811.5088739.518.56247***
Triglyceride (mg/dL)123.4873.37887181.91112.83247***
hs-CRP (mg/L)1.333.818872.124.96247n.s.
W.B.C. blood (Thous/uL)5.221.358876.131.59247***
R.B.C. blood (Mil/uL)4.430.428874.460.46247n.s.
Hemoglobin (Hb) (g/dL)13.701.3888713.731.49247n.s.
Hematocrit (Hct) (%)41.173.8488741.064.23247n.s.
Platelet (Thous/uL)255.2260.11887255.3566.94247n.s.
a, *, p < 0.001; ***, p < 0.000001; n.s., not significant (p ≥ 0.05).
Table 2. Top 10 differentially methylated probes (DMPs).
ProbeDelta-Betap-ValueAdj. p-ValueCHRMAPINFOGeneFeaturecgiMethylation
cg19693031−0.058 2.95 × 10−492.13 × 10−431145441552TXNIP3′UTRopenseahypo
cg26974062−0.022 2.76 × 10−369.97 × 10−311145440734TXNIPBodyopenseahypo
cg26823705−0.029 3.22 × 10−235.82 × 10−181145435523NBPF20Bodyopenseahypo
cg048163110.021 2.34 × 10−202.42 × 10−1571066650C7orf50Bodyshorehyper
cg17075888−0.033 2.52 × 10−192.03 × 10−14795225339PDK4Bodyshorehypo
cg167405860.026 3.05 × 10−182.21 × 10−132143655919ABCG1Bodyshorehyper
cg02841972−0.021 1.90 × 10−151.06 × 10−10210176151 IGRopenseahypo
cg197506570.025 4.10 × 10−151.98 × 10−101338935967UFM13′UTRopenseahyper
cg10217853−0.037 3.99 × 10−141.70 × 10−91598505199ARRDC4Bodyshorehypo
cg006839220.021 4.66 × 10−141.87 × 10−91207242569PFKFB2Bodyopenseahyper
Table 3. Top 10 differentially methylated regions (DMRs).
ChromosomeStartEndWidthp Valuep Value AreaGene
DMR_1chr63206311432065211209700.00040626TNXB
DMR_2chr630038910300396006900.00022080.00106864RNF39
DMR_3chr51354156931354166139200.00062710.002040131MIR886
DMR_4chr105306355315849490.00119230.003170594DIP2C
DMR_5chr11535994791536001566770.00181930.004265729S100A13
DMR_6chr629648161296490248630.0020490.010306638
DMR_7chr633047944330488799350.00226980.005581658HLA-DPB1
DMR_8chr631691354316921527980.00244640.017168898C6orf25
DMR_9chr631275551312758813300.00269370.006924082
DMR_10chr168752578756263690.00266720.037163952
Disclaimer/Publisher’s Note: The statements, opinions and data contained in all publications are solely those of the individual author(s) and contributor(s) and not of MDPI and/or the editor(s). MDPI and/or the editor(s) disclaim responsibility for any injury to people or property resulting from any ideas, methods, instructions or products referred to in the content.

