Article

Characterization of Simple Sequence Repeat (SSR) Markers Mined in Whole Grape Genomes

1
Fruit Crop Genetic Improvement and Seedling Propagation Engineering Center of Jiangsu Province, College of Horticulture, Nanjing Agricultural University, Nanjing 210095, China
2
Zhenjiang Institute of Agricultural Sciences in Hilly Area of Jiangsu Province, Zhenjiang 212400, China
3
Department of Botany and Plant Sciences, University of California Riverside, Riverside, CA 22963, USA
*
Author to whom correspondence should be addressed.
These authors contributed equally to this work.
Genes 2023, 14(3), 663; https://doi.org/10.3390/genes14030663
Submission received: 30 January 2023 / Revised: 25 February 2023 / Accepted: 1 March 2023 / Published: 7 March 2023
(This article belongs to the Section Plant Genetics and Genomics)

Abstract

:
SSR (simple sequence repeat) DNA markers are widely used for genotype DNA identification, QTL mapping, and analyzing genetic biodiversity. However, SSRs in grapes are still in their early stages, with a few primer pairs accessible. With the whole-genome sequencing (WGS) of several grape varieties, characterization of grape SSR changed to be necessary not only to genomics but to also help SSR development and utility. Based on this, we identified the whole-genome SSR of nine grape cultivars (‘PN40024’, ‘Cabernet Sauvignon’, ‘Carménère’, ‘Chardonnay’, ‘Merlot’, ‘Riesling’, ‘Zinfandel’, ‘Shine Muscat’, and ‘Muscat Hamburg’) with whole-genome sequences released publicly and found that there are great differences in the distribution of SSR loci in different varieties. According to the difference in genome size, the number of SSRs ranged from 267,385 (Cabernet Sauvignon) to 627,429 (Carménère), the density of the SSR locus in the genome of nine cultivars was generally 1 per Kb. SSR motif distribution characteristic analysis of these grape cultivars showed that the distribution patterns among grape cultivars were conservative, mainly enriched in A/T. However, there are some differences in motif types (especially tetranucleotides, pentanucleotides, and hexanucleotides), quantity, total length, and average length in different varieties, which might be related to the size of the assembled genome or the specificity of variety domestication. The distribution characteristics of SSRs were revealed by whole-genome analysis of simple repeats of grape varieties. In this study, 32 pairs of primers with lower polymorphism have been screened, which provided an important research foundation for the development of molecular markers of grape variety identification and the construction of linkage maps of important agronomic traits for crop improvement.

1. Introduction

Molecular markers that reveal polymorphism at the DNA level have proved to be a very powerful tool for characterizing and estimating genetic diversity [1,2]. The fast expansion of molecular markers has been fostered by the advancement of genetic research and the lowering of genotyping costs in recent years [3]. At present, different genetic marker assistance systems have been developed [4]. However, compared with other DNA markers, microsatellites or SSR markers have become valuable molecular tools for genetic fingerprint analysis because of their richness, high polymorphism, co-dominant inheritance, high repeatability, and suitability for automation [5,6,7]. Furthermore, they are very variable, and the associated data can be easily compared between laboratories, and basic laboratory equipment suitable for small- and medium-sized laboratories is required [8].
SSR markers have 2–6 bp tandem repeats in the core sequence, which are highly repeatable, and rich in the genome, and the number of repeats at specific sites is highly variable. Most SSR markers used in grape variety identification are generated by cross-amplification in the development of expressed sequence tag (EST)—SSR primer pairs [9,10,11,12]. Although EST-SSR can be used for genetic analysis and has been widely used to estimate genetic diversity and construct linkage maps, its relatively high sequence conservation and high-concentration gene-rich regions with low polymorphism levels may limit its application, especially in the construction of a linkage map [13]. In contrast, genomic SSR markers are highly polymorphic and tend to be widely distributed throughout the genome, resulting in better map coverage [14,15]. However, in distant species, the conservation of genomic SSR loci is low, so their applicability decreases with the increase in genetic distance [16,17]. Therefore, the development of a large number of original SSR markers will contribute to the genetic and breeding research of species. Next-generation sequencing technology stands out because of its low price of analysis and high performance of data acquisition, which has become a new tool for detecting molecular markers [18,19].
Since the first time, scientists have effectively translated the genetic code of a fruit plant in 2007, considerably advancing grape functional genomics and grape molecular biology research [20]. With the rapid development of sequencing technology, more and more important grape varieties have been sequenced [21]. A large number of molecular markers are developed based on the level of the grape genome, which can be applied to variety identification, genetic diversity research, population structure analysis, association mapping, and linkage mapping [22,23,24]. All these applications support the increase in grape basic genetics research and breeding activities. The effectiveness of SSR in grapes plays a fundamental role in the rapid genetic separation of complex traits, such as resistance to biological and abiotic stresses and the identification of quantitative trait locus of various important traits [25]. For better utilization of grape SSR, here, we used large-scale genome sequence data to characterize SSR in several grape genomes.

2. Experiment Method and Content

2.1. Plant Materials

A collection of eight random grape cultivars (‘Hongxiangjiao’, ‘Jumeigui’, ‘Pione’, ‘Kuroshio’, ‘Jingzijing’, ‘Queen of Vinyard’, ‘Pinot Noir’, and ‘Cabernet Sauvignon’) were obtained from the national grape germplasm repository of Zhengzhou Fruit Research Institute at Chinese Academy of Agricultural Sciences. Those samples were used to validate the usefulness of SSR primer pairs. The DNA was extracted using the hexadecyl trimethyl ammonium bromide (CTAB) method [26].

2.2. Data Sources

In this study, nine Vitis materials that have completed genome sequencing were selected. There were seven Vitis vinifera ssp. vinifera (taxonomy id: 29760) germplasm resources, ‘Cabernet Sauvignon’ [27,28,29], ‘Carménère’ [30], ‘Chardonnay’ [31], ‘Merlot’ [32], ‘Riesling’ [33], ‘Zinfandel’ [34], and ‘Pinot Noir’ (‘PN40024’) [20,35,36]; and two Vitis labruscana × Vitis vinifera (taxonomy id: 2817680) resources, ‘Shine Muscat’ [37] and ‘Muscat Hamburg’ (sequencing sequence not published).
Except for V. labruscana × V. vinifera resources (‘Shine Muscat’ and ‘Muscat Hamburg’), the genome sequences of other grape cultivars are mainly downloaded from http://www.grapegenomics.com/pages/all.php (accessed on 15 December 2021).

2.3. Identification of SSR Motifs

SSRs of nine grape cultivars were identified by the microsatellite identification tool. A Perl5 script called MISA (http://pg-rc.ipk-gatersleben.de/misa/misa.html (accessed on 3 January 2022)) was used to identify and locate perfect SSRs and composite SSRs interrupted by a certain number of bases. The repeat unit length is defined as the default mononucleotide to hexanucleotide, as microsatellites with long repeat units are very rare. For mononucleotide to hexanucleotide, the minimum repeat units are defined as 10, 6, 5, 5, 5, and 5, respectively. Composite microsatellites are defined as repeats with ≥2 repeats interrupted by ≤100 bp [38]. Primer 3 [39] was used to design primers for sequences containing SSR loci. Primers were designed by using the genomic sequence of ‘PN40024’. The parameters for primers are: length: 18–25 bp, GC content: 40–60%, annealing temperature (TM): 55–60 °C, and desired amplification product size: 100–500 bp. Eighty pairs of primers were randomly selected and sent to General Biol Co., Ltd. for synthesis. PCR products were detected by nondenaturing polyacrylamide gel electrophoresis (PAGE) [40]. SSR primers were initially standardized for optimum annealing temperature at different gradient temperatures. The PCR procedure was 94 °C for 3 min, then 29 cycles at 94 °C for 30 s, 55 °C for 30 s, 72 °C for 45 s, and a final extension at 72 °C for 10 min. The number of alleles and polymorphism information content (PIC) for the SSRs were calculated using Anderson’s method [41].

2.4. Distribution Density of SSRs and SNPs in the Genome

To investigate the motif distribution of SSRs and single-nucleotide polymorphism (SNP) density in the genome of ‘PN40024’ 19 chromosomes (chr1–chr19), we have used Circos (v 0.69) [42]. This tool is effective in displaying structure variation in genomes. In this paper, a circle figure can be created from SSRs/SNPs and karyotype data inputs.

2.5. Functional Annotation of SSR Loci

We used SnpEff 5.0e software (https://pcingola.github.io/SnpEff (accessed on 3 June 2022)) for gene annotation of SSR loci. In this paper, SSR loci results can be created from genome gtf and SSR data inputs.

2.6. Phylogenetic Analysis

SNPhylo software (https://chibba.pgml.uga.edu/snphylo/ (accessed on 18 January 2022)) [43] was used to construct a phylogenetic tree. SNPhylo accepts a vcf input, removes low-quality data, extracts SNPs in an approximate linkage equilibrium, aligns SNPs with MUSCLE, and generates a phylogenetic tree in the PHYLIP package [44]. A SNPhylo phylogenetic tree was generated by using the default parameters: linkage disequilibrium (LD) is 0.1, minor allele frequency (MAF) is 0.1 and the missing rate is 0.1.

3. Results

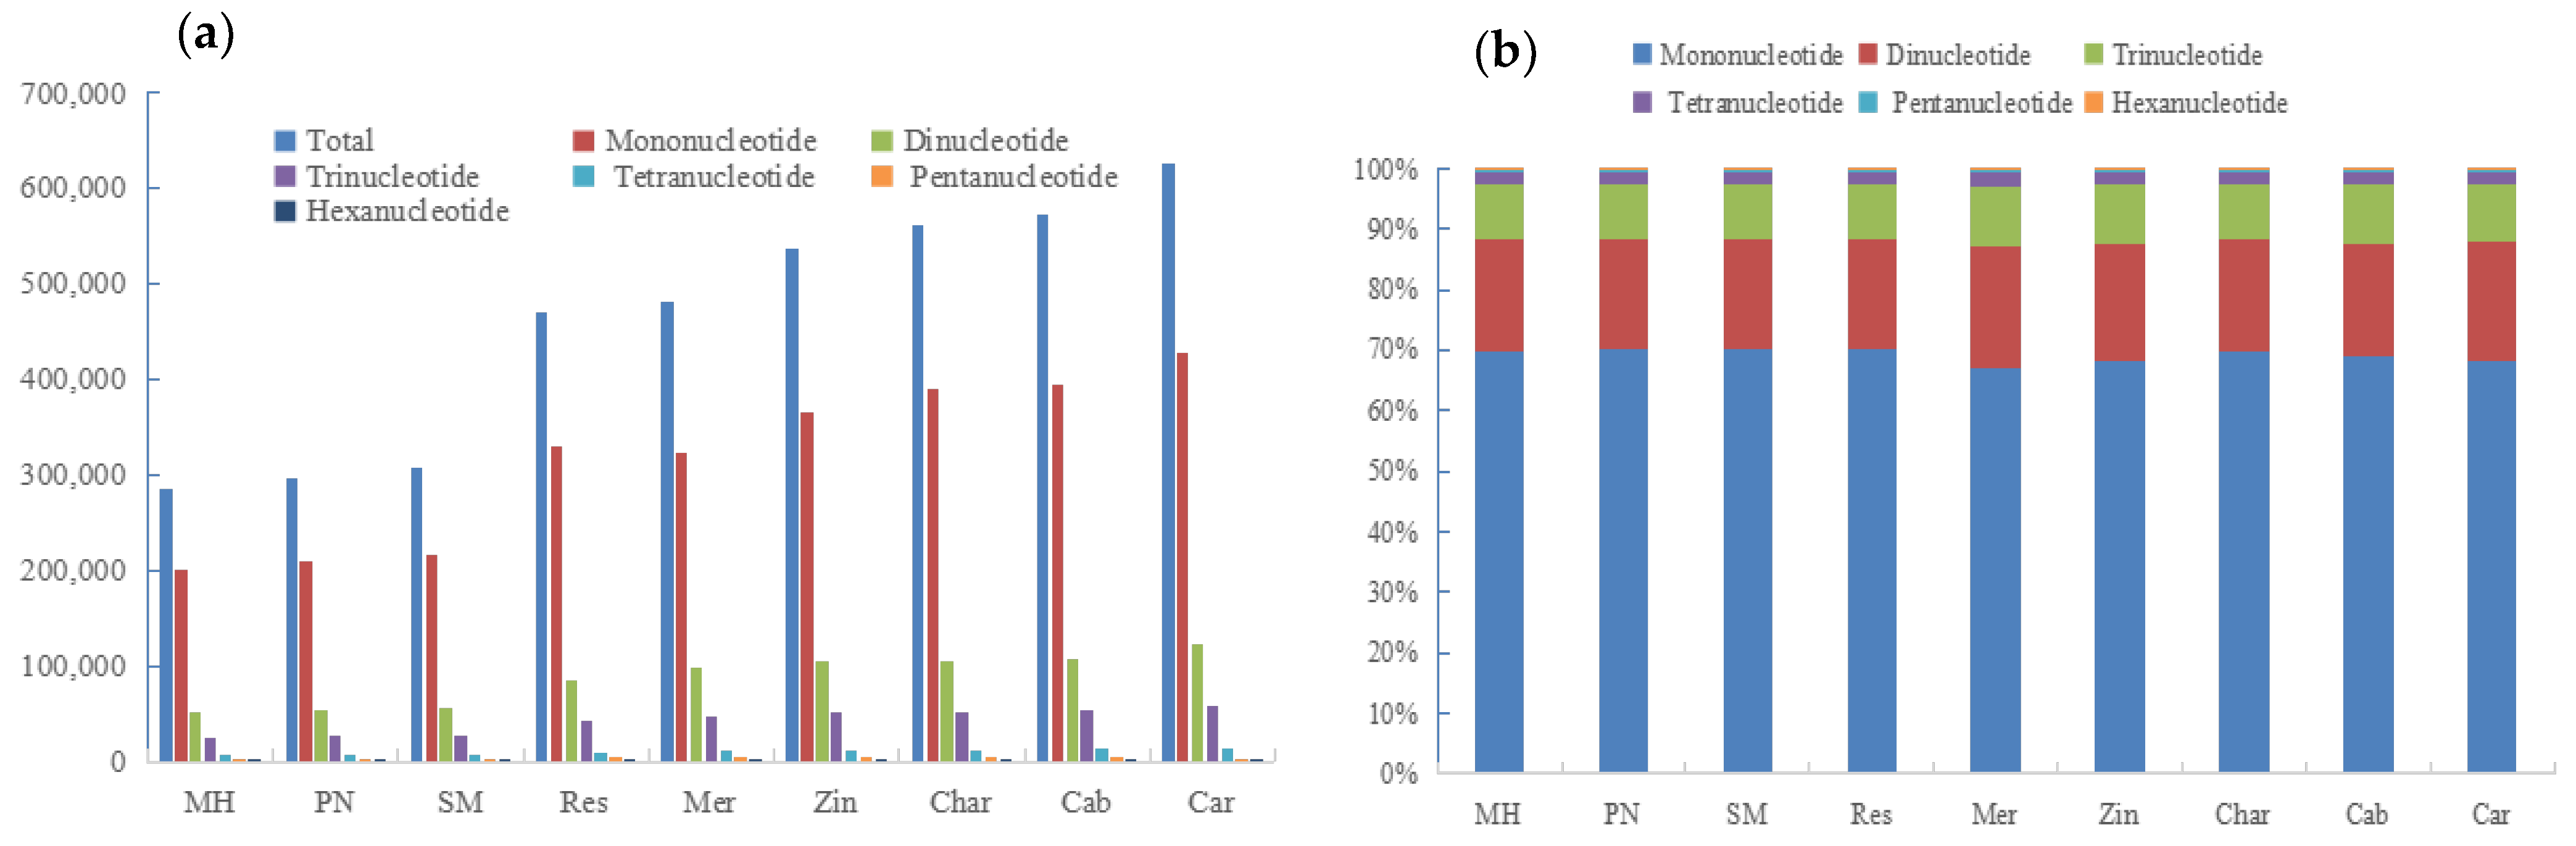
3.1. Number and Density of SSRs Identified in Nine Grape Genomes

The analysis indicated that the numbers of SSR on nine grape cultivars’ chromosomes were different, ranging from 297,659 in ‘PN40024’ to 627,429 in ‘Carménère’ (Table 1). When considering their assembled genome sizes, the SSR loci densities showed another variation, even though the lowest and the most were still in ‘PN40024’ and ‘Carménère’, respectively. Except for the relatively lower density of ‘Carménère’ (0.99), the others were all over 1 SSR loci per 1 Kb.
The distribution of the number of SSRs on chromosomes is shown in Table S1. It can be seen that, on the whole, the distributions of the number of SSRs on chromosomes of all varieties show the same regular patterns. Namely, there is the smallest quantitative distribution on chromosome 17 (accounting for 3.33–4.02%); the largest number of SSRs was distributed on chromosome 14 or 18 (accounting for 5.78–7.64%). The variation of the total number of SSRs on chromosome 3 among the nine cultivars was the smallest, only 9.16%, while the variation on chromosome 13 was the largest, reaching 31.89%. Except for hexanucleotides that had the smallest variation in the number distribution of chromosome 10, the number distribution variation of other SSR motif types on chromosome 3 is the smallest, only 8.48–10.50%. Pentanucleotides and hexanucleotides had the largest variation in the number distribution of chromosomes 13 and 4, reaching 35.60% and 51.09%, respectively.
Among different varieties, the distribution density of SSRs on chromosomes showed obvious differences (Table S2), and no obvious regularity was found. The SSR distribution densities on chromosomes 2, 17 and 19 were lower, while those on chromosomes 1, 9 and 16 were high. The variation of SSR distribution densities on chromosome 18 among cultivars was the lowest, only 1.81%, while those on chromosome 19 were the largest, reaching 5.00%. In general, with the increase in the number of nucleotides, the distribution density variation coefficient of SSRs on chromosomes showed a gradually increasing trend. That is, the coefficient of variation of the distribution density of a single nucleotide on the chromosome is the smallest, only 0.90%, while the distribution density variation coefficient of hexanucleotides on the chromosome was the largest, reaching 8.47%.
The distribution of SSRs in the grape genome was presented using the number and density distribution of ‘PN40024’-derived chromosomal SSRs as an example. The overall view of the motif distribution of SSRs and SNP density in the genome of ‘PN40024’ 19 chromosomes (chr1–chr19) was assembled by Hi-C as shown in Figure 1. It can be seen that there is no significant difference between the distribution uniformity of SSR and SNP on 19 chromosomes. The SSR motifs in the genome of the variety ‘PN40024’ and the distribution quantity and density on different chromosomes of SSR are shown in Figure 2. It can be seen that the distribution quantity and density of SSR motifs on different chromosomes are different. Chromosome 9 has the largest distribution density, reaching 539.63/Mb; the minimum distribution density of chromosome 2 was only 500.96/Mb; the distribution density of SSR motifs on other staining ranged from 502.54/Mb (chr17) to 537.46/Mb (chr6). In addition, the number of SSR motifs on each chromosome (chr1–chr19) of ‘PN40024’ varies from 8607 (chr17) to 15,403 (chr14). In addition, we found a positive correlation between the number of SSR motifs on chromosomes and the genome assembly size (Figure S1), while there was no significant correlation between genome size and its distribution density (Figure S2).

3.2. Types of SSRs Repeat Motifs and Lengths in the Grape Genome

There are six different types of SSR repeat motif lengths, as illustrated in Figure 3, including mononucleotides, dinucleotides, trinucleotides, tetranucleotides, pentanucleotides, and hexanucleotides, with mononucleotide loci accounting for 70% below and upper of the total SSR loci on the nine genomes. It was discovered that the longer the repeat motifs, the lower the SSR locus numbers, with the hexanucleotide loci in ‘Chardonnay’ accounting for only 0.12% of the total locus number. It was also found that the repeat motif types are very different among the 6 kinds of SSR loci, and the longer the repeat motif, the more the repeat motif types, from 2 of mononucleotide loci to 82 of hexanucleotides (Table 2 and Table S3). Among them, there are all types of mononucleotides, dinucleotides, and trinucleotides in the nine grape genomes, while the existence of tetranucleotides, pentanucleotides, and hexanucleotides showed differences among the genomes. Most interestingly, each kind of length SSR loci has a dominant type of repeat motif with most A/T nucleotide pairs. For example, A/T is rich in mononucleotide loci, and AT/AT, AAT/ATT, AAAT/ATTT, AAAAT/ATTTT, and AAAAAT/ATTTTT are the main motif types of dinucleotides, trinucleotides, tetranucleotides, pentanucleotides, and hexanucleotides, respectively, covering 65.334–68.659%, 11.937–13.387%, 6.702–7.434%, 1.396–1.545%, 0.1680–0.2090%, and 0.0220–0.0320%.

3.3. Length of Various SSR Loci and Repeating Times of the Different Repeat Motifs

As shown in Table S4, it was found that duplicated times of all the six kinds of long repeat motifs were different, which determined the length of the corresponding locus. In total, the longer the motifs, the fewer the number of lower duplicating times. For example, the duplicating times of mononucleotide SSR loci were the highest ranging from 11 to 12 in the ‘PN40024’ genome, while that of the pentanucleotide loci was the lowest from 5 to 6. Those of dinucleotides, trinucleotides, tetranucleotides, and pentanucleotides were 6 to 7, 5 to 6, 5 to 6, and 5 to 6, respectively. The phenomena in the other eight genomes were similar (Table S4).
The overall lengths of SSRs differed between and among the six types of motif length groupings (Figure 4). The lengths of mononucleotides, dinucleotides, trinucleotides, tetranucleotides, pentanucleotides, and hexanucleotides had different ranges of 200,117 bp–428,787 bp, 52,587 bp–122,412 bp, 25,857 bp–59,162 bp, 6138 bp–13,897 bp, 1053 bp–2305 bp, and 433 bp–921 bp., respectively. Among each motif length group, the SSRs with the motifs including AT/AT, AAT/ATT, AAAT/ATTT, AAAAT/ATTTT, and AAAAAT/ATTTTT had the longest lengths, suggesting that the motifs with more A/T duplicated much more. The situation was the same in all the nine genomes.

3.4. Annotation of SSR Loci

By searching the ‘Chardonnay’ genome annotation file (GFF) (Table S5), we found that among the 561,635 SSR loci identified, 316,874 SSR loci were located in or near the gene. There were 224,001 SSRs in the intergenic region, followed by the number of SSRs located in introns (53,959). There are 7536 SSRs in 5 ‘UTR or 3’ UTR. Only 1890 SSRs were located in the exon region of the coding gene (Table S5).
The distribution of different motif SSRs in the ‘Chardonnay’ genome is shown in Table 3. We found that the mononucleotide-annotated SSR sites were the most, reaching 227,078; the SSR sites annotated by hexanucleotide were the least, only 409. In each nucleotide motif type, trinucleotides and hexanucleotides were distributed in the exon region of the coding gene in a large number, reaching 1363 and 46, respectively, while the number of mononucleotide, dinucleotide, tetranucleotide and pentanucleotide types distributed in the exon region of the coding gene was relatively low—281, 186, 11, and 3 (1.49%), respectively. We also found that the distribution of SSRs in the genome of other varieties showed a similar pattern.

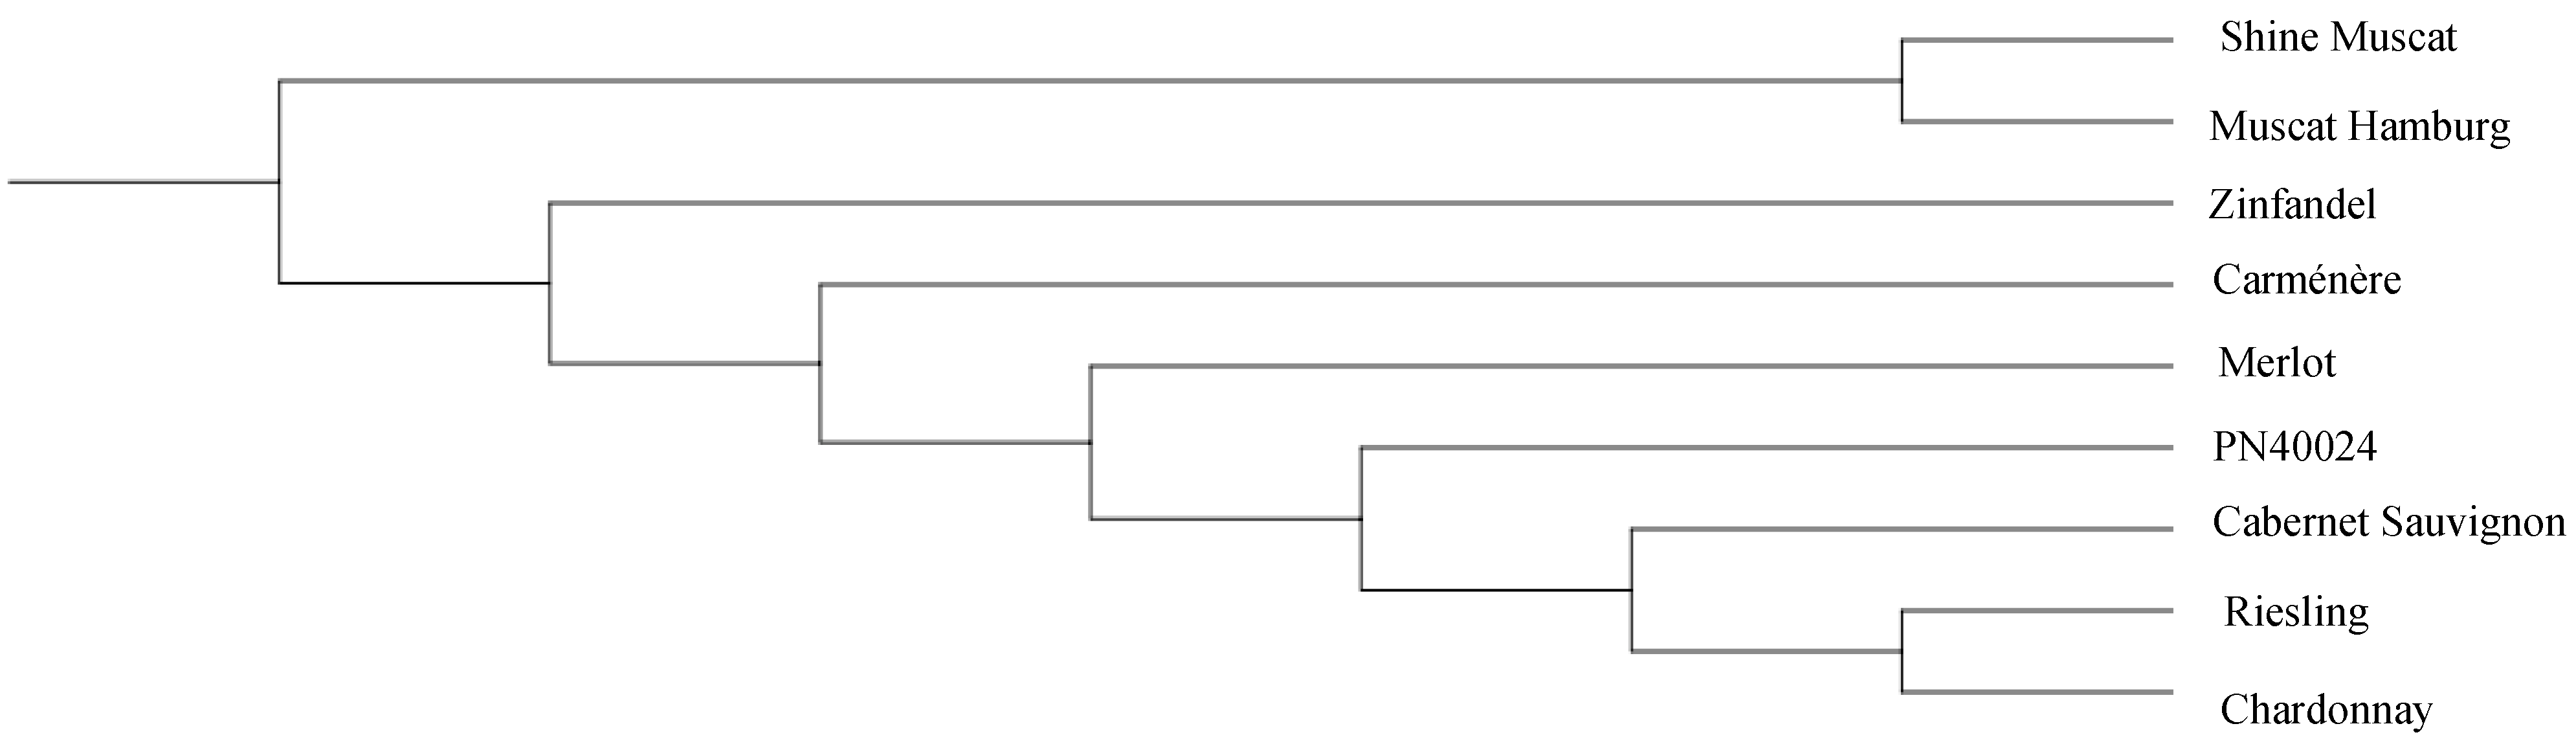
3.5. Comparison of the Phylogenetic Trees of Nine Grape Cultivars Constructed Using All the SSRs and SNPs

In order to evaluate the utility of the whole-genome SSR identified, both the SSRs and SNPs were utilized to analyze the phylogenetic trees of the nine grape cultivars. The result indicated that both the trees constructed using SSRs and SNPs were almost identical (Figure 5 and Figure 6). In general, the nine varieties that have been sequenced can be divided into two categories as shown in Figure 5 and Figure 6. One species is Vitis vinifera ssp. vinifera, with seven varieties, Cabernet Sauvignon’, ‘Carménère’, ‘Chardonnay’, ‘Merlot’, ‘Riesling’, ‘Zinfandel’, and ‘PN40024’derived. The other is V. labruscana × V. vinifera, with two varieties, ‘Shine Muscat ’and ‘Muscat Hamburg’. In addition, we found that ‘Riesling’ and ‘Chardonnay’ are closely related.

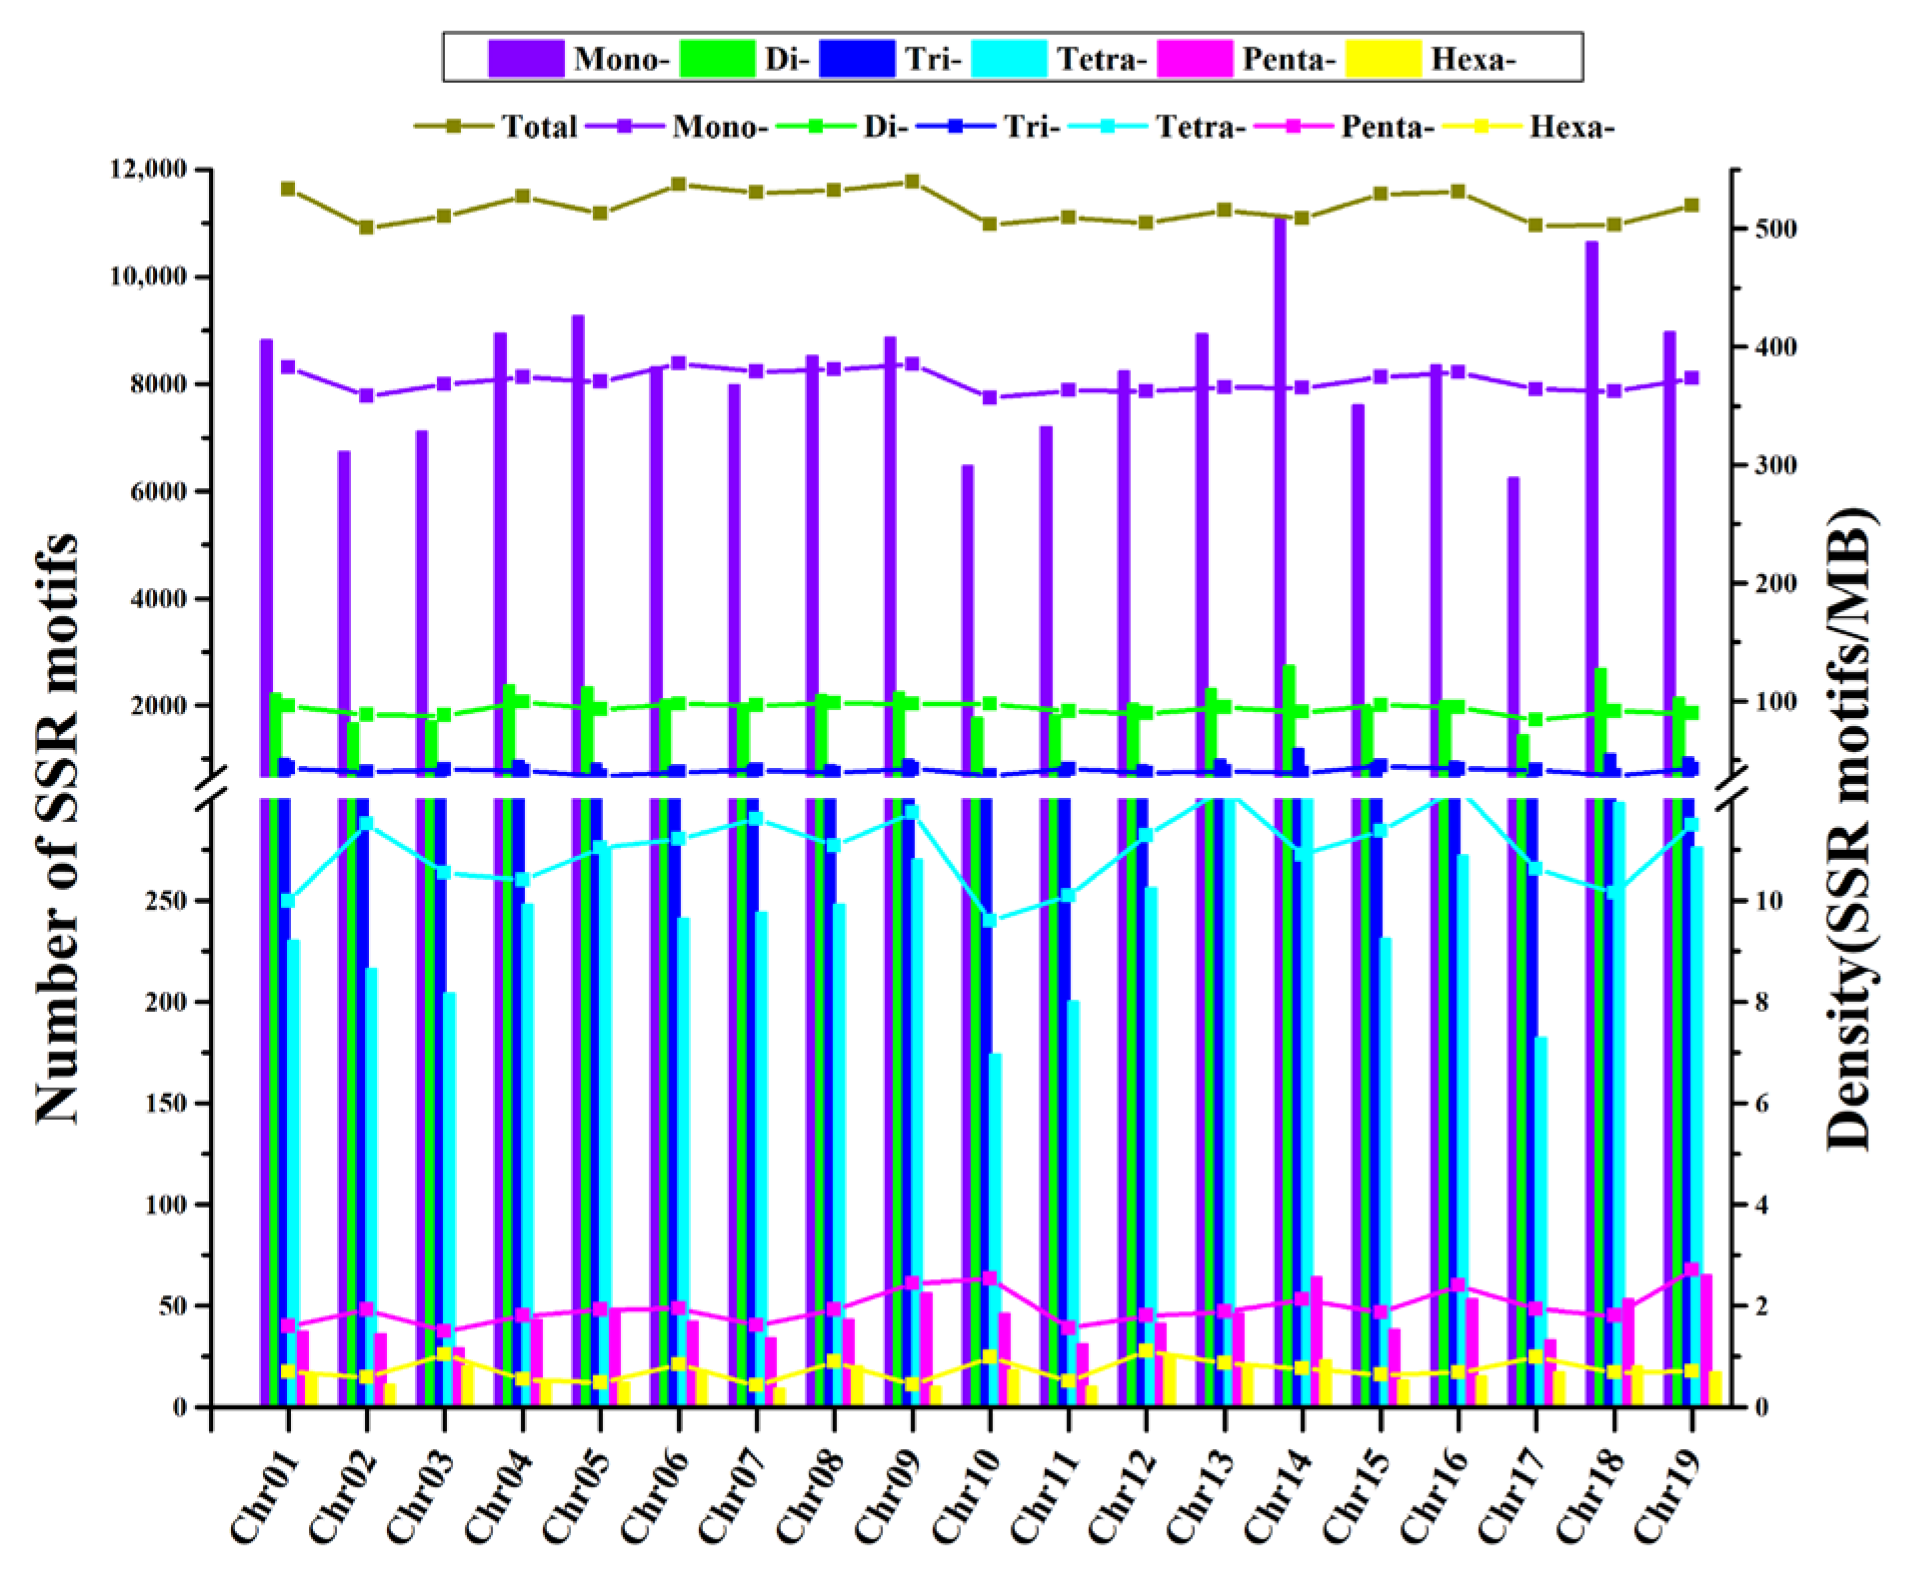
3.6. The Distribution and Numbers of ‘PN40024’ SSR Loci

In the ’PN40024’ genome data, 297,659 SSRs were identified, including 208,985 SSRs with mononucleotides, 54,196 SSRs with dinucleotides, 26,478 SSRs with trinucleotides, 6.438 SSRs with tetranucleotides, 1129 SSRs with pentanucleotides, 433 SSRs with hexanucleotides, and 50,927 compound SSRs. A total of 147,308 of them could be located on 19 chromosomes, accounting for 49% of the total SSRs. We mainly analyzed SSRs with 1–6 repeat units, and their distribution density on 19 chromosomes is shown in Figure 7, Figures S3 and S4.
Units 2 and 3 were the main types, with the size of repeat sequences more than 100 bp. On the contrary, long repeat units (5 and 6) failed to form long repetitive sequences. Primers were designed for randomly selected 80 SSR loci, and verified with 8 grape cultivars (Table S6). Among them, 68 pairs of primers were able to detect amplification products, of which 32 pairs (40%) of primers had relatively low polymorphism, which could be used to distinguish different varieties. Among the 32 pairs of primers that can provide low polymorphism, 25 pairs are from 5 and 6 SSR repeat units, indicating that the variation between long repeat units can be more reflected in different varieties. A total of 134 bands were generated in the amplification results of all type b primers, of which 113 (84.33%) could be used for variety discrimination (Table S6).

4. Discussion

With the rapid development of sequencing technology, many SSR loci can be found quickly and cost effectively by next-generation sequencing (NGS) technology [18,19,45,46]. Whole-genome-based SSR locus mining can be much more efficient and output higher numbers of SSR markers than the method of rapid isolation of repeat containing sequences (fiasco) by amplified fragment length polymorphism (AFLP) or the traditional magnetic bead enrichment method or library, etc. The discovery and mining of SSR loci through genome sequences have been successfully applied to many plant species, including field crops, cash crops and medicinal plants [47,48,49,50,51]. All these do much help in plant genotyping, QTL mapping, and analyzing biodiversity, etc. With grape whole-genome sequencing (WGS), the characterization of the SSR loci is necessary and important.

4.1. Relationship between the Grape Genome Sizes and the Distribution Density of SSR on Chromosomes

The present study analyzed the distribution of SSR (composed of 1–6 bp) in nine genomes of grape cultivated varieties. Except for ‘Riesling’, similar to plant species such as Capsicum [52] and Cucurbitaceae [51], the number of the SSR motifs in grapes was positively correlated with genome size (r2 = 0.92, Figure S1). In contrast, SSR density is usually negatively correlated with genome size [53], however, similar to Cucurbitaceae plants (r2 = 0.89, Figure S2) [51]. It is worth noting that, similar to the more compact genome of Cucurbitaceae [51], the genome of grape species also shows a similar trend.
The classification of SSR motifs in the grape crop genome was compared initially. Compared with ‘PN40024’, the ‘Cabernet Sauvignon’ genome has more motif types, which may be partly due to the larger genome assembly size of the latter [51]. In SSR motifs, the changes in repeat selectivity constraints may be different [54]. In general, A/T-rich motifs appear more frequently in di-cotyledons [52,55]. The theme forms of classification in each variation, however, are not the same. Cucurbitaceae has had similar non-identities documented [51] and Capsicum genomes [52]. In the grape genome, we found comparable results. In all nine genomes, A/T, AT/AT, and AAT/ATT are the top three abundant motifs. However, AC/GT and C/G content shows different modes among nine cultivars, which indicate SSR contains sufficient information to distinguish different varieties.
In addition, there was no significant difference in the distribution uniformity of SNPs and SSRs on the ‘PN40024’ genome; therefore, SSR has the potential to be an alternative approach for variety identification and correlation analysis.

4.2. Conservation and Variety Specificity of the SSR Distribution Pattern of Grape Cultivars

Although the genome assembly sizes of the nine grape varieties analyzed in this study are different (‘Cabernet Sauvignon’, 591.0 Mb; ‘Carménère’, 622.8 Mb; ‘Chardonnay’, 606.0 Mb; ‘Merlot’, 606.1 Mb; ‘Muscat Hamburg’, 457.0Mb; ‘PN40024’, 486.0 Mb;‘Riesling’, 741.8 Mb; ‘Shine Muscat’, 484.89 Mb; ‘Zinfandel’, 591.20 Mb), we found that the SSR distribution pattern was conservative in these grape varieties. Firstly, the nine grape cultivated varieties have the same mononucleotide, dinucleotide, and trinucleotide types, and the main motif types are A/T, AT/AT, and AAT/ATT. Although distinct kinds of tetranucleotides, pentanucleotides, and hexanucleotides show varying degrees of deletion, the fundamental nucleotide motif types are essentially the same. The evolutionary mechanism of generating and maintaining high-order repeats is conservative in grape genomes [56]. These results suggest that the characteristics of SSRs may be species dependent and may be related to their evolution and adaptation. In general, SSR distribution patterns are consistent with species differentiation [57]. The number and length of varieties are obviously different. The difference in motif length and frequency between genomic and gene SSRs is likely due to gene SSRs’ selection pressure, which limits mutation fixation, resulting in a frameshift. [18]. SSR is mainly caused by replication slip, resulting in the addition or deletion of repeat motifs in the plant genome. Therefore, specific numbers and lengths of SSRs may reflect the evolutionary history of specific species and their relatives [58].

4.3. Grape Genome Sequencing to Construct a Grape Variety Evolutionary Tree and Reveal Its Potential Genetic Relationship

Through an evolutionary tree constructed based on genome sequencing data, we found that Chardonnay and Riesling are closely related. These two varieties may have common ancestors, which is consistent with the results of previous studies [59]. DNA fingerprint analysis of ‘Chardonnay’ shows that one of the ancestors of this noble grape is the “civilian” of grape cultivation. Modern DNA fingerprinting studies at the University of California, Davis, show that Chardonnay is the result of hybridization between ‘PN40024’ and the rare ‘Gouais blanc’ (also known as ‘Heunisch Weiss’) grape variety. These two varieties are widely distributed in northeast France [59]. Riesling was once thought to be a wild vine native to the Rhine area, although there is little evidence to back up this statement. According to DNA fingerprinting, one of Riesling’s parents is ‘Gouais blanc’ [60]. Similar to ‘Gouais blanc’, ‘Kyoho’ and ‘Muscat Hamburg’ are related to many important varieties. Those varieties with good characters are applied to many breeding works. This has resulted in the narrow genetic relationship of grapes, and also created difficulties for variety identification. Therefore, a large number of SSR primers have been developed to help clarify the genetic relationship between them. Compared with the nine commonly used primers (VVS2, VVMD5, VVMD7, VVMD25, VVMD27, VVMD28, VVMD32, VZAG79 and VZAG62) (www.vivc.de (accessed on 20 March 2022)) and the SNP marker, genome-based SSR markers have the advantages of high precision and low price. These markers with more readable bands can be used for cultivar identification and traceability.

5. Conclusions

In this study, we identified 286,192 to 627,429 SSR motifs among nine grape genomes. Of these, the dominant SSR motif type in grapes is rich in A/T, AT/AT, AAT/ATT, and AAAT/ATTT while there are some differentiated motifs such as AC/GT and C/G. We then designed 80 SSR primer pairs and validated these by PCR amplification. Among them, there are 32 pairs of primers that can be used to assess the genetic diversity of grape samples. The SSR molecular markers discovered in this work will aid grape breeding, germplasm resource identification, and gene mining of critical agronomic features, all of which will assist speeding up the directional breeding process.

Supplementary Materials

The following supporting information can be downloaded at: https://www.mdpi.com/article/10.3390/genes14030663/s1, Figure S1: Relationship between the number of SSRs in grape genome and the size of genome assembly; Figure S2: Relationship between grape genome size and SSR distribution density; Figure S3: PCR amplification of SSR primer in eight random DNA. M: DL2000; Sample 1 8. a: 1 3; b: 1 4; c 1 5; d: 1 6; e: 1 10; f: 2 4; g: 3 1; h: 3 2; i: 3 7; j: 3 8; k: 3 9; l: 4 2; Figure S4: PCR amplification of SSR primer in eight random DNA. M: DNA Ladder; Sample 1-8. a: 4-3; b: 4-4; c:4-6; d: 4-8; e: 4-9; f: 5-3; g: 5-4; h: 5-5; i: 5-7; j: 5-10; k: 5-12; l: 5-16; Table S1: The distribution of the number of microsatellites on chromosomes; Table S2: The distribution density of microsatellites on chromosomes; Table S3: SSR type and number of nine cultivars; Table S4: The repeating times of the different repeat motifs in different cultivars; Table S5: The genome annotation of Chardonnay; Table S6: Validation of SSR motifs and polymorphisms for 80 primer pairs.

Author Contributions

Conceptualization, D.P.; methodology, J.F.; software, C.Z.; validation, J.W.; formal analysis, T.P.; investigation, D.P. and J.K.; resources, P.Z.; data curation, T.D. and M.G.; writing—original draft preparation, D.P., S.S. and J.K.; writing—review and editing, S.S.; visualization, C.Z.; supervision, J.F.; funding acquisition, J.F. All authors have read and agreed to the published version of the manuscript.

Funding

This research was funded by Jiangsu Provincial Agricultural Science and Technology Independent Innovation Fund Project, CX(21)3023; National Key Research and Development Program of China, 2019YFD1000101; Jiangsu Agricultural Industry Technology System, JATS [2022]457.

Institutional Review Board Statement

Not applicable.

Informed Consent Statement

Not applicable.

Data Availability Statement

Not applicable.

Conflicts of Interest

The authors declare no conflict of interest.

References

  1. Varshney, R.K.; Graner, A.; Sorrells, M.E. Genic microsatellite markers in plants: Features and applications. Trends Biotechnol. 2005, 23, 48–55. [Google Scholar] [CrossRef] [PubMed]
  2. Grover, A.; Sharma, P.C. Development and use of molecular markers: Past and present. Crit. Rev. Biotechnol. 2016, 36, 290–302. [Google Scholar] [CrossRef] [PubMed]
  3. Kantartzi, S.K. Microsatellites: Methods and Protocols; Springer: New York, NY, USA, 2013; pp. 1–13. [Google Scholar]
  4. O’Hanlon, P.C.; Peakall, R.; Briese, D.T. A review of new PCR-based genetic markers and their utility to weed ecology. Weed Res. 2000, 40, 239–254. [Google Scholar] [CrossRef]
  5. Powell, W.; Machray, G.C.; Provan, J. Polymorphism revealed by simple sequence repeats. Trends Plant Sci. 1996, 1, 215–222. [Google Scholar] [CrossRef]
  6. Schlötterer, C. The evolution of molecular markers-just a matter of fashion? Nat. Rev. Genet. 2004, 5, 63–69. [Google Scholar] [CrossRef] [PubMed]
  7. Agarwal, M.; Shrivastava, N.; Padh, H. Advances in molecular marker techniques and their applications in plant sciences. Plant Cell Rep. 2008, 27, 617–631. [Google Scholar] [CrossRef]
  8. Zarouri, B.; Vargas, A.M.; Gaforio, L.; Aller, M.; de Andrés, M.T.; Cabezas, J.A. Whole-genome genotyping of grape using a panel of microsatellite multiplex PCRs. Tree Genet. Genomes 2015, 11, 17. [Google Scholar] [CrossRef] [Green Version]
  9. Singh, R.K.; Jena, S.N.; Khan, S.; Yadav, S.; Banarjee, N.; Raghuvanshi, S.; Bhardwaj, V.; Dattamajumder, S.K.; Kapur, R.; Solomon, S.; et al. Development, cross-species/genera transferability of novel EST-SSR markers and their utility in revealing population structure and genetic diversity in sugarcane. Gene 2013, 524, 309–329. [Google Scholar] [CrossRef]
  10. Haq, S.U.; Kumar, P.; Singh, R.K.; Verma, K.S.; Bhatt, R.; Sharma, M.; Kachhwaha, S.; Kothari, S.L. Assessment of functional EST-SSR markers (sugarcane) in cross-species transferability, genetic diversity among Poaceae plants, and bulk segregation analysis. Genet. Res. Int. 2016, 2016, 7052323. [Google Scholar]
  11. Upadhyay, A.; Kadam, U.S.; Chacko, P.; Aher, L.; Karibasappa, G.M. Microsatellite analysis to differentiate clones of thompson seedless grapevine. Indian J. Hortic. 2010, 67, 260. [Google Scholar]
  12. Upadhyay, A.; Kadam, U.S.; Priya, C.M.; Karibasappa, G.S. Microsatellite and RAPD analysis of grape (Vitis spp.) accessions and identification of duplicates/misnomers in germplasm collection. Indian J. Hortic. 2010, 67, 8. [Google Scholar]
  13. Pinto, L.R.; Oliveira, K.M.; Marconi, T.; Garcia, A.A.F.; Ulian, E.C.; DeSouza, A.P. Characterization of novel sugarcane expressed sequence tag microsatellites and their comparison with genomic SSRs. Plant Breed. 2006, 125, 378–384. [Google Scholar] [CrossRef]
  14. La Rota, M.; Kantety, R.V.; Yu, J.K.; Sorrells, M.E. Nonrandom distribution and frequencies of genomic and EST-derived microsatellite markers in rice, wheat, and barley. BMC Genom. 2005, 6, 23. [Google Scholar] [CrossRef] [PubMed] [Green Version]
  15. Saha, M.C.; Mian, R.; Zwonitzer, J.C.; Chekhovskiy, K.; Hopkins, A.A. An SSR- and AFLP-based genetic linkage map of tall fescue (Festuca arundinacea Schreb.). Theor. Appl. Genet. 2005, 110, 323–336. [Google Scholar] [CrossRef]
  16. Lagercrantz, U.; Ellegren, H.; Andersson, L. The abundance of various polymorphic microsatellite motifs differs between plants and vertebrates. Nucl. Acids. Res. 1993, 21, 1111–1115. [Google Scholar] [CrossRef] [Green Version]
  17. Roa, A.C.; Chavarriaga-Aguirre, P.; Duque, M.C.; Maya, M.M.; Bonierbale, M.W.; Iglesias, C.; Tohme, J. Cross-species amplification of cassava (Manihot esculenta) (Euphorbiaceae) microsatellites: Allelic polymorphism and degree of relationship. Am. J. Bot. 2000, 87, 1647–1655. [Google Scholar] [CrossRef]
  18. Abuzayed, M.A.; Goktay, M.; Allmer, J.; Doganlar, S. Development of genomic simple sequence repeat markers in faba bean by next-generation sequencing. Plant Mol. Biol. Rep. 2017, 35, 61–71. [Google Scholar] [CrossRef]
  19. Gil, J.S.; Um, Y.; Kim, S.; Kim, O.K.; Koo, S.C.; Reddy, C.S.; Kim, S.C.; Hong, C.P.; Park, S.G.; Kim, H.B.; et al. Development of genome-wide SSR markers from Angelica gigas nakai using next generation sequencing. Genes 2017, 8, 238. [Google Scholar] [CrossRef]
  20. Jaillon, O.; Aury, J.M.; Noel, B.; Policriti, A.; Clepet, C.; Casagrande, A.; Choisne, N.; Aubourg, S.; Vitulo, N.; Jubin, C.; et al. French-Italian Public Consortium for Grapevine Genome Characterization. The grapevine genome sequence suggests ancestral hexaploidization in major angiosperm phyla. Nature 2007, 449, 463–467. [Google Scholar]
  21. Shirasawa, K.; Hirakawa, H.; Azuma, A.; Taniguchi, F.; Yamamoto, T.; Sato, A.; Ghelfi, A.; Isobe, S.N. De novo whole-genome assembly in an interspecific hybrid table grape, ‘Shine Muscat’. DNA Res. 2022, 29, dsac040. [Google Scholar] [CrossRef]
  22. Zhao, J.; Huang, L.; Ren, X.; Pandey, M.K.; Wu, B.; Chen, Y.; Zhou, X.; Chen, W.; Xia, Y.; Li, Z.; et al. Genetic variation and association mapping of seed-related traits in cultivated peanut (Arachis hypogaea L.) using single-locus simple sequence repeat markers. Front. Plant Sci. 2017, 8, 2105. [Google Scholar] [CrossRef] [PubMed] [Green Version]
  23. Gyawali, S.; Harrington, M.; Durkin, J.; Horner, K.; Parkin, I.A.; Hegedus, D.D.; Bekkaoui, D.; Buchwaldt, L. Microsatellite markers used for genome-wide association mapping of partial resistance to Sclerotinia sclerotiorum in a world collection of Brassica napus. Mol. Breed. 2016, 36, 72. [Google Scholar] [CrossRef] [PubMed] [Green Version]
  24. Zalapa, J.E.; Cuevas, H.; Zhu, H.; Steffan, S.; Senalik, D.; Zeldin, E.; McCown, B.; Harbut, R.; Simon, P. Using next-generation sequencing approaches to isolate simple sequence repeat (SSR) loci in the plant sciences. Am. J. Bot. 2012, 99, 193–208. [Google Scholar] [CrossRef] [PubMed] [Green Version]
  25. Zhou, Y.W.; Wei, X.; Abbas, F.; Yu, Y.Y.; Yu, R.C.; Fan, Y.P. Genome-wide identification of simple sequence repeats and assessment of genetic diversity in Hedychium. J. Appl. Res. Med. Aroma 2021, 24, 100312. [Google Scholar] [CrossRef]
  26. Liao, Z.; Chen, M.; Guo, L.; Gong, Y.; Tang, F.; Sun, X.; Tang, K. Rapid isolation of high-quality total RNA from taxus and ginkgo. Prep. Biochem. Biotechnol. 2004, 34, 209–214. [Google Scholar] [CrossRef]
  27. Chin, C.S.; Peluso, P.; Sedlazeck, F.J.; Nattestad, M.; Concepcion, G.T.; Clum, A.; Dunn, C.; O’Malley, R.; Figueroa-Balderas, R.; Morales-Cruz, A.; et al. Phased diploid genome assembly with single-molecule real-time sequencing. Nat. Methods 2016, 13, 1050–1054. [Google Scholar] [CrossRef] [Green Version]
  28. Minio, A.; Cochetel, N.; Vondras, A.; Massonnet, M.; Cantu, D. Assembly of complete diploid phased chromosomes from draft genome sequences. bioRxiv 2021, 1–8. [Google Scholar] [CrossRef]
  29. Minio, A.; Massonnet, M.; Figueroa-Balderas, R.; Vondras, A.M.; Blanco-Ulate, B.; Cantu, D. Iso-seq allows genome-independent transcriptome profiling of grape berry development. G3 Genes Genom. Genet. 2019, 9, 755–767. [Google Scholar] [CrossRef] [Green Version]
  30. Minio, A.; Massonnet, M.; Figueroa-Balderas, R.; Castro, A.; Cantu, D. Diploid genome assembly of the wine grape Carménère. G3 Genes Genom. Genet. 2019, 9, 1331–1337. [Google Scholar] [CrossRef] [Green Version]
  31. Zhou, Y.F.; Minio, A.; Massonnet, M.; Solares, E.; Lv, Y.D.; Beridze, T.; Cauto, D.; Gaut, B.S. The population genetics of structural variants in grapevine domestication. Nat. Plants 2019, 5, 965–979. [Google Scholar] [CrossRef]
  32. Massonnet, M.; Cochetel, N.; Minio, A.; Vondras, A.M.; Lin, J.; Muyle, A.; Garcia, J.F.; Zhou, Y.; Delledonne, M.; Riaz, S.; et al. The genetic basis of sex determination in grapes. Nat. Commun. 2020, 11, 2902. [Google Scholar] [CrossRef] [PubMed]
  33. Zou, C.; Massonnet, M.; Minio, A.; Patel, S.; Llaca, V.; Karn, A.; Gouker, F.; Cadle-Davidson, L.; Reisch, B.; Fennell, A.; et al. Multiple independent recombinations led to hermaphroditism in grapevine. Proc. Natl. Acad. Sci. USA 2021, 118, e2023548118. [Google Scholar] [CrossRef] [PubMed]
  34. Vondras, A.M.; Minio, A.; Blanco-Ulate, B.; Figueroa-Balderas, R.; Penn, M.A.; Zhou, Y.; Seymour, D.; Ye, Z.; Liang, D.; Espinoza, L.K.; et al. The genomic diversification of grapevine clones. BMC Genom. 2019, 20, 972. [Google Scholar] [CrossRef] [Green Version]
  35. Vitulo, N.; Forcato, C.; Carpinelli, E.C.; Telatin, A.; Campagna, D.; D’Angelo, M.; Zimbello, R.; Corso, M.; Vannozzi, A.; Bonghi, C.; et al. A deep survey of alternative splicing in grape reveals changes in the splicing machinery related to tissue, stress condition and genotype. BMC Plant Biol. 2014, 14, 99. [Google Scholar] [CrossRef] [PubMed] [Green Version]
  36. Canaguier, A.; Grimplet, J.; Di Gaspero, G.; Scalabrin, S.; Duchêne, E.; Choisne, N.; Mohellibi, N.; Guichard, C.; Rombauts, S.; Le Clainche, I.; et al. A new version of the grapevine reference genome assembly (12X.v2) and of its annotation (VCost.v3). Genom. Data 2017, 14, 56–62. [Google Scholar] [CrossRef]
  37. Sawata, Y.; Matsukawa, T.; Doi, S.; Tsunoda, T.; Arikawa, N.; Matsunaga, N.; Ohnuki, K.; Shirasawa, S.; Kotake, Y. A novel compound, ferulic acid-bound resveratrol, induces the tumor suppressor gene p15 and inhibits the three-dimensional proliferation of colorectal cancer cells. Mol. Cell. Biochem. 2019, 462, 25–31. [Google Scholar] [CrossRef]
  38. Shi, J.Q.; Huang, S.M.; Fu, D.H.; Yu, J.Y.; Wang, X.F.; Hua, W.; Liu, S.Y.; Liu, G.H. Evolutionary dynamics of microsatellite distribution in plants: Insight from the comparison of sequenced Brassica, Arabidopsis and other angiosperm species. PLoS ONE 2013, 8, e59988. [Google Scholar] [CrossRef] [Green Version]
  39. Rozen, S.; Skaletsky, H. Primer3 on the WWW for general users and for biologist programmers. Methods Mol. Biol. 2000, n132, 365–386. [Google Scholar]
  40. Chory, J.; Baldwin, A.S. Nondenaturing Polyacrylamide Gel Electrophoresis: Preparation and Analysis of DNA. Curr. Protoc. Mol. Biol. 1994, 25, 2.7.1–2.7.8. [Google Scholar] [CrossRef]
  41. Anderson, J.A.; Churchill, G.A.; Autrique, J.E.; Tanksley, S.D.; Sorrells, M.E. Optimizing parental selection for genetic linkage maps. Genome 1993, 36, 181–186. [Google Scholar] [CrossRef]
  42. Krzywinski, M.; Schein, J.; Birol, I.; Connors, J.; Gascoyne, R.; Horsman, D.; Jones, S.J.; Marra, M.A. Circos: An information aesthetic for comparative genomics. Genome Res. 2009, 19, 1639–1645. [Google Scholar] [CrossRef] [Green Version]
  43. Lee, T.H.; Guo, H.; Wang, X.; Kim, C.; Paterson, A.H. SNPhylo: A pipeline to construct a phylogenetic tree from huge SNP data. BMC Genom. 2014, 15, 162. [Google Scholar] [CrossRef] [Green Version]
  44. Willis, L.G.; Winston, M.L.; Honda, B.M. Phylogenetic relationships in the honeybee (genus Apis) as determined by the sequence of the cytochrome oxidase II region of mitochondrial DNA. Mol. Phylogenetics Evol. 1992, 1, 169–178. [Google Scholar] [CrossRef] [PubMed]
  45. Varshney, R.K.; Nayak, S.N.; May, G.D.; Jackson, S.A. Next-generation sequencing technologies and their implications for crop genetics and breeding. Trends Biotechnol. 2009, 27, 522–530. [Google Scholar] [CrossRef] [Green Version]
  46. Zhu, H.; Guo, L.; Song, P.; Luan, F.; Hu, J.; Sun, X.; Yang, L. Development of genome-wide SSR markers in melon with their cross-species transferability analysis and utilization in genetic diversity study. Mol. Breed. 2016, 36, 153. [Google Scholar] [CrossRef]
  47. Wang, Q.; Fang, L.; Chen, J.; Hu, Y.; Si, Z.; Wang, S.; Chang, L.; Guo, W.; Zhang, T. Genome-wide mining, characterization, and development of microsatellite markers in Gossypium species. Sci. Rep. 2015, 5, 10638. [Google Scholar] [CrossRef] [PubMed] [Green Version]
  48. Zhang, Z.; Deng, Y.; Tan, J.; Hu, S.; Yu, J.; Xue, Q. A genome-wide microsatellite polymorphism database for the indica and japonica rice. DNA Res. 2007, 14, 37–45. [Google Scholar] [CrossRef] [Green Version]
  49. Zhu, H.; Song, P.; Koo, D.H.; Guo, L.; Li, Y.; Sun, S.; Weng, Y.; Yang, L. Genome wide characterization of simple sequence repeats in watermelon genome and their application in comparative mapping and genetic diversity analysis. BMC Genom. 2016, 17, 557. [Google Scholar] [CrossRef] [PubMed] [Green Version]
  50. Zhu, J.F.; Zhang, J.Y.; Jiang, M.Y.; Wang, W.R.; Zhou, X.R. Development of genome-wide SSR markers in rapeseed by next generation sequencing. Gene 2021, 798, 145798. [Google Scholar] [CrossRef]
  51. Cui, J.; Cheng, J.; Nong, D.; Peng, J.; Hu, Y.; He, W.; Zhou, Q.; Dhillon, N.P.S.; Hu, K. Genome-wide analysis of simple sequence repeats in bitter gourd (Momordica charantia). Front. Plant Sci. 2017, 8, 1103. [Google Scholar] [CrossRef] [Green Version]
  52. Cheng, J.; Zhao, Z.; Li, B.; Qin, C.; Wu, Z.; Trejo-Saavedra, D.L.; Luo, X.; Cui, J.; Rivera-Bustamante, R.F.; Li, S.; et al. A comprehensive characterization of simple sequence repeats in pepper genomes provides valuable resources for marker development in Capsicum. Sci. Rep. 2016, 6, 18919. [Google Scholar] [CrossRef] [PubMed] [Green Version]
  53. Deng, P.; Wang, M.; Feng, K.; Cui, L.; Tong, W.; Song, W.; Nie, X. Genome-wide characterization of microsatellites in Triticeae species: Abundance, distribution and evolution. Sci. Rep. 2016, 6, 32224. [Google Scholar] [CrossRef] [PubMed] [Green Version]
  54. Ellegren, H. Microsatellites: Simple sequences with complex evolution. Nat. Rev. Genet. 2004, 5, 435–445. [Google Scholar] [CrossRef] [PubMed]
  55. Morgante, M.; Hanafey, M.; Powell, W. Microsatellites are preferentially associated with nonrepetitive DNA in plant genomes. Nat. Genet. 2002, 30, 194–200. [Google Scholar] [CrossRef] [PubMed]
  56. Li, Y.C.; Korol, A.B.; Fahima, T.; Beiles, A.; Nevo, E. Microsatellites: Genomic distribution, putative functions and mutational mechanisms: A review. Mol. Ecol. 2002, 11, 2453–2465. [Google Scholar] [CrossRef]
  57. Zhang, L.; Peng, J.; Li, X.; Cui, C.; Sun, J.; Yang, G. Characterization of genome-wide microsatellites of Saccharina japonica based on a preliminary assembly of Illumina sequencing reads. J. Ocean Univ. China 2016, 15, 523–532. [Google Scholar] [CrossRef]
  58. Han, B.; Wang, C.; Tang, Z.; Ren, Y.; Li, Y.; Zhang, D.; Dong, Y.; Zhao, X. Genome-wide analysis of microsatellite markers based on sequenced database in Chinese spring wheat (Triticum aestivum L.). PLoS ONE 2015, 10, e0141540. [Google Scholar] [CrossRef] [Green Version]
  59. Bowers, J.E.; Dangl, G.S.; Meredith, C.P. Development and characterization of additional microsatellite DNA markers for grape. Am. J. Enol. Viticult. 1999, 50, 243–246. [Google Scholar] [CrossRef]
  60. Röckel, F.; Moock, C.; Schwander, F.; Maul, E.; Töpfer, R.; Hausmann, L. A 69 kbp Deletion at the Berry Color Locus Is Responsible for Berry Color Recovery in Vitis vinifera L. Cultivar ‘Riesling Rot’. Int. J. Mol. Sci. 2022, 23, 3708. [Google Scholar] [CrossRef]
Figure 1. Overall view of the motif distribution of SSRs and SNP density in the genome of nineteen ‘PN40024’ chromosomes (chr1–chr19) was assembled by Hi-C. (a) SSR; (b) SNP.
Genes 14 00663 g001
Figure 2. Number and density distribution of SSRs on 19 chromosomes in the genome of cv. ‘PN40024’. The bar graph shows the number of SSR loci. The linear graph shows the density of SSR loci. The horizontal ordinate is chromosome number, vertical coordinates are number of SSR motifs and SSR motif density, respectively.
Genes 14 00663 g002
Figure 3. Distribution of SSR motif number (a) and proportion (b) in genome sequences of different grape varieties.
Genes 14 00663 g003
Figure 4. The overall lengths (a) and proportion (b) of microsatellites in genome sequences of different grape varieties.
Genes 14 00663 g004
Figure 5. Construction of a grape variety evolutionary tree based on a simple repeat sequence.
Genes 14 00663 g005
Figure 6. Construction of a grape variety evolutionary tree based on SNPs.
Genes 14 00663 g006
Figure 7. PCR amplification of SSR primers in eight random DNA. M: DNA ladder; sample 1-8. (a): 5-14; (b): 5-19; (c): 5-20; (d): 6-2; (e): 6-3; (f): 6-4; (g): 6-6; (h): 6-15.
Genes 14 00663 g007
Table 1. Total frequency of SSRs in grape cultivars.
CultivarsSSRs NumberGC (%)Genome Length (Mb)Frequency
Per MbOne Every (Kb)
‘Cabernet Sauvignon’572,97634.61591.0969.501.03
‘Carménère’627,42934.45622.81007.430.99
‘Chardonnay’561,63534.34606.0926.791.08
‘Merlot’481,49134.56606.1794.411.26
‘Muscat Hamburg’286,19234.61457.0626.241.60
‘PN40024’297,65934.55486.0612.071.63
‘Riesling’470,67034.43741.8634.501.58
‘Shine Muscat’308,36534.49484.9635.941.57
‘Zinfandel’537,60634.42591.2909.351.10
Table 2. Analysis of repeat motif types in grape genome.
Repeat TypeRepeat MotifNumberProportion (%)Frequency
MononucleotideA/T196,103–419,27865.334–68.6590.4579–0.5442
C/G4014–95091.341–1.7780.0134–0.0186
DinucleotideAT/AT34,612–81,60211.937–13.3870.1666–0.1797
AG/CT13,551–30,5514.5270–5.1630.529–0.571
AC/GT4403–10,2181.522–1.7270.0167–0.0178
CG/CG21–500.0070–0.01000.001
TrinucleotideAAT/ATT19,253–44,4826.702–7.4340.0888–0.0953
AAG/CTT2884–67690.9700–1.11110.0113–0.0124
ACC/GGT702–14740.2300–0.26200.0025–0.0029
AAC/GTT631–14880.2120–0.25000.0024–0.0029
AGG/CCT509–11100.1610–0.18900.0019–0.0020
ACT/AGT179–4180.0620–0.07700.0008–0.0010
CCG/CGG70–1700.0240–0.03100.0002–0.0003
ACG/CGT62–1430.0200–0.02400.0002
TetranucleotideAAAT/ATTT4156–93701.396–1.5450.0187–0.0200
AATT/AATT475–11000.1600–0.18100.0021–0.0022
AAAG/CTTT429–9690.1450–0.17100.0021–0.0022
ACAT/ATGT321–7430.1100–0.13000.0018–0.0020
AAAC/GTTT198–4370.0640–0.07500.0008–0.0010
AGAT/ATCT146–3680.0490–0.06000.0008–0.0009
AGGG/CCCT88–2090.0260–0.03600.0004–0.0005
PentanucleotideAAAAT/ATTTT530–11690.1680–0.20900.0027–0.0034
AAATT/AATTT48–1120.0120–0.01800.0002–0.0003
AATAT/ATATT41–980.0140–0.01800.0003
AAAAC/GTTTT37–840.0100–0.01600.0001–0.0002
CCCCG/CGGGG30–530.0070–0.01200.0001–0.0002
AAAGG/CCTTT15–370.0040–0.00700.0001
HexanucleotideAAAAAT/ATTTTT77–1700.0220–0.03200.0004–0.0006
AAAAAG/CTTTTT75–1740.0190–0.03000.0004–0.0006
AGAGGG/CCCTCT22–580.0060–0.01000.0001–0.0002
AAAAAC/GTTTTT13–320.0040–0.00600.0001
ACTCCC/AGTGGG7–280.0020–0.00500.0000–0.0001
AAAAGG/CCTTTT5–200.0020–0.00300.0000–0.0001
Table 3. Distribution of SSR motif types in the ‘Chardonnay’ genome.
Mono-Di-Tri-Tetra-Penta-Hexa-
Total number227,07856,38825,23066791090409
Between genes160,94739,10417,9374973790250
Within genesExon281186136311346
Others44,46611,9703670110719983
Others21,384512822605889830
Disclaimer/Publisher’s Note: The statements, opinions and data contained in all publications are solely those of the individual author(s) and contributor(s) and not of MDPI and/or the editor(s). MDPI and/or the editor(s) disclaim responsibility for any injury to people or property resulting from any ideas, methods, instructions or products referred to in the content.

