Article

The Complete Mitochondrial Genome of Mytilisepta virgata (Mollusca: Bivalvia), Novel Gene Rearrangements, and the Phylogenetic Relationships of Mytilidae

1
National Engineering Research Center for Marine Aquaculture, Zhejiang Ocean University, Zhoushan 316022, China
2
Shengsi Marine Science and Technology Institute, Shengsi, Zhoushan 202450, China
3
Key Laboratory of Sustainable Utilization of Technology Research for Fisheries Resources of Zhejiang Province, Scientific Observing and Experimental Station of Fishery Resources for Key Fishing Grounds, Ministry of Agriculture and Rural Affairs of China, Zhejiang Marine Fisheries Research Institute, Zhoushan 316021, China
*
Authors to whom correspondence should be addressed.
Genes 2023, 14(4), 910; https://doi.org/10.3390/genes14040910
Submission received: 6 February 2023 / Revised: 10 April 2023 / Accepted: 10 April 2023 / Published: 13 April 2023
(This article belongs to the Special Issue Mitochondrial DNA Replication and Transcription)

Abstract

:
The circular mitochondrial genome of Mytilisepta virgata spans 14,713 bp, which contains 13 protein-coding genes (PCGs), 2 ribosomal RNA genes, and 22 transfer RNA genes. Analysis of the 13 PCGs reveals that the mitochondrial gene arrangement of Mytilisepta is relatively conserved at the genus level. The location of the atp8 gene in Mytilisepta keenae differs from that of other species. However, compared with the putative molluscan ancestral gene order, M. virgata exhibits a high level of rearrangement. We constructed phylogenetic trees based on concatenated 12 PCGs from Mytilidae. As a result, we found that M. virgata is in the same clade as other Mytilisepta spp. The result of estimated divergence times revealed that M. virgata and M. keenae diverged around the early Paleogene period, although the oldest Mytilisepta fossil was from the late or upper Eocene period. Our results provide robust statistical evidence for a sister-group relationship within Mytilida. The findings not only confirm previous results, but also provide valuable insights into the evolutionary history of Mytilidae.

1. Introduction

The mitochondrial genome (mitogenome) is regarded as a good model of phylogenetics in the investigation of species due to its small molecular weight and maternal inheritance [1]. With the rapid advancement of next-generation sequencing (NGS) technology, there was a significant reduction in the cost of DNA sequencing, and analyses of the complete mitochondrial genomes (mitogenomes) have gained popularity in recent years for phylogenetic investigations [2,3]. Compared to nuclear genes, mitochondrial DNA sequences can provide more informative data for phylogenetic analysis, as well as multiple structural genomic features [4,5], such as gene length, compositional features, gene order, and the secondary structure of the encoded RNA. The typical metazoan mitogenome is generally a circular, double-stranded molecule ranging from 15 to 20 kb in size, and contains 37 genes: 2 for rRNAs, 13 for proteins, and 22 for tRNAs [6]. The family Mytilidae constitutes a major clade within Mytilida and includes approximately 88 extant genera containing 1632 species (World Register of Marine Species, https://www.marinespecies.org/ (accessed 6 September 2022)). The species among Mytilidae are represented by one of the largest numbers of cultivated and marketed bivalves, such as Mytilus spp., which are widely distributed in cold and temperate waters throughout the world’s oceans [7]. Furthermore, species of Perna spp. are well researched because of their significant economic and social importance in the aquaculture and fishing sectors [8]. The dominant rocky shore bivalve Xenostrobus securis Lamarck, 1819, and the freshwater bivalve Limnoperna fortunei Dunker, 1857, became invasive in the Northern Hemisphere [9]. Non-obvious small taxa such as Modiolarca subpicta, Cantraine, 1835 [10], and the taxa Mytilisepta virgata Wiegmann, 1837, have attracted less scientific attention. Many bivalve species exhibit a distinctive pattern of mitochondrial inheritance known as doubly uniparental inheritance (DUI) [11]. At present, no studies have reported whether there is DUI in the mitochondria of M. virgata.
The genus Mytilisepta (Habe, 1951) belongs to the family Mytilidae, and it contains three species: M. keenae Nomura, 1936; M. bifurcata Conrad, 1837; and M. virgata. The finely ribbed black mussel M. virgata, also known as Septifer virgatus, is widely distributed in Japan, Korea, and several locations along the coast of China and Hong Kong [12,13,14,15]. It usually forms in large mussel beds that contribute to providing refuge and a suitable habitat for diverse invertebrate marine species [16]. In comparison to other lower tidal sympatric mussel species, this mussel species is flatter ventrally, has a wider and firmer shell, and has a stronger byssal attachment for improved physical stability to deal with its rough environment [17]. From a taxonomic perspective, M. virgata has long been identified as a species from Septifer and was placed within the subfamily Septiferinae [18]. However, M. virgata and the majority of the other species formerly placed within Septiferinae were then moved to Mytilinae Rafinesque, 1815. It is thought that Mytilisepta is a junior synonym of Septifer, according to the revised hierarchical classification of the NCBI Taxonomy. An anterior internal umbilical septum of each valve is the most distinctive feature of the shells of the Septifer and Mytilisepta species, which provides the subfamily with its name [19]. Until now, only linear mitochondrial sequences and individual genes were available for species of M. virgata in the NCBI database.
In this study, we aimed to sequence the complete mitochondrial genome of M. virgata to increase taxon sampling for the genus Mytilisepta. We also analyzed the genomic features and evolutionary pattern of its mitogenome, including gene order, nucleotide composition, codon usage, and the secondary structure of tRNAs. Moreover, we performed a phylogenetic analysis of the subclass Pteriomorphia to evaluate the phylogenetic position of M. virgata. In addition, we integrated the gene arrangement of mitogenomes during evolution in Mytilidae to obtain accurate evolutionary relationships and determine the divergence time of the major lineages of Mytilisepta. Furthermore, we incorporated the new mitogenomes into the Mytilidae dataset to assist in clarifying contentious phylogenetic relationships associated with the family Mytilidae. In a broader sense, the phylogenetic tree of M. virgata and its corresponding gene order is important for higher taxonomic level genomic and systematic studies due to the uncertainties currently associated with deep relationships within the family Mytilidae.

2. Materials and Methods

2.1. Collection of Samples and DNA Extraction

Samples of M. virgata were collected from Gouqi Island (N 30°43′1.64″, E 122°46′3.25″) in the Zhejiang province of China in November 2020. The specimens were stored in 95% ethanol before DNA extraction. The total genomic DNA was extracted from the adductor muscle using the rapid salting-out method [20]. Then, the quality of the DNA was checked with 1% agarose gel electrophoresis and the DNA was preserved at −20 °C.

2.2. Sequencing, Assembly, and Annotation of Mitochondrial Genomes

The complete mitogenome of M. virgata was sequenced using next-generation sequencing by Origingene Bio-pharm Technology Co., Ltd. (Shanghai, China). The 1 μg DNA was first cut into approximately 300–500 bp using a physical ultrasonic method (Covaris M220). Then, the TruSeq Nano DNA Sample Prep Kit was used to complete the leveling of the 3′ end with a nucleotide before the ligation of index connectors. The DNA fragments after ligation were amplified by PCR (eight cycles). Subsequently, quantitative analysis was performed using TBS380 (Picogreen) and bridge PCR amplification on a cBot solid phase vector to generate clusters. Finally, 2 × 150 bp sequencing was conducted on the Illumina NovaSeq 6000 platform using total genomic DNA. Data quality control was performed using Trimmomatic v0.39 [21], which filtered out the adapter sequence in reads; the quality value of sequencing reads was less than that of the terminal reads of Q20 and the sequencing linker sequences. The clean data were reassembled using NOVOPlasty software (https://github.com/ndierckx/NOVOPlasty (accessed 6 September 2022)) without sequencing adapters [22]. To ensure the correctness of the sequence, we conducted NCBI BLAST searches based on the cox1 barcode sequence to identify the mitogenome sequence. The MITOS web server (http://mitos2.bioinf.uni-leipzig.de/index.py (accessed 6 September 2022)) was utilized to predict the new mitogenome of protein-coding genes (PCGs), tRNA, and rRNA genes, and redundancy for the predicted initial genes was removed. The initial and terminal codon positions were manually corrected by comparing them with sequences from other mussels to obtain a highly accurate set of conserved genes [23]. Moreover, we manually annotated sequences lacking atp8 by scanning the intergenic regions. ORFfinder (https://www.ncbi.nlm.nih.gov/orffinder/ (accessed 15 March 2023)) was used to find the ORFs (open reading frames). The starting codon of the atp8 sequences was corrected according to the sequences of related species.

2.3. Visualization and Comparative Analysis of the Genome

The sequence features of the mitochondrial circular genome of M. virgata were shown using the online CGView server [24]. The relative synonymous codon usage (RSCU) values were analyzed using MEGA X [25]. The composition skew values were calculated based on the ratio of AT-skew = (A − T)/(A + T); GC-skew = (G − C)/(G + C) [26]. An initial prediction of tRNA genes was performed using the MITOS web server, followed by re-identification utilizing invertebrate mitochondrial codons and default search patterns utilizing the tRNAscan-SE search server (http://lowelab.ucsc.edu/tRNAscan-SE/ (accessed 6 September 2022)) and ARWEN (http://130.235.244.92/ARWEN/ (accessed 6 September 2022)) [27,28].

2.4. Phylogenetic Analysis and Gene Order

The substitution saturation of 12 PCGs in the mitochondrial genome of 70 species was measured using the DAMBE software [29,30]. Based on the results, we used the nucleotide sequences of the 12 PCGs aligned according to default settings using the ClustalW algorithm in MEGA X [25] to construct maximum likelihood (ML) and Bayesian inference (BI) phylogenetic trees. Due to the high divergence, the atp8 gene was excluded from phylogenetic analysis. The sequences of 12 PCGs of the complete mitogenomes of 70 species from Mytilidae (Table S1) were used for the phylogenetic analysis.
Two Adapedonta species, Panopea globosa (NC_025636) and Panopea abrupta (NC_033538), were also included in the analysis as an outgroup. The phylogenetic relationships were analyzed using the ML method and constructed in IQ-TREE using the best-fit “GTR + F + R7” model with 1000 nonparametric bootstrapping replicates. The best ML model was selected based on ModelFinder software results [31,32]. The best-fit model (GTR + I + G) for each section was selected by the Akaike Information Criterion (AIC) in MrModeltest 2.3 [33], and then BI analysis was performed using MrBayes 3.2 associating PAUP 4.0 [34] and Modeltest 3.7 software in MrMTgui [34]. The BI analyses were conducted with Markov Chain Monte Carlo (MCMC) using default settings over three independent sets for 2,000,000 generations and were sampled every 1000 steps. The average standard deviation of split frequencies was <0.01, and the first 25% of samples were discarded as burn-in. The resulting phylogenetic tree was visualized through FigTree v1.4.3 (http://tree.bio.ed.ac.uk/software/figtree/ (accessed 6 September 2022)).

2.5. Estimation of Divergence Times

To better investigate the time of fossil differentiation of Mytilisepta, we selected 14 Mytilidae species, consisting of those belonging to Brachidontinae, Mytilinae, and Mytiliseptinae, to approximate the divergence times. The analysis was conducted with an uncorrelated relaxed clock, the lognormal relaxed molecular clock model, the random starting trees, and the Yule speciation model in BEAST v1.8.4 [35]. We selected two Mytilidae fossil calibration points to effectively increase the accuracy of the divergence time estimation. The node calibration points of Mytilus were constrained using a normal distribution prior to approximately 78.2 million years ago (Mya) and the roots Brachidontinae, Mytilisepta, and Mytilus were constrained between 334 Mya (http://www.timetree.org/ (accessed 5 March 2023)). Samples were taken from the posterior every 5000 steps for a total of 10,000,000 steps per MCMC run, and then 10% of the steps were discarded by TreeAnnotator v1.8.4 software (https://beast.community/treeannotator#user-interface (accessed 6 September 2022)) after confirming the convergence of the chains using Tracer v.1.6 [36]. The effective sample size of the majority of the parameters was above 200. The divergence times tree was visualized in FigTree v1.4.3 (http://tree.bio.ed.ac.uk/software/figtree/ (accessed 6 September 2022)).

3. Results

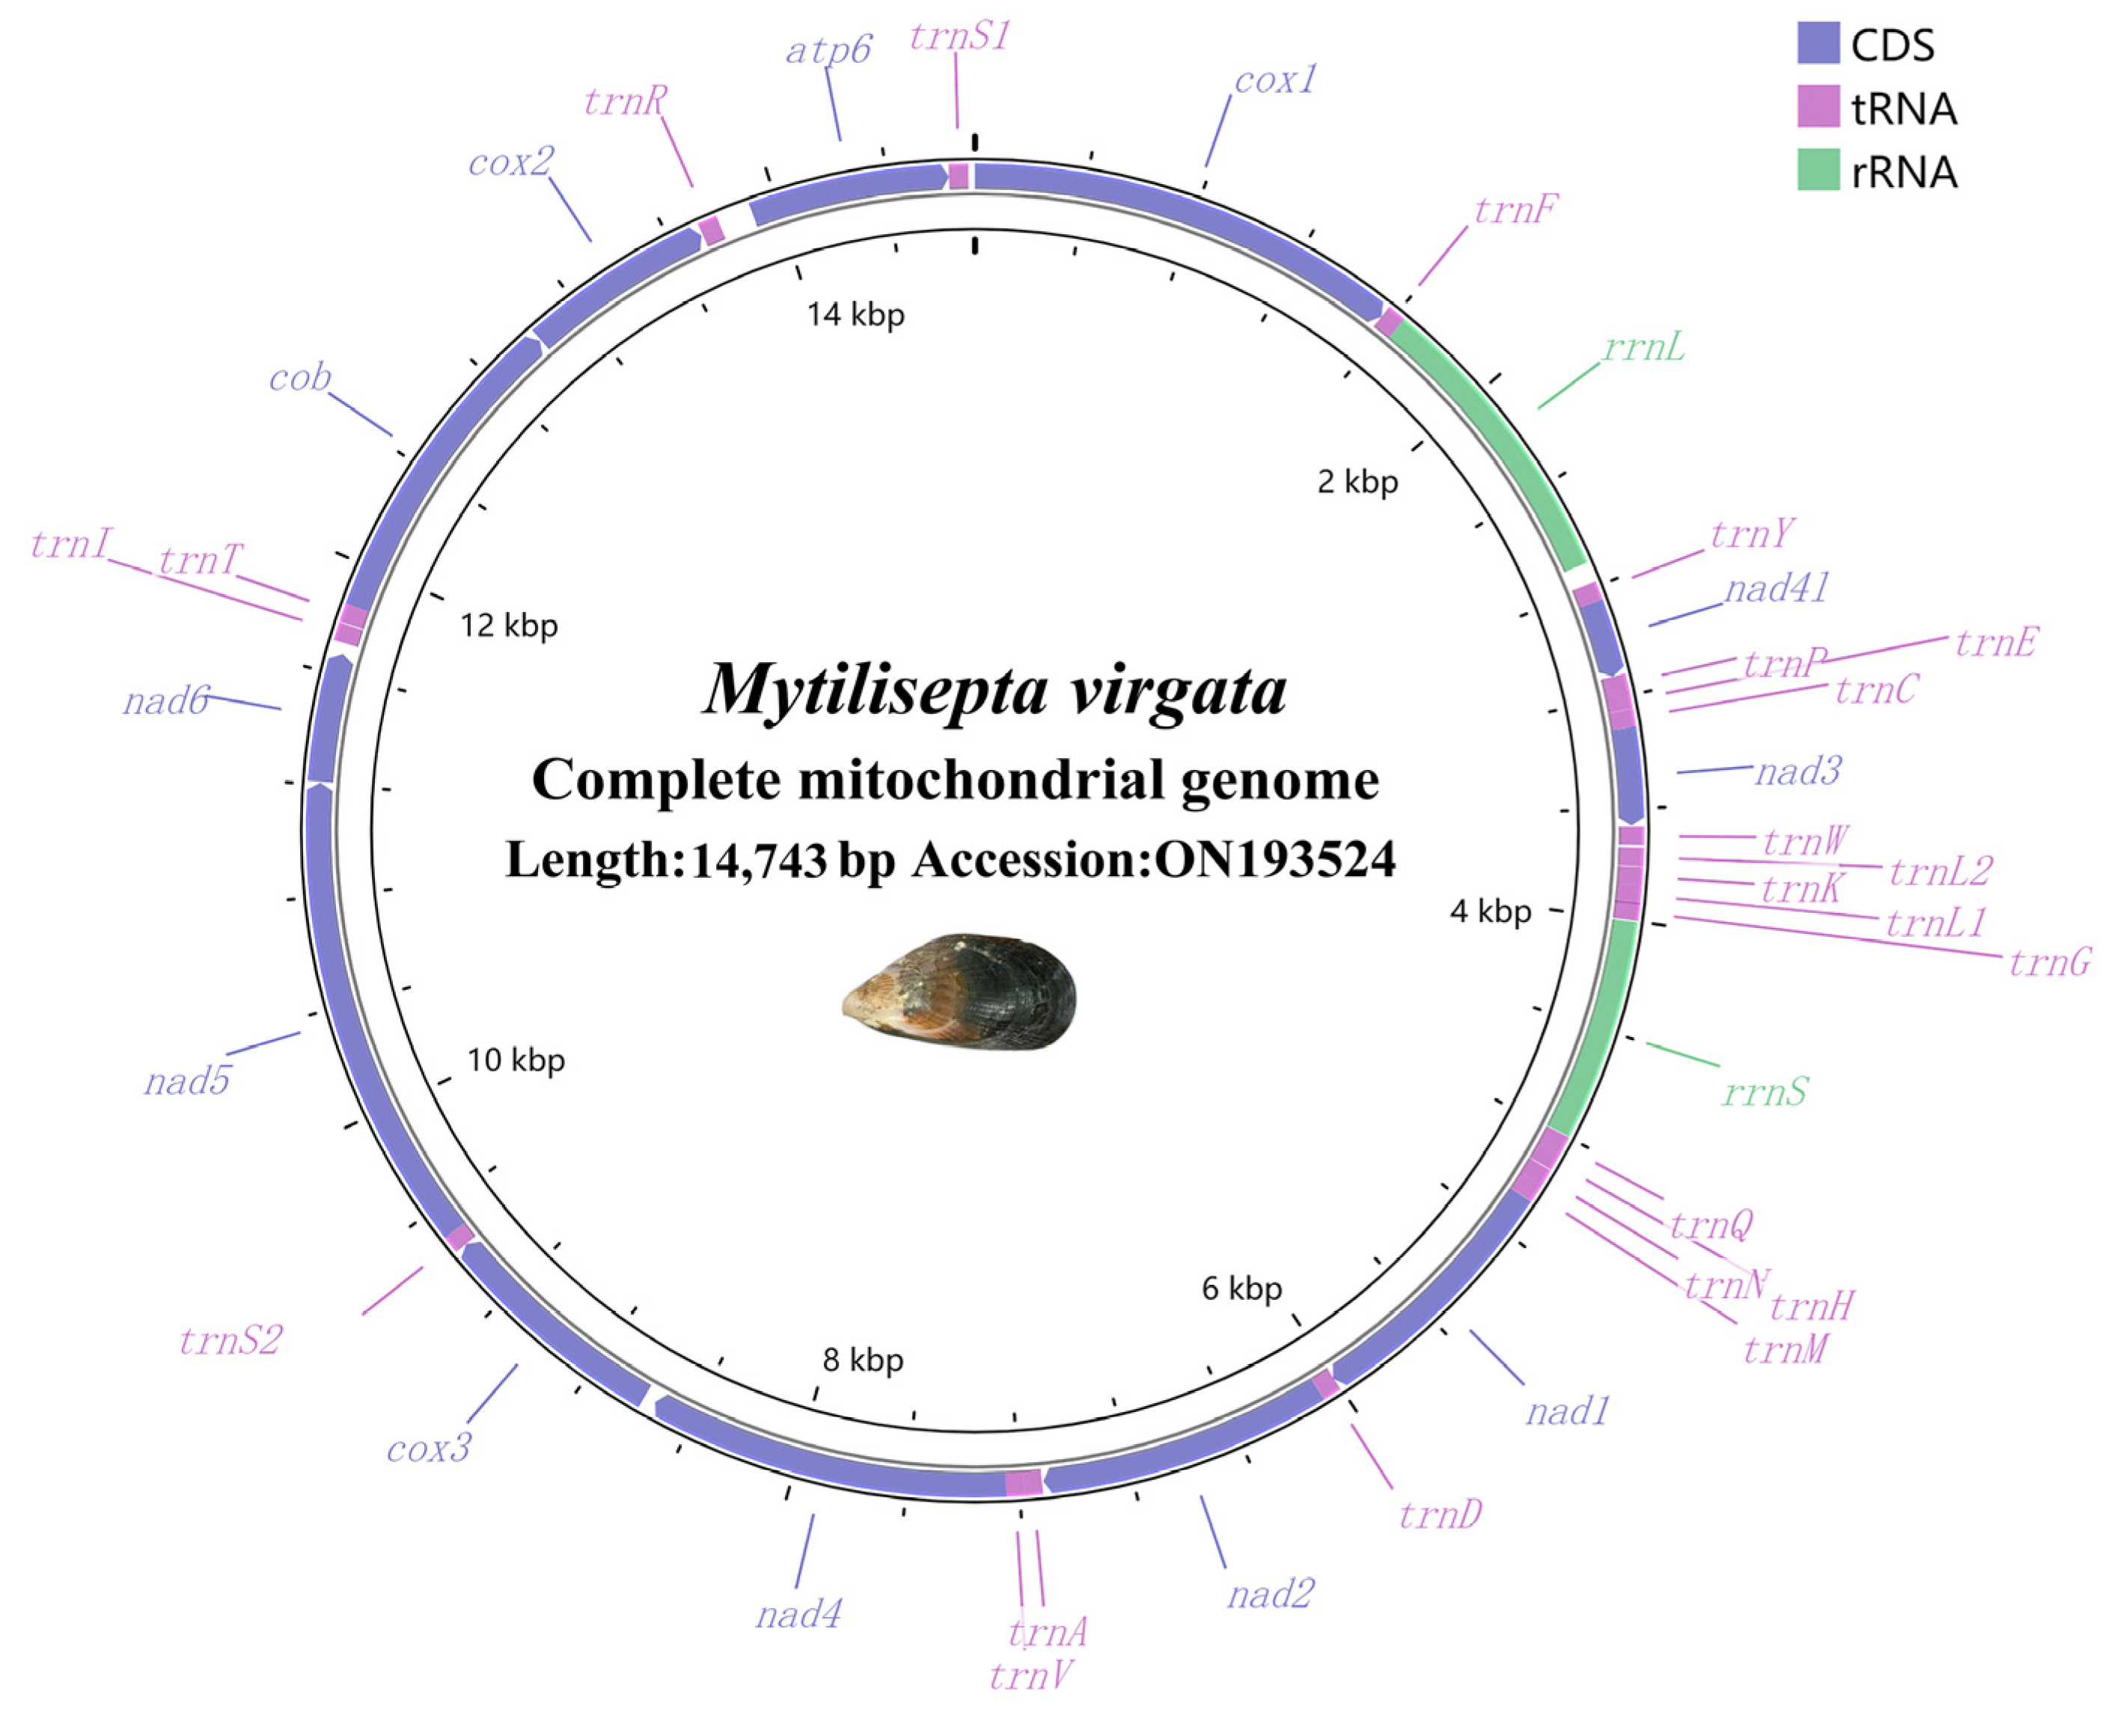
3.1. The Organization and Base Composition of the Genome

The raw sequencing data of the genome were 4854.2 Mb (SRA accession number: SRX19510287), and the clean data were 4831.3 Mb with a GC content of 33.22%; 6374 reads were obtained. The M. virgata mitogenome (GenBank accession number: ON193524) was 14,713 bp long. (Figure 1 and Table 1). It contained a common set of 37 mitochondrial genes including 2 rRNA genes, 13 PCGs, and 22 tRNA genes. The distribution of PCGs and RNAs indicated the common pattern of most Mytilidae mitogenomes: all 37 mitochondrial genes were encoded on the heavy chain [37,38], as reported for the majority of the Mytilidae spp. The nucleotide compositions were A = 25.75%, T = 43.56%, G = 20.97% and C = 9.73%, A + T = 69.36%, and G + C = 30.7% (Table 1). With an overall nucleotide composition biased toward AT, the M. virgata mitogenome suggested that significant strand asymmetry or chain-specific biases can be found in the Mollusca [39]. In addition, the highest A + T content was observed in the atp8 (73.64%). The A + T content of total PCGs was higher than that of total rRNA and total tRNA genes.

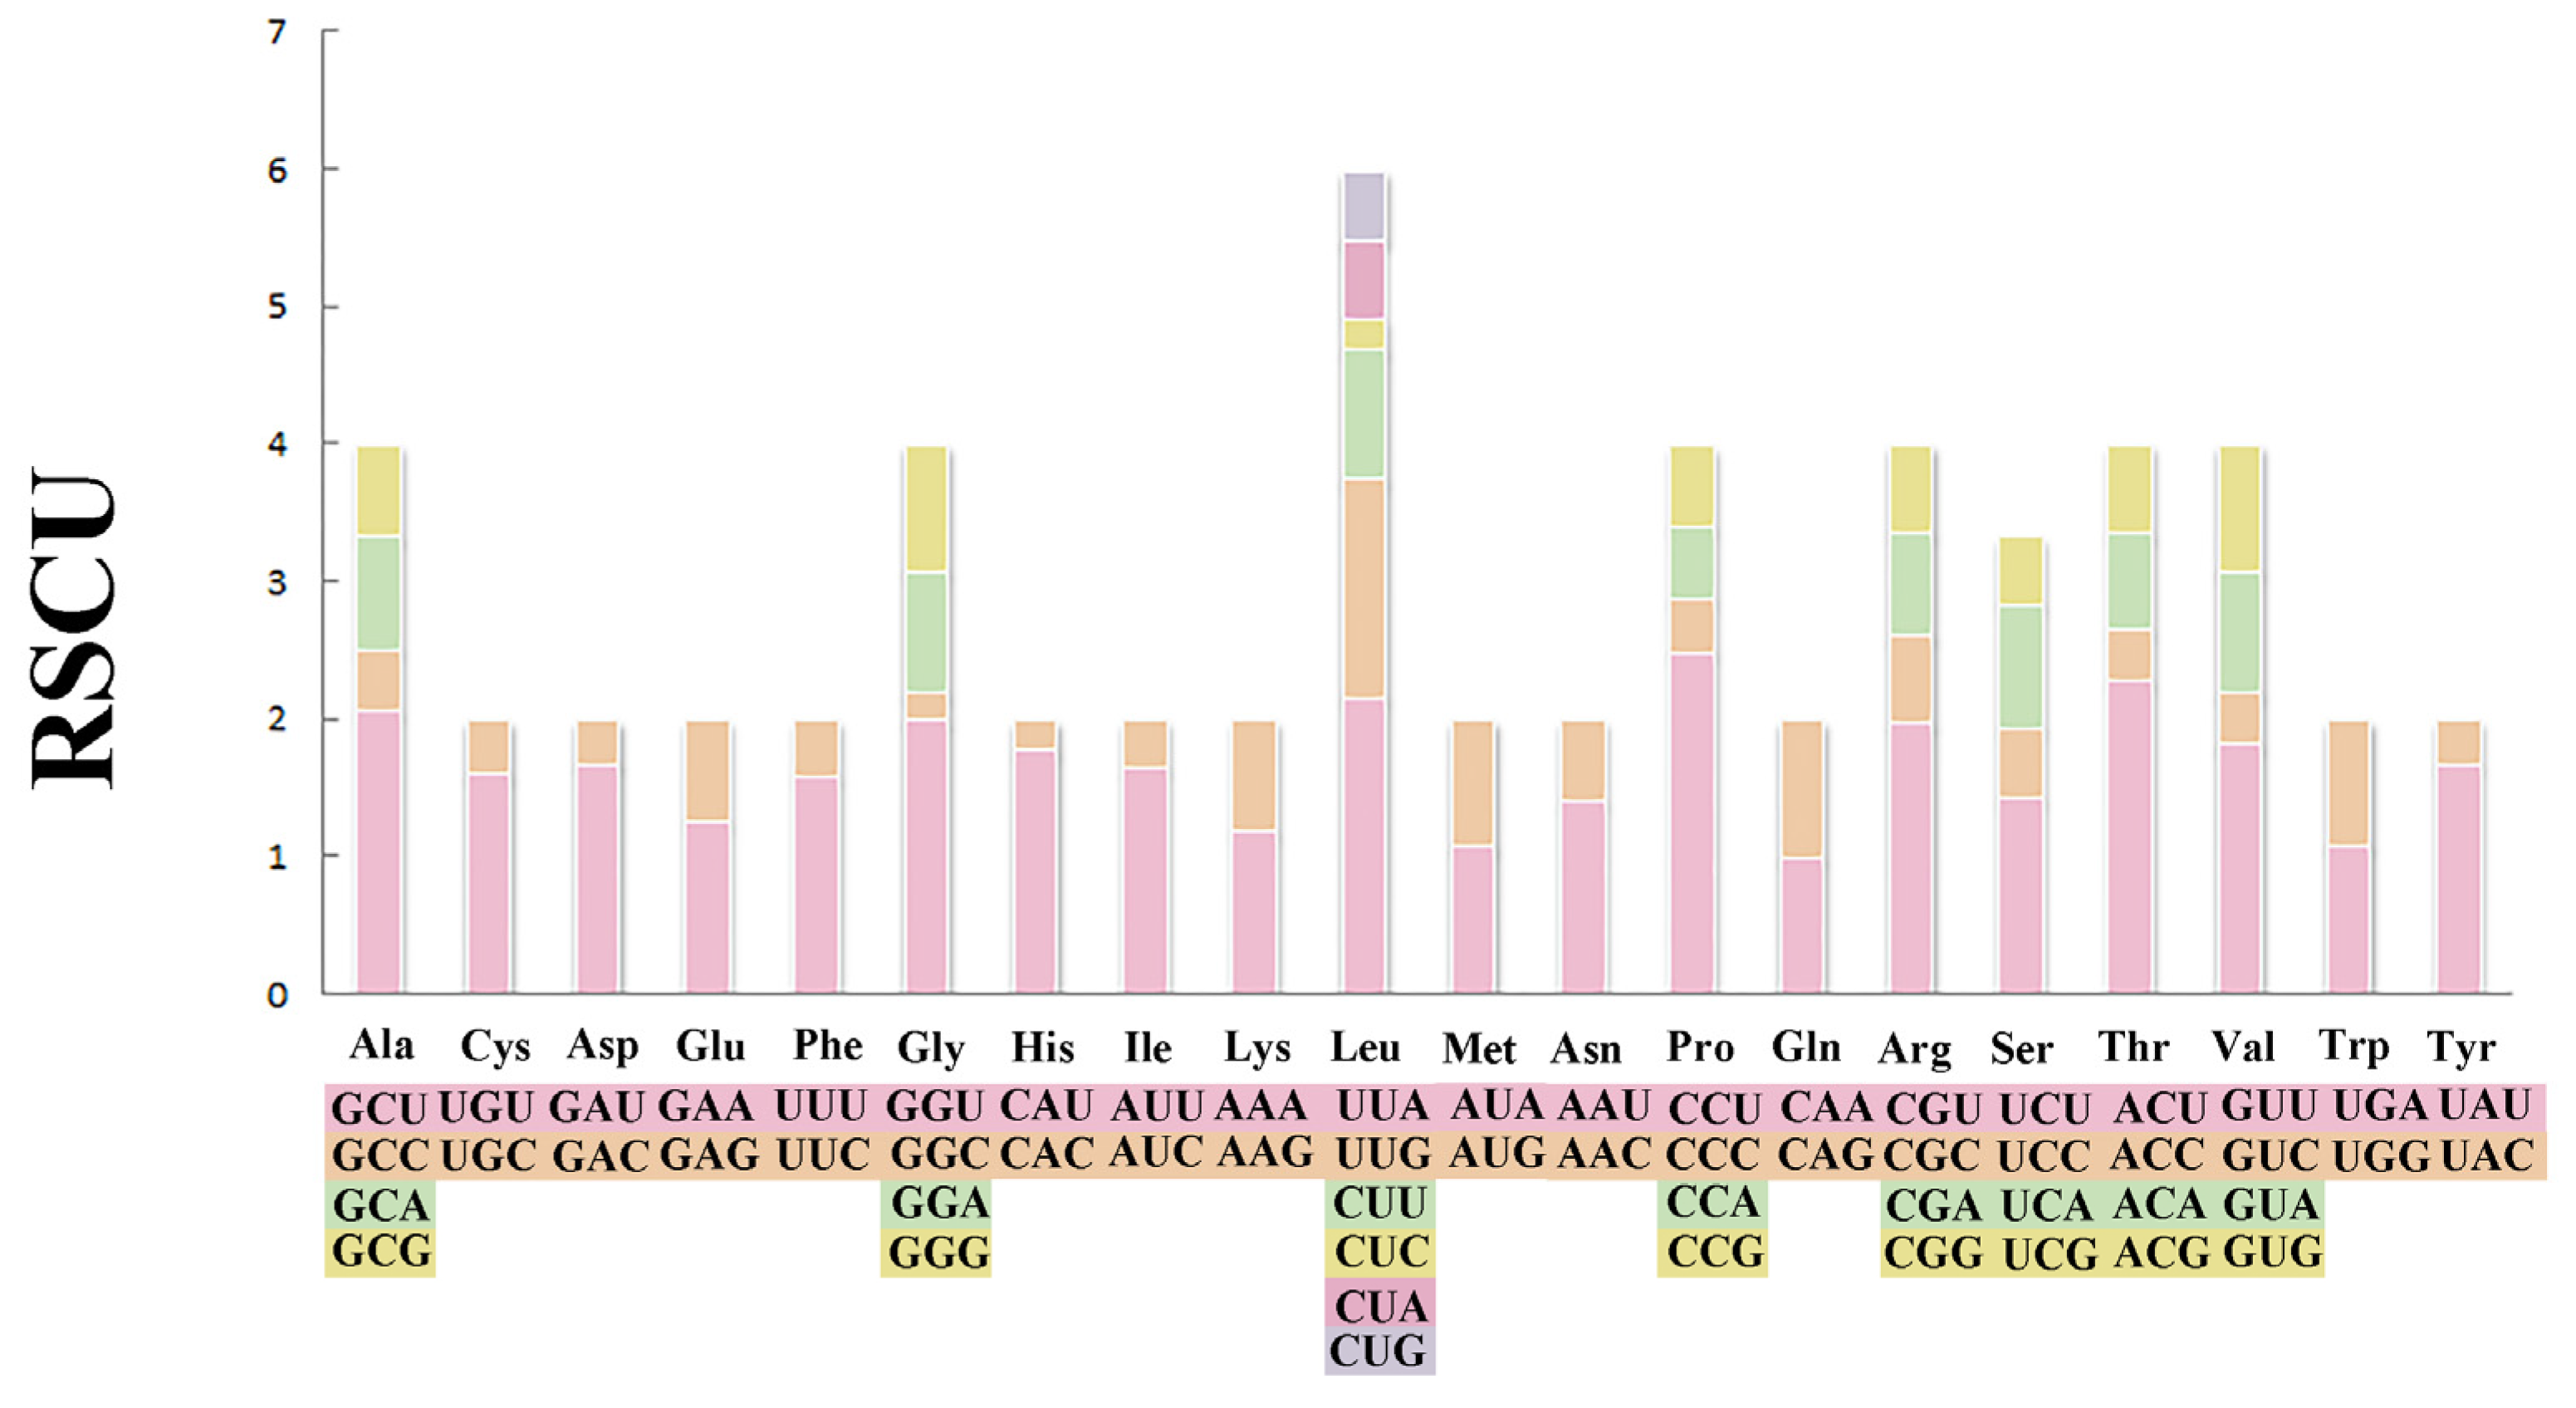
3.2. Use of Protein-Coding Genes and Codons

The total length of 13 PCGs was 11,189 bp (Table 1). The conventional ATG was used as the starting codon in most PCGs, while the initial codons of cox1, cob, and atp8 were ATA, ATT, and GTG, respectively. For the termination codons, the typical TAA and TAG were used in most PCGs, but an incomplete termination codon T was found in cox1 and atp6 (Table 2). Across the mitogenome, the standard invertebrate mitochondrial genetic code was used for all genetic codons. The codon usage pattern analysis of PCGs showed that the three most frequently detected amino acids in M. virgata were Leu (16.97%), Phe (10.96%), and Val (9.70%), and the least common amino acid was Gln (1.17%) (Figure 2). Relative synonymous codon usages for M. virgata are summarized in Figure 3 and Table 3; CCU (Pro), UUA (Leu), ACU (Thr), and GCU (Ala) were the four most frequently detected codons, while GGC (Gly) was the least common codon.

3.3. Transfer and Ribosomal RNA Genes

Compared to the mitogenomes of most species in the family Mytilidae, the M. virgata contained 22 tRNA genes (Figure 4 and Table 1 and Table 2). There were 22 tRNA genes in the mitochondrial genome with a total length of 1435 bp, and the overall A + T content of tRNA genes was 68.50%. In the complete mitogenome of M. virgata, the tRNA length varied between 58 and 70 bp. The tRNA genes of M. virgata had a negative AT skew (–0.105) and a positive GC skew (0.274). The secondary cloverleaf structure of the 22 tRNAs was investigated and the majority of them were found to have a typical cloverleaf structure, except for trnS2, trnE, and trnW. Strikingly, the TψC loop of the trnW gene was completely absent. This characteristic might be a specific feature of tRNA genes in the M. virgata mitogenome.
Within this study, the16S rRNA (rrnL) and 12S rRNA (rrnS) genes of M. virgata were identified. The total lengths of the rrnL and rrnS were 1078 bp and 794 bp, respectively. The rRNAs had an A + T content of 69.61%. Notably, the AT-skew (–0.115) was negative, while the GC-skew (0.321) value of the rRNAs was positive. This indicates that the G content was more prevalent in mitochondrial RNA genes of M. virgata.

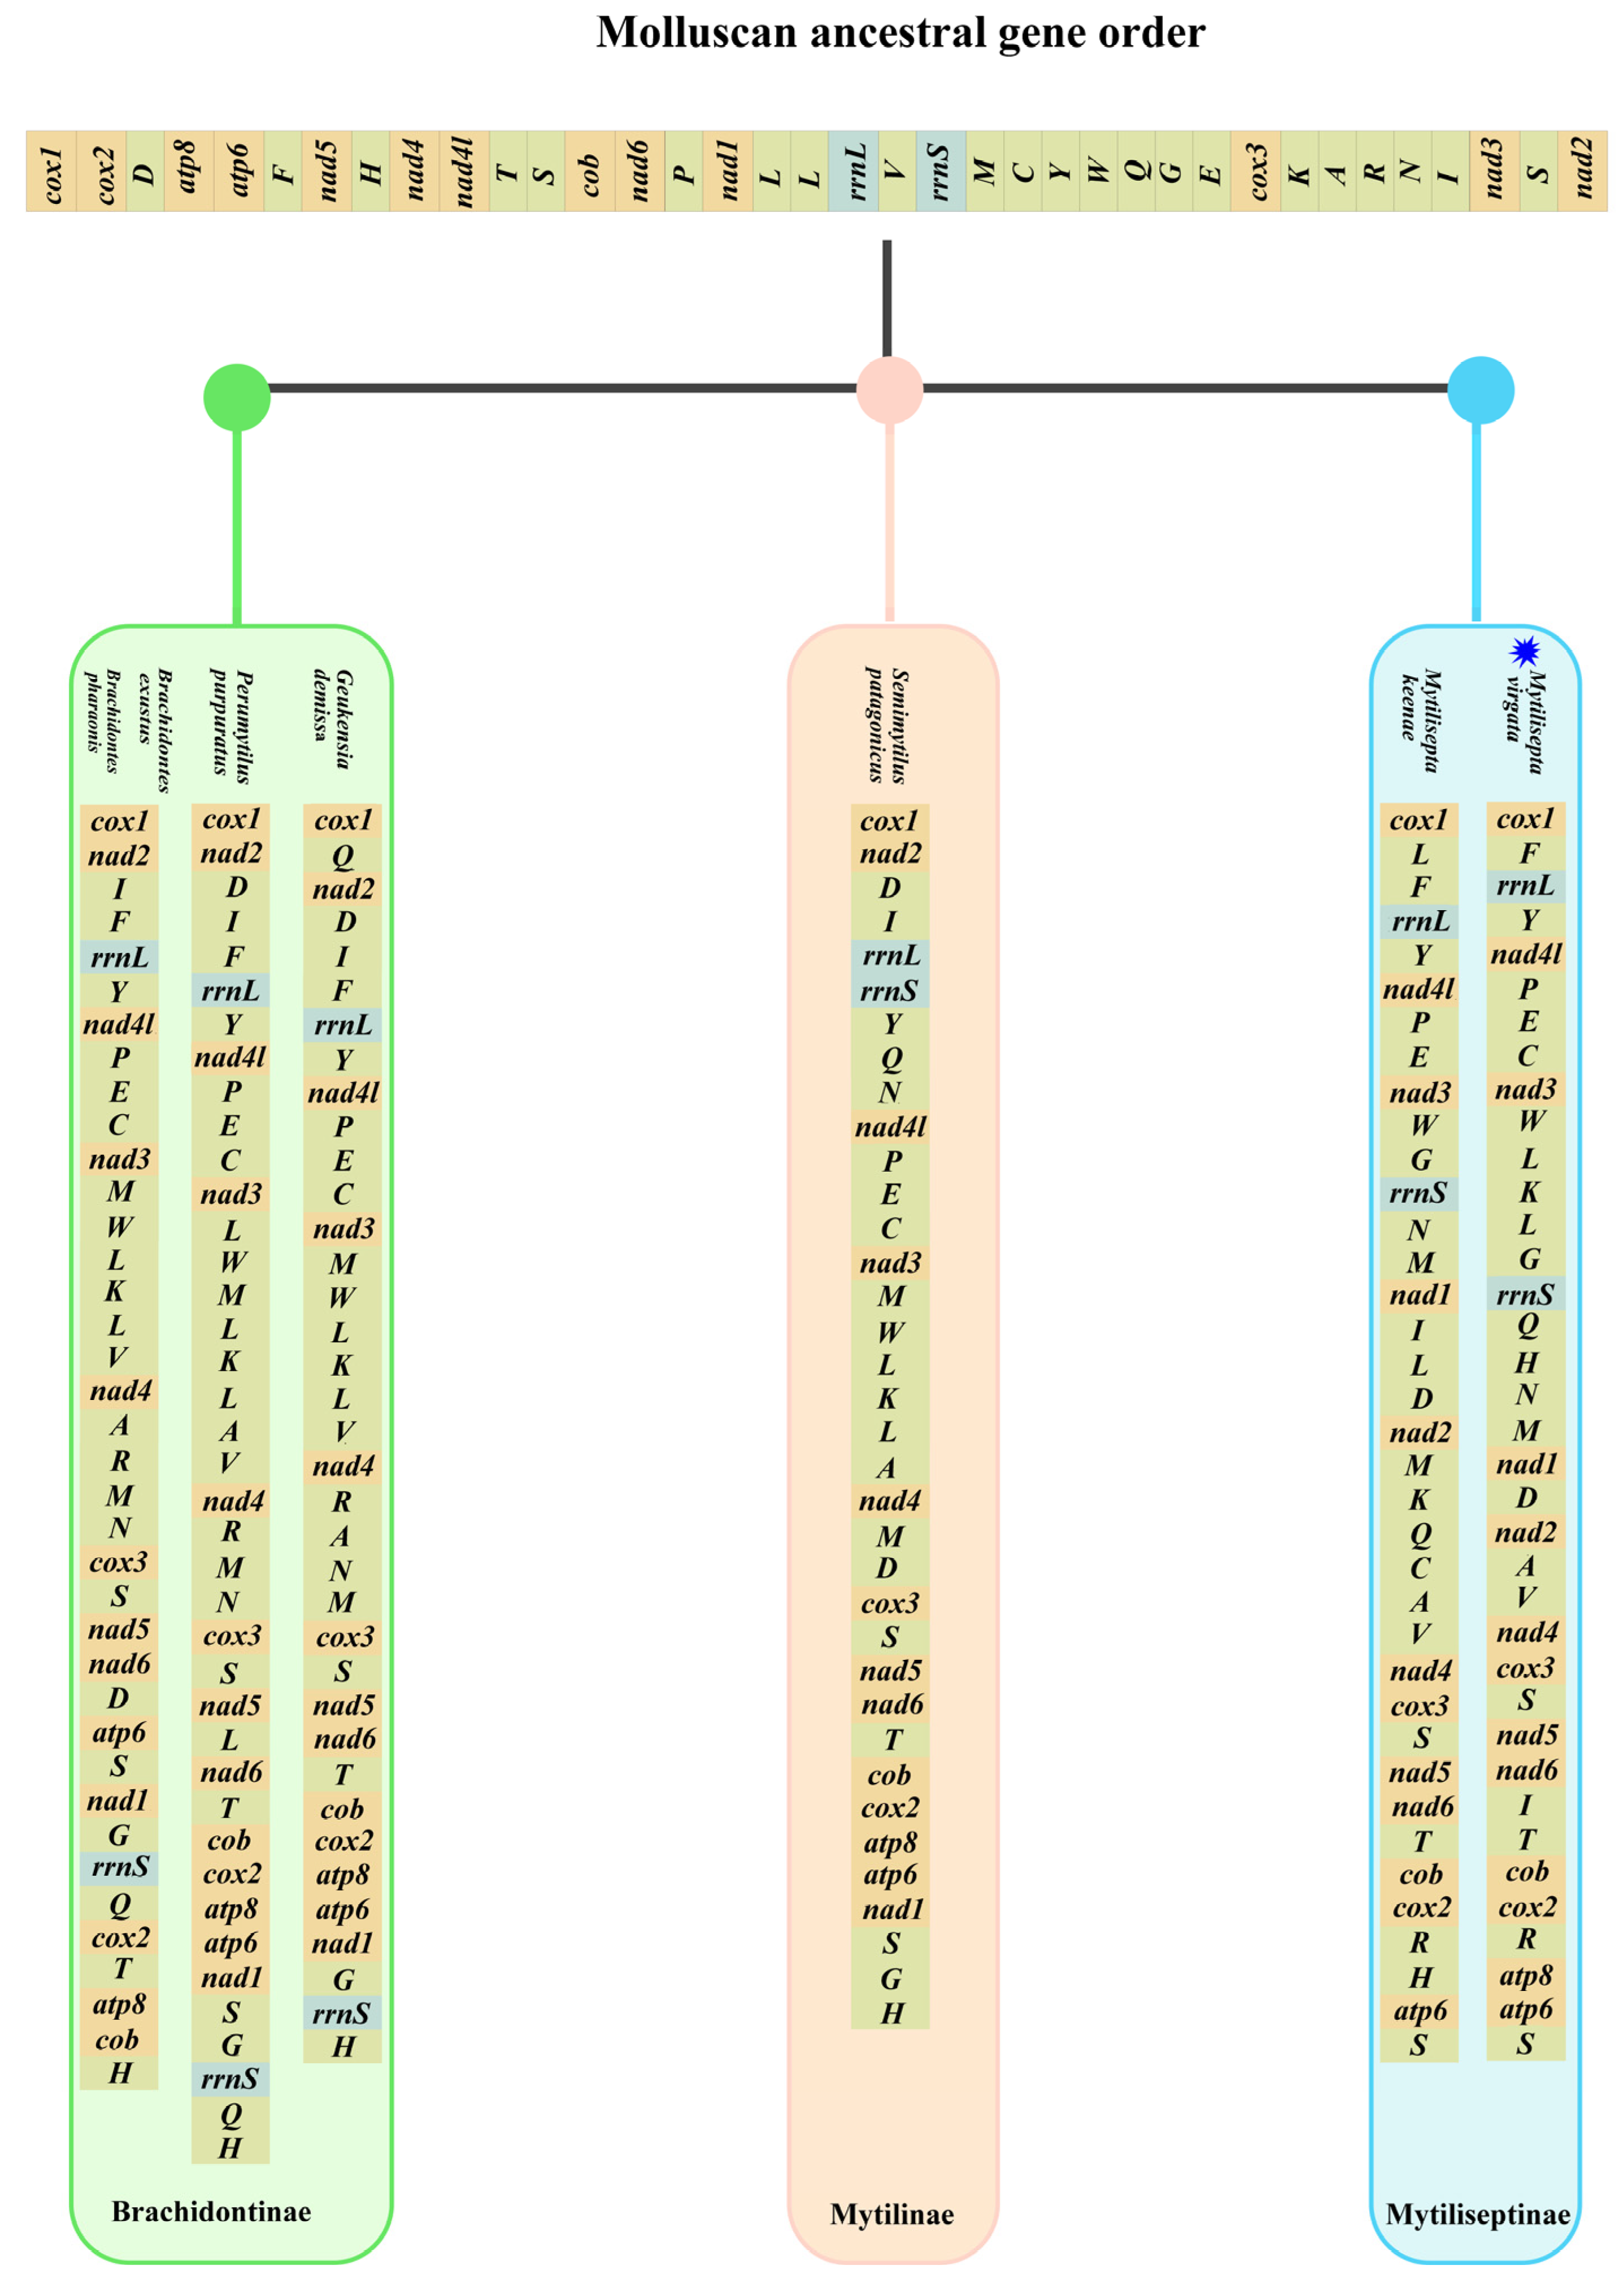
3.4. Gene Arrangement

The gene order of mitogenomes in most Mollusca species displayed an extraordinary amount of variation, especially for bivalves [40,41]. Several species of the subfamily Mytilidae were chosen as representatives of bivalves to investigate mitochondrial gene rearrangement. The complete mitogenomes sequenced for all species consisted of 12–13 PCGs (some species lacked atp8 gene), and we manually annotated the sequences that were missing the atp8 gene (Table 4 and Figure 5); these varied among subfamilies but were generally conserved in closely related species. The majority of species (Arcuatulinae, Mytilinae, and Mytiliseptinae) were identified as lacking the mitochondrial atp8 gene based on simplification comparisons of the mitochondrial genome structure of the Mytilidae mitogenomes. The gene rearrangement analysis based on genera was preferable because substantial rearrangements still existed within subfamilies of bivalve as we deleted all tRNAs. According to our analysis, the mitochondrial gene order in Bathymodiolinae displayed the same gene order arrangement. The subfamily Modiolinae contained six Modiolus spp. That shared an identical arrangement of 13 PCGs in the order of cox1-nad3-atp8-atp6-nad4-cox3-nad6-nad2-cob-nad4l-nad5-cox2-nad1, which was also identical to that of Bathymodiolinae. Among the Xenostrobus secures and species from Modiolinae, both contained cox1-nad3, nad4-cox3, and cox2-nad1 gene fragments. Rearrangement events in the mitogenome of Brachidontinae species were mainly concentrated in two regions. Compared to Brachidontes exustus and Brachidontes 10haraonic, cob was transposed to between nad6 and cox2, whereas the small fragment atp6-nad1 followed the atp8 in Perumytilus purpuratus and Geukensia demissa. The gene order in subfamilies (e.g., Xenostrobinae and Brachidontinae) retained the small fragments of nad4-cox3. The gene arrangement in the mitogenome of M. virgata was found to be identical to that of M. keenae (from cox1 to cox2), and this gene arrangement contained fragments of two other species (P. purpuratus and G. demissa): the nad4-cox3-nad5-nad6-cob-cox2 gene fragment. Additionally, M. virgata was found to contain the atp8 gene, which was consistent with previous studies [3]. For the gene arrangement, the species in Mytilus and Crenomytilus shared an identical arrangement of Mytilinae based on 13 PCGs (in the order of cox1-atp6-nad4l-nad5-nad6-cob-cox2-nad1-nad4-cox3-nad2-nad3-atp8), compared with the Semimytilus patagonicus and Mytilus spp., where there existed the same fragment of cob-cox2. Gene order differences were observed in the genus Perna, with the fragments spanning from atp6 to nad3 and nad6 to cox3, being conserved among Perna perna, Perna canaliculus, and Perna viridis. Surprisingly, the gene sequences of the three genera, G. demissa, P. purpuratus, and S. patagonicus, were found to be identical. Furthermore, the genome order in Gregariella coralliophaga, Crenomytilus grayanus, and Mytilus spp. was almost identical. The most complicated and comprehensive rearrangement of PCGs occurred in Arcuatulinae, with a series of relocations of PCGs taking place, affecting the location of most PCGs. Furthermore, within the bivalvia, there were changes in mitogenomes exhibiting genome organization with the following characteristics: transpositions, inversions, and inverse transpositions [42]. As shown in Figure 6, the gene trnL moved from between cox1 and rrnL to a position between nad3 and rrnS in M. virgata. The transposition of trnC from gene block trnE-trnC-nad3 downstream of trnQ occurred in M. virgata, as compared with M. keenae. The transposition of trnK and trnL, trnQ, trnH, and trnI occurred in the gene block from nad1 to nad4 and made the new gene boundaries trnK-trnL-trnG, trnQ-trnH-trnN-trnM, and trnI-trnT in M. virgata. It was common for mitogenomes to contain two or more copies of a tRNA gene. [43]. For instance, two different trnM genes were present in almost all bivalves (e.g., Mytilus edulis) [44], but such genes were not identified in M. virgata. Analyzing M. virgata also revealed a mass of gene arrangements compared to the putative ancestor. Further, the gene orders of the different subfamilies (Brachidontinae, Mytilinae, and Mytiliseptinae) were most distinct from each other.

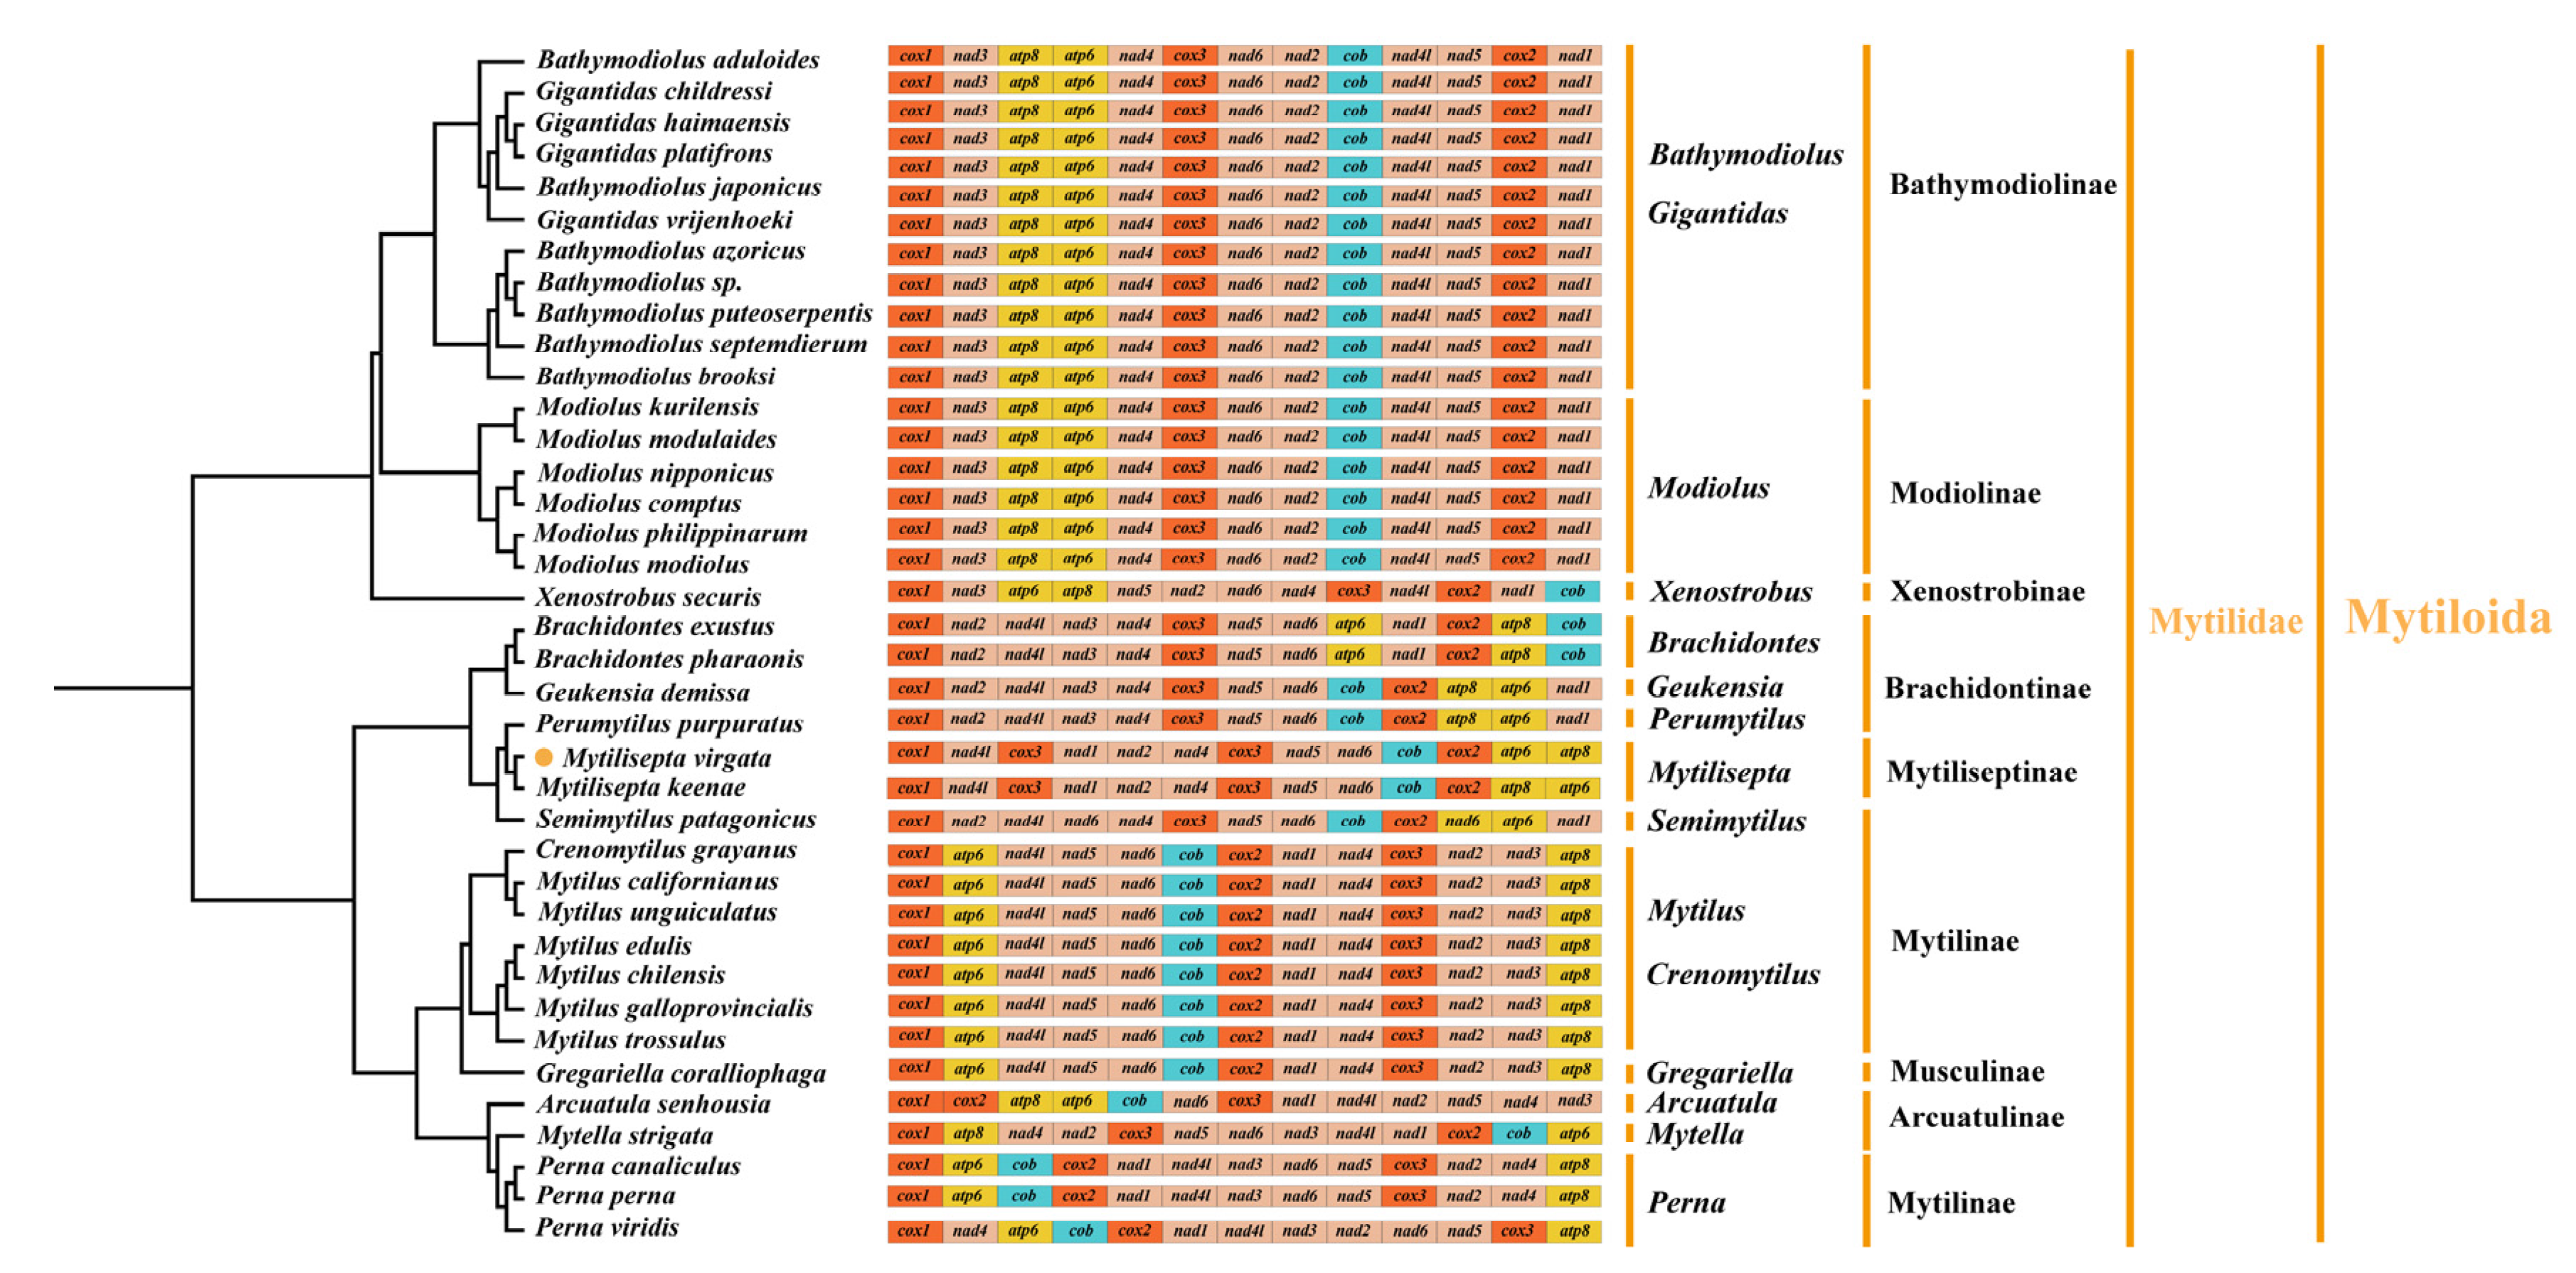
3.5. Phylogenetic Relationships of Mytilidae

In contrast to individual genes or gene fragments, analyzing complete mitochondrial genomes provides a comprehensive view of several genome-level features, including genetic resources, molecular evolution, genome evolution, and phylogeny [45,46]. In the present study, Maximum Likelihood (ML) and Bayesian inference (BI) trees were produced to reconstruct phylogenetic relationships within Pteriomorphia using 12 PCGs based on 70 species (Figure 7). It was anticipated that all phylogenetic analyses with the same topology and approach, but different data matrices, would produce congruent results. Additionally, high support in the majority of nodes between the BI and ML trees was expected for both the data matrices and the tree topologies. The infraclass Pteriomorphia has two clades: the first clade with the family Mytilidae and the second clade with families Pinnidae, Margaritidae, Pteriidae, Pectinidae, Ostreidae, Arcidae, and Cucullaeidae. The clades of 13 subfamilies were supported with 56–100% ML BP (bootstrap probability) and 0.86–1.0 PP (posterior probability). Within clade 1, Bathymodiolinae was well supported (100 BP), but the relationships within it were not well supported. All species in Modiolinae formed a well-supported group. The X. securis of the subfamily Xenostrobinae was located underneath Bathymodiolinae. Mytilinae was split into two groups. In the first one, S. patagonicus consisted of the subfamily Mytiliseptinae and P. purpuratus. The genus Mytilus spp. (e.g., M. californanus and M. unguiculatus) and C. grayanus were considered to be closely related, forming a group in which all species formed a well-supported clade. The second group, the genus Perna, was closely linked with Arcuatula senhousia and Mytella strigata. Within clade 2, the sister-group relationship of Pinnidae, Margaritidae, and Pteriidae showed high support. Pectinidae was the most closely related taxon to these three families. Among the Ostreidae, Ostreinae was most closely related to Saccostreinae and clustered with the Crassostreinae species group.

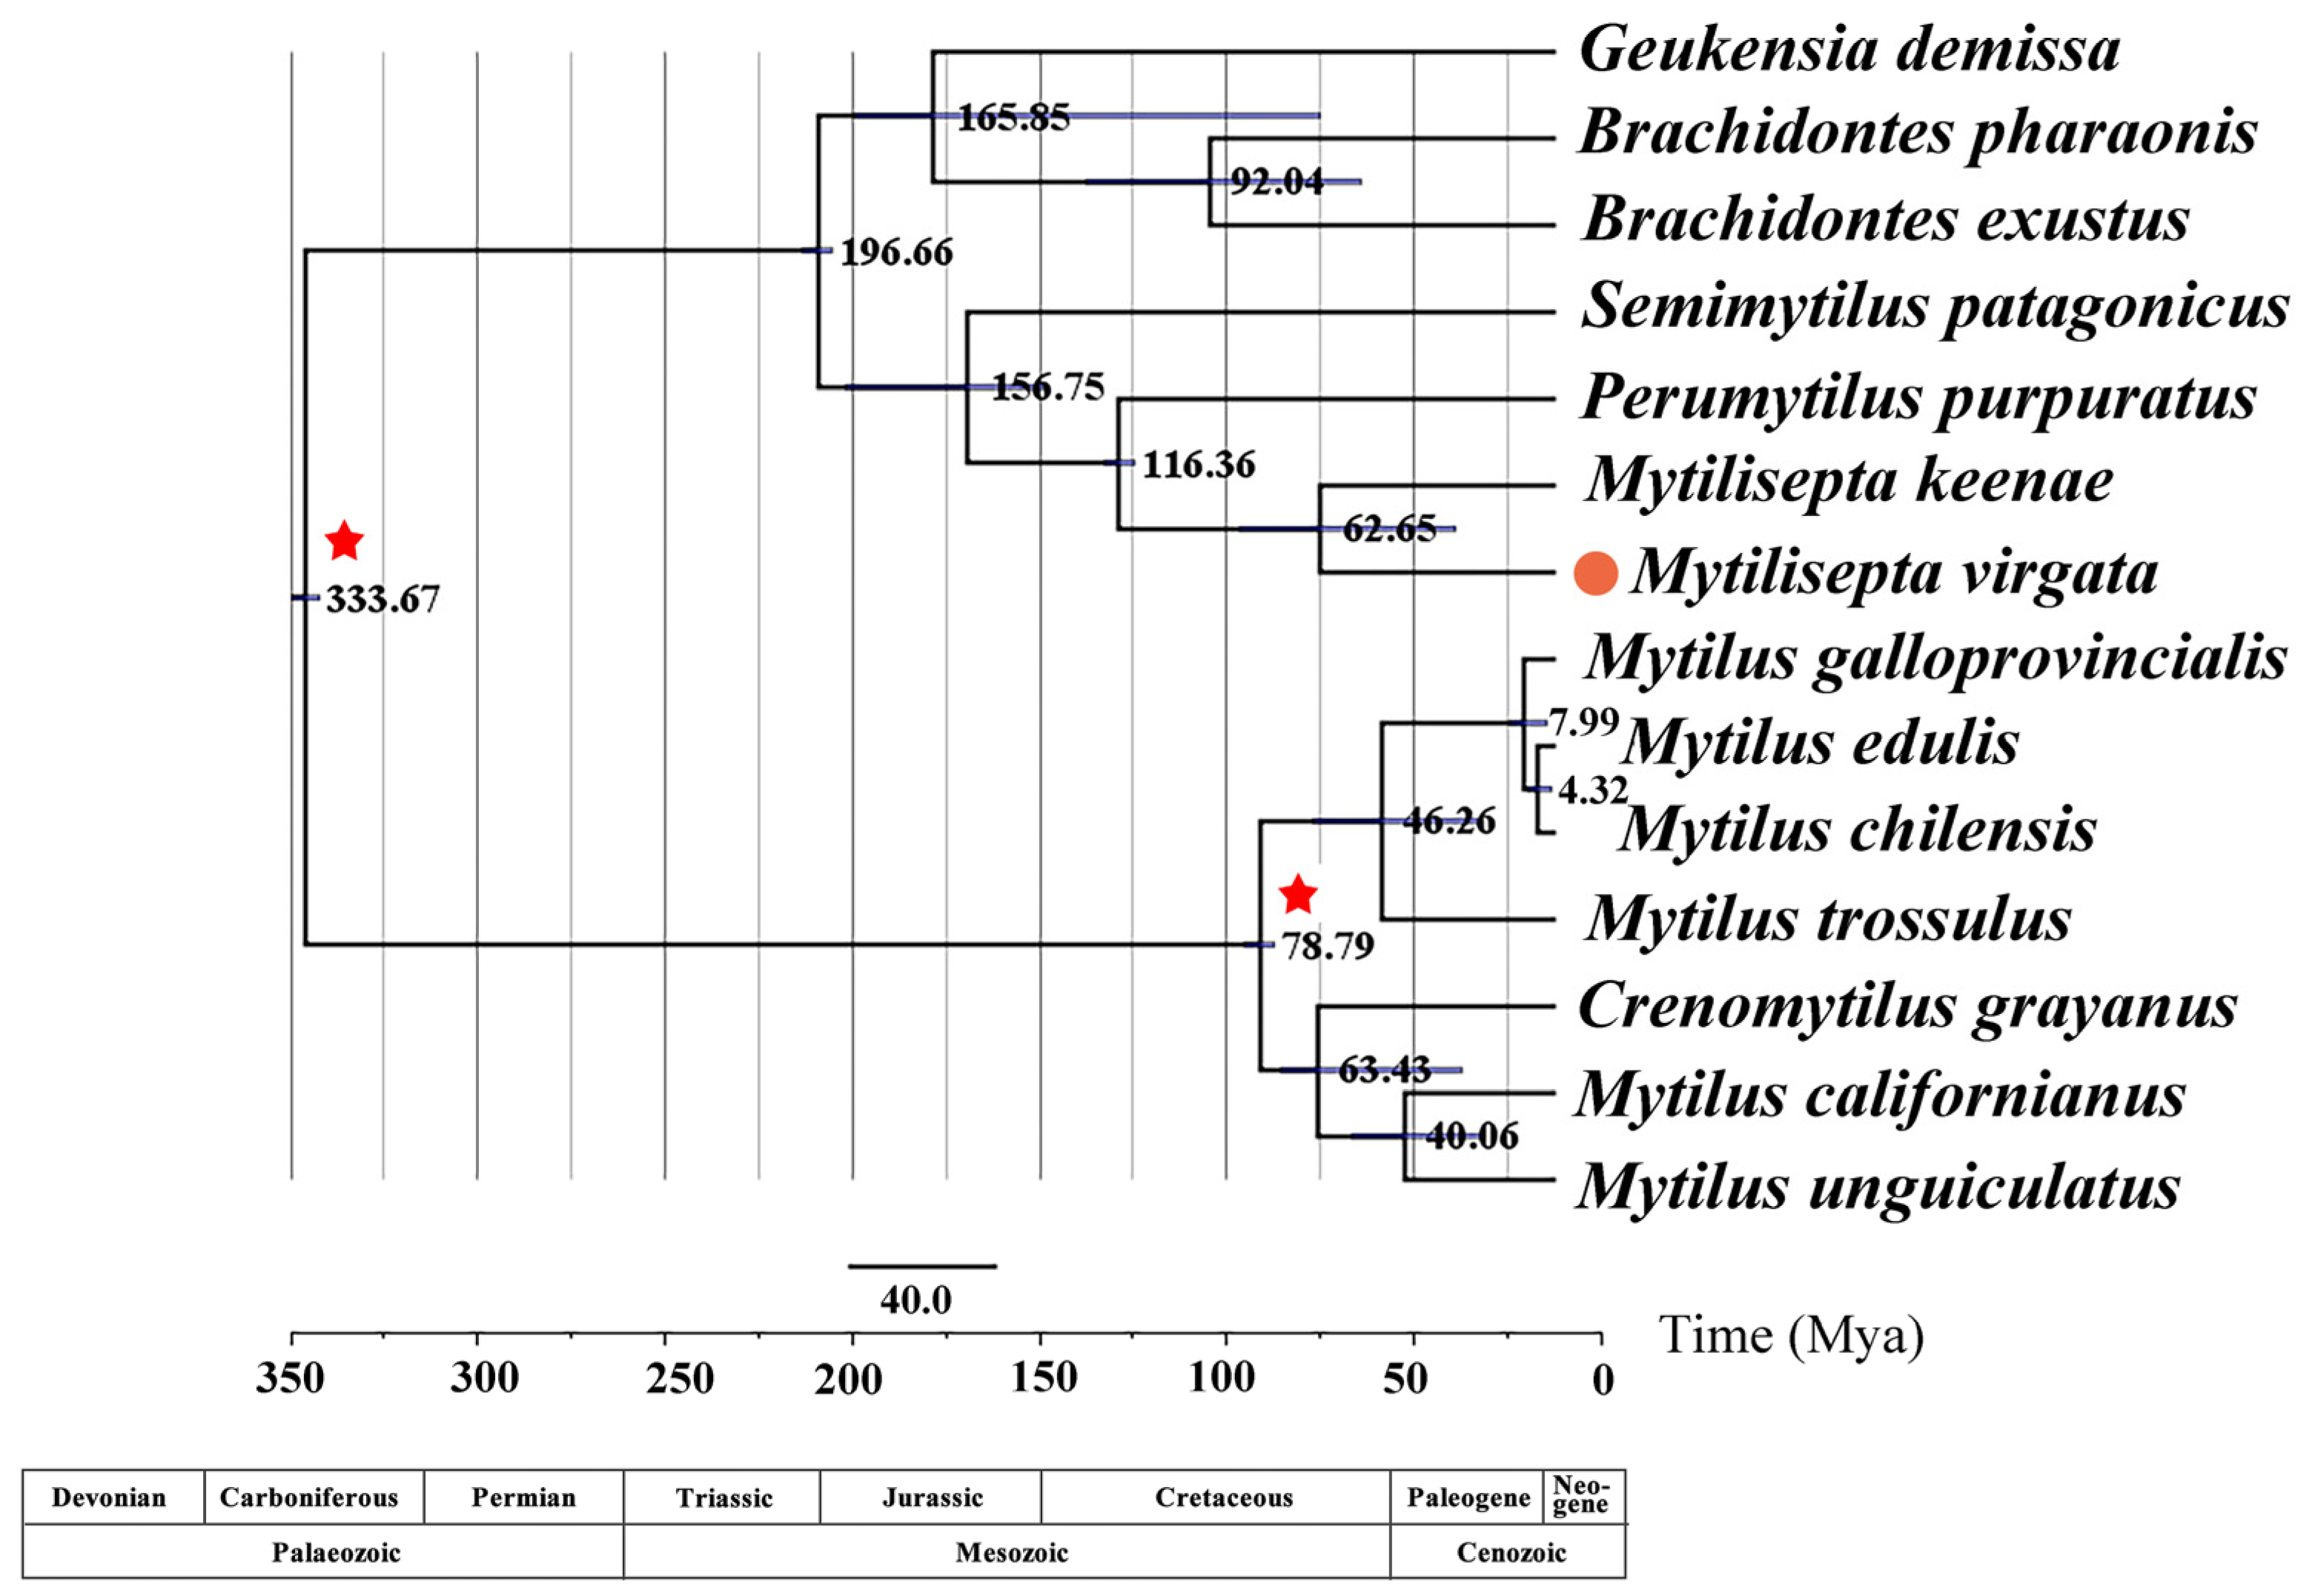
3.6. Divergence Times

Retrieving the topology of the maximum clade plausibility tree from the BEAST analysis (Figure 3) yielded the same result as the BI and ML trees in MrBayes (Figure 8). Our estimates show that the tree split into three lineages—Mytilinae, Brachidontinae, and Mytiliseptinae—approximately 333.67 Mya during the early Carboniferous period, which is consistent with the split timing estimated in a previous study [3]. Mytilus spp. first diverged approximately 78.79 Mya, with a 95% highest posterior density (HPD) interval spanning the Cretaceous period (61.3–122.0 Mya). The divergence time between M. virgata, M. keenae, and P. purpuratus was estimated to be approximately 116.36 Mya in the late Cretaceous period. Fossil evidence of M. virgata and M. keenae dates back to 62.65 Mya in the early Paleogene era.

4. Discussion

4.1. The Organization of the Mitogenome

The complete mitochondrial genome DNA sequence of M. virgata contained 37 genes, which is consistent with the findings of the Mytilidae family [3]. Among Mytilisepta, it was shorter than M. keenae (15,902 bp) (Table 1). The variation in mitochondrial genome size is largely attributed to factors such as the frequency of duplicated repeats, horizontal gene transfer, genetic drift, and plasmid-derived regions [47,48,49], but the reason for diversity in the mitochondrial genome length in Mytilisepta is unclear. In the M. virgata mitogenome, there was a non-coding region between rrnL and trnY (Figure 1). We consider this non-coding region as the CR/D-loop. The mitogenome was completed immediately following assembly; hence, no further methods were required.
There was a very high prevalence of AT content in mollusca mitogenomes [2,37], with the lowest AT contents typically being over 50% rather than having a balanced nucleotide frequency. GC content in mitochondrial genomes varies among different species, and this variation is attributed to GC-biased gene conversion across the genome. GC content is influenced by mutational bias, the environment, selection, and recombination-associated DNA repair [50,51]. Nucleotide skews are also regularly used to characterize the base compositions of mitogenomes [52] and detect the origin of replication in circular mitogenomes [53]. For M. virgata, the lowest AT content was 60.06% (nad4l) and the AT skew was negative, while the GC skew was positive, indicating a bias towards G over C. The GC skew was more pronounced, as observed in most studied mollusks, especially bivalves [54,55].

4.2. Protein Coding Genes and Codon Usage

According to Ojala et al., incomplete termination codons may result from posttranscriptional modification, in which an “A” is added to the 3′-end of mRNA through polyadenylation to form a complete TAA stop codon, thereby terminating transcription [56]. The explanations for codon usage bias include isoaccepting transfer RNAs, variation in gene expression levels, and GC-content between species [50]. This phenomenon has been observed in other metazoan mitogenomes [57]. Furthermore, in our results, the most frequently used amino acid was Leu, which is consistent with most of the currently studied mitogenomes [58,59].

4.3. tRNAs

Following almost all metazoans, the DHU-arm of trnS2 was reduced to a large DHU loop [60]. The trnW completely lacked the TψC loop, as was observed in the Stenopodidea, and the complete absence of the TψC loop in trnR or trnM was occasionally observed in other Mollusca groups [61,62]. A previous study showed that tRNAs commonly exhibited altered structures in mitochondria [63].

4.4. Gene Arrangement

Within some phyla of animals, mitochondrial gene arrangement is thought to have undergone only infrequent changes. In the majority of vertebrate mitogenomes, from fish to mammals, the repertoire of coding genes was highly conserved, indicating that no significant gene rearrangements have occurred across different vertebrate clades over a span of 500 million years [64]. On the contrary, gene rearrangements seemed to be more prevalent in invertebrates, where they were accelerated within groups at many taxonomic levels [65,66]. Based on the types of genes rearranged, genome rearrangements can be characterized as minor (tRNAs only) or major (protein-coding and rRNA genes) rearrangements [67]. Various hypotheses have been proposed to explain gene rearrangements in animal mitogenomes: the tandem duplication/random loss (TDRL) model [68], the tandem duplication/non-random loss (TDNL) model [69], the recombination model [70], and the tRNA mispriming model [71]. The TDRL model, which explained the translocation of genes encoded on the same strand through tandem duplication following the random deletion of certain replicated genes, had been broadly applied [71]. Gene arrangements are recognized as powerful evidence for the evolution of organisms and their genomes, and they provide explanations that resolve the relationships between distant lineages in terms of phylogenetic signals [40].
The phenomenon of missing atp8 is common in bivalves (e.g., species in Mactridae, Arcidae, and Pectinidae) [1,55,62,72,73]. Some researchers have proposed that this peptide possibly has a dispensable function in the ATPase complex, either because the gene is transferred to the nucleus or because the atp8 protein is too short and variable in length to be annotated [1,38]. A significant number of transpositions and inversions have been identified in comparison to the putative ancestral sequence. Thus far, one assumption that explains why the bivalve gene order is so variable has been proposed: there may be occasional failures in the unique mtDNA inheritance pattern (DUI) machinery, which may also involve gene translocations, gene duplication/lost events, and recombination [40]. Lubośny et al. proposed that bivalvia was considered to be lacking atp8 because of the poor similarity between protein-coding gene sequences in genetically closed species. It was, in fact, present but highly divergent and just not annotated in some of them [74]. Additionally, we manually annotated atp8 in all those species that lack sequences with atp8. The outcome of the manual annotation process was found to be highly consistent with the findings reported in the previous article.

4.5. Phylogeny

Recent molecular phylogenetic studies have proposed different hypotheses for the higher-level phylogeny of Pteriomorphia. However, most of the families within this order remain unresolved [3,75]. Given this, the taxonomy of the Mytilidae family is primarily reliant on morphological characteristics, and there is little consensus regarding specific taxonomic assignments within the family. Additional studies are, therefore, needed to address phylogenetic relationships within the Mytilidae family.
In our study, the subfamilies Bathymodiolinae and Modiolinae showed sister relationships, which were identical both to the topological structure of the phylogenetic tree based on nuclear 18S rRNA and mitochondrial COI genes constructed for all species in the deep sea and to the results based on transcriptome sequences of representative members of the Mytilidae [76]. This is also consistent with the results based on transcriptome sequences of representative members of Mytilidae [77], but different from the result based on 18S rRNA variability, where Modiolinae occupied a position under the Mytilinae [78]. The apparent monophyly of Modiolinae differs from the previous results presented by Distel [78]; additionally, in our dataset, X. secures (Limnoperna fortunei) of the subfamily Xenostrobinae was located underneath the Bathymodiolinae, which is consistent with the previous study [76]. The findings for the Perna species were the same as that of Wood et al. [79] and Cunha et al. [80], who found evidence for the monophyly of the Perna genus and built the phylogenetic trees without using the sequences from the Brachidontes genus. Combosch et al. validated the monophyly of the genus Perna and indicated a misidentification in the previous study [81]. In our analysis, the Mytilisepta was clustered with P. purpuratus, as in previous studies [18,82], but this finding differed from the results presented by Zhao et al. [83]. Moreover, Combosch et al. concluded that M. virgata was most closely related to B. exustus by using a five-gene Sanger-based approach [81]. In addition, early phylogeny based on the mitochondrial gene cox1 suggested that Mytilisepta was a monophyletic genus placed within Mytilidae [84,85], as confirmed by our results. It was confirmed that the genus Mytilus spp. (e.g., M. californanus and M. unguiculatus) and C. grayanus were closely related and formed one clade. C. grayanus was classified as a Mytilus by Dunker (World Register of Marine Species, WORMS), which indicated that C. grayanus could be closely related to M. californanus and M. unguiculatus. The phylogenetic tree showed five subfamilies of Brachidontinae, Mytilinae, Mytiliseptinae, Musculinae, and Arcuatulinae (A. senhousia and M. strigata) classified into one clade. There has long been some debate regarding the branch of the Perna and Arcuatula (Musculista). Earlier studies based on spermatozoa structure and shell morphology placed them into Mytilinae and Musculinae, respectively [86,87]. Subsequently, both Perna and Arcuatula were located in the same subfamily (Musculinae) because of the anatomical feature of the pericardial complex being located between two posterior byssal retractor muscle blocks [3]. In our study, the relationships between A. senhousia and Perna (P. canaliculus and P. viridis) strengthen the previously established connections between Arcuatula and Perna [3].
In the second clade, the family Pectinidae was nested within the Pinnidae, Margaritidae, and Pteriidae, forming a closer relationship. This result differs from those of previous studies that used cox1 and 18S rDNA and suggested that Pectinidae was closer to Arcidae than any other family [88,89]. The phylogenetic trees, however, support a closer relationship between Ostreidae and Arcidae, with high support values, contradicting the analysis by Sun and Gao [90]. In our study, we observed that Ostreinae and Saccostreinae were clustered together, with the result that the three genera (Ostreinae, Saccostreinae, and Crassostreinae) formed a monophyletic group with strong support [91].

4.6. Divergence Times

In contrast to our findings, the divergence time estimated for the Austromytilus + Mytilisepta + Perumytilus clade was relatively insensitive to the prior selection and was estimated to be 13.35 Mya under the Yule prior [86]. The Paleobiology Database (https://paleobiodb.org (accessed 6 September 2022)) indicates that the oldest Mytilisepta fossil was from the late or upper Eocene. It was beyond the scope of this paper to suggest that further analysis might be needed to produce an affordable taxonomic revision. To our surprise, there were discrepancies between our findings and those of Zhao et al. Therefore, further in-depth investigations should be conducted in the future [83].

5. Conclusions

In our study, we used the next-generation sequencing method to sequence the mitogenome of M. virgata, which was 14,713 bp in length. Our analyses show that all 37 mitochondrial genes are encoded on the heavy chain, with a negative AT skew and a positive GC skew in the total mitochondrial genome. Among the tRNA secondary structures, only trnS2 lacked DHU stems, while the TψC loop of the trnW gene was entirely absent, and the trnE was missing the anticodon arm. Furthermore, gene rearrangements were especially apparent among the Mytiloidea mitogenomes. Our analysis of the mitochondrial genome provides further support for the previous elevation of the family Mytilidae to the order level. Although there is currently a lack of molecular data on M. virgata, comprehensive data on the taxa of Mytiliseptinae was available to enhance our understanding of the rearrangements, evolutionary events, and phylogenetic position of the Mytilidae.

Supplementary Materials

The following are available online at https://www.mdpi.com/article/10.3390/genes14040910/s1, Table S1: List of species analyzed in this study with their GenBank accession numbers.

Author Contributions

Conceptualization, K.X. and Y.Y.; methodology, M.X.; software, J.L.; validation, Y.Y. and J.L.; formal analysis, M.X.; investigation, Z.G. and J.H.; resources, M.X.; data curation, M.X.; writing—original draft preparation, M.X.; writing—review and editing, Y.Y. and M.X.; visualization, K.X. and L.J.; supervision, B.G. and L.J.; project administration, B.G.; funding acquisition, K.X, Y.Y. and B.G. All authors have read and agreed to the published version of the manuscript.

Funding

This research was funded by the National Natural Science Foundation of China, grant number 42107301; the National Key R&D Program of China, grant number 2019YFD0901204; and the NSFC Projects of International Cooperation and Exchanges, grant number 42020104009.

Institutional Review Board Statement

All animal experiments were conducted under the guidance approved by the Animal Research and Ethics Committee of Zhejiang Ocean University (NO:ZJOU2022078).

Informed Consent Statement

Not applicable.

Data Availability Statement

The data that support the findings of this study are available from the corresponding author upon reasonable request.

Conflicts of Interest

The authors declare no conflict of interest.

References

  1. Gissi, C.; Iannelli, F.; Pesole, G. Evolution of the mitochondrial genome of metazoa as exemplified by comparison of congeneric species. Heredity 2008, 101, 301–320. [Google Scholar] [CrossRef] [PubMed] [Green Version]
  2. Xie, G.L.; Köhler, F.; Huang, X.C.; Wu, R.W.; Zhou, C.H.; Ouyang, S.; Wu, X.P. A novel gene arrangement among the stylommatophora by the complete mitochondrial genome of the terrestrial slug Meghimatium bilineatum (Gastropoda, Arionoidea). Mol. Phylogenet. Evol. 2019, 135, 177–184. [Google Scholar] [CrossRef] [PubMed]
  3. Lee, Y.; Kwak, H.; Shin, J.; Kim, S.C.; Kim, T.; Park, J.K. A mitochondrial genome phylogeny of Mytilidae (Bivalvia: Mytilida). Mol. Phylogenet. Evol. 2019, 139, 106533. [Google Scholar] [CrossRef] [PubMed]
  4. Liu, Y.; Kurokawa, T.; Sekino, M.; Tanabe, T.; Watanabe, K. Complete mitochondrial DNA sequence of the ark shell Scapharca broughtonii: An ultra-large metazoan mitochondrial genome. C.B.P.D Genom. Proteom. 2013, 8, 72–81. [Google Scholar] [CrossRef] [PubMed]
  5. Boore, J.L.; Macey, J.R.; Medina, M. Sequencing and comparing whole mitochondrial genomes of animals. Methods Enzymol. 2005, 395, 311–348. [Google Scholar]
  6. Boore, J.L. Animal mitochondrial genomes. Nucleic Acids Res. 1999, 27, 1767–1780. [Google Scholar] [CrossRef] [PubMed] [Green Version]
  7. Gérard, K.; Bierne, N.; Borsa, P.; Chenuil, A.; Féral, J. Pleistocene separation of mitochondrial lineages of Mytilus Spp. mussels from northern and southern hemispheres and strong genetic differentiation among southern populations. Mol. Phylogenet. Evol. 2008, 49, 84–91. [Google Scholar] [CrossRef]
  8. Krampah, E.A.; Yankson, K.; Blay, J. Population dynamics of the brown mussel Perna perna at a rocky beach near cape coast, ghana. Mar. Ecol. 2020, 41, e12571–e12575. [Google Scholar] [CrossRef]
  9. Colgan, D.J.; Costa, P.D. Invasive and non-invasive lineages in Xenostrobus (Bivalvia: Mytilidae). Molluscan Res. 2013, 33, 272–280. [Google Scholar] [CrossRef]
  10. Morton, B.; Dinesen, G.E. The biology and functional morphology of Modiolarca subpicta (Bivalvia: Mytilidae: Musculinae), epizoically symbiotic with Ascidiella aspersa (Urochordata: Ascidiacea), from the kattegat, northern jutland, denmark. J. Mar. Biol. Assoc. Uk 2011, 91, 1637–1649. [Google Scholar] [CrossRef]
  11. Lubośny, M.; Śmietanka, B.; Arculeo, M.; Burzyński, A. No evidence of DUI in the Mediterranean alien species Brachidontes pharaonis (P. Fisher, 1870) despite mitochondrial heteroplasmy. Sci. Rep. 2022, 12, 8569. [Google Scholar] [CrossRef] [PubMed]
  12. Iwasaki, K. Distribution and bed structure of the two intertidal mussels, Septifer virgatus (Wiegmann) and Hormomya mutabilis (Gould). P-SMBL 1994, 36, 223–247. [Google Scholar] [CrossRef] [PubMed] [Green Version]
  13. Morton, B. The population dynamics and reproductive cycle of Septifer virgatus (Bivalvia: Mytilidae) on an exposed rocky shore in Hong Kong. J. Zool. 1995, 235, 485–500. [Google Scholar] [CrossRef]
  14. Okutani, T. Marine Mollusks in Japan; Tokai University Press: Tokai, Japan, 2000; 1173p. [Google Scholar]
  15. Liu, J.H.; Morton, B. The temperature tolerances of Tetraclita squamosa (Crustacea: Cirripedia) and Septifer virgatus (Bivalvia: Mytilidae) on a sub-tropical rocky shore in Hong Kong. J. Zool. 2010, 234, 325–339. [Google Scholar] [CrossRef]
  16. Seed, R. Patterns of biodiversity in the macro-invertebrate fauna associated with mussel patches on rocky shores. J. Mar. Biol. Assoc. Uk 1996, 76, 203–210. [Google Scholar] [CrossRef] [Green Version]
  17. Seed, R.; Richardson, C.A. Evolutionary traits in Perna viridis (Linnaeus) and Septifer virgatus (Wiegmann) (Bivalvia: Mytilidae). J. Exp. Mar. Biol. Ecol. 1999, 239, 273–287. [Google Scholar] [CrossRef]
  18. Gerdo, M.; Fujii, Y.; Hasan, I.; Koike, T.; Shimojo, S.; Spazzali, F.; Yamamoto, K.; Ozeki, Y.; Pallavicini, A.; Fujita, H. The purplish bifurcate mussel Mytilisepta virgata gene expression atlas reveals a remarkable tissue functional specialization. BMC Genom. 2017, 18, 590. [Google Scholar] [CrossRef] [Green Version]
  19. Yonge, C.M.; Campbell, J.I. II.-on the heteromyarian condition in the Bivalvia with special reference to dreissena polymorpha and certain Mytilacea. Earth Environ. Sci. Trans. R. Soc. Edinb. 1968, 68, 21–42. [Google Scholar] [CrossRef]
  20. Aljanabi, S.M.; Martinez, I. Universal and rapid salt-extraction of high quality genomic dna for Pcr-based techniques. Narnia 1997, 25, 4692–4693. [Google Scholar] [CrossRef]
  21. Bolger, A.M.; Lohse, M.; Usadel, B. Trimmomatic: A flexible trimmer for illumina sequence data. Bioinformatics 2014, 30, 2114–2120. [Google Scholar] [CrossRef] [Green Version]
  22. Dierckxsens, N.; Mardulyn, P.; Smits, G. Novoplasty: De novo assembly of organelle genomes from whole genome data. Nucleic Acids Res. 2017, 45, e18. [Google Scholar] [CrossRef] [PubMed] [Green Version]
  23. Bernt, M.; Donath, A.; Jühling, F.; Externbrink, F.; Florentz, C.; Fritzsch, G.; Pütz, J.; Middendorf, M.; Stadler, P.F. Mitos: Improved de novo metazoan mitochondrial genome annotation. Mol. Phylogenet. Evol. 2013, 69, 313–319. [Google Scholar] [CrossRef] [PubMed]
  24. Grant, J.R.; Stothard, P. The CGview server: A comparative genomics tool for circular genomes. Nucleic Acids Res. 2008, 36, W181–W184. [Google Scholar] [CrossRef] [PubMed]
  25. Kumar, S.; Stecher, G.; Li, M.; Knyaz, C.; Tamura, K. Mega X: Molecular evolutionary genetics analysis across computing platforms. Mol. Biol. Evol. 2018, 35, 1547–1549. [Google Scholar] [CrossRef] [PubMed]
  26. Perna, N.T.; Kocher, T.D. Patterns of nucleotide composition at fourfold degenerate sites of animal mitochondrial genomes. J. Mol. Evol. 1995, 41, 353–358. [Google Scholar] [CrossRef] [PubMed]
  27. Lowe, T.M.; Eddy, S.R. Trnascan-Se: A program for improved detection of transfer rna genes in genomic sequence. Nucleic Acids Res. 1997, 25, 955–964. [Google Scholar] [CrossRef]
  28. Laslett, D.; Canbck, A.B. Arwen: A program to detect trna genes in metazoan mitochondrial nucleotide sequences. BMC Bioinform. 2008, 24, 5–172. [Google Scholar] [CrossRef] [Green Version]
  29. Xia, X.; Zheng, X.; Salemi, M.; Lu, C.; Wang, Y. An index of substitution saturation and its application. Mol. Phylogenet. Evol. 2003, 26, 1–7. [Google Scholar] [CrossRef]
  30. Xia, X.; Xie, Z. Dambe: Software package for data analysis in molecular biology and evolution. J. Hered. 2001, 32, 371–373. [Google Scholar] [CrossRef] [Green Version]
  31. Lam-Tung, N.; Schmidt, H.A.; Arndt, V.H.; Quang, M.B. Iq-Tree: A fast and effective stochastic algorithm for estimating maximum-likelihood phylogenies. Mol. Phylogenet. Evol. 2015, 32, 268–274. [Google Scholar] [CrossRef]
  32. Kalyaanamoorthy, S.; Minh, B.Q.; Wong, T.; Haeseler, A.V.; Jermiin, L.S. Modelfinder: Fast model selection for accurate phylogenetic estimates. Nat. Methods 2017, 14, 587–589. [Google Scholar] [CrossRef] [PubMed] [Green Version]
  33. Huelsenbeck, J.P. Mrbayes 3.2: Efficient bayesian phylogenetic inference and model choice across a large model space. Syst. Biol. 2012, 61, 539–542. [Google Scholar] [CrossRef] [Green Version]
  34. Swofford, D. Paup*: Phylogenetic analysis using parsimony (*and other methods). Evolution 2002, 56, 1776–1788. [Google Scholar] [CrossRef]
  35. Drummond, A.J.; Suchard, M.A.; Xie, D.; Rambaut, A. Bayesian phylogenetics with beauti and the beast 1.7. Mol. Biol. Evol. 2012, 22, 1185–1192. [Google Scholar] [CrossRef] [Green Version]
  36. Rambaut, A.; Drummond, A.J.; Xie, D.; Baele, G.; Suchard, M.A. Posterior summarization in bayesian phylogenetics using Tracer 1.7. Syst Biol. 2018, 67, 901–904. [Google Scholar] [CrossRef] [Green Version]
  37. Uliano-Silva, M.; Americo, J.A.; Costa, I.; Schomaker-Bastos, A.; de Freitas Rebelo, M.; Prosdocimi, F. The complete mitochondrial genome of the golden mussel Limnoperna fortunei and comparative mitogenomics of mytilidae. Gene 2016, 577, 202–208. [Google Scholar] [CrossRef]
  38. Breton, S.; Stewart, D.T.; Hoeh, W.R. Characterization of a mitochondrial orf from the gender-associated mtdnas of Mytilus Spp. (Bivalvia: Mytilidae): Identification of the “missing” atpase 8 gene. Mar. Genom. 2010, 3, 11–18. [Google Scholar] [CrossRef]
  39. Fontanilla, I.K.; Naggs, F.; Wade, C.M. Molecular phylogeny of the Achatinoidea (Mollusca: Gastropoda). Mol. Phylogenet. Vol. 2017, 49, 114. [Google Scholar] [CrossRef]
  40. Serb, J.M.; Charles, L. Complete mtdna sequence of the north American freshwater mussel, Lampsilis ornata (Unionidae): An examination of the evolution and phylogenetic utility of mitochondrial genome organization in bivalvia (Mollusca). Mol. Biol. Evol. 2003, 20, 1854–1866. [Google Scholar] [CrossRef] [Green Version]
  41. Wang, Y.; Yang, Y.; Liu, H.; Kong, L.; Li, Q. Phylogeny of Veneridae (Bivalvia) based on mitochondrial genomes. Zool. Scr. 2020, 50, 58–70. [Google Scholar] [CrossRef]
  42. Smith, D.R.; Snyder, M. Complete mitochondrial dna sequence of the scallop Placopecten magellanicus: Evidence of transposition leading to an uncharacteristically large mitochondrial genome. J. Mol. Evol. 2007, 65, 380–391. [Google Scholar] [CrossRef] [PubMed]
  43. Wu, X.; Li, X.; Li, L.; Xu, X.; Xia, J.; Yu, Z. New features of Asian Crassostrea oyster mitochondrial genomes: A novel alloacceptor trna gene recruitment and two novel orfs. Gene 2012, 507, 112–118. [Google Scholar] [CrossRef] [PubMed]
  44. Hoffmann, R.J.; Boore, J.L.; Brown, W.M. A novel mitochondrial genome organization for the blue mussel, Mytilus edulis. Genetics 1992, 131, 397–412. [Google Scholar] [CrossRef] [PubMed]
  45. Huang, L.; Sun, H.; Li, C.; Zhao, W.; Yao, Y. The complete mitochondrial genome of Platygaster robiniae (Hymenoptera: Platygastridae): A novel trna secondary structure, gene rearrangements and phylogenetic implications. Int. J. Parasitol. Par. 2022, 18, 249–259. [Google Scholar] [CrossRef]
  46. Gu, Y.L.; Sun, C.H.; Liu, P.; Zhang, X.; Sinev, A.Y.; Dumont, H.J.; Han, B.P. Complete mitochondrial genome of Ovalona pulchella (Branchiopoda, Cladocera) as the first representative in the family chydoridae: Gene rearrangements and phylogenetic analysis of cladocera. Gene 2022, 818, 146230. [Google Scholar] [CrossRef]
  47. Xiao, S.; Nguyen, D.T.; Wu, B.; Hao, W. Genetic drift and indel mutation in the evolution of yeast mitochondrial genome size. Genome Biol. Evol. 2017, 9, 3088–3099. [Google Scholar] [CrossRef] [Green Version]
  48. Himmelstrand, K.; Olson, A.; Durling, M.B.M.; Karlsson, M.; Stenlid, J. Intronic and plasmid-derived regions contribute to the large mitochondrial genome sizes of agaricomycetes. Curr. Genet. 2014, 60, 303–313. [Google Scholar] [CrossRef] [Green Version]
  49. Gandini, C.L.; Sanchez-Puerta, M.V. Foreign plastid sequences in plant mitochondria are frequently acquired via mitochondrion-to-mitochondrion horizontal transfer. Sci. Rep. 2017, 7, 43402. [Google Scholar] [CrossRef]
  50. Galtier, N.; Roux, C.; Rousselle, M.; Romiguier, J.; Duret, L. Codon usage bias in animals: Disentangling the effects of natural selection, effective population size, and gc-biased gene conversion. Mol. Biol. Evol. 2018, 35, 1092–1103. [Google Scholar] [CrossRef] [Green Version]
  51. Bohlin, J.; Pettersson, J.H.O. Evolution of genomic base composition: From single cell microbes to multicellular animals. Computat. Struct. Biotec. 2019, 17, 362–370. [Google Scholar] [CrossRef]
  52. Yang, M.; Song, L.; Shi, Y.; Li, J.; Song, N. The first mitochondrial genome of the family epicopeiidae and higher-level phylogeny of Macroheterocera (Lepidoptera: Ditrysia). Int. J. Biol. Macromol. 2019, 136, 123–132. [Google Scholar] [CrossRef] [PubMed]
  53. Sahyoun, A.H.; Bernt, M.; Stadler, P.F.; Tout, K. Gc skew and mitochondrial origins of replication. Mitochondrion 2014, 17, 56–66. [Google Scholar] [CrossRef] [PubMed]
  54. Kong, L.; Li, Y.; Kocot, K.M.; Yang, Y.; Qi, L.; Li, Q.; Halanych, K.M. Mitogenomics reveals phylogenetic relationships of Arcoida (Mollusca, Bivalvia) and multiple independent expansions and contractions in mitochondrial genome size. Mol. Phylogenet. Evol. 2020, 150, 106857. [Google Scholar] [CrossRef]
  55. Meng, X.; Zhao, N.; Shen, X.; Hao, J.; Liang, M.; Zhu, X.; Cheng, H.; Yan, B.; Liu, Z. Complete mitochondrial genome of Coelomactra Antiquata (Mollusca: Bivalvia): The first representative from the family mactridae with novel gene order and unusual tandem tepeats. Comp. Biochem. Physiol. Part D Genom. Proteom. 2012, 7, 175–179. [Google Scholar] [CrossRef] [PubMed]
  56. Ojala, D.; Montoya, J.; Attardi, G. Trna punctuation model of rna processing in human mitochondria. Nature 1981, 290, 470–474. [Google Scholar] [CrossRef]
  57. Southworth, J.; Armitage, P.; Fallon, B.; Dawson, H.; Bryk, J.; Carr, M. Patterns of ancestral animal codon usage bias revealed through holozoan protists. Mol. Biol. Evol. 2018, 35, 2499–2511. [Google Scholar] [CrossRef] [Green Version]
  58. Shen, X.; Meng, X.P.; Chu, K.H.; Zhao, N.N.; Tian, M.; Liang, M.; Hao, J. Comparative mitogenomic analysis reveals cryptic species: A case study in Mactridae (Mollusca: Bivalvia). Comp. Biochem. Physiol. Part D Genom. Proteom. 2014, 12, 1–9. [Google Scholar] [CrossRef]
  59. Cejp, B.; Ravara, A.; Aguado, M.T. First mitochondrial genomes of Chrysopetalidae (Annelida) from shallow-water and deep-sea chemosynthetic environments. Gene 2022, 815, 146159. [Google Scholar] [CrossRef]
  60. Wolstenholme, D. Genetic novelties in mitochondrial genomes of multicellular animals. Curr. Opin. Genet. Dev. 1992, 2, 918–925. [Google Scholar] [CrossRef]
  61. Wu, X.; Li, X.; Li, L.; Yu, Z. A unique trna gene family and a novel, highly expressed orf in the mitochondrial genome of the silver-lip pearl oyster, Pinctada Maxima (Bivalvia: Pteriidae). Gene 2012, 510, 22–31. [Google Scholar] [CrossRef]
  62. Sun, S.E.; Kong, L.; Yu, H.; Li, Q. Complete mitochondrial genome of Anadara vellicata (Bivalvia: Arcidae): A unique gene order and large atypical non-coding region. Comp. Biochem. Physiol. Part D Genom. Proteom. 2015, 16, 73–82. [Google Scholar] [CrossRef] [PubMed]
  63. Jühling, F.; Pütz, J.; Bernt, M.; Donath, A.; Middendorf, M.; Florentz, C.; Stadler, P.F. Improved systematic trna gene annotation allows new insights into the evolution of mitochondrial trna structures and into the mechanisms of mitochondrial genome rearrangements. Nucleic Acids Res. 2012, 40, 2833–2845. [Google Scholar] [CrossRef] [PubMed] [Green Version]
  64. Satoh, T.P.; Miya, M.; Mabuchi, K.; Nishida, M. Structure and variation of the mitochondrial genome of fishes. BMC Genom. 2016, 17, 1–20. [Google Scholar] [CrossRef] [PubMed] [Green Version]
  65. Dowton, M.; Castro, L.R.; Austin, A.D. Mitochondrial gene rearrangements as phylogenetic characters in the invertebrates: The examination of genome ‘morphology’. Invertebr. Syst. 2002, 16, 345–356. [Google Scholar] [CrossRef]
  66. Alexandre, H.; Nelly, L.; Jean, D. Evidence for multiple reversals of asymmetric mutational constraints during the evolution of the mitochondrial genome of metazoa, and consequences for phylogenetic inferences. Syst. Biol. 2005, 54, 277–298. [Google Scholar] [CrossRef]
  67. Cameron, S.L.; Johnson, K.P.; Whiting, M.F. The mitochondrial genome of the screamer louse bothriometopus (Phthiraptera: Ischnocera): Effects of extensive gene rearrangements on the evolution of the genome. J. Mol. Evol. 2007, 65, 589–604. [Google Scholar] [CrossRef]
  68. Brown, M.W.M. Tandem duplications in animal mitochondrial dnas: Variation in incidence and gene content among lizards. Proc. Natl. Acad. Sci. USA 1987, 84, 7183–7187. [Google Scholar] [CrossRef] [Green Version]
  69. Lavrov, D.V.; Boore, J.L.; Brown, W.M. Complete mtdna sequences of two millipedes suggest a new model for mitochondrial gene rearrangements: Duplication and nonrandom loss. Mol. Biol. Evol. 2002, 19, 163–169. [Google Scholar] [CrossRef] [Green Version]
  70. Rokas, A.; Ladoukakis, E.; Zouros, E. Animal mitochondrial dna recombination revisited. Trends Ecol. Evol. 2003, 18, 411–417. [Google Scholar] [CrossRef]
  71. Cantatore, P.; Gadaleta, M.N.; Roberti, M.; Saccone, C.; Wilson, A.C. Duplication and remoulding of trna genes during the evolutionary rearrangement of mitochondrial genomes. Nature 1987, 329, 853–855. [Google Scholar] [CrossRef]
  72. Moritz, C.; Dowling, T.E.; Brown, W.M. Evolution of animal mitochondrial dna: Relevance for population biology and systematics. Annu. Rev. Ecol. Syst. 1987, 18, 269–292. [Google Scholar] [CrossRef]
  73. Dreyer, H.; Steiner, G. The complete sequence and gene organization of the mitochondrial genome of the gadilid scaphopod Siphonodentalium lobatum (Mollusca). Mol. Phylogenet. Evol. 2004, 31, 605–617. [Google Scholar] [CrossRef] [PubMed]
  74. Lubośny, M.; Przyłucka, A.; Śmietanka, B.; Breton, S.; Burzyński, A. 2018 Actively transcribed and expressed atp8 gene in Mytilus edulis mussels. PeerJ6 2018, e4897. [Google Scholar] [CrossRef] [Green Version]
  75. Liu, J.; Liu, H.; Zhang, H. Phylogeny and evolutionary radiation of the marine mussels (Bivalvia: Mytilidae) based on mitochondrial and nuclear genes. Mol. Phylogenet. Evol. 2018, 126, 233–240. [Google Scholar] [CrossRef]
  76. Samadi, S.; Quéméré, E.; Lorion, J.; Tillier, A.; von Cosel, R.; Lopez, P.; Cruaud, C.; Couloux, A.; Boisselier-Dubayle, M.C. Molecular phylogeny in mytilids supports the wooden steps to deep-sea vents hypothesis. Comptes Rendus Biol. 2007, 330, 446–456. [Google Scholar] [CrossRef] [PubMed]
  77. Sun, J.; Zhang, Y.; Xu, T.; Zhang, Y.; Mu, H.; Zhang, Y.; Lan, Y.; Fields, C.J.; Hui, J.H.L.; Zhang, W.; et al. Adaptation to deep-sea chemosynthetic environments as revealed by mussel genomes. Nat. Ecol. Evol. 2017, 1, 121. [Google Scholar] [CrossRef] [Green Version]
  78. Distel, D.L. Phylogenetic relationships among mytilidae (Bivalvia): 18S rrna data suggest convergence in mytilid body plans. Mol. Phylogenet. Evol. 2000, 15, 25–33. [Google Scholar] [CrossRef]
  79. Wood, A.R.; Apte, S.; MacAvoy, E.S.; Gardner, J.P. A molecular phylogeny of the marine mussel genus Perna (Bivalvia: Mytilidae) based on nuclear (its1&2) and mitochondrial (coi) dna sequences. Mol. Phylogenet. Evol. 2007, 44, 685–698. [Google Scholar] [CrossRef]
  80. Cunha, R.L.; Nicastro, K.R.; Costa, J.; McQuaid, C.D.; Serrão, E.A.; Zardi, G.I. Wider sampling reveals a non-sister relationship for geographically contiguous lineages of a marine mussel. Ecol. Evol. 2014, 4, 2070–2081. [Google Scholar] [CrossRef]
  81. Combosch, D.J.; Collins, T.M.; Glover, E.A.; Graf, D.L.; Bieler, R.A. Family-level tree of life for bivalves based on a sanger-sequencing approach. Mol. Phylogenet. Evol. 2017, 107, 191–208. [Google Scholar] [CrossRef] [Green Version]
  82. Trovant, B.; Orensanz, J.L.; Ruzzante, D.E.; Stotz, W.; Basso, N.G. Scorched mussels (Bivalvia: Mytilidae: Brachidontinae) from the temperate coasts of south America: Phylogenetic relationships, trans-pacific connections and the footprints of quaternary glaciations. Mol. Phylogenet. Evol. 2015, 82, 60–74. [Google Scholar] [CrossRef]
  83. Zhao, B.; Gao, S.; Zhao, M.; Lv, H.; Song, J.; Wang, H.; Zeng, Q.; Liu, J. Mitochondrial genomic analyses provide new insights into the "missing" atp8 and adaptive evolution of Mytilidae. BMC Genom. 2022, 23, 738. [Google Scholar] [CrossRef] [PubMed]
  84. Matsumoto, M. Phylogenetic analysis of the subclass pteriomorphia (Bivalvia) from mtdna COI sequences. Mol. Phylogenet. Evol. 2003, 27, 429–440. [Google Scholar] [CrossRef] [PubMed]
  85. Cunha, R.L.; Nicastro, K.R.; Zardi, G.I.; Madeira, C.; McQuaid, C.D.; Cox, C.J.; Castilho, R. Comparative mitogenomic analyses and gene rearrangements reject the alleged polyphyly of a bivalve genus. PeerJ 2022, 10, e13953. [Google Scholar] [CrossRef] [PubMed]
  86. Kafanov, A.I.; Drozdov, A.L. Comparative sperm morphology and phylogenetic classification of recent mytiloidea (Bivalvia). Malacologia 1998, 39, 129–139. [Google Scholar]
  87. Coan, E.V.; Valentich-Scott, P.; Bernard, F.R. Bivalve Seashells of Western North America: Marine Mollusks from Arctic Alaska to Baja California; Santa Barbara Museum of Natural History: Santa Barbara, CA, USA, 2000. [Google Scholar]
  88. Malchus, N. Constraints in the ligament ontogeny and evolution of pteriomorphian bivalvia. Palaeontology 2010, 47, 1539–1574. [Google Scholar] [CrossRef]
  89. Steiner, G.; Hammer, S. Molecular phylogeny of the bivalvia inferred from 18S rdna sequences with particular reference to the pteriomorphia. Geol. Soc. Lond. Spec. Publ. 2000, 177, 11–29. [Google Scholar] [CrossRef]
  90. Sun, W.; Gao, L. Phylogeny and comparative genomic analysis of pteriomorphia (Mollusca: Bivalvia) based on complete mitochondrial genomes. Mar. Biol. Res. 2017, 13, 255–268. [Google Scholar] [CrossRef]
  91. Danic-Tchaleu, G.; Heurtebise, S.; Morga, B.; Lapègue, S. Complete mitochondrial dna sequence of the European flat oyster Ostrea edulis confirms ostreidae classification. BMC Res. Notes 2011, 4, 400. [Google Scholar] [CrossRef] [Green Version]
Figure 1. Circular mitogenome map of the mitochondrial genome of M. virgata. Protein coding, ribosomal, and tRNA genes are shown with standard abbreviations. Arrows indicate the orientation of gene transcription.
Genes 14 00910 g001
Figure 2. Amino acid compositions of M. virgata mitochondrial genomes.
Genes 14 00910 g002
Figure 3. Relative synonymous codon usages (RSCU) in the mitogenomes of M. virgata.
Genes 14 00910 g003
Figure 4. Putative secondary structures of the tRNA genes in the mitogenome of M. virgata. The tRNAs are labeled with the abbreviations of their corresponding amino acids.
Genes 14 00910 g004
Figure 5. Linearized representation of the mitochondrial gene arrangement in Mytilidae bivalves (see Figure 7 for detailed relationships among Mytilidae species). Gene segments are not drawn to scale. The gene arrangement of all genes is transcribed from left to right. The orange dot indicates the specie of this study.
Genes 14 00910 g005
Figure 6. Comparison of mitochondrial gene rearrangements between the M. virgata and Molluscan ancestral gene orders. Gene segments are not drawn to scale. The blue symbol indicates the specie of this study.
Genes 14 00910 g006
Figure 7. The phylogenetic tree for M. virgata and other bivalvia species based on 12 PCGs. Phylogenetic tree inferred using Bayesian inference (BI) and maximum likelihood (ML) methods. The value on the left side of the slash is the posterior probabilities estimated by the Bayesian tree, and the value on the right side is the maximum likelihood tree. The blue dot indicates M. virgata in this study.
Genes 14 00910 g007
Figure 8. Divergence time estimations for Brachidontinae, Mytilinae, and Mytiliseptinae by using Bayesian relaxed dating methods (BEAST) based on the nucleotide sequences of 12 PCGs (except atp8). Horizontal bars indicate 95% relevant nodes and credible intervals of the estimated divergence time. Calibration taxa are indicated with red asterisks on the corresponding nodes, and the orange dot indicates M. virgate in this study.
Genes 14 00910 g008
Table 1. Skewness of the M. virgata mitogenome.
RegionSize (bp)A (%)T (%)G (%)C (%)A + T (%)AT-SkewGC-Skew
Mitogenome14,71325.7543.5620.979.7369.31–0.257 0.366
cox1156422.8943.4822.0611.5766.37–0.310 0.312
cox268724.8941.4822.5611.0660.70–0.250 0.342
atp671520.7047.6921.969.6563.96–0.395 0.389
atp812220.9352.7123.263.1073.64–0.4310.765
cox384323.6145.5521.839.0269.16–0.317 0.415
nad334823.2847.7020.698.3370.98–0.344 0.426
nad194524.0245.2921.279.4269.31–0.307 0.386
nad5171025.3244.2722.817.6064.96–0.272 0.500
nad4130224.0447.8520.207.9171.89–0.331 0.437
nad4l27326.7442.8622.717.6969.60–0.232 0.494
nad646521.5150.7521.086.6762.42–0.405 0.519
cob116723.3145.5919.3711.7464.05–0.323 0.245
nad2104126.6143.0419.8810.4763.76–0.236 0.310
tRNAs143530.6637.8420.0711.4368.50–0.105 0.274
rRNAs187230.7838.8320.0810.3269.61–0.115 0.321
PCGs11,18923.9445.2721.369.4369.21–0.597 0.387
Table 2. Annotation of the M. virgata mitochondrial genome.
GeneStrandLocationLengthCodonsIntergenic
Nucleotide (bp)
Anticodon
StartStop
cox1+115641564ATA/T0
trnF+1565163167 0TTC
rrnL+163227091078 73
trnY+2783285068 0TAC
nad4l+28513123273ATG/TAA0
trnP+3124318966 0CCA
trnE+3190324758 1GAA
trnC+3249331264 0TGC
nad3+33133660348ATG/TAA5
trnW+3666373065 10TGA
trnL2+3741380565 2TTA
trnK+3808387366 0AAA
trnL1+3874393966 −4CTA
trnG+3936399762 5GGA
rrnS+40034796794 3
trnQ+4800486768 0CAA
trnH+4868492861 3CAC
trnN+4932499665 0AAC
trnM+4997505963 1ATG
nad1+50616005945ATG/TAG0
trnD+6004607168 1GAC
nad2+607371131041ATG/TAA5
trnA+7119718466 0GCA
trnV+7185724763 0GTA
nad4+724885491302ATG/TAA42
cox3+85929434843ATT/TAA0
trnS2+9435949763 0TCA
nad5+949811,2071710ATG/TAG3
nad6+11,21111,675465ATG/TAA39
trnI+11,71511,77965 3ATC
trnT+11,78311,84967 0ACA
cob+11,85013,0161167ATT/TAG5
cox2+13,02213,708687ATG/TAG5
trnR+13,71413,78370 1CGA
atp8+13,78513,913122GTG/TAA−7
atp6+13,90714,621715ATG/T0
trnS1+14,62214,69069 23AGC
Table 3. The codon number and relative synonymous codon usage in the mitochondrial genomes of M. virgata. The asterisk (*) in the table indicates the stop codon.
CodonCountRSCUCodonCountRSCUCodonCountRSCUCodonCountRSCU
UUU (F)3991.58UCU (S)731.43UAU (Y)2131.67UGU (C)1451.6
UUC (F)1060.42UCC (S)260.51UAC (Y)420.33UGC (C)360.40
UUA (L)2822.16UCA (S)460.90UAA (*)1721.16UGA (W)1121.09
UUG (L)2061.58UCG (S)250.49UAG (*)1240.84UGG (W)930.91
CUU (L)1240.95CCU (P)382.49CAU (H)561.78CGU (R)341.97
CUC (L)290.22CCC (P)60.39CAC (H)70.22CGC (R)110.64
CUA (L)740.57CCA (P)80.52CAA (Q)271.00CGA (R)130.75
CUG (L)670.51CCG (P)90.59CAG (Q)271.00CGG (R)110.64
AUU (I)2261.65ACU (T)492.28AAU (N)981.41AGU (S)881.73
AUC (I)480.35ACC (T)80.37AAC (N)410.59AGC (S)210.41
AUA (M)1471.08ACA (T)150.70AAA (K)1141.19AGA (S)691.36
AUG (M)1250.92ACG (T)140.65AAG (K)770.81AGG (S)591.16
GUU (V)2031.82GCU (A)552.06GAU (D)981.68GGU (G)1301.99
GUC (V)410.37GCC (A)120.45GAC (D)190.32GGC (G)130.20
GUA (V)1000.89GCA (A)220.82GAA (E)831.26GGA (G)580.89
GUG (V)1030.92GCG (A)180.67GAG (E)490.74GGG (G)600.92
Table 4. Annotation of atp8 gene in Mytilidae.
SpeciesPosition (bp)Size (bp)Intergenic Region
(bp)
Start CodonStop CodonGenBank
Modiolus kurilensis676–861186191ATGTAAKY242717
Modiolus modiolus3240–3419 180194ATGTAANC_033537
Modiolus nipponicus3409–3636 228304ATGTAANC_044130
Modiolus philippinarum16,113–16,304 192209ATGTAANC_035422
Modiolus comptus3106–3276171670ATGTAGMN602036
Arcuatula senhousia7403–7594192216ATGTAGNC_014590
Mytilus unguiculatus8677–8949273286ATGTAANC_024733
Mytilisepta keenae15,718–15,882 165186 ATG TAAMK721542
Disclaimer/Publisher’s Note: The statements, opinions and data contained in all publications are solely those of the individual author(s) and contributor(s) and not of MDPI and/or the editor(s). MDPI and/or the editor(s) disclaim responsibility for any injury to people or property resulting from any ideas, methods, instructions or products referred to in the content.

