
Identification and Interpretation of eQTL and eGenes for Hodgkin Lymphoma Susceptibility

Abstract
:1. Introduction
2. Materials and Methods
2.1. Gene Expression and Genotype Data
2.2. GWAS Signals for HL
2.3. Statistical Analysis for Identifying eQTL
2.4. Functional Analysis of eGenes
2.5. Functional Analysis of eQTL
3. Results
3.1. eQTL Analysis
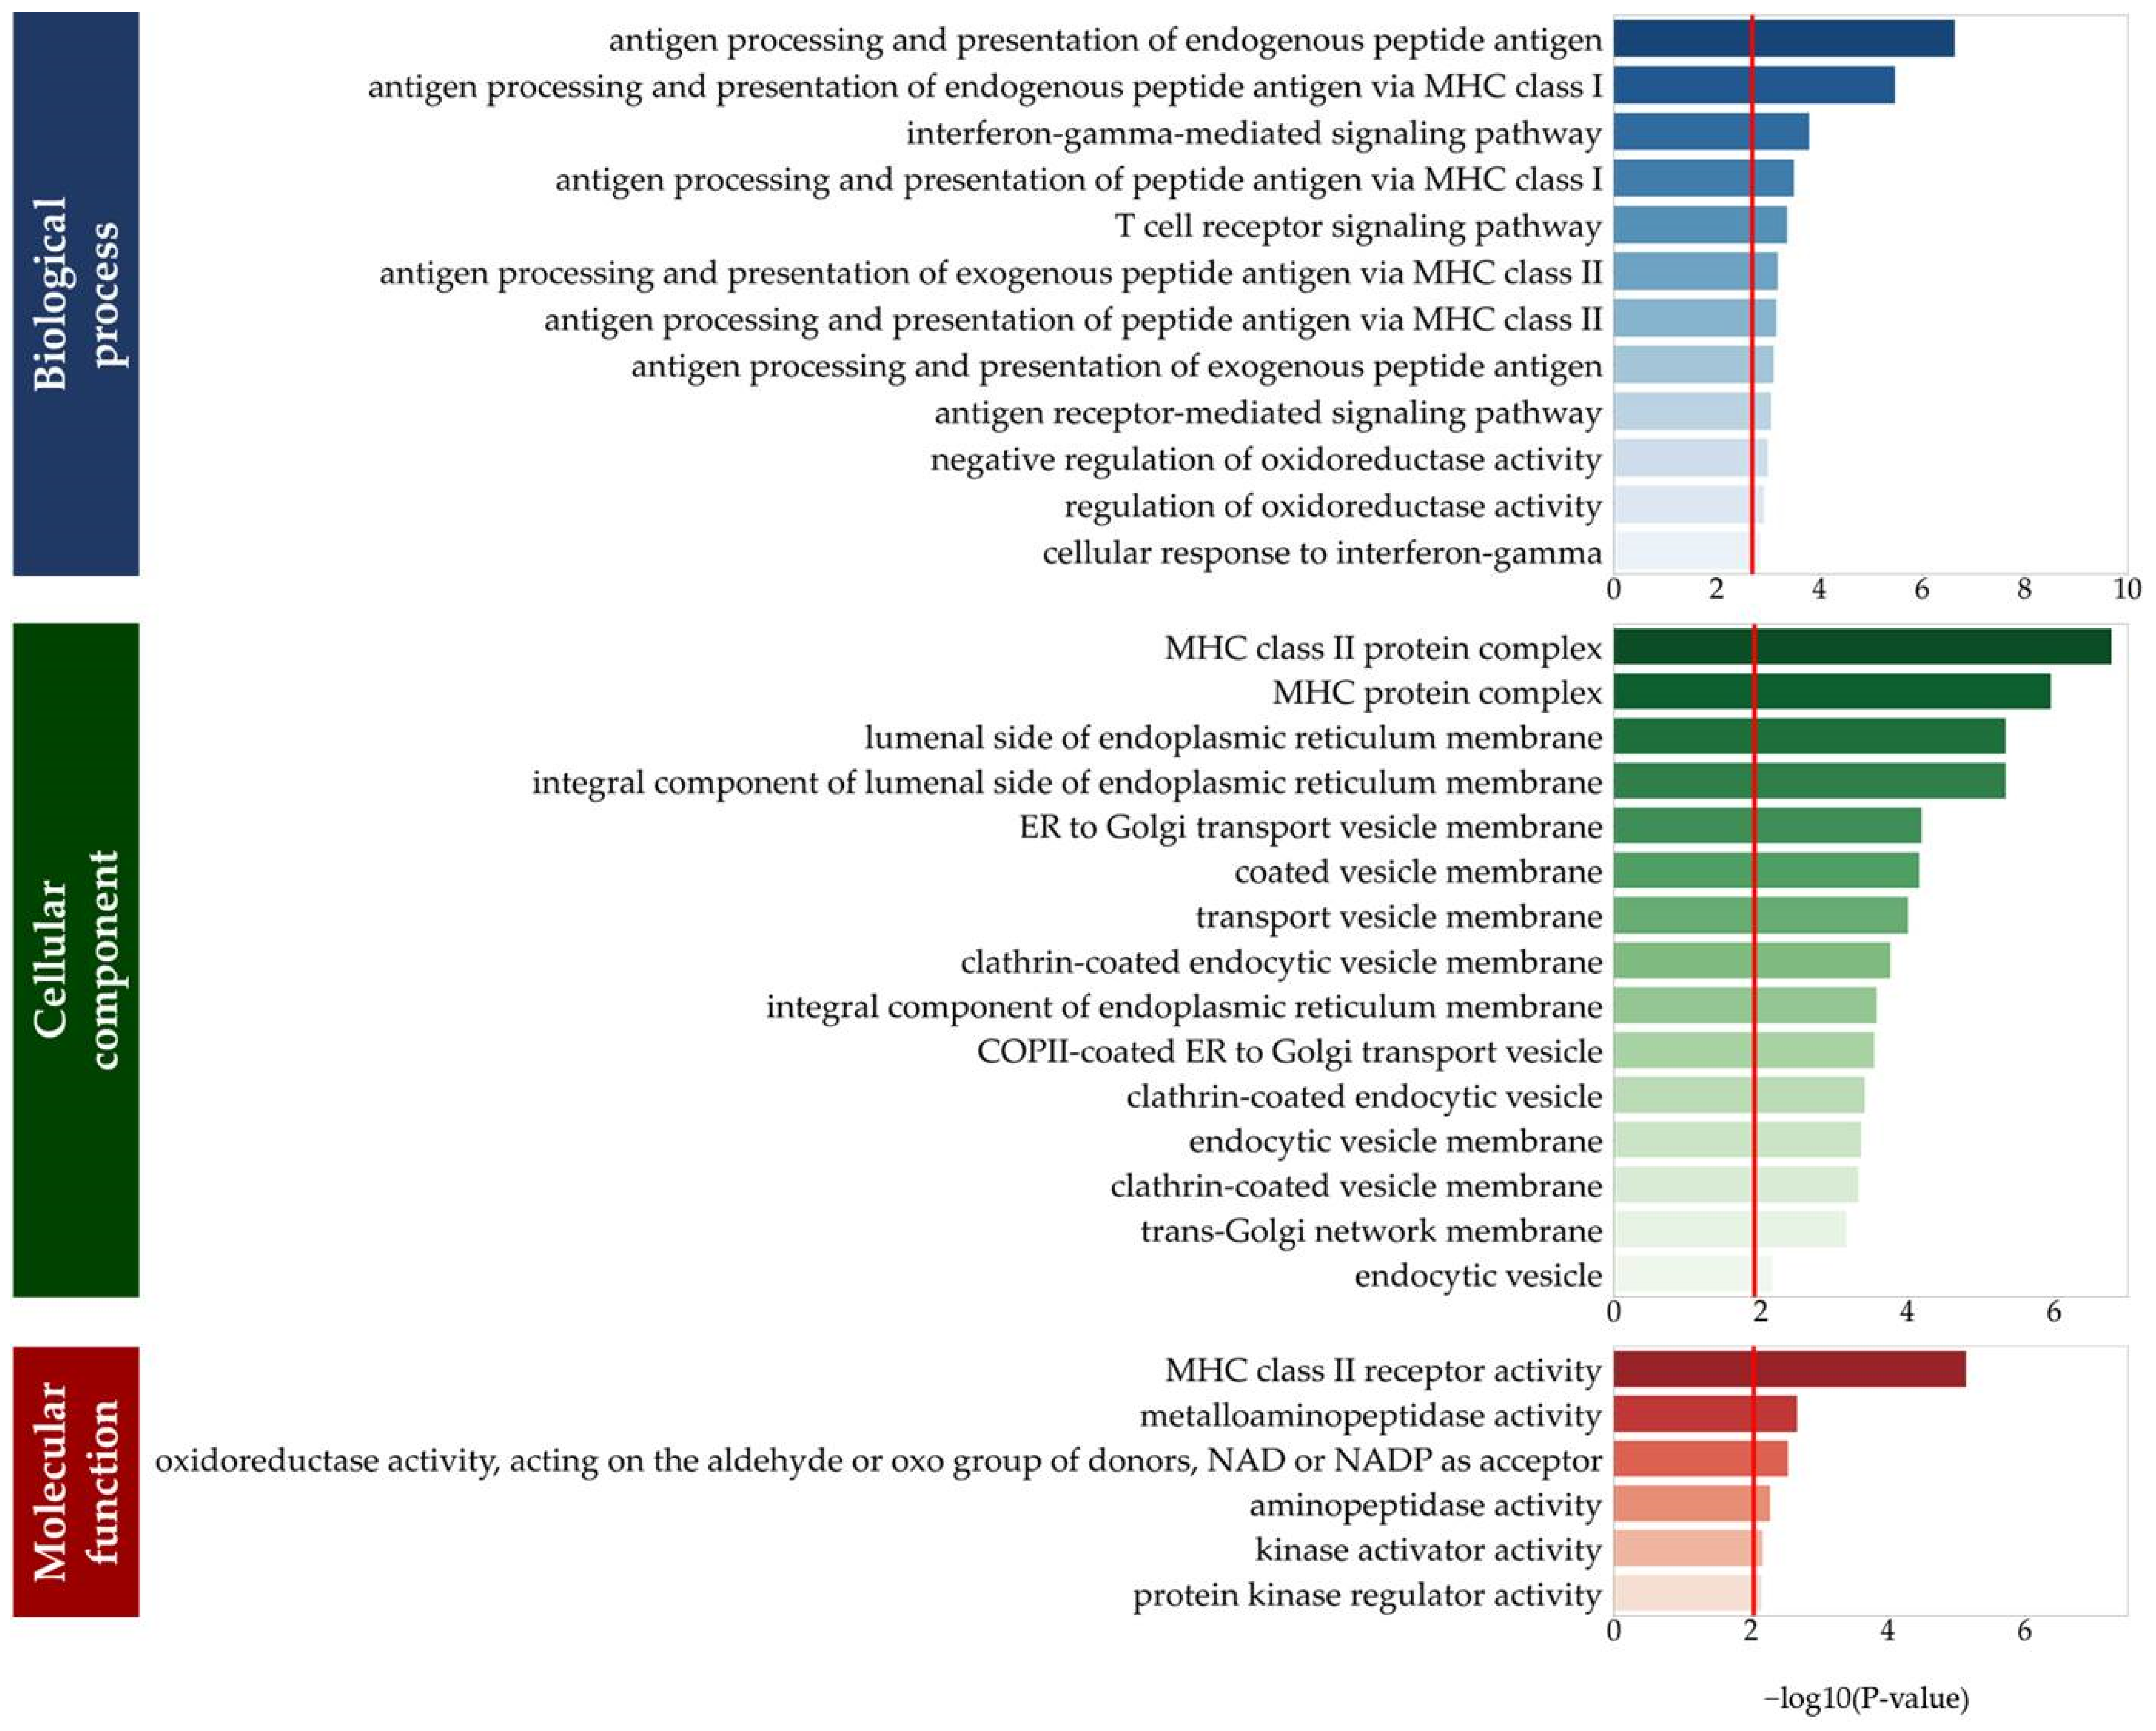
3.2. Functions of eGenes
3.3. Functions of Cis-Regulatory eQTL
4. Discussion
5. Conclusions
Author Contributions
Funding
Institutional Review Board Statement
Informed Consent Statement
Data Availability Statement
Conflicts of Interest
References
- Metzger, M.L.; Mauz-Körholz, C. Epidemiology, outcome, targeted agents and immunotherapy in adolescent and young adult non-Hodgkin and Hodgkin lymphoma. Br. J. Haematol. 2019, 185, 1142–1157. [Google Scholar] [CrossRef] [PubMed]
- Kaseb, H.; Babiker, H.M. Hodgkin Lymphoma; StatPearls Publishing: Treasure Island, FL, USA, 2022. Available online: https://www.ncbi.nlm.nih.gov/books/NBK499969/ (accessed on 10 July 2022).
- Kharazmi, E.; Fallah, M.; Pukkala, E.; Olsen, J.H.; Tryggvadottir, L.; Sundquist, K.; Tretli, S.; Hemminki, K. Risk of familial classical Hodgkin lymphoma by relationship, histology, age, and sex: A joint study from five Nordic countries. Blood 2015, 126, 1990–1995. [Google Scholar] [CrossRef] [PubMed]
- Hsu, J.L.; Glaser, S.L. Epstein–Barr virus-associated malignancies: Epidemiologic patterns and etiologic implications. Crit. Rev. Oncol. Hematol. 2000, 34, 27–53. [Google Scholar] [CrossRef]
- Biggar, R.J.; Jaffe, E.S.; Goedert, J.J.; Chaturvedi, A.; Pfeiffer, R.; Engels, E.A. for the HIV/AIDS Cancer Match Study. Hodgkin lymphoma and immunodeficiency in persons with HIV/AIDS. J. Blood 2006, 108, 3786–3791. [Google Scholar] [CrossRef]
- Landgren, O.; Engels, E.A.; Pfeiffer, R.M.; Gridley, G.; Mellemkjaer, L.; Olsen, J.H.; Kerstann, K.F.; Wheeler, W.; Hemminki, K.; Linet, M.S.; et al. Autoimmunity and susceptibility to Hodgkin lymphoma: A population-based case-control study in Scandinavia. J. Natl. Cancer Inst. 2006, 98, 1321–1330. [Google Scholar] [CrossRef] [PubMed]
- Taj, T.; Poulsen, A.H.; Ketzel, M.; Geels, C.; Brandt, J.; Christensen, J.H.; Hvidtfeldt, U.A.; Sørensen, M.; Raaschou-Nielsen, O. Long-term residential exposure to air pollution and Hodgkin lymphoma risk among adults in Denmark: A population-based case–control study. Cancer Causes Control 2021, 32, 935–942. [Google Scholar] [CrossRef]
- Hjalgrim, H.; Melbye, M.; Lagiou, P. Hodgkin lymphoma. In Textbook Cancer Epidemiology, 3rd ed.; Oxford Academic: New York, NY, USA, 2018. [Google Scholar] [CrossRef]
- Rudant, J.; Menegaux, F.; Leverger, G.; Baruchel, A.; Nelken, B.; Bertrand, Y.; Hartmann, O.; Pacquement, H.; Vérité, C.; Robert, A.; et al. Family history of cancer in children with acute leukemia, Hodgkin’s lymphoma or non-Hodgkin’s lymphoma: The ESCALE study (SFCE). Int. J. Cancer 2007, 121, 119–126. [Google Scholar] [CrossRef]
- Küppers, R.; Rajewsky, K.; Zhao, M.; Simons, G.; Laumann, R.; Fischer, R.; Hansmann, M.L. Hodgkin disease: Hodgkin and Reed-Sternberg cells picked from histological sections show clonal immunoglobulin gene rearrangements and appear to be derived from B cells at various stages of development. Proc. Natl. Acad. Sci. USA 1994, 91, 10962–10966. [Google Scholar] [CrossRef]
- Kanzler, H.; Küppers, R.; Hansmann, M.L.; Rajewsky, K. Hodgkin and Reed-Sternberg cells in Hodgkin’s disease represent the outgrowth of a dominant tumor clone derived from (crippled) germinal center B cells. J. Exp. Med. 1996, 184, 1495–1505. [Google Scholar] [CrossRef]
- Jungnickel, B.; Staratschek-Jox, A.; Bräuninger, A.; Spieker, T.; Wolf, J.; Diehl, V.; Hansmann, M.L.; Rajewsky, K.; Küppers, R. Clonal deleterious mutations in the IκBα gene in the malignant cells in Hodgkin’s lymphoma. J. Exp. Med. 2000, 191, 395–402. [Google Scholar] [CrossRef]
- Lake, A.; Shield, L.A.; Cordano, P.; Chui, D.T.; Osborne, J.; Crae, S.; Hansmann, M.-L.; Rajewsky, K.; Küppers, R. Mutations of NFKBIA, encoding IκBα, are a recurrent finding in classical Hodgkin lymphoma but are not a unifying feature of non-EBV-associated cases. Int. J. Cancer 2009, 125, 1334–1342. [Google Scholar] [CrossRef] [PubMed]
- Emmerich, F.; Theurich, S.; Hummel, M.; Haeffker, A.; Vry, M.S.; Döhner, K.; Bommert, K.; Stein, H.; Dörken, B. Inactivating I kappa B epsilon mutations in Hodgkin/Reed-Sternberg cells. J. Pathol. 2003, 201, 413–420. [Google Scholar] [CrossRef] [PubMed]
- Schmitz, R.; Hansmann, M.L.; Bohle, V.; Martin-Subero, J.I.; Hartmann, S.; Mechtersheimer, G.; Klapper, W.; Vater, I.; Giefing, M.; Gesk, S.; et al. TNFAIP3 (A20) is a tumor suppressor gene in Hodgkin lymphoma and primary mediastinal B cell lymphoma. J. Exp. Med. 2009, 206, 981–989. [Google Scholar] [CrossRef]
- Nomoto, J.; Hiramoto, N.; Kato, M.; Sanada, M.; Maeshima, A.M.; Taniguchi, H.; Hosoda, F.; Asakura, Y.; Munakata, W.; Sekiguchi, N.; et al. Deletion of the TNFAIP3/A20 gene detected by FICTION analysis in classical Hodgkin lymphoma. BMC Cancer 2012, 12, 457. [Google Scholar] [CrossRef]
- Martin-Subero, J.I.; Gesk, S.; Harder, L.; Sonoki, T.; Tucker, P.W.; Schlegelberger, B.; Grote, W.; Novo, F.J.; Calasanz, M.J.; Hansmann, M.L.; et al. Recurrent involvement of the REL and BCL11A loci in classical Hodgkin lymphoma. Blood 2002, 99, 1474–1477. [Google Scholar] [CrossRef] [PubMed]
- Steidl, C.; Telenius, A.; Shah, S.P.; Farinha, P.; Barclay, L.; Boyle, M.; Connors, J.M.; Horsman, D.E.; Gascoyne, R.D. Genome-wide copy number analysis of Hodgkin Reed-Sternberg cells identifies recurrent imbalances with correlations to treatment outcome. Blood 2010, 116, 418–427. [Google Scholar] [CrossRef]
- Otto, C.; Giefing, M.; Massow, A.; Vater, I.; Gesk, S.; Schlesner, M.; Richter, J.; Klapper, W.; Hansmann, M.L.; Siebert, R.; et al. Genetic lesions of the TRAF3 and MAP3K14 genes in classical Hodgkin lymphoma. Br. J. Haematol. 2012, 157, 702–708. [Google Scholar] [CrossRef]
- Martin-Subero, J.I.; Wlodarska, I.; Bastard, C.; Picquenot, J.M.; Höppner, J.; Giefing, M.; Klapper, W.; Siebert, R. Chromosomal rearrangements involving the BCL3 locus are recurrent in classical Hodgkin and peripheral T-cell lymphoma. Blood 2006, 108, 401–402. [Google Scholar] [CrossRef]
- Joos, S.; Küpper, M.; Ohl, S.; von Bonin, F.; Mechtersheimer, G.; Bentz, M.; Marynen, P.; Möller, P.; Pfreundschuh, M.; Trümper, L.; et al. Genomic imbalances including amplification of the tyrosine kinase gene JAK2 in CD30+ Hodgkin cells. Cancer Res. 2000, 60, 549–552. [Google Scholar]
- Weniger, M.A.; Melzner, I.; Menz, C.K.; Wegener, S.; Bucur, A.J.; Dorsch, K.; Mattfeldt, T.; Barth, T.F.E.; Möller, P. Mutations of the tumor suppressor gene SOCS-1 in classical Hodgkin lymphoma are frequent and associated with nuclear phospho-STAT5 accumulation. Oncogene 2006, 25, 2679–2684. [Google Scholar] [CrossRef]
- Tiacci, E.; Ladewig, E.; Schiavoni, G.; Penson, A.; Fortini, E.; Pettirossi, V.; Wang, Y.; Rosseto, A.; Venanzi, A.; Vlasevska, S.; et al. Pervasive mutations of JAK-STAT pathway genes in classical Hodgkin lymphoma. Blood 2018, 131, 2454–2465. [Google Scholar] [CrossRef] [PubMed]
- Gunawardana, J.; Chan, F.C.; Telenius, A.; Woolcock, B.; Kridel, R.; Tan, K.L.; Ben-Neriah, S.; Mottok, A.; Lim, R.S.; Boyle, M.; et al. Recurrent somatic mutations of PTPN1 in primary mediastinal B cell lymphoma and Hodgkin lymphoma. Nat. Genet. 2014, 46, 329–335. [Google Scholar] [CrossRef] [PubMed]
- Desch, A.K.; Hartung, K.; Botzen, A.; Brobeil, A.; Rummel, M.; Kurch, L.; Georgi, T.; Jox, T.; Bielack, S.; Burdach, S.; et al. Genotyping circulating tumor DNA of pediatric Hodgkin lymphoma. Leukemia 2020, 34, 151–166. [Google Scholar] [CrossRef] [PubMed]
- Roemer, M.G.; Advani, R.H.; Ligon, A.H.; Natkunam, Y.; Redd, R.A.; Homer, H.; Connelly, C.F.; Sun, H.H.; Daadi, S.E.; Freeman, G.J.; et al. PD-L1 and PD-L2 genetic alterations define classical Hodgkin lymphoma and predict outcome. J. Clin. Oncol. 2016, 34, 2690–2697. [Google Scholar] [CrossRef]
- Reichel, J.; Chadburn, A.; Rubinstein, P.G.; Giulino-Roth, L.; Tam, W.; Liu, Y.; Eng, K.; Brody, J.; Inghirami, G.; Carlo-Stella, C.; et al. Flow-sorting and exome sequencing reveals the oncogenome of primary Hodgkin and Reed-Sternberg cells. Blood 2015, 125, 1061–1072. [Google Scholar] [CrossRef]
- Steidl, C.; Shah, S.; Woolcock, B.; Rui, L.; Kawahara, M.; Farinha, P.; Johnson, N.A.; Zhao, Y.; Telenius, A.; Neriah, S.B.; et al. MHC class II transactivator CIITA is a recurrent gene fusion partner in lymphoid cancers. Nature 2011, 471, 377–381. [Google Scholar] [CrossRef]
- Jaffe, E.S. The elusive Reed-Sternberg cell. N. Engl. J. Med. 1989, 320, 529–531. [Google Scholar] [CrossRef]
- Enciso-Mora, V.; Broderick, P.; Ma, Y.; Jarrett, R.F.; Hjalgrim, H.; Hemminki, K.; van den Berg, A.; Olver, B.; Lloyd, A.; Dobbins, S.E.; et al. A genome-wide association study of Hodgkin’s lymphoma identifies new susceptibility loci at 2p16.1 (REL), 8q24.21 and 10p14 (GATA3). Nat. Genet. 2010, 42, 1126–1130. [Google Scholar] [CrossRef]
- Cozen, W.; Li, D.; Best, T.; Van Den Berg, D.J.; Gourraud, P.A.; Cortessis, V.K.; Skol, A.D.; Mack, T.M.; Glaser, S.L.; Weiss, L.M.; et al. A genome-wide meta-analysis of nodular sclerosing Hodgkin lymphoma identifies risk loci at 6p21.32. Blood 2012, 119, 469–475. [Google Scholar] [CrossRef]
- Urayama, K.Y.; Jarrett, R.F.; Hjalgrim, H.; Diepstra, A.; Kamatani, Y.; Chabrier, A.; Gaborieau, V.; Boland, A.; Nieters, A.; Becker, N.; et al. Genome-wide association study of classical Hodgkin lymphoma and Epstein–Barr virus status–defined subgroups. J. Natl. Cancer Inst. 2012, 104, 240–253. [Google Scholar] [CrossRef]
- Frampton, M.; da Silva Filho, M.I.; Broderick, P.; Thomsen, H.; Försti, A.; Vijayakrishnan, J.; Cooke, R.; Enciso-Mora, V.; Hoffmann, P.; Nöthen, M.M.; et al. Variation at 3p24.1 and 6q23.3 influences the risk of Hodgkin’s lymphoma. Nat. Commun. 2013, 4, 2549. [Google Scholar] [CrossRef] [PubMed]
- Cozen, W.; Timofeeva, M.N.; Li, D.; Diepstra, A.; Hazelett, D.; Delahaye-Sourdeix, M.; Edlund, C.K.; Franke, L.; Rostgaard, K.; Van Den Berg, D.J.; et al. A meta-analysis of Hodgkin lymphoma reveals 19p13. 3 TCF3 as a novel susceptibility locus. Nat. Commun. 2014, 5, 3856. [Google Scholar] [CrossRef] [PubMed]
- Law, P.; Sud, A.; Mitchell, J.; Henrion, M.; Orlando, G.; Lenive, O.; Broderick, P.; Speedy, H.E.; Johnson, D.C.; Kaiser, M.; et al. Genome-wide association analysis of chronic lymphocytic leukaemia, Hodgkin lymphoma and multiple myeloma identifies pleiotropic risk loci. Sci. Rep. 2017, 7, 41071. [Google Scholar] [CrossRef] [PubMed]
- Sud, A.; Thomsen, H.; Law, P.J.; Asta Försti, A.; da Silva Filho, M.I.; Holroyd, A.; Broderick, P.; Orlando, G.; Lenive, O.; Wright, L.; et al. Genome-wide association study of classical Hodgkin lymphoma identifies key regulators of disease susceptibility. Nat. Commun. 2017, 8, 1892. [Google Scholar] [CrossRef]
- Sud, A.; Thomsen, H.; Orlando, G.; Försti, A.; Law, P.J.; Broderick, P.; Cooke, R.; Hariri, F.; Pastinen, T.; Easton, D.F.; et al. Genome-wide association study implicates immune dysfunction in the development of Hodgkin lymphoma. Blood 2018, 132, 2040–2052. [Google Scholar] [CrossRef]
- Osman, Y.; Elsharkawy, T.; Hashim, T.M.; Alratroot, J.A.; Alsuwat, H.S.; Otaibi, W.M.A.; Hegazi, F.M.; AbdulAzeez, S.; Borgio, J.F. Functional multigenic variations associated with Hodgkin lymphoma. Int. J. Lab. Hematol. 2021, 43, 1472–1482. [Google Scholar] [CrossRef]
- Chen, C.; Song, N.; Dong, Q.; Sun, X.; Mulder, H.L.; Easton, J.; Zhang, J.; Yasui, Y.; Bhatia, S.; Armstrong, G.T.; et al. Association of single-nucleotide variants in the human leukocyte antigen and other loci with childhood Hodgkin lymphoma. JAMA Netw. Open 2022, 5, e2225647. [Google Scholar] [CrossRef]
- The 1000 Genomes Project Consortium. A global reference for human genetic variation. Nature 2015, 526, 68–74. [Google Scholar] [CrossRef]
- Hoen, P.A.; Friedländer, M.R.; Almlöf, J.; Sammeth, M.; Pulyakhina, I.; Anvar, S.Y.; Laros, J.F.; Buermans, H.P.; Karlberg, O.; Brännvall, M.; et al. Reproducibility of high-throughput mRNA and small RNA sequencing across laboratories. Nat. Biotechnol. 2013, 11, 1015–1022. [Google Scholar] [CrossRef]
- Stegle, O.; Parts, L.; Durbin, R.; Winn, J. A Bayesian framework to account for complex non-genetic factors in gene expression levels greatly increases power in eQTL studies. PLoS Comput. Biol. 2010, 6, e1000770. [Google Scholar] [CrossRef]
- Stegle, O.; Parts, L.; Piipari, M.; Winn, J.; Durbin, R. Using probabilistic estimation of expression residuals (PEER) to obtain increased power and interpretability of gene expression analyses. Nat. Protoc. 2012, 7, 500–507. [Google Scholar] [CrossRef] [PubMed]
- 1000 Genomes Project Consortium; Abecasis, G.R.; Auton, A.; Brooks, L.D.; DePristo, M.A.; Durbin, R.M.; Handsaker, R.E.; Kang, H.M.; Marth, G.T.; McVean, G.A. An integrated map of genetic variation from 1,092 human genomes. Nature 2012, 491, 56–65. [Google Scholar] [CrossRef] [PubMed]
- Welter, D.; MacArthur, J.; Morales, J.; Burdett, T.; Hall, P.; Junkins, H.; Klemm, A.; Flicek, P.; Manolio, T.; Hindorff, L.; et al. The NHGRI GWAS Catalog, a curated resource of SNP-trait associations. Nucleic Acids Res. 2014, 42, 1001–1006. [Google Scholar] [CrossRef] [PubMed]
- Shin, J.; Lee, C. A mixed model reduces spurious genetic associations produced by population stratification in genome-wide association studies. Genomics 2015, 105, 191–196. [Google Scholar] [CrossRef]
- Lee, C. Genome-wide expression quantitative trait loci analysis using mixed models. Front. Genet. 2018, 9, 341. [Google Scholar] [CrossRef] [PubMed]
- Lee, C. Best linear unbiased prediction of individual polygenic susceptibility to sporadic vascular dementia. J. Alzheimers Dis. 2016, 53, 1115–1119. [Google Scholar] [CrossRef]
- Yang, J.; Lee, S.H.; Goddard, M.E.; Visscher, P.M. GCTA: A tool for genome-wide complex trait analysis. Am. J. Hum. Genet. 2011, 88, 76–82. [Google Scholar] [CrossRef]
- Barrett, J.C.; Fry, B.; Maller, J.; Daly, M.J. Haploview: Analysis and visualization of LD and haplotype maps. Bioinformatics 2005, 21, 263–265. [Google Scholar] [CrossRef]
- Gabriel, S.B.; Schaffner, S.F.; Nguyen, H.; Moore, J.M.; Roy, J.; Blumenstiel, B.; Higgins, J.; DeFelice, M.; Lochner, A.; Faggart, M.; et al. The structure of haplotype blocks in the human genome. Science 2002, 296, 2225–2229. [Google Scholar] [CrossRef]
- Cunningham, F.; Amode, M.R.; Barrell, D.; Beal, K.; Billis, K.; Brent, S.; Carvalho-Silva, D.; Clapham, P.; Coates, G.; Fitzgerald, S.; et al. Ensembl 2105. Nucleic Acids Res. 2015, 43, 662–669. [Google Scholar] [CrossRef]
- Boutet, E.; Lieberherr, D.; Tognolli, M.; Schneider, M.; Bairoch, A. UniProtKB/Swiss-Prot. In Plant Bioinformatics; Methods in Molecular Biology™; Edwards, D., Ed.; Humana Press: Totowa, NJ, USA, 2007; Volume 406. [Google Scholar] [CrossRef]
- Gene Ontology Consortium. The Gene Ontology (GO) database and informatics resource. Nucleic Acids Res. 2004, 32 (Suppl. S1), 258–261. [Google Scholar] [CrossRef] [PubMed]
- Chen, E.Y.; Tan, C.M.; Kou, Y.; Duan, Q.; Wang, Z.; Vaz Meirelles, G.; Clark, N.R.; Ma’ayan, A. Enrichr: Interactive and collaborative HTML5 gene list enrichment analysis tool. BMC Bioinform. 2013, 14, 128. [Google Scholar] [CrossRef] [PubMed]
- Fang, F.; Liu, X.; Peltz, G. GSEApy: A comprehensive package for performing gene set enrichment analysis in Python. Bioinformatics 2022, 11, 1367–4803. [Google Scholar] [CrossRef]
- Zhou, J.; Theesfeld, C.L.; Yao, K.; Chen, K.M.; Wong, A.K.; Troyanskaya, O.G. Deep learning sequence-based ab initio prediction of variant effects on expression and disease risk. Nat. Genet. 2018, 50, 1171–1179. [Google Scholar] [CrossRef] [PubMed]
- Chen, K.M.; Wong, A.K.; Troyanskaya, O.G.; Zhou, J. A sequence-based global map of regulatory activity for deciphering human genetics. Nat. Genet. 2022, 54, 940–949. [Google Scholar] [CrossRef] [PubMed]
- Zheng, R.; Wan, C.; Mei, S.; Qin, Q.; Wu, Q.; Sun, H.; Chen, C.H.; Brown, M.; Zhang, X.; Meyer, C.A.; et al. Cistrome Data Browser: Expanded datasets and new tools for gene regulatory analysis. Nucleic Acids Res. 2019, 47, 729–735. [Google Scholar] [CrossRef] [PubMed]
- ENCODE Project Consortium. An integrated encyclopedia of DNA elements in the human genome. Nature 2012, 489, 57–74. [Google Scholar] [CrossRef]
- Bernstein, B.; Stamatoyannopoulos, J.; Costello, J.; Ren, B.; Milosavljevic, A.; Meissner, A.; Kellis, M.; Marra, M.A.; Beaudet, A.L.; Ecker, J.R.; et al. The NIH Roadmap Epigenomics Mapping Consortium. Nat. Biotechnol. 2010, 28, 1045–1048. [Google Scholar] [CrossRef]
- Zuo, C.; Shin, S.; Keleş, S. atSNP: Transcription factor binding affinity testing for regulatory SNP detection. Bioinformatics 2015, 31, 3353–3355. [Google Scholar] [CrossRef]
- Mathelier, A.; Zhao, X.; Zhang, A.W.; Parcy, F.; Worsley-Hunt, R.; Arenillas, D.J.; Buchman, S.; Chen, C.Y.; Chou, A.; Ienasescu, H.; et al. JASPAR 2014: An extensively expanded and updated open-access database of transcription factor binding profiles. Nucleic Acids Res. 2014, 42, D142–D147. [Google Scholar] [CrossRef]
- Chamuleau, M.E.; Ossenkoppele, G.J.; van Rhenen, A.; van Dreunen, L.; Jirka, S.M.; Zevenbergen, A.; Schuurhuis, G.J.; van de Loosdrecht, A.A. High TRAIL-R3 expression on leukemic blasts is associated with poor outcome and induces apoptosis-resistance which can be overcome by targeting TRAIL-R2. Leuk. Res. 2011, 35, 741–749. [Google Scholar] [CrossRef] [PubMed]
- Rajpal, A.; Cho, Y.A.; Yelent, B.; Koza-Taylor, P.H.; Li, D.; Chen, E.; Whan, M.; Kan, C.; Turi, T.G.; Winoto, A.; et al. Transcriptional activation of known and novel apoptotic pathways by Nur77 orphan steroid receptor. EMBO J. 2003, 22, 6526–6536. [Google Scholar] [CrossRef] [PubMed]
- Park, S.Y.; Shin, J.N.; Woo, H.N.; Piya, S.; Moon, A.R.; Seo, Y.W.; Tae-Hyoung, K. DOBI is cleaved by caspases during TRAIL-induced apoptotic cell death. BMB Rep. 2009, 42, 511–515. [Google Scholar] [CrossRef] [PubMed]
- Redza-Dutordoir, M.; Averill-Bates, D.A. Activation of apoptosis signalling pathways by reactive oxygen species. Biochim. Biophys. Acta 2016, 1863, 2977–2992. [Google Scholar] [CrossRef]
- Liu, X.Z.; Sun, X.; Shen, K.P.; Jin, W.J.; Fu, Z.Y.; Tao, H.R.; Xu, Z.X. Aldehyde dehydrogenase 2 overexpression inhibits neuronal apoptosis after spinal cord ischemia/reperfusion injury. Neural. Regen. Res. 2017, 12, 1166–1171. [Google Scholar] [CrossRef]
- Ikeda, J.; Mamat, S.; Tian, T.; Wang, Y.; Luo, W.; Rahadiani, N.; Aozasa, K.; Morii, E. Reactive oxygen species and aldehyde dehydrogenase activity in Hodgkin lymphoma cells. Lab. Invest. 2012, 92, 606–614. [Google Scholar] [CrossRef]
- Giefing, M.; Winoto-Morbach, S.; Sosna, J.; Döring, C.; Klapper, W.; Böttcher, S.; Adam, D.; Siebert, R.; Schütze, S. Hodgkin-Reed-Sternberg cells in classical Hodgkin lymphoma show alterations of genes encoding the NADPH oxidase complex and impaired reactive oxygen species synthesis capacity. PLoS ONE 2013, 8, e84928. [Google Scholar] [CrossRef]
- Mori, Y.; Yamawaki, K.; Ishiguro, T.; Yoshihara, K.; Ueda, H.; Sato, A.; Ohata, H.; Yoshida, Y.; Minamino, T.; Okamoto, K.; et al. ALDH-dependent glycolytic activation mediates stemness and paclitaxel resistance in patient-derived spheroid models of uterine endometrial cancer. Stem Cell Rep. 2019, 13, 730–746. [Google Scholar] [CrossRef]
- Hartmann, S.; Agostinelli, C.; Diener, J.; Döring, C.; Fanti, S.; Zinzani, P.L.; Gallamini, A.; Bergmann, L.; Pileri, S.; Hansmann, M.L. GLUT1 expression patterns in different Hodgkin lymphoma subtypes and progressively transformed germinal centers. BMC Cancer 2012, 12, 586. [Google Scholar] [CrossRef]
- Mikkilineni, L.; Whitaker-Menezes, D.; Domingo-Vidal, M.; Sprandio, J.; Avena, P.; Cotzia, P.; Dulau-Florea, A.; Gong, J.; Uppal, G.; Zhan, T.; et al. Hodgkin lymphoma: A complex metabolic ecosystem with glycolytic reprogramming of the tumor microenvironment. Semin. Oncol. 2017, 44, 218–225. [Google Scholar] [CrossRef]
- Birkenmeier, K.; Dröse, S.; Wittig, I.; Winkelmann, R.; Käfer, V.; Döring, C.; Hartmann, S.; Wenz, T.; Reichert, A.S.; Brandt, U.; et al. Hodgkin and Reed-Sternberg cells of classical Hodgkin lymphoma are highly dependent on oxidative phosphorylation. Int. J. Cancer 2016, 138, 2231–2246. [Google Scholar] [CrossRef] [PubMed]
- Galber, C.; Acosta, M.J.; Minervini, G.; Giorgio, V. The role of mitochondrial ATP synthase in cancer. Biol. Chem. 2020, 401, 1199–1214. [Google Scholar] [CrossRef] [PubMed]
- Black, W.; Chen, Y.; Matsumoto, A.; Thompson, D.C.; Lassen, N.; Pappa, A.; Vasiliou, V. Molecular mechanisms of ALDH3A1-mediated cellular protection against 4-hydroxy-2-nonenal. Free Radic. Biol. Med. 2012, 52, 1937–1944. [Google Scholar] [CrossRef] [PubMed]
- Koh, J.Y.; Lee, S.J. Metallothionein-3 as a multifunctional player in the control of cellular processes and diseases. Mol. Brain 2020, 13, 116. [Google Scholar] [CrossRef] [PubMed]
- Güven, M.; Oztürk, B.; Sayal, A.; Ozet, A. Lipid peroxidation and antioxidant system in the blood of patients with Hodgkin’s disease. Clin. Biochem. 2000, 33, 209–212. [Google Scholar] [CrossRef] [PubMed]
- Noh, K.M.; Koh, J.Y. Induction and activation by zinc of NADPH oxidase in cultured cortical neurons and astrocytes. J. Neurosci. 2000, 20, 111. [Google Scholar] [CrossRef] [PubMed]
- Quest, A.F.; Bloomenthal, J.; Bardes, E.S.; Bell, R.M. The regulatory domain of protein kinase C coordinates four atoms of zinc. J. Biol. Chem. 1992, 267, 10193–10197. [Google Scholar] [CrossRef]
- Cosentino-Gomes, D.; Rocco-Machado, N.; Meyer-Fernandes, J.R. Cell signaling through protein kinase C oxidation and activation. Int. J. Mol. Sci. 2012, 13, 10697–10721. [Google Scholar] [CrossRef]
- Tang, J.X.; Thompson, K.; Taylor, R.W.; Oláhová, M. Mitochondrial OXPHOS Biogenesis: Co-Regulation of Protein Synthesis, Import, and Assembly Pathways. Int. J. Mol. Sci. 2020, 21, 3820. [Google Scholar] [CrossRef]
- Davis, I.; Yang, Y.; Wherritt, D.; Liu, A. Reassignment of the human aldehyde dehydrogenase ALDH8A1 (ALDH12) to the kynurenine pathway in tryptophan catabolism. J. Biol. Chem. 2018, 293, 9594–9603. [Google Scholar] [CrossRef]
- Badawy, A.A. Kynurenine pathway of tryptophan metabolism: Regulatory and functional aspects. Int. J. Tryptophan. Res. 2017, 10, 1178646917691938. [Google Scholar] [CrossRef] [PubMed]
- Aldinucci, D.; Celegato, M.; Casagrande, N. Microenvironmental interactions in classical Hodgkin lymphoma and their role in promoting tumor growth, immune escape and drug resistance. Cancer Lett. 2016, 380, 243–252. [Google Scholar] [CrossRef] [PubMed]
- Aguet, F.; Anand, S.; Ardlie, K.G.; Gabriel, S.; Getz, G.A.; Graubert, A.; Hadley, K.; Handsaker, R.E.; Huang, K.H.; Kashin, S.; et al. The GTEx consortium atlas of genetic regulatory effects across human tissues. Science 2020, 369, 1318–1330. [Google Scholar] [CrossRef]
- Võsa, U.; Claringbould, A.; Westra, H.J.; Bonder, M.J.; Deelen, P.; Zeng, B.; Kirsten, H.; Saha, A.; Kreuzhuber, R.; Yazar, S.; et al. Large-scale cis- and trans-eQTL analyses identify thousands of genetic loci and polygenic scores that regulate blood gene expression. Nat. Genet. 2021, 53, 1300–1310. [Google Scholar] [CrossRef] [PubMed]
- Forloni, M.; Albini, S.; Limongi, M.Z.; Cifaldi, L.; Boldrini, R.; Nicotra, M.R.; Giannini, G.; Natali, P.G.; Giacomini, P.; Fruci, D. NF-κB, and not MYCN, regulates MHC class I and endoplasmic reticulum aminopeptidases in human neuroblastoma cells. Cancer Res. 2010, 70, 916–924. [Google Scholar] [CrossRef]
- Bargou, R.C.; Emmerich, F.; Krappmann, D.; Bommert, K.; Mapara, M.Y.; Arnold, W.; Royer, H.D.; Grinstein, E.; Greiner, A.; Scheidereit, C.; et al. Constitutive nuclear factor-kappaB-RelA activation is required for proliferation and survival of Hodgkin’s disease tumor cells. J. Clin. Invest. 1997, 100, 2961–2969. [Google Scholar] [CrossRef]
- Krappmann, D.; Emmerich, F.; Kordes, U.; Scharschmidt, E.; Dörken, B.; Scheidereit, C. Molecular mechanisms of constitutive NF-κB/Rel activation in Hodgkin/Reed-Sternberg cells. Oncogene 1999, 18, 943–953. [Google Scholar] [CrossRef]
- Hinz, M.; Lemke, P.; Anagnostopoulos, I.; Hacker, C.; Krappmann, D.; Mathas, S.; Dörken, B.; Zenke, M.; Stein, H.; Scheidereit, C. Nuclear factor kappaB-dependent gene expression profiling of Hodgkin’s disease tumor cells, pathogenetic significance, and link to constitutive signal transducer and activator of transcription 5a activity. J. Exp. Med. 2002, 196, 605–617. [Google Scholar] [CrossRef]
- Hatada, E.N.; Nieters, A.; Wulczyn, F.G.; Naumann, M.; Meyer, R.; Nucifora, G.; McKeithan, T.W.; Scheidereit, C. The ankyrin repeat domains of the NF-kappa B precursor p105 and the protooncogene bcl-3 act as specific inhibitors of NF-kappa B DNA binding. Proc. Natl. Acad. Sci. USA 1992, 89, 2489–2493. [Google Scholar] [CrossRef]
- Kerr, L.D.; Duckett, C.S.; Wamsley, P.; Zhang, Q.; Chiao, P.; Nabel, G.; McKeithan, T.W.; Baeuerle, P.A.; Verma, I.M. The proto-oncogene bcl-3 encodes an I kappa B protein. Genes Dev. 1992, 6, 2352–2363. [Google Scholar] [CrossRef]
- Wulczyn, F.G.; Naumann, M.; Scheidereit, C. Candidate proto-oncogene bcl-3 encodes a subunit-specific inhibitor of transcription factor NF-kappa B. Nature 1992, 358, 597–599. [Google Scholar] [CrossRef] [PubMed]
- Watanabe, N.; Iwamura, T.; Shinoda, T.; Fujita, T. Regulation of NFKB1 proteins by the candidate oncoprotein BCL-3: Generation of NF-kappaB homodimers from the cytoplasmic pool of p50-p105 and nuclear translocation. EMBO J. 1997, 16, 3609–3620. [Google Scholar] [CrossRef] [PubMed]
- Collins, P.E.; Kiely, P.A.; Carmody, R.J. Inhibition of transcription by B cell Leukemia 3 (Bcl-3) protein requires interaction with nuclear factor κB (NF-κB) p50. J. Biol. Chem. 2014, 289, 7059–7067. [Google Scholar] [CrossRef] [PubMed]
- Jiang, P.; Veenstra, R.N.; Seitz, A.; Nolte, I.M.; Hepkema, B.G.; Visser, L.; van den Berg, A.; Diepstra, A. Interaction between ERAP Alleles and HLA Class I Types Support a Role of Antigen Presentation in Hodgkin Lymphoma Development. Cancers 2021, 13, 414. [Google Scholar] [CrossRef] [PubMed]
- Evnouchidou, I.; Weimershaus, M.; Saveanu, L.; van Endert, P. ERAP1-ERAP2 dimerization increases peptide-trimming efficiency. J. Immunol. 2014, 193, 901–908. [Google Scholar] [CrossRef] [PubMed]
- Poppema, S.; Visser, L. Absence of HLA class I expression by Reed-Sternberg cells. Am. J. Pathol. 1994, 145, 37–41. [Google Scholar]
- Vardhana, S.; Younes, A. The immune microenvironment in Hodgkin lymphoma: T cells, B cells, and immune checkpoints. Haematologica 2016, 101, 794–802. [Google Scholar] [CrossRef]
- Fruci, D.; Ferracuti, S.; Limongi, M.Z.; Cunsolo, V.; Giorda, E.; Fraioli, R.; Sibilio, L.; Carroll, O.; Hattori, A.; van Endert, P.M.; et al. Expression of endoplasmic reticulum aminopeptidases in EBV-B cell lines from healthy donors and in leukemia/lymphoma, carcinoma, and melanoma cell lines1. J. Immunol. 2006, 176, 4869–4879. [Google Scholar] [CrossRef]
- Fruci, D.; Giacomini, P.; Nicotra, M.R.; Forloni, M.; Fraioli, R.; Saveanu, L.; van Endert, P.; Natali, P.G. Altered expression of endoplasmic reticulum aminopeptidases ERAP1 and ERAP2 in transformed non-lymphoid human tissues. J. Cell Physiol. 2008, 216, 742–749. [Google Scholar] [CrossRef]
- Fishilevich, S.; Nudel, R.; Rappaport, N.; Hadar, R.; Plaschkes, I.; Stein, T.I.; Rosen, N.; Kohn, A.; Twik, M.; Safran, M.; et al. GeneHancer: Genome-wide integration of enhancers and target genes in GeneCards. Database 2017, 2017, bax028. [Google Scholar] [CrossRef]
- Ameyar, M.; Wisniewska, M.; Weitzman, J.B. A role for AP-1 in apoptosis: The case for and against. Biochimie 2003, 85, 747–752. [Google Scholar] [CrossRef] [PubMed]
- Mathas, S.; Hinz, M.; Anagnostopoulos, I.; Krappmann, D.; Lietz, A.; Jundt, F.; Bommert, K.; Mechta-Grigoriou, F.; Stein, H.; Dörken, B.; et al. Aberrantly expressed c-Jun and JunB are a hallmark of Hodgkin lymphoma cells, stimulate proliferation and synergize with NF-kappa B. EMBO J. 2002, 21, 4104–4113. [Google Scholar] [CrossRef] [PubMed]
- Rengstl, B.; Newrzela, S.; Heinrich, T.; Weiser, C.; Thalheimer, F.B.; Schmid, F.; Warner, K.; Hartmann, S.; Schroeder, T.; Küppers, R.; et al. Incomplete cytokinesis and re-fusion of small mononucleated Hodgkin cells lead to giant multinucleated Reed-Sternberg cells. Proc. Natl. Acad. Sci. USA 2013, 110, 20729–20734. [Google Scholar] [CrossRef] [PubMed]
- Farrugia, A.J.; Rodríguez, J.; Orgaz, J.L.; Lucas, M.; Sanz-Moreno, V.; Calvo, F. CDC42EP5/BORG3 modulates SEPT9 to promote actomyosin function, migration, and invasion. J. Cell. Biol. 2020, 219, e201912159. [Google Scholar] [CrossRef] [PubMed]
- Tsang, W.Y.; Spektor, A.; Vijayakumar, S.; Bista, B.R.; Li, J.; Sanchez, I.; Duensing, S.; Dynlacht, B.D. Cep76, a centrosomal protein that specifically restrains centriole reduplication. Dev. Cell 2009, 16, 649–660. [Google Scholar] [CrossRef] [PubMed]
- Phan, L.; Jin, Y.; Zhang, H.; Qiang, W.; Shekhtman, E.; Shao, D.; Revoe, D.; Villamarin, R.; Ivanchenko, E.; Kimura, M.; et al. ALFA: Allele Frequency Aggregator; National Center for Biotechnology Information, U.S. National Library of Medicine: Bethesda, MD, USA, 2020. Available online: www.ncbi.nlm.nih.gov/snp/docs/gsr/alfa/ (accessed on 4 May 2023).


| SNP | SNP Position 2 | Allele 3 | MAF 4 | eGene (chr 5) | Beta 6 | P 7 |
|---|---|---|---|---|---|---|
| rs2476601 | 1:114377568 | G/A | 0.10 | OTUB2 (14) | 0.09 | 4.07 × 10⁻⁶ |
| rs13034020 | 2:61043834 | A/G | 0.18 | PUS10 (2) | 0.28 | 1.01 × 10⁻⁶ |
| rs1432295 | 2:61066666 | A/G | 0.42 | PRKACB (1) | 2.55 | 3.44 × 10⁻⁶ |
| RPL18A (19) | −13.41 | 3.36 × 10⁻⁵ | ||||
| rs3806624 | 3:27764623 | A/G | 0.46 | OIP5 (15) | 0.64 | 9.73 × 10⁻⁶ |
| CEP76 (18) | 0.11 | 1.23 × 10⁻⁵ | ||||
| H2AFZ (4) | 8.92 | 1.26 × 10⁻⁵ | ||||
| CCNB2 (15) | 1.72 | 3.73 × 10⁻⁵ | ||||
| rs6439924 | 3:140169657 | A/C U | 0.15 | RP11-392P7.1 (12) | 8.15 | 9.50 × 10⁻⁶ |
| OXA1L (14) | 7.41 | 1.17 × 10⁻⁵ | ||||
| LA16c-306E5.1 (16) | 0.04 | 1.48 × 10⁻⁵ | ||||
| SETD6 (16) | 1.18 | 1.57 × 10⁻⁵ | ||||
| ZNF311 (6) | 0.03 | 2.36 × 10⁻⁵ | ||||
| RPL23AP65 (11) | 26.59 | 2.86 × 10⁻⁵ | ||||
| OVCH1-AS1 (12) | 0.27 | 2.88 × 10⁻⁵ | ||||
| RPL3P9 (8) | 1.38 | 3.11 × 10⁻⁵ | ||||
| rs20541 | 5:131995964 | G/A | 0.23 | NR6A1 (9) | 0.42 | 2.02 × 10⁻⁶ |
| PDLIM4 (5) | 0.72 | 2.35 × 10⁻⁵ | ||||
| rs2069757 | 5:131998413 | G/A | 0.08 | GPRC5C (17) | 2.11 | 1.47 × 10⁻⁷ |
| FBXO27 (19) | 0.83 | 1.47 × 10⁻⁷ | ||||
| APOC2 (19) | 1.26 | 3.61 × 10⁻⁷ | ||||
| SLC35G2 (3) | 0.37 | 3.68 × 10⁻⁷ | ||||
| CD2 (1) | 0.82 | 4.03 × 10⁻⁷ | ||||
| KCNRG (13) | 0.40 | 1.12 × 10⁻⁶ | ||||
| APOC4-APOC2 (19) | 0.10 | 1.31 × 10⁻⁶ | ||||
| OTP (5) | 0.48 | 1.41 × 10⁻⁶ | ||||
| CDC42EP5 (19) | 0.73 | 3.84 × 10⁻⁶ | ||||
| ZNF853 (7) | 0.06 | 3.99 × 10⁻⁶ | ||||
| TMEM132B (12) | 0.30 | 4.05 × 10⁻⁶ | ||||
| DUSP15 (20) | 0.84 | 6.44 × 10⁻⁶ | ||||
| SYNPO2L (10) | 0.64 | 6.72 × 10⁻⁶ | ||||
| PROSER2 (10) | 0.29 | 8.48 × 10⁻⁶ | ||||
| TNFRSF10C (8) | 0.74 | 1.44 × 10⁻⁵ | ||||
| PRAM1 (19) | 0.03 | 2.41 × 10⁻⁵ | ||||
| WFIKKN1 (16) | 0.05 | 3.12 × 10⁻⁵ | ||||
| C12orf4 (12) | 2.73 | 3.93 × 10⁻⁵ | ||||
| rs27524 | 5:96101944 | G/A | 0.35 | ERAP1 (5) | 8.07 | 3.60 × 10−38 |
| ERAP2 (5) | −4.84 | 1.52 × 10⁻⁷ | ||||
| EIF2AK2 (2) | 1.77 | 1.08 × 10⁻⁵ | ||||
| rs1002658 | 6:137981584 | C/T | 0.16 | MTCYBP18 (5) | 1.16 | 2.00 × 10⁻⁵ |
| rs2858870 | 6:32572251 | T/C | 0.12 | HLA-DQB1-AS1 (6) | −4.01 | 7.29 × 10⁻¹⁵ |
| HLA-DQB1 (6) | −147.20 | 9.36 × 10⁻¹⁴ | ||||
| HLA-DRB1 (6) | −118.50 | 5.63 × 10⁻¹³ | ||||
| HLA-DQA1 (6) | −112.40 | 1.39 × 10⁻¹⁰ | ||||
| HLA-DRB5 (6) | −54.28 | 5.95 × 10⁻⁹ | ||||
| DPYSL3 (5) | 0.17 | 1.52 × 10⁻⁷ | ||||
| AC007163.6 (2) | 0.02 | 1.66 × 10⁻⁵ | ||||
| DSE (6) | 13.96 | 1.66 × 10⁻⁵ | ||||
| CHORDC2P (14) | 0.01 | 3.28 × 10⁻⁵ | ||||
| TAP2 (6) | 3.38 | 3.76 × 10⁻⁵ | ||||
| rs649775 | 6:33684313 | G/A | 0.07 | RP11-131H24.4 (14) | 0.06 | 3.57 × 10⁻⁵ |
| rs6928977 | 6:135626348 | G/T | 0.42 | AHI1 (6) | −0.75 | 1.44 × 10⁻¹⁵ |
| rs7745098 | 6:135415004 | T/C | 0.47 | ALDH8A1 (6) | 0.08 | 9.36 × 10⁻¹⁹ |
| CTA-212D2.2 (6) | 0.06 | 5.26 × 10⁻¹⁶ | ||||
| PIGL (17) | −0.44 | 9.53 × 10⁻⁷ | ||||
| ADNP2 (18) | −0.39 | 1.04 × 10⁻⁵ | ||||
| ALDH3A1 (17) | −0.03 | 1.94 × 10⁻⁵ | ||||
| NDUFB2-AS1 (7) | 0.04 | 3.29 × 10⁻⁵ | ||||
| rs9482849 | 6:128288536 | T/C | 0.16 | CEP162 (6) | 0.43 | 3.08 × 10⁻⁵ |
| GNAI2 (3) | 6.56 | 3.77 × 10⁻⁵ | ||||
| rs2608053 | 8:129075832 | C/T | 0.46 | LINC00621 (13) | 0.23 | 3.61 × 10⁻⁵ |
| rs3781093 | 10:8101927 | T/C | 0.17 | HSD11B1L (19) | 0.13 | 3.91 × 10⁻⁵ |
| rs7111520 | 11:111249611 | A/G | 0.31 | COLCA2 (11) | −0.12 | 1.51 × 10⁻⁶ |
| COLCA1 (11) | −0.06 | 1.78 × 10⁻⁶ | ||||
| CCDC13 (3) | 0.20 | 3.16 × 10⁻⁶ | ||||
| HEXIM2 (17) | 0.19 | 3.32 × 10⁻⁶ | ||||
| KHDC1 (6) | 0.20 | 1.61 × 10⁻⁵ | ||||
| rs112998813 | 13:115059729 | T/C | 0.08 | UPF3AP2 (17) | −1.56 | 8.10 × 10⁻¹⁰ |
| CDC16 (13) | 2.94 | 1.24 × 10⁻⁸ | ||||
| MT3 (16) | 1.06 | 6.78 × 10⁻⁶ | ||||
| AL928768.3 (14) | 112.90 | 6.95 × 10⁻⁶ | ||||
| ZNF534 (19) | 0.06 | 7.98 × 10⁻⁶ | ||||
| TATDN1 (8) | 0.72 | 8.03 × 10⁻⁶ | ||||
| rs6565176 | 16:30174926 | C/T | 0.43 | RP11-345J4.5 (16) | −2.52 | 2.43 × 10⁻¹⁰ |
| TBX6 (16) | 0.07 | 3.09 × 10⁻⁸ | ||||
| RP11-166B2.1 (16) | 0.55 | 8.92 × 10⁻⁷ | ||||
| AC006014.7 (7) | −0.16 | 1.29 × 10⁻⁵ | ||||
| NPIPB11 (16) | 0.61 | 2.15 × 10⁻⁵ | ||||
| FAM13B (5) | 0.44 | 3.38 × 10⁻⁵ | ||||
| rs1860661 | 19:1650134 | A/G | 0.40 | RP11-93B14.6 (20) | 0.01 | 1.29 × 10⁻⁵ |
| iSNP | eGene | fSNP | LD 4 | Regulatory Function 5 | ||
|---|---|---|---|---|---|---|
| ID | Position 2 | Allele 3 | ||||
| rs13034020 | PUS10 | rs1432296 | 2:61068167 | C/T | 0.82 | Promoter |
| rs27524 | ERAP1 | rs27524 | 5:96101944 | G/A | Transcription | |
| ERAP2 | rs27524 | 5:96101944 | G/A | Transcription | ||
| rs6928977 | AHI1 | rs2746432 | 6:135696597 | T/C | 0.86 | Transcription |
| rs2858870 | HLA-DRB5 | rs17840121 | 6:32577693 | G/C | 0.87 | Enhancer (multi-tissue) |
| HLA-DQB1 | rs28383358 | 6:32606779 | G/A | 0.84 | Enhancer (B-cell-like) | |
| HLA-DQA1 | rs28383344 | 6:32605067 | C/G | 0.93 | Enhancer (multi-tissue) | |
| HLA-DRB1 | rs28366261 | 6:32559572 | G/C | 0.85 | Transcription factor CEBPB | |
| TAP2 | rs115110712 | 6:32600340 | A/G | 0.97 | Enhancer (brain) | |
| rs7745098 | ALDH8A1 | rs6930223 | 6:135424203 | T/G | 0.85 | Enhancer (B-cell-like) |
| rs7111520 | COLCA2 | rs4283016 | 11:111248640 | G/A | 0.81 | Enhancer (B-cell-like) |
| rs112998813 | CDC16 | rs17337612 | 13:114998977 | G/C | 0.87 | Enhancer (erythroblast-like) |
| rs6565176 | TBX6 | rs9924308 | 16:30154740 | G/A | 0.97 | CTCF-Cohesin |
Disclaimer/Publisher’s Note: The statements, opinions and data contained in all publications are solely those of the individual author(s) and contributor(s) and not of MDPI and/or the editor(s). MDPI and/or the editor(s) disclaim responsibility for any injury to people or property resulting from any ideas, methods, instructions or products referred to in the content. |
© 2023 by the authors. Licensee MDPI, Basel, Switzerland. This article is an open access article distributed under the terms and conditions of the Creative Commons Attribution (CC BY) license (https://creativecommons.org/licenses/by/4.0/).
Share and Cite
An, Y.; Lee, C. Identification and Interpretation of eQTL and eGenes for Hodgkin Lymphoma Susceptibility. Genes 2023, 14, 1142. https://doi.org/10.3390/genes14061142
An Y, Lee C. Identification and Interpretation of eQTL and eGenes for Hodgkin Lymphoma Susceptibility. Genes. 2023; 14(6):1142. https://doi.org/10.3390/genes14061142
Chicago/Turabian StyleAn, Yeeun, and Chaeyoung Lee. 2023. "Identification and Interpretation of eQTL and eGenes for Hodgkin Lymphoma Susceptibility" Genes 14, no. 6: 1142. https://doi.org/10.3390/genes14061142