Article

High-Resolution Melting (HRM) Analysis for Rapid Molecular Identification of Sparidae Species in the Greek Fish Market

by
Evanthia Chatzoglou
1,*,
Nefeli Tsaousi
1,
Apostolos P. Apostolidis
2,
Athanasios Exadactylos
3,
Raphael Sandaltzopoulos
4,
Ioannis A. Giantsis
5,
Georgios A. Gkafas
3,
Emmanouil E. Malandrakis
1,
Joanne Sarantopoulou
3,
Maria Tokamani
4,
George Triantaphyllidis
1 and
Helen Miliou
1
1
Laboratory of Applied Hydrobiology, Department of Animal Science, School of Animal Biosciences, Agricultural University of Athens, 11855 Athens, Greece
2
Laboratory of Fish & Fisheries, Department of Animal Production, School of Agriculture, Faculty of Agriculture, Forestry and Natural Environment, Aristotle University of Thessaloniki, 54124 Thessaloniki, Greece
3
Hydrobiology-Ichthyology Lab, Department of Ichthyology and Aquatic Environment, School of Agricultural Sciences, University of Thessaly, 38446 Volos, Greece
4
Department of Molecular Biology and Genetics, Democritus University of Thrace, 68100 Alexandroupolis, Greece
5
Department of Animal Science, Faculty of Agricultural Sciences, University of Western Macedonia, 53100 Florina, Greece
*
Author to whom correspondence should be addressed.
Genes 2023, 14(6), 1255; https://doi.org/10.3390/genes14061255
Submission received: 8 May 2023 / Revised: 5 June 2023 / Accepted: 8 June 2023 / Published: 12 June 2023
(This article belongs to the Section Animal Genetics and Genomics)

Abstract

:
The red porgy (Pagrus pagrus) and the common dentex (Dentex dentex) are Sparidae species of high commercial value, traded in the Greek market. In some cases, fish species identification from Greek fisheries is difficult for the consumer due to the strong morphological similarities with their imported counterparts or closely related species such as Pagrus major, Pagrus caeroleustictus, Dentex gibbosus and Pagellus erythrinus, especially when specimens are frozen, filleted or cooked. Techniques based on DNA sequencing, such as COI barcoding, accurately identify species substitution incidents; however, they are time consuming and expensive. In this study, regions of mtDNA were analyzed with RFLPs, multiplex PCR and HRM in order to develop a rapid method for species identification within the Sparidae family. HRM analysis of a 113 bp region of cytb and/or a 156 bp region of 16s could discriminate raw or cooked samples of P. pagrus and D. dentex from the aforementioned closely related species and P. pagrus specimens sampled in the Mediterranean Sea when compared to those fished in the eastern Atlantic. HRM analysis exhibited high accuracy and repeatability, revealing incidents of mislabeling. Multiple samples can be analyzed within three hours, rendering this method a useful tool in fish fraud monitoring.

1. Introduction

Fish is considered a valuable nutritional resource containing high content of beneficial lipids, high-quality proteins and vitamins, being a very important component in the Mediterranean diet [1]. The health benefits of fish are reflected by the increase in its global consumption with the international trade of fisheries and aquaculture products growing significantly in recent decades, expanding over continents and regions [2]. At the same time due to the complex and valuable supply chains of this commodity, there is a potential increase in fish mislabeling and/or fraud [3]. Fish mislabeling is defined as an inaccurate labeling of a specimen’s species name, weight and geographic origin [4]. Economic profit by the difference in price is the main criterion of intentional fraud by the substitution of expensive species for cheaper ones, while consumers are exposed to the risk of buying harmful products containing allergens [5] or endangered species are threatened since the substitute is exploited without reporting, thus undermining conservation efforts by supporting unsustainable or illegal fishing activities [6,7]. Fish are sold as whole or filleted (fresh or frozen) and processed (dried, salted, smoked, canned, etc.) in the markets, as well as served cooked in restaurants. Under these conditions, their morphological characteristics are altered; thus, identification of the species is often not possible, raising opportunities for fraudulent operations [8,9].
Greek consumers have a strong preference for fresh and wild fish compared to reared, frozen tinned or canned fish, whereas in many cases, the ratio price/quality is the key factor influencing consumers’ choice [10]. Two members of the Sparidae family, the red porgy P. pagrus and the common dentex, D. dentex, are widely traded species in the Greek market and are frequently served at restaurants, where fresh fish are sold under high prices, ranging from 25 to 40 EUR/kg in fish markets up to more than 60 EUR/kg in restaurants.
P. pagrus is a benthopelagic species, with its wild populations located in the Mediterranean Sea but also on the Atlantic coasts of America, South Europe and Africa [11,12]. Its high commercial value raises as its size increases, with European regulations setting the minimum size (total length) of its catch in the Mediterranean at 18 cm (EC), No. 1967/2006 [13]. During the previous years, due to increased consumer demand, many fish farms in Greece, Italy, Cyprus and Croatia have included the genus Pagrus in their production [14,15]. For many years, Pagrus fish farming products were sold in the Greek market under various names, and, recently, Greece has requested to add the species red seabream (P. major), also known as Japanese sea bream, in Annex IV of the Regulation (EC) No. 708/2007 [16], as the species has been used in Greek aquaculture for a long time. Therefore, in the Greek market regarding the genus Pagrus, fresh fish from (a) domestic catch, (b) Greek fish farms and (c) lagoon fish traps (the so-called “Divaria”) and frozen imported samples are available. Species of the same genus worldwide, such as the Japanese seabream (P. major), the blue-spotted sea bream (P. caeruleostictus), the red-banded sea bream (Pagrus auriga) and the silver sea bream (Pagrus auratus), share similar morphological characteristics, mainly the color and the shape. As a result, incidents of mislabeling have occurred by the mixing of the fish and their sale under the same name [17]. For example, in the German market, it has been observed that P. pagrus, P. caeruleostictus and P. auratus are commonly sold as “Dorade Rose” [18].
D. dentex is a demersal fish and high-trophic-level predator of the Sparidae family living in various habitats [12,19]. Its populations are distributed in the Mediterranean and eastern Atlantic. Its length reaches 100.00 cm, and it is considered the “Queen of fish” in the Greek market, where it can be found mainly as whole fresh fish catch, sliced or filleted and, in some markets, frozen. D. dentex is mainly fished by small-scale fisheries and leisure fishers or divers and, according to the IUCN Red List of Threatened Species 2014, is categorized as “vulnerable” [20]. There have been attempts to rear D. dentex, some of them with successful outcomes [21,22], as well as the species D. gibbosus, which shares strong similarities with both D. dentex and P. pagrus and is considered one of the most delicious marine fish. D. gibbosus resembles and is often marketed as D. dentex or P. pagrus, with taste and appearance that are hardly distinguishable by consumers [23]. The higher commercial value of wild P. pagrus and D. dentex from wild catches compared to imported, reared counterparts or other species of the Sparidae family (i.e., D. gibbosus, P. erythrinus) raises the need for accurate identification and labeling of the fish according to EU 1379/2013 guidelines [24].
Traditionally, fish species identification is based on external morphological features, including shape, various relative measurements of body parts and otoliths [25]. For many years, protein-based methods have been used in official laboratories, such as protein isoelectric focusing (IEF) of soluble muscle proteins [18] or the enzyme-linked immunosorbent assay (ELISA) [26]; however, these techniques are restricted to the identification of fresh samples, as they cannot be applicable when fish are filleted, canned or cooked due to the removal of morphological characteristics and denaturing of proteins [25]. On the other hand, DNA-based methods have proven to give accurate and reliable results and are more rapid and cost effective than protein-based analyses [8,9,25,26]. The principle of these methods is based on species-specific polymerase chain reaction (PCR) coupled with DNA sequencing [27,28] or RFLPs [17], SSCP [18,29] and/or real-time (qPCR) coupled with end-point analysis and high-resolution melting (HRM) [26,30,31,32,33]. Mitochondrial DNA is often used in fish identification as it has features that facilitate the analyses: (a) lack of introns, (b) a large number of copies, (c) maternally inherited, (d) no recombination and (e) circular structure [29]. Moreover, it evolves much faster than nuclear DNA and thus enables even closely related species to be differentiated and identified [34].
DNA barcoding is a universal taxonomic method that refers to the sequence of a 650 bp fragment of the COI gene amplified with universal primers and is used to identify it as belonging to a particular species [8,27,35]. A large number of standardized reference DNA sequences is collected in databases such as GenBank [36] and the Fish Barcode of Life (FISH-BOL) campaign [27]. By using these libraries, an unknown fish sample can be matched against fish species reference sequences to determine its species [27]. This approach has gained much attention in recent years since the survey of authenticity and single laboratory validated method for DNA barcoding for the species identification of fish has been adopted by the FDA for the identification of fish products [37]. Other mtDNA genes that are used in PCR-sequencing-based methods as species-specific markers are cytb and 16s, under the term forensically informative nucleotide sequencing (FINS) [29]. These genes exhibit high levels of variation between species but low variations within species [9,38].
DNA-sequencing-based methods are reliable, with the capability to accurately detect cases of substitutions [35,39]; however, they are expensive and time consuming and thus not easily applicable to extensive market controls [30,32,33]. Conventional PCR-based methods are used for fish species identification, such as PCR-RFLP [40,41] and multiplex PCR [25,29], which rely on the analysis of species-specific band patterns by agarose gel electrophoresis. Real-time PCR technology employs fluorescent dyes that allow for the direct observation of results in real-time and has paved the way for the creation of post-amplification analysis techniques such as HRM based on the quantitative analysis of the melting temperature (Tm) curve of an amplified DNA fragment [26,42,43]. HRM has been used for fish species identification of fresh [32,44] or processed samples [30,33,45].
In this study, DNA-sequencing-based methods (COI barcoding), conventional PCR methods (PCR-RFLP and multiplex PCR) and real-time PCR coupled with HRM analysis are used on raw, frozen and cooked samples for the identification of P. pagrus and D. dentex from Greek fisheries, and they are distinguished from Pagrus aquaculture specimens, their imported counterparts or other Sparidae species that are sold in the Greek market and could be used in mislabeling incidents. The aim of this study is to develop an accurate, rapid and cost-effective method that could be used in extensive market controls to detect mislabeling and prevent fraud incidents.

2. Materials and Methods

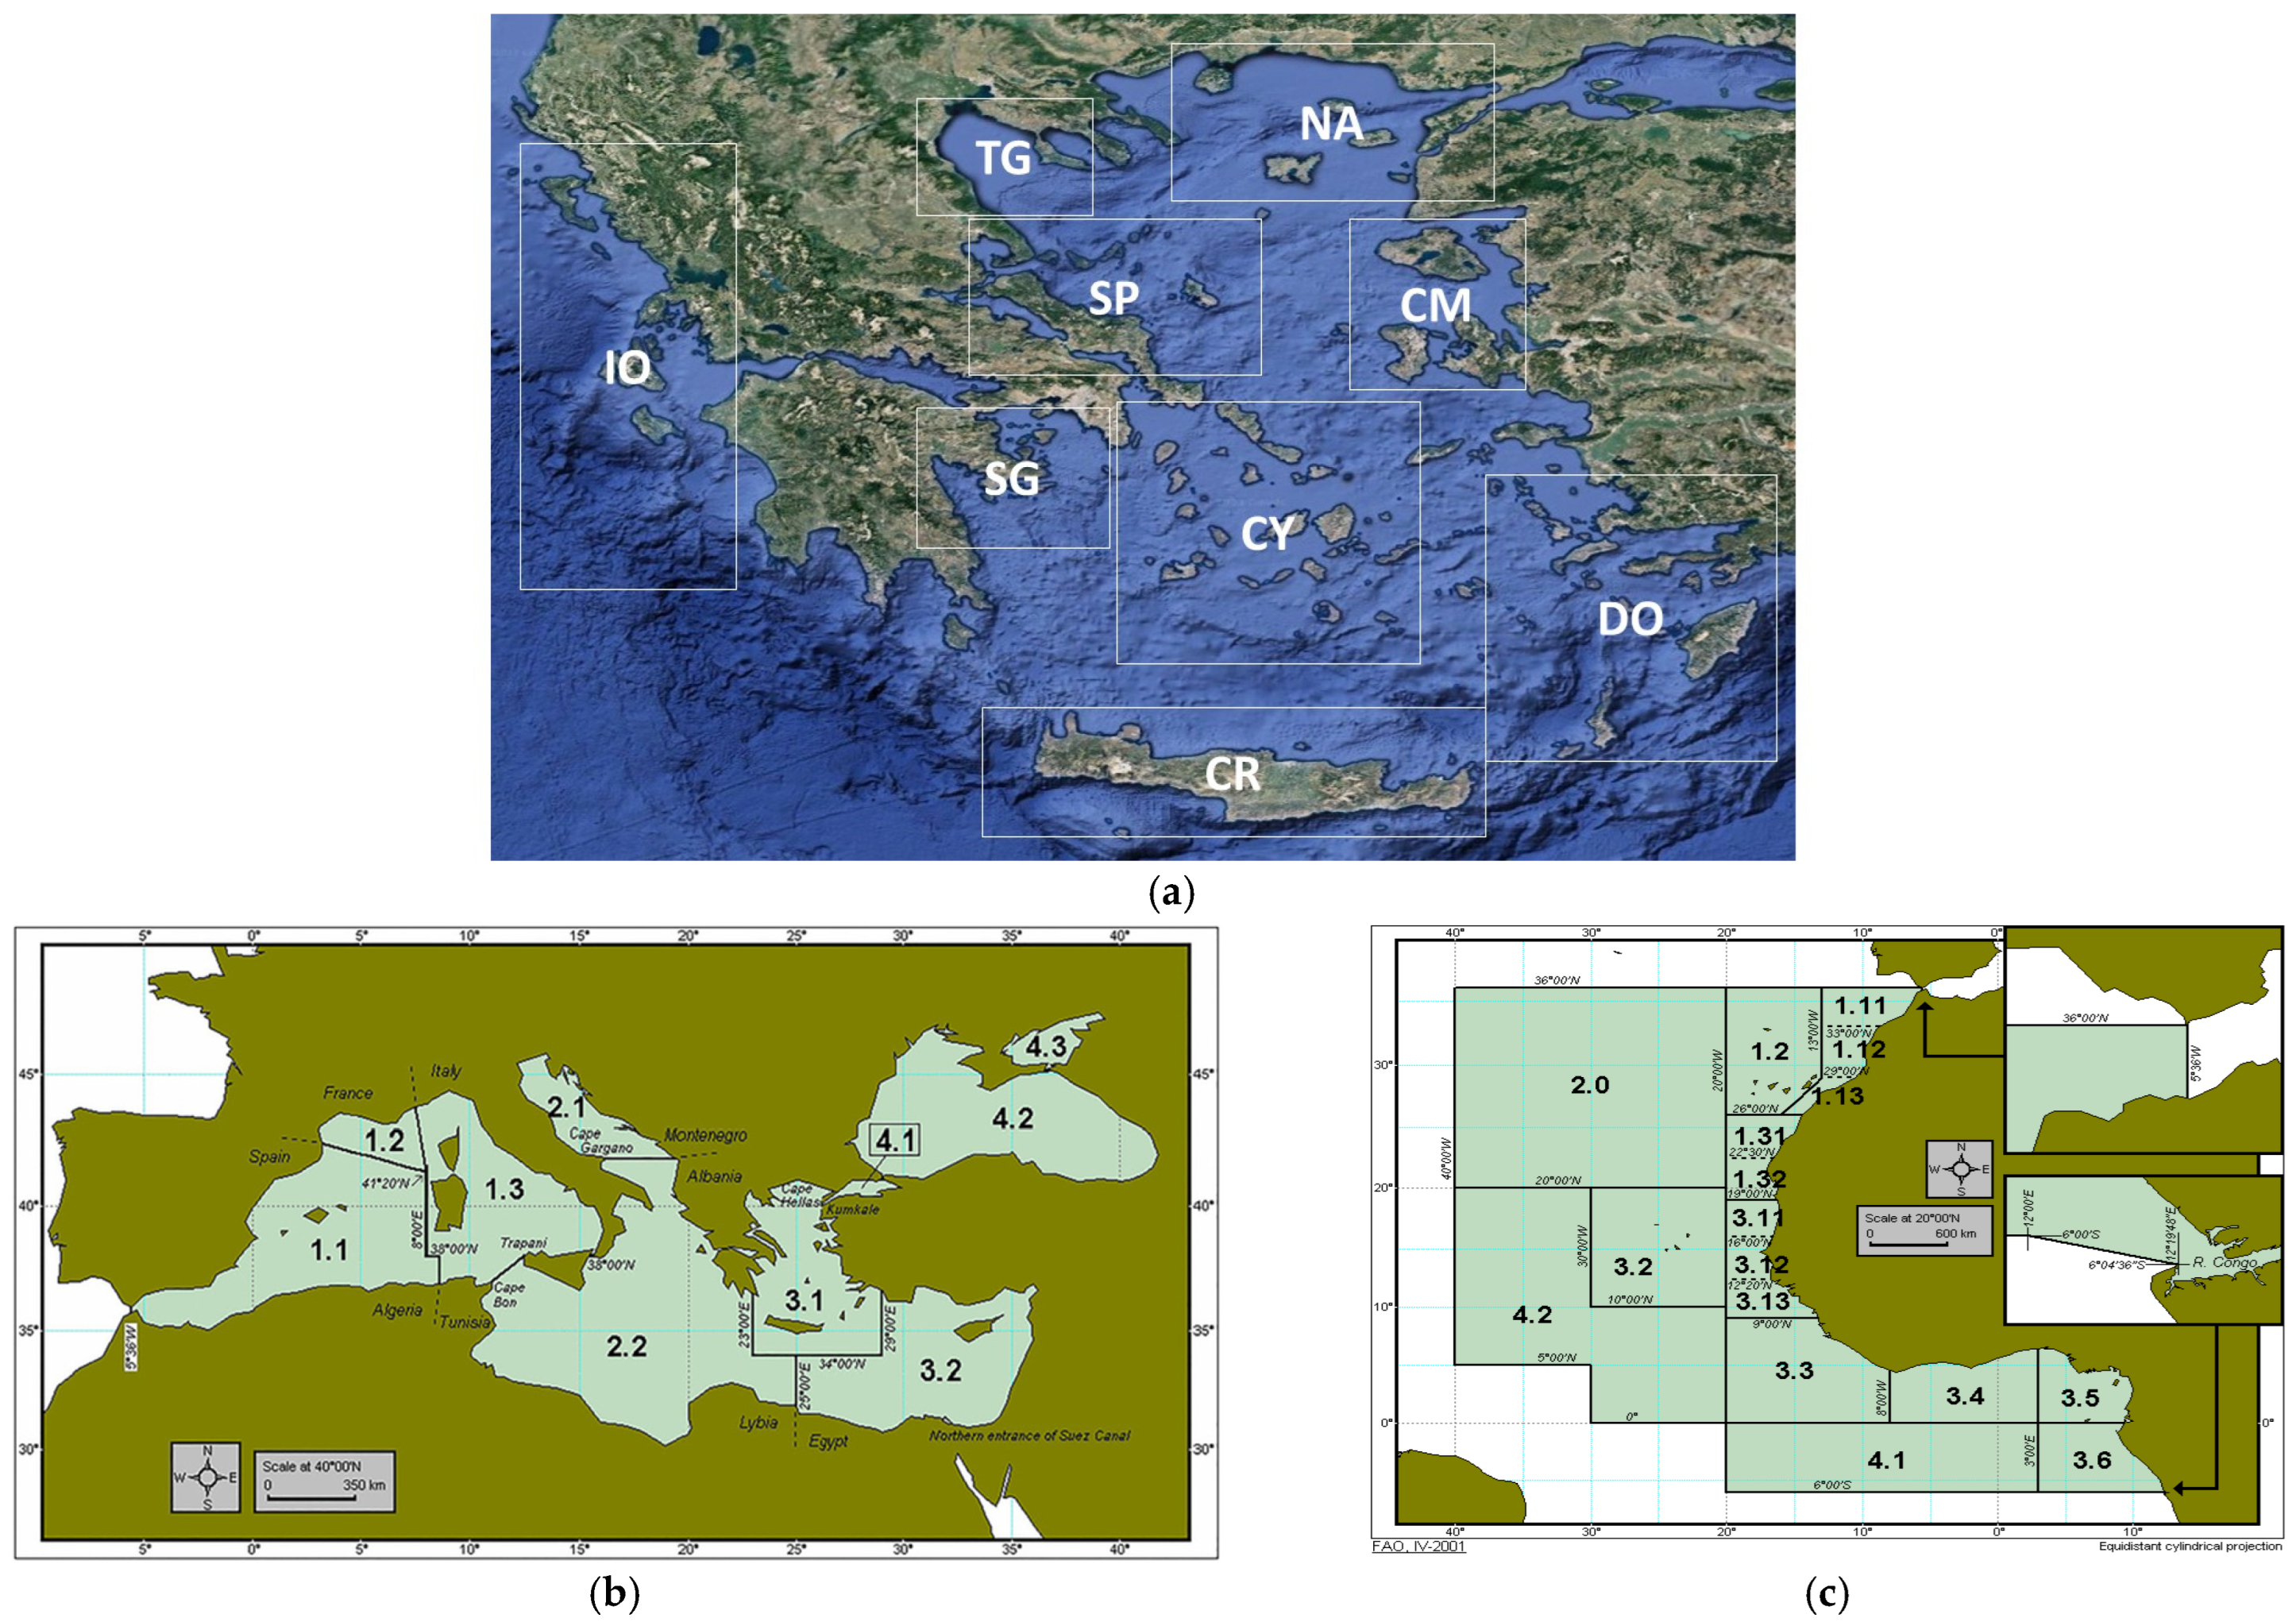
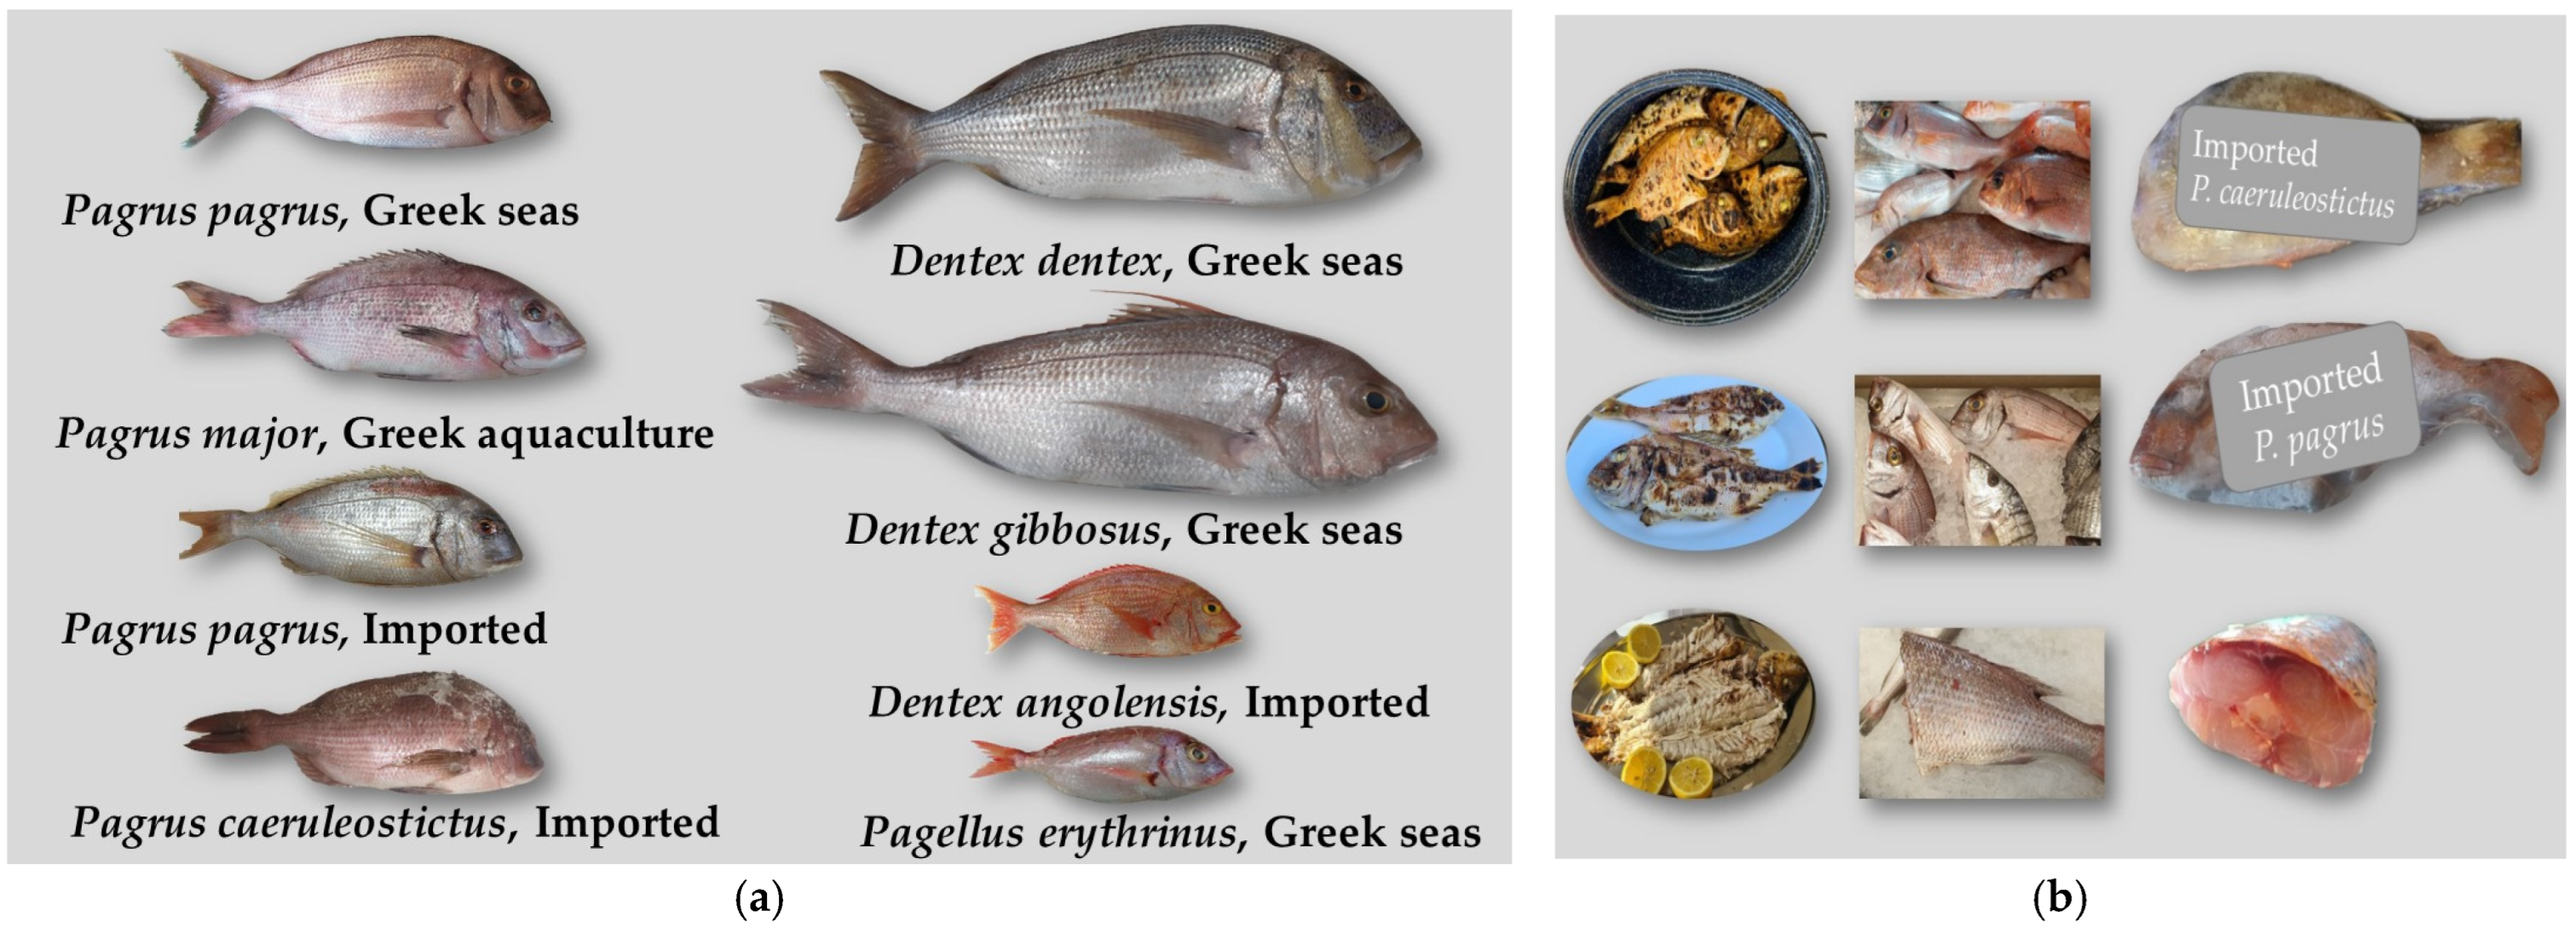
2.1. Samples Collection and Morphological Identification

The 106 Pagrus spp. samples used in this study were collected from (a) Greek fisheries, (b) Greek fish farms, (c) lagoon fish traps in Greece, (d) imported fish sold at the Greek market and (e) restaurants. The 57 D. dentex specimens were collected from Greek fisheries (sampled), and 1 was imported from the Mediterranean Sea (Tunisia). Moreover, three identified samples of P. pagrus and three of D. dentex from the east coasts of Spain were donated to be used as controls in our experiments. Other Sparidae species incorporated in this study were D. gibbosus, Dentex angolensis and P. erythrinus from Greek fisheries and/or imported and sold in the Greek market. Most of the imported species were labeled with origin from the Atlantic Ocean fished in Senegal or Argentina. The areas of collection are shown in Figure 1, and the number of samples tested from each region collected is shown in Table 1.
When possible, the specimens were identified by their external morphological characteristics (body shape, fins, rays and color) according to FAO [46] and categorized into groups by their origin. The difference between P. pagrus and P. major is the absence of a white line at the end of the caudal fin and the shorter pectoral fin in the latter [12]. Between young Pagrus spp. and P. erythrinus, the differences are found in body shape, color and lateral fins (Figure 2). P. caeruleostictus shares many common characteristics with P. pagrus and P. major, being distinguished by the presence of blue spots on the upper body, a dark spot at the end of the dorsal fin and its elongated 3rd ray [47]. D. dentex has a compact oval body [48], with characteristic canine teeth and dorsal spots that are present in bigger fish. Regarding species of the same family but of a different genus, the main characteristic of D. gibbosus is that the first two rays of the dorsal fin are very small but the third and fourth are distinctively enlarged, a feature that sets it apart from other species [12,48]. P. erythrinus’s body shape is oval and laterally flattened. Its body color is red without stripes, the snout is at least twice as long as the eye diameter (Figure 2), and its caudal fin is forked with a red spot on its base [12,48].
For ten samples, morphological characterization was not possible as they were either tissue samples from recreational fishers, collected as filleted P. pagrus from the Greek fish market or cooked and served at Greek restaurants (Figure 2b). Moreover, five imported samples were frozen; therefore, some of the morphological characteristics were altered. Samples from all species and origins already identified were cooked in various ways, roasted, fried or boiled in soup with other ingredients, in order to estimate the efficacy of different methods when compared with the respective raw samples (Table 1). After morphological identification, tissues were collected from all samples, and whole fish samples and isolated tissues in 70% ethanol were stored at −20 °C.

2.2. DNA Extraction and PCR

For each fresh sample, 25 mg of tissue (muscle or liver) was dissected with sterile disposable plastic forceps, diluted in PBS and homogenized with a cordless motor pellet pestle (Kimble). Total DNA was extracted using the NucleoSpin® Tissue (Macherey-Nagel) kit for all fresh tissues and the NucleoSpin® Food (Macherey-Nagel) kit for cooked or frozen samples and small amounts of tissue, according to the manufacturer’s instructions. DNA concentration and quality were assessed using Biophotometer D30 (Eppendorf) and run on 0.8% agarose gel. DNA of high quality (260/280 ratio 1.8–2.0 and 260/230 ratio 2.0–2.2) from both extraction procedures was used in downstream applications, and the results were compared. Primers sourced from the literature or designed in this study with Geneious Prime [49], based on the complete mtDNA of P. pagrus (Accession number NC_072936) and D. dentex (Accession number MG727892), were used for the amplification of different mtDNA regions of the Sparidae (Table 2). All PCR reactions were performed in MiniAmp Plus Thermal Cycler (Applied Biosystems), using the KAPA Taq PCR Kit (KAPABIOSYSTEMS). In each reaction, 200 ng of total DNA was used as a template. PCR reactions were performed as follows: initial denaturation at 95 °C for 3 min, followed by 40 cycles of amplification. The annealing temperatures were adjusted according to the Tm of primers (Table 2) used in each reaction, with an elongation of 30–90 s and final elongation of 3 min. Specifically, for barcoding, a fragment of 706 bp of COI was amplified using the pair COIpp-COIUnR; for cytb, a fragment of 583 bp was amplified using the pair cytbF1-cytbUR; and for 16s, a fragment of 681 bp was amplified using the pair 16sF2-16sF2. For these three reactions, the annealing temperature was 54 °C. Amplification conditions targeting different fragments of Sparidae mt DNA used in RFLPs, multiplex PCR and HRM analyses are described in Section 2.4, Section 2.5 and Section 2.6. For the verification of amplification efficiency, the products were run on 1.2% agarose gels stained with Midori Green (Nippon Genetics).

2.3. Sanger Sequencing

For the COI barcode, all samples were sequenced for both strands using the Sanger dideoxy method by EUROFINS Genomics sequencing services. The obtained COI sequences for each haplotype present in different fishing areas or in the fish market are available in GenBank with accession numbers for P. pagrus: OQ208746-OQ208756, OQ211305-OQ211329, OQ272113-OQ272123, OQ865594-OQ865603, OQ208828-OQ208830, OQ281602, OQ272124, OQ281603-OQ281609, and OQ860775-OQ860777; P. major: OQ860773, OQ860774, OQ888163, and OQ888164; P. caeruleostictus: OQ861107; P. erythrinus: OQ861152-OQ861162 and OQ890738; D. dentex: OQ862795-OQ862820; D. gibbosus: OQ880490-OQ880493 and OQ880557-OQ880559; and D. angolensis: OQ888790. For cytb and 16s fragments, 165 samples representing all species listed in Table 1 were sequenced. Sequences showing different SNPs from these fragments were deposited to Genbank and are available with accession numbers for P. pagrus 16s OQ892284-OQ892292 and cytb OQ915022-OQ915035, as well as for D. dentex 16s (OQ903885-OQ903890).

2.4. In Silico Analysis and Detection of Polymorphisms

All sequences obtained were identified with the Blast search tool [52], compared to sequences from the GenBank [36] database or matched with reference sequences by using the BOLD database [27]. Samples were aligned for each gene region with ClustalW2 [53]. For the alignments, samples from this study, as well as sequences extracted from the databases, were used. After in silico analysis of COI, cytb and 16s genes and total mtDNA of Sparidae species and polymorphic sites were detected. New primers were designed with Geneious Prime to amplify smaller fragments (100–150 bp) that were used in HRM experiments or fragments of different sizes to be used in multiplex PCR. For RFLP analysis, the aligned partial sequences, as well as the complete genomes of the available Sparidae species in GenBank with the respective accession numbers P. pagrus (NC_072936), P. major (NC_003196), P. caeruleostictus (MN319701), P. erythrinus (NC_037732.1), D. dentex (MG727892), D. gibbosus (NC_037731) and D. angolensis (NC_044097.1), were checked for restriction enzyme digestion sites with Geneious Prime.

2.5. Restriction Fragment Length Polymorphism (RFLP)

For RFLP analysis, the COI barcode fragment (Table 1) was digested with HindIII (Takara) to distinguish between D. dentex and other species (Table 3) and with Sau3AI (EnzyQuest) to identify P. pagrus. Additionally, for P. pagrus and related species, the cytb fragment (Table 1) was digested with Sau3AI, and a 1292 bp fragment of the CR (Table 3) amplified with cytbF2 and CRR primers was digested with XbaI (Takara).
The products were run on 1.2% agarose gels stained with Midori Green (Nippon Genetics), and the band sizes were estimated with FastGene® 100 bp DNA Ladder (Nippon Genetics) and 50 bp DNA Ladder (Jena Bioscience GmbH).

2.6. Multiplex PCR

In a single reaction, a combination of primers was used to amplify fragments of different lengths. Multiplex PCR was performed using the KAPA2G Fast Multiplex PCR Kit (KAPABIOSYSTEMS) using the supplied buffer at a final concertation of 3 mM MgCl2, 100 ng of the template and 0.2 μM of each primer in combinations as shown in Table 4. After amplification, the products were run on 1.5% agarose gels stained with Midori Green (Nippon Genetics).

2.7. HRM Analysis

In order to define a suitable region to be used as a species-specific marker for HRM analysis, fragments of COI barcode, cytb and 16s, were selected, as they are often used in phylogenetic studies and several reference sequences are available in GenBank. Sequences of these samples and databases were aligned with the aim to locate SNPs that could discriminate between species and/or populations within species. By these comparisons, regions that could serve as templates for smaller fragments’ amplification (113–156 bp) were defined. For the amplification of the selected regions, specific primers were designed (Table 5) that are able to anneal with all species of the Sparidae family. Different DNA template concentrations (from 1–10 ng) were tested for both isolation procedures in order to check the accuracy of the method, and the optimum concentration (10 ng) was defined. PCR conditions were adjusted to ensure amplification for all samples, and, prior to HRM analysis, the efficacy of primers was tested by conventional PCR products and run on 2% agarose gel to verify product amplification. The curve analysis parameters [43] for each fragment tested were optimized by using samples of known sequences as controls, and final values were determined when the percent confidence was 95–99.9% for all species clustering. All samples used were sequenced before or after HRM analysis for the verification of the results.
HRM reactions were performed with KAPA HRM FAST qPCR KitAll PCR (KAPABIOSYSTEMS) in CFX96 Real-Time PCR thermocycler (BIO-RAD LABORATORIES INC). The 2× Master Mix supplied by the kit contains EvaGreen and was mixed with MgCl2 and the pair of primers for each gene as shown in Table 3. Each 20 μL reaction contained 5 ng of total DNA and final concentrations of 2.5 mM MgCl2, 200 nM for each primer. A three-step protocol was used for amplification as follows: enzyme activation at 95 °C for 2 min, followed by 45 cycles of denaturation at 95 °C for 5 s, annealing according to the set of primers (Table 3) for 20 s and elongation at 72 °C for 10 s. Melt curve dissociation was performed in 0.2 °C increments from 65 °C to 95 °C. PCR amplification and melting processes were monitored in real time by plate read through CFX manager 3.1 software (Bio-Rad Laboratories Inc. Hercules, CA, USA). Curve data were analyzed using Bio-Rad Precision Melt Analysis Software, version 1.2 (Bio-Rad Laboratories Inc. Hercules, CA, USA) [43]. Analysis options, melt curve shape sensitivity (which determines the level of stringency applied in classifying the melt curves into distinct clusters) and the Tm difference threshold (which determines the minimum melting temperature difference between samples below which the software will classify them as belonging to different clusters) [43] were adjusted for each gene to obtain maximum confidence percent values, i.e., the relative probability of the sample of being in a cluster, and were compared to sequencing results. Samples were run as triplicates in 2 or 3 independent trials.

3. Results

3.1. Morphological Identification and DNA Isolation

All whole-body samples collected from Greek fisheries (FC) and supermarkets (FM/SM) were identified by their morphological characteristics as described in Section 2.1. When small fish from Greek catch were closely examined, P. pagrus with a total length less than 18 cm up to 500 gr were mixed with P. erythrinus. In one case, morphological identification failed to identify a young D. gibbosus that was also mixed with P. erythrinus. In two cases of big fish (>4 kg) collected from the Greek market and sold as P. pagrus, morphological examination identified them as D. gibbosus, as they had the characteristic dark spot on the end of their dorsal fin, although the characteristic enlarged third and fourth rays of the dorsal fin were not visible. Therefore, it is possible that these rays were cut in order to sell the fish as P. pagrus. The majority of imported P. pagrus samples were collected from the fish market and the supermarkets as frozen and packed (Figure 2b). When fish were thawed, some characteristics were detectable; however, morphological identification was not always clear, as they were partly destroyed from freezing. When imported P. pagrus (PpI) are sold fresh, they are morphologically identical to P. pagrus from Greek fisheries. All Pp samples from Greek fish farms (AQ) as well as all samples from lagoon fish traps (LFT) labeled as Pagrus spp. Were identified as P. major.
For D. dentex specimens, morphological identification was clear for smaller (1 kg) or bigger (up to 3 kg) fish. In one case, an imported frozen and packed sample was labeled both with the common name pandora but with the scientific name D. dentex, and when unpacked and defrosted, morphological identification showed that it was P. erythrinus.

3.2. Sequencing-Based Identification—COI Barcoding

3.2.1. P. pagrus

COI barcoding accurately identified all samples examined. For PpG (Table 1), a predominant haplotype and eleven more haplotypes with one or two SNPs were determined. Each of these barcodes shows 99–100% homology with barcodes of P. pagrus mined from GenBank and Bold databases corresponding to samples from different areas of the Mediterranean Sea [54,55,56,57,58]. Specimens of PpI sold in the Greek market were identified as P. pagrus, showing 98–100% homology with barcodes of P. pagrus from the eastern Atlantic Ocean, with the exception of one frozen sample labeled as Sparus pagrus, which was identified as P. caeruleostictus (Pc). In four cases of samples sold as filleted PpG, DNA barcoding identified two of them as P. pagrus and two as D. gibbosus. Two samples offered as P. pagrus by recreation fishermen were identified as P. major. Three out of seven samples collected at restaurants (RE) were offered as P. pagrus, but one was identified as D. gibbosus and two as P. major. Barcoding was in accordance with the founding of morphological classification in the case of two samples of big fish (>4 kg) sold as P. pagrus but identified as D. gibbosus. In addition, in ten samples of juvenile fish, the classification of which based on their morphological characteristics was not clear, barcoding confirmed that two of them were P. erythrinus and one was D. gibbosus. All samples from different Greek aquaculture farms (AQ) and lagoon fish traps (LFT) were identified as P. major. Barcodes of known samples that were cooked for the purposes of this study were identical to the respective raw specimens.

3.2.2. D. dentex

Two barcodes with one SNP were found for the populations of DdG (Table 1), distributed randomly in all sampling areas. Both barcodes were compared against sequences from GenBank and Bold databases and found to be identical with barcodes from D. dentex samples from the Mediterranean Sea [54,59,60]. The only imported samples in the Greek market come from Tunisia (DdM), and their sequences are identical to the samples from Greek fisheries, as well as from Spain and Italy [59,60]. One incident of mislabeling was detected regarding a sample given by a recreational fisherman as D. dentex, which was identified as D. gibbosus.

3.2.3. Other Sparidae Species

Twenty-five samples of D. gibbosus, D. angolensis and P. erythrinus, from Greek fisheries or imported and sold in the Greek market (Table 1), were identified by their morphological characteristics and by barcoding in order to be used in downstream applications as characterized species-specific controls.

3.3. Non-Sequencing-Based Techniques

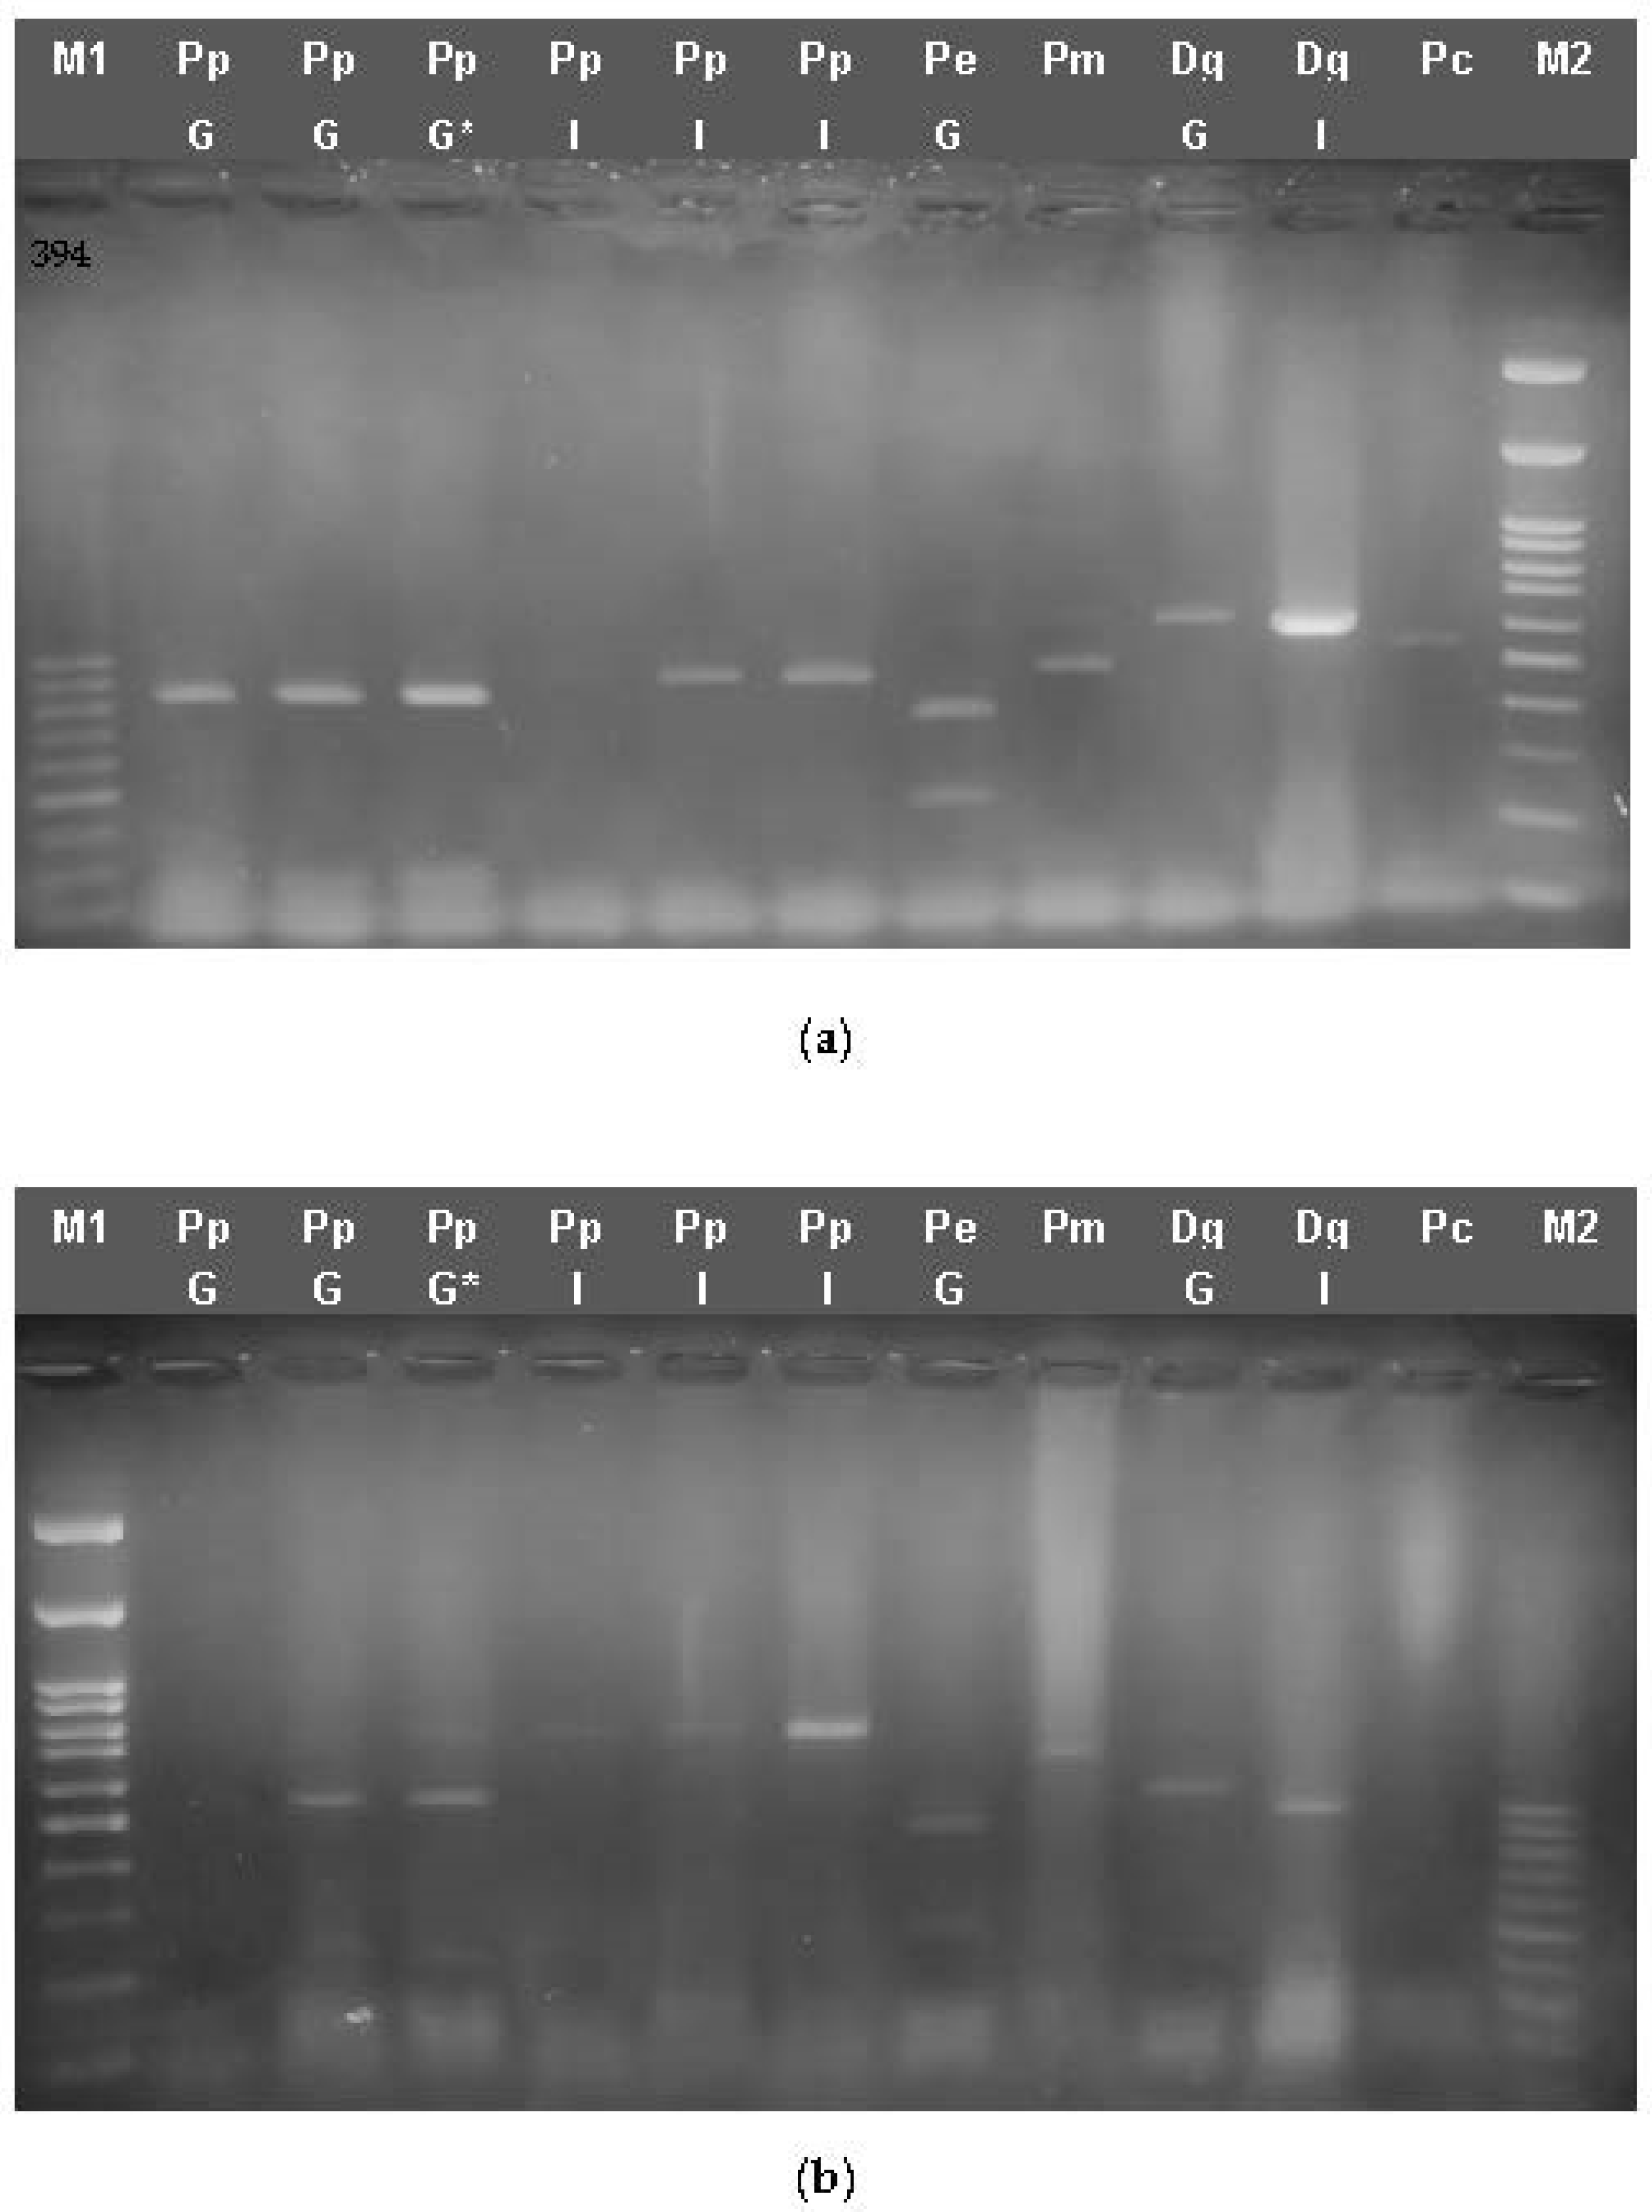
3.3.1. RFLP Analysis

When the cytb fragment was digested with Sau3AI (Figure 3a), fragments of 420 bp, 90 bp and 70 bp are generated for PpG, as well as three fragments of 450 bp, 80 bp and 50 bp for PpI, two fragments of 380 bp and 200 bp for Pe, two fragments of 430 bp and 150 bp for Pc and two fragments of 420 and 160 bp for Pm, whereas no digestion sites were found for Dg (Figure 3a). When the COI barcode fragment was digested with HindIII, two bands of approx. 500 bp and 200 bp for PpG and Dg and two bands of 620 bp and 80 bp for Pm were obtained, but no restriction site for PpI was detected (Figure 3b).
When cutting the CR fragment with XbaI, one restriction site was found, resulting in two fragments of appr 500 bp and 700 bp for PpG, whereas this site is absent from PpI, Pm, Pc and Dg. Cooked samples were also digested, giving the pattern expected for P. pagrus in each case. However, in some cases of frozen samples or filleted fish, the amplification of PCR products was not as efficient as expected; therefore, the products could not be easily detectable on agarose gels (Figure 3).
The COI barcode fragment was also used for the discrimination of DdG compared to D. dentex samples fished in the Mediterranean Sea and found in the Greek market, as well as other Sparidae species. Digestion with HindIII showed a two-band pattern of 450 and 250 bp for all D. dentex as well as for D. angolensis samples but not for D. gibbosus and P. erythrinus (Figure 4). Therefore, the identification of D. dentex cannot be ascertained in the case D. angolensis samples are introduced.

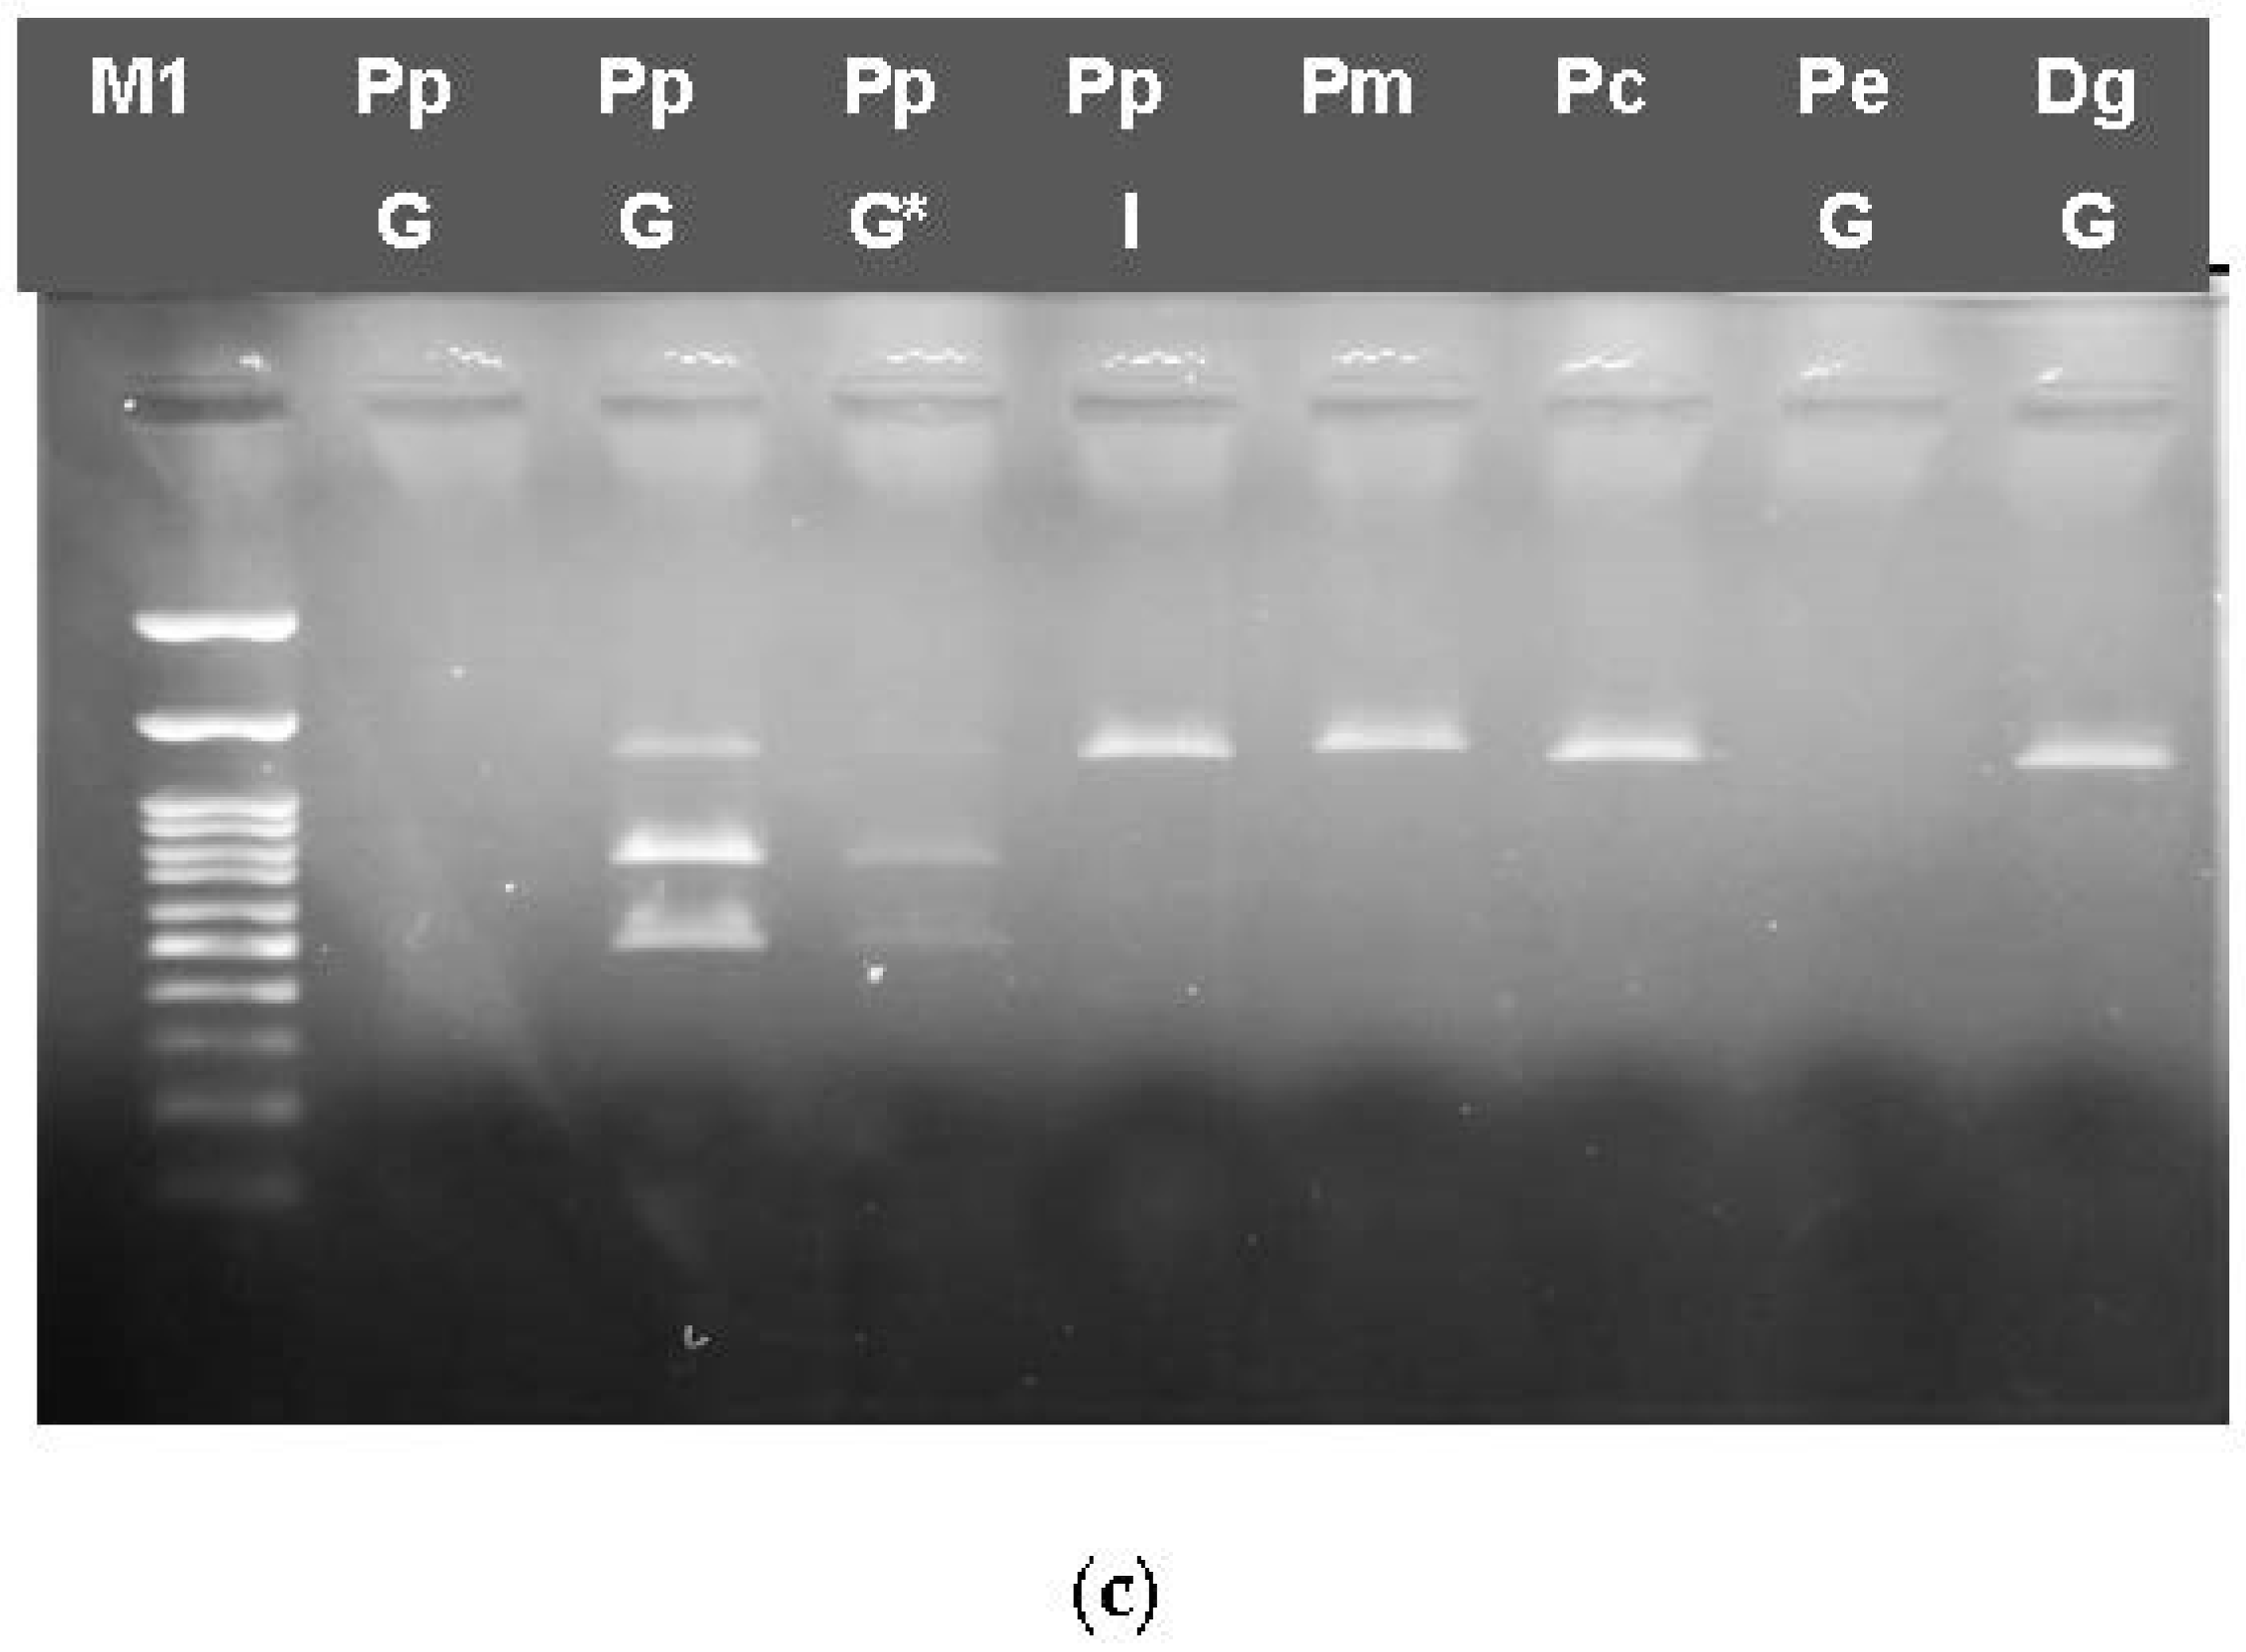
3.3.2. Multiplex PCR

Multiplex PCR showed that the expected three-band pattern of 461, 295 and 211 bp was observed only in P. pagrus but not in the other species; however, some bands were not detectable in some PpG and PpI samples (cooked or frozen) (Figure 5a), or, in some PpG samples, the presence of other bands indicates nonspecific amplification. When D. dentex and other Sparidae species were analyzed as described in Section 2.5, different patterns were obtained for different species and populations. For the D. dentex samples analyzed, only the 249 bp band was amplified in all samples. Da showed two bands at 583 and 295 bp; DgG showed two bands at 583 and 249; DgI showed all four bands; P. erythrinus from Greek fisheries and P. caeruleostictus showed three bands of 583 bp, 295 bp and 249 bp; and imported P. pagrus and P. erythrinus showed one band each of 295 bp and 249 bp.

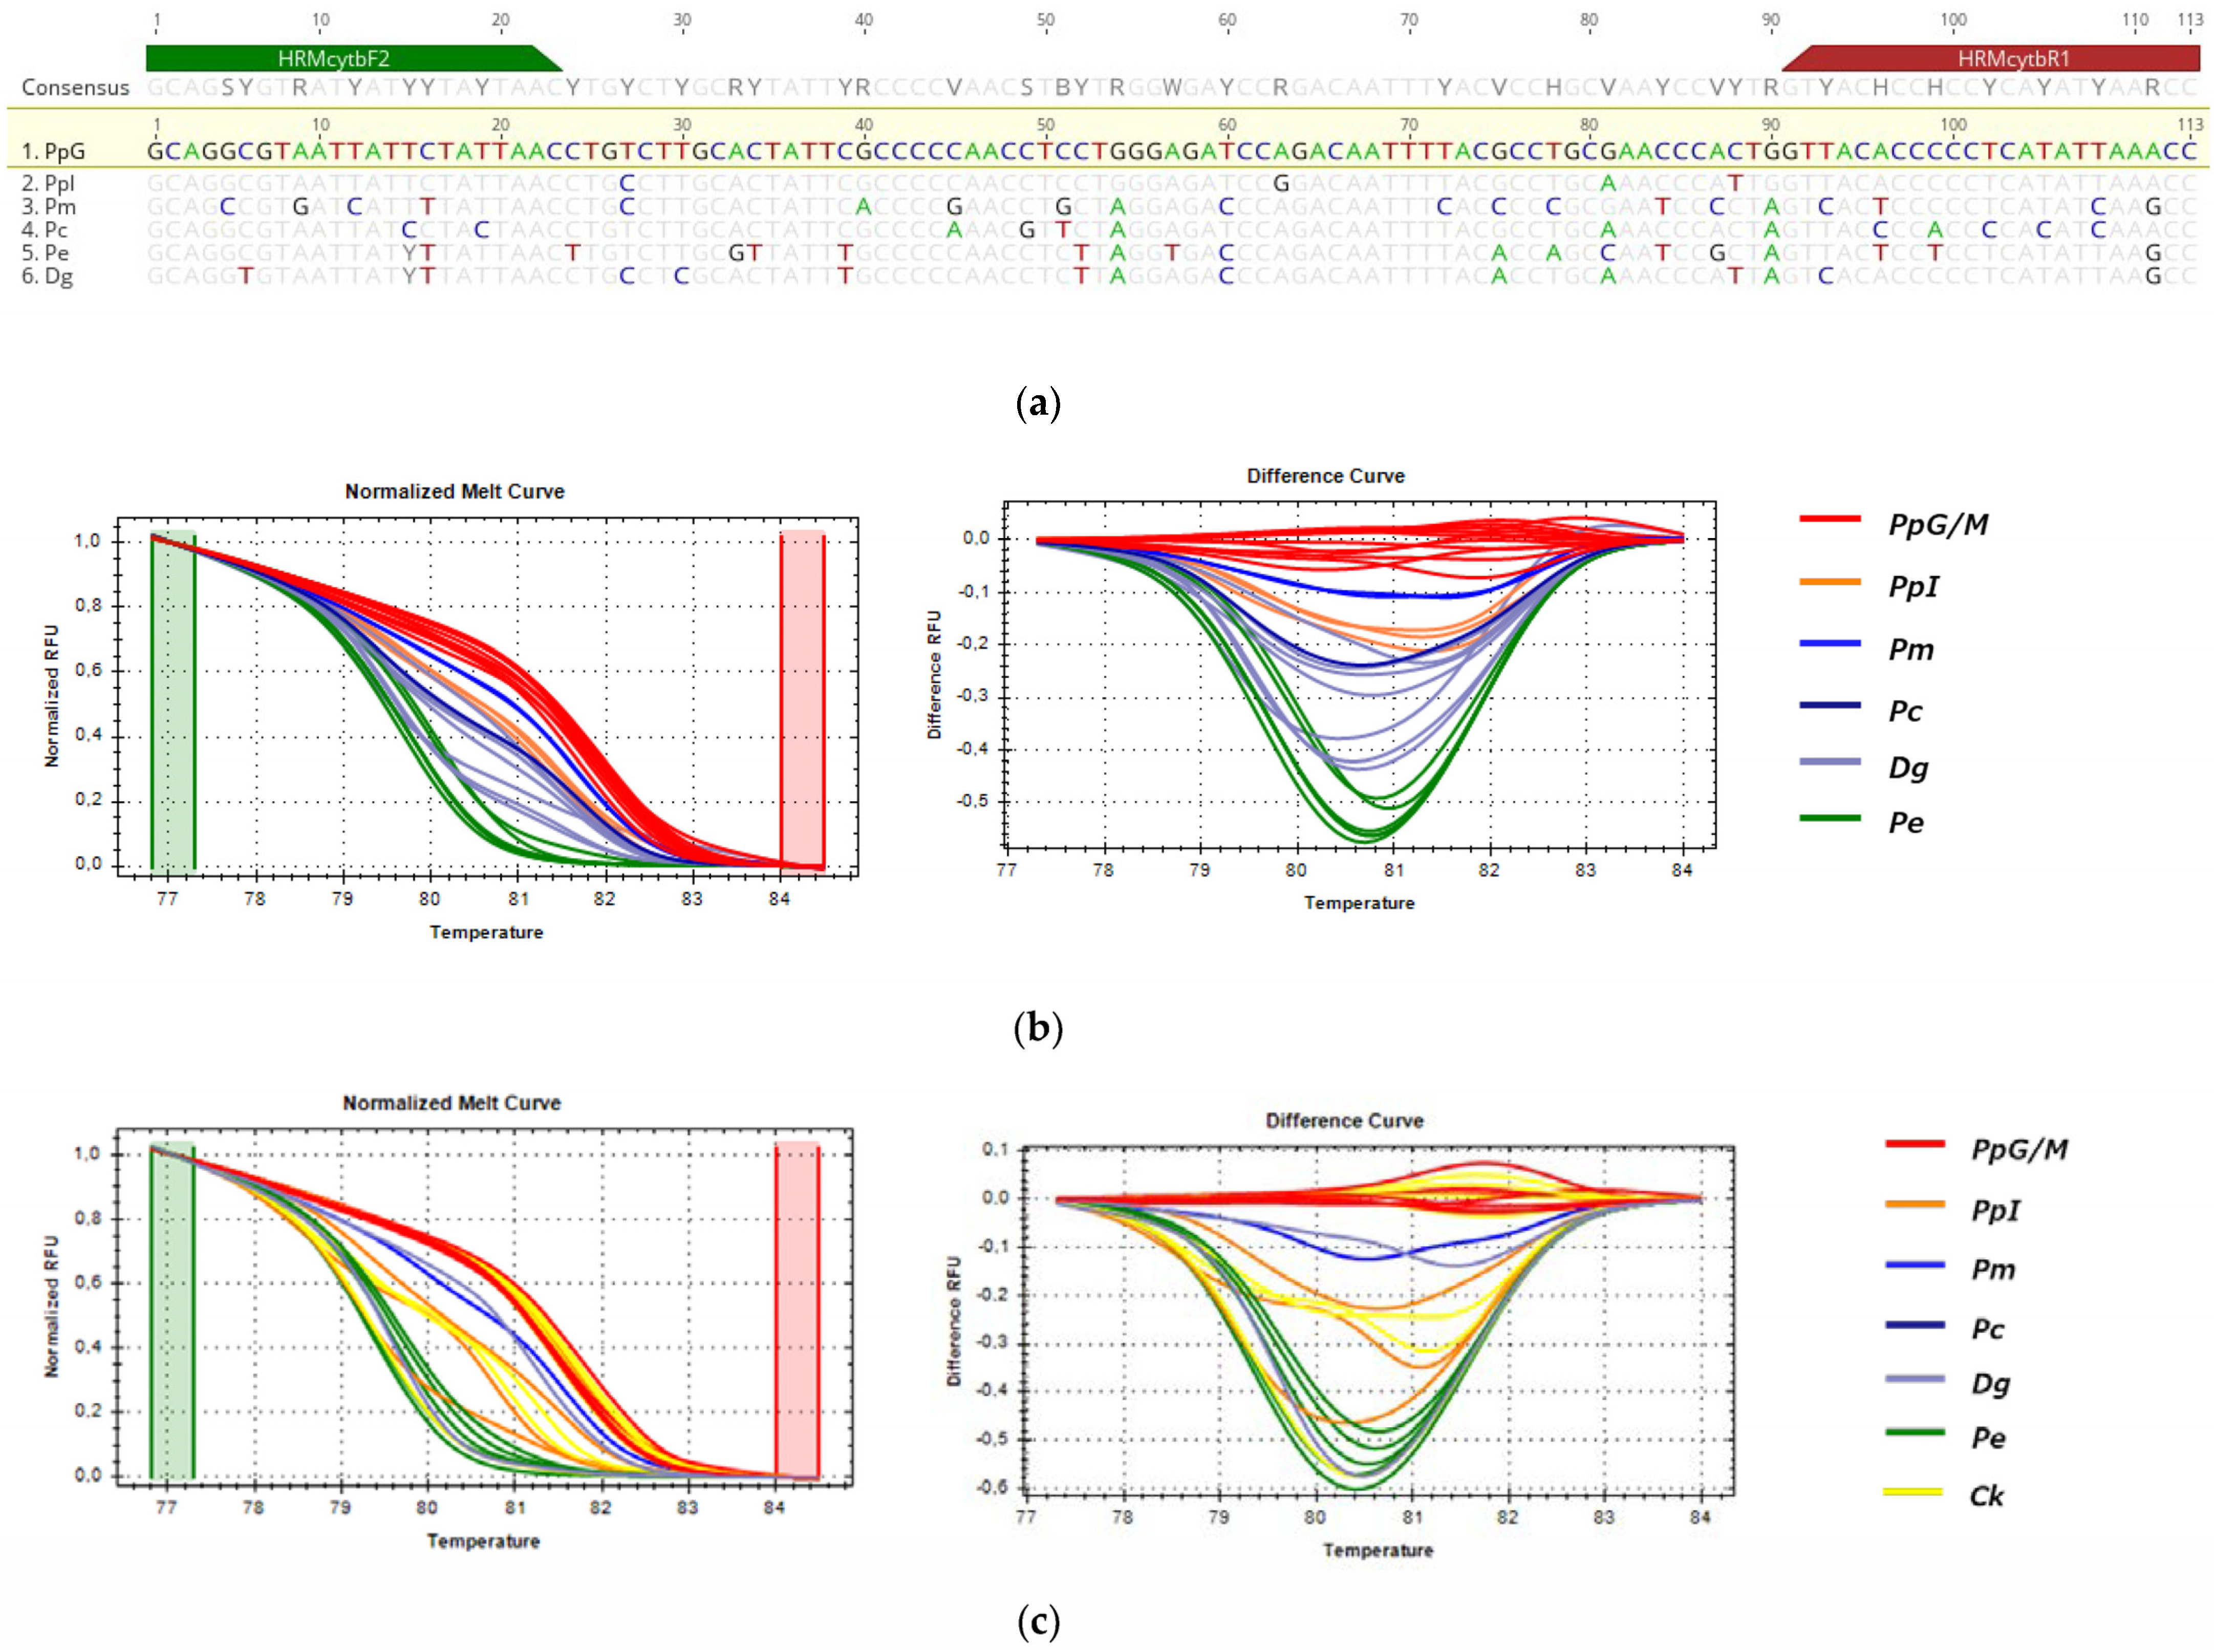
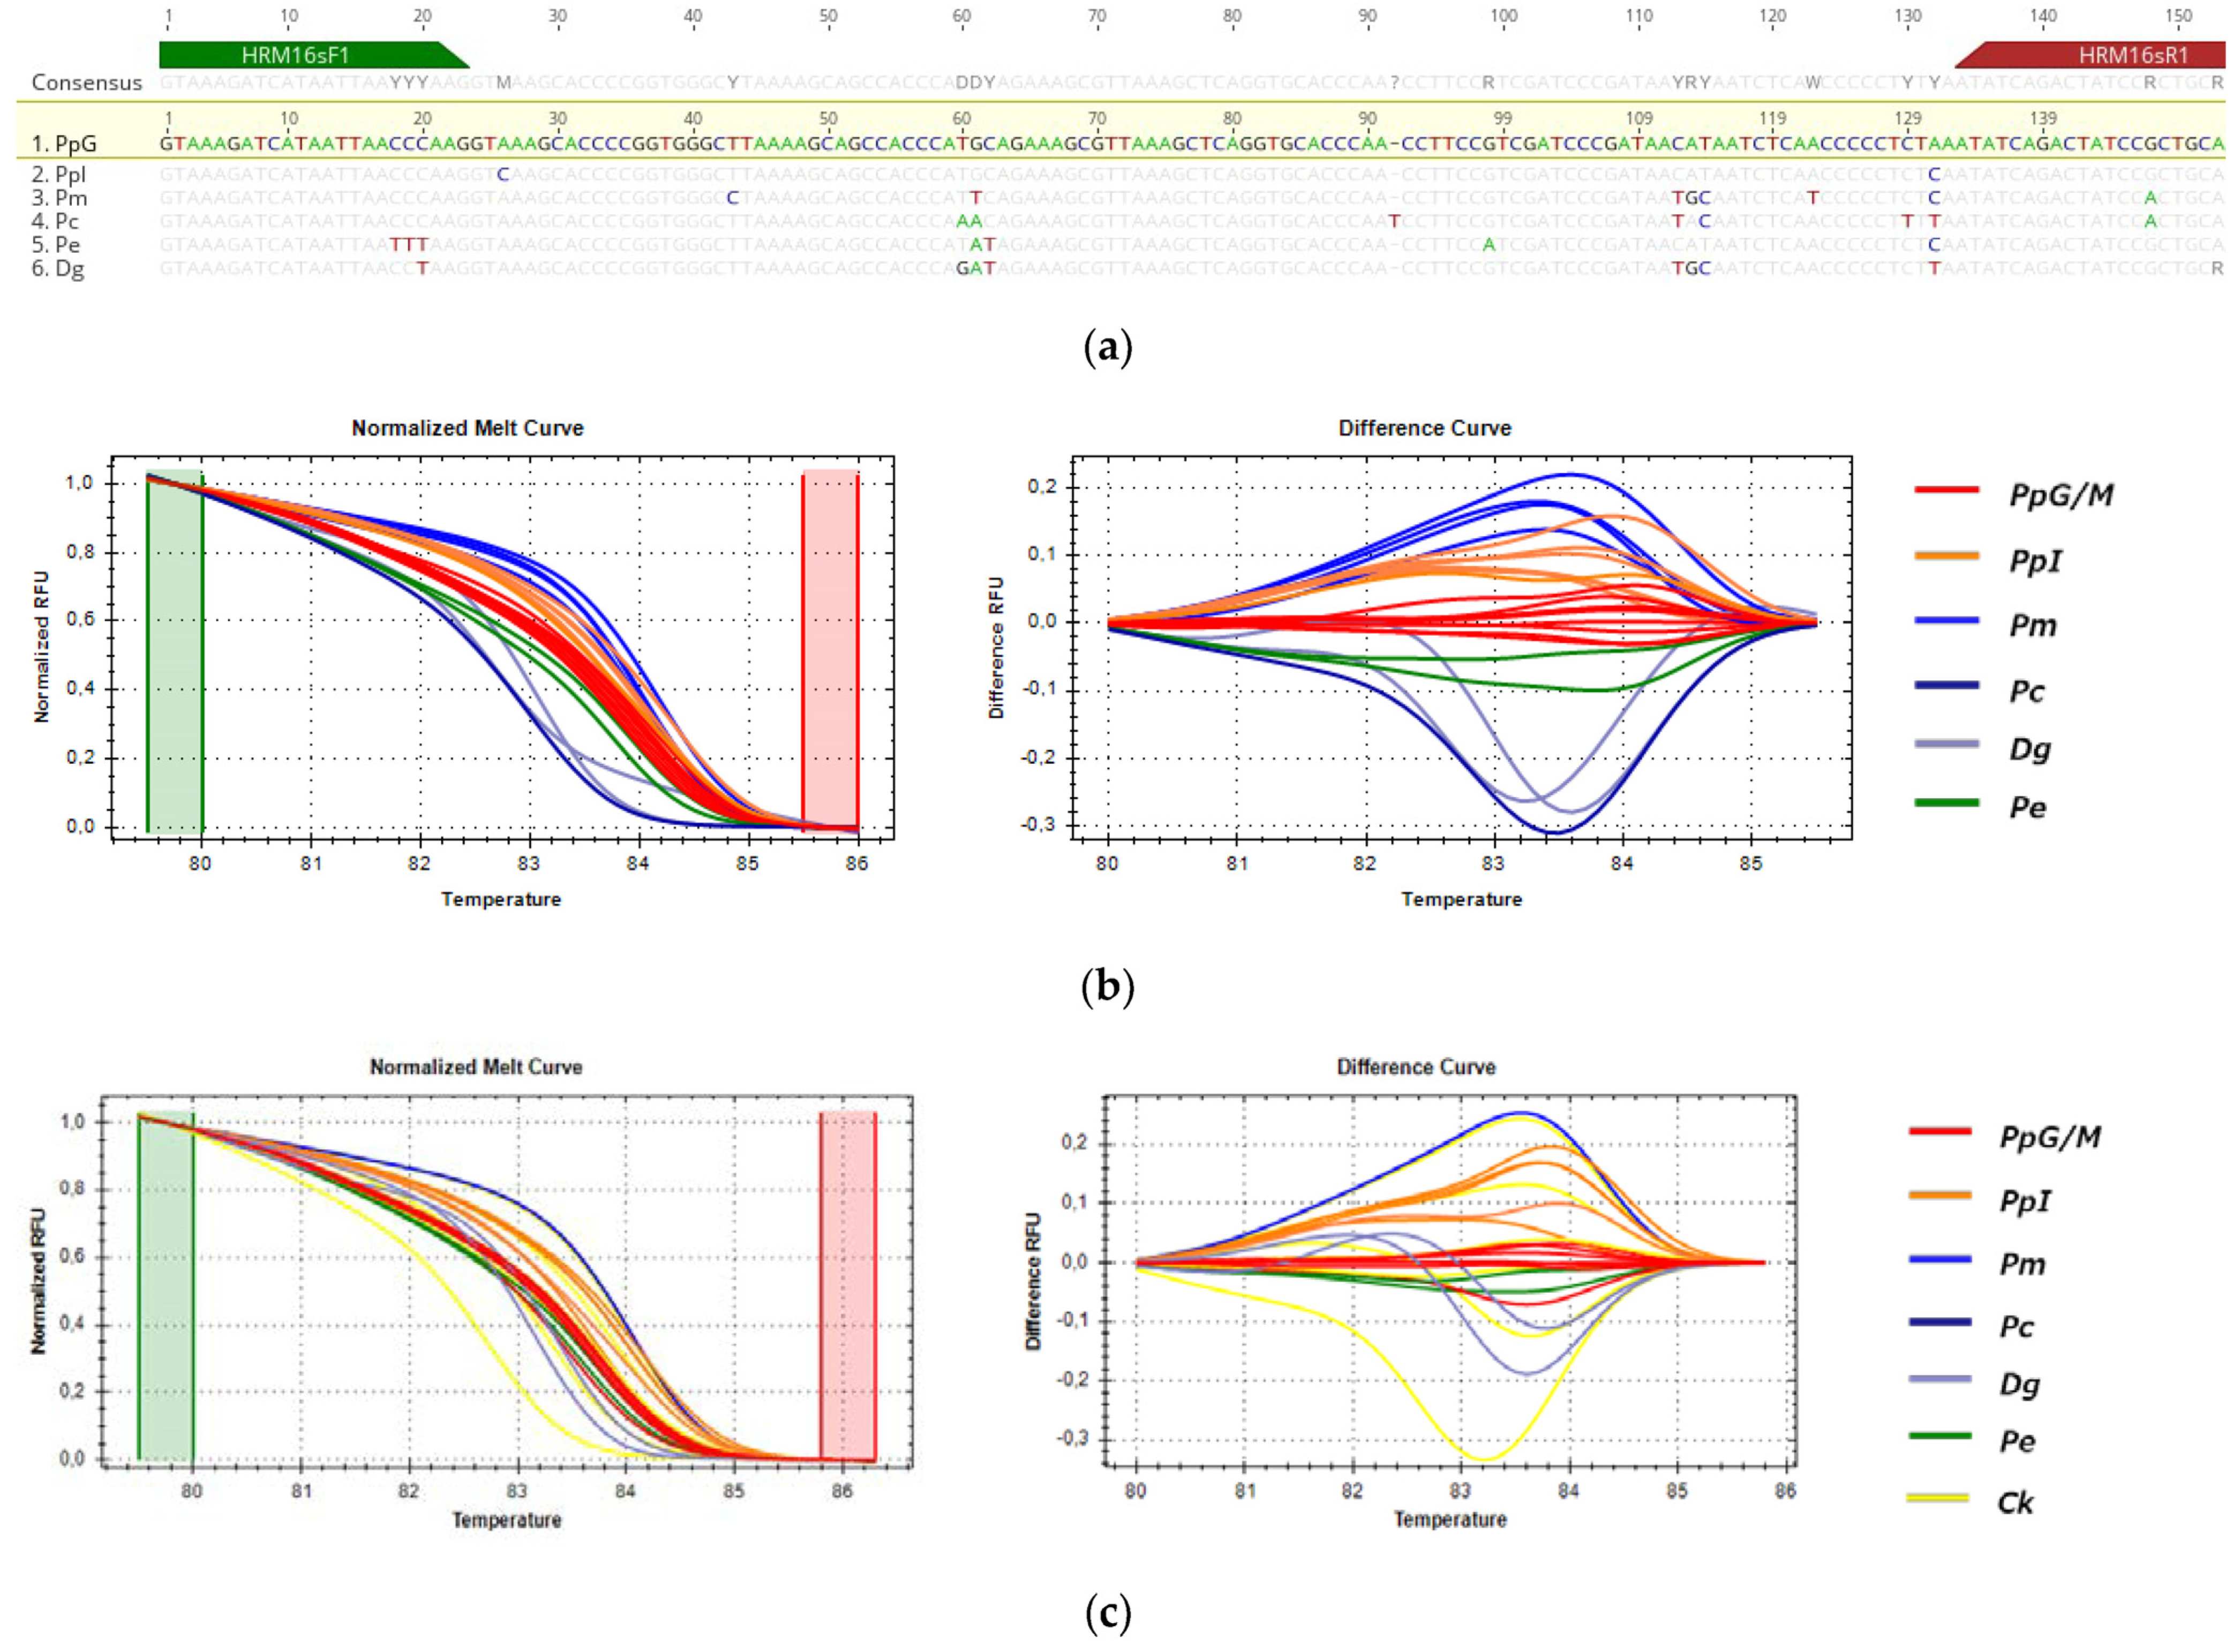
3.3.3. HRM Analysis for the Detection of P. pagrus from Greek Fisheries

For the detection of the substitution of P. pagrus from Greek fisheries when compared to the samples listed in Table 1, three fragments (COI, cytb and 16s) were tested by HRM, but only cytb (113 bp) and 16s (156 bp) were informative for the comparison. These sequences were selected for being 100% identical in all specimens of PpG but showing SNPs with specimens of closely related species and populations of different geographic origins, as shown in Figure 6a and Figure 7a alignments. In HRM analysis, PpG and PpM (red) were assembled in one cluster that was used as the reference, distinct from the imported P. pagrus cluster (PpI-orange) and distinct from other species including P. major (Pm-blue), P. caeruleostictus (Pc-dark blue), P. (Pe-green) and D. gibbosus (Dg-purple) for both cytb and 16s fragments, as shown in Figure 6b and Figure 7b. Cooked samples, as expected, were clustered with the same curves as the respective raw samples (Ck-shown in yellow in Figure 6c and Figure 7c). Confidence levels for all samples are given in Figure S2.
For cytb, the melt region was automatically set by the software, whereas, in order to achieve maximum confidence levels, the melting curve shape sensitivity and Tm difference threshold were set manually at 75% and 0.2, respectively. Under these conditions, confidence levels ranged from 97 to 98.5% for the PpG cluster. The correct clustering of 99% of tested samples was confirmed by sequencing. One unknown sample of PpG (SP) was clustered separately both from PpG/M and PpI, and sequencing results revealed one SNP between this sample and other PpG/M samples.
The 16s melt region was automatically set by the software, whereas, in order to achieve maximum confidence levels, the melting curve shape sensitivity and Tm difference threshold were set manually at 75% and 0.2, respectively. Under these parameters, confidence levels ranged from 97.2 to 99.9% for the PpG cluster, and all samples were accurately clustered as distinct species or different geographical origin groups (i.e., PpG/M vs. PpI).
Both sets of primers used in HRM experiments amplified all tested samples; however, SNPs within the primer binding regions were higher for cytb primers (Figure 6a) compared to 16s primers (Figure 7a). Moreover, the percent identity between tested groups is higher for the 16s fragment (93.9–98.7%) than cytb (81.0–96.5%) (Figure S3). Our results showed that these variations do not interfere with the correct clustering of samples for both mtDNA regions tested.

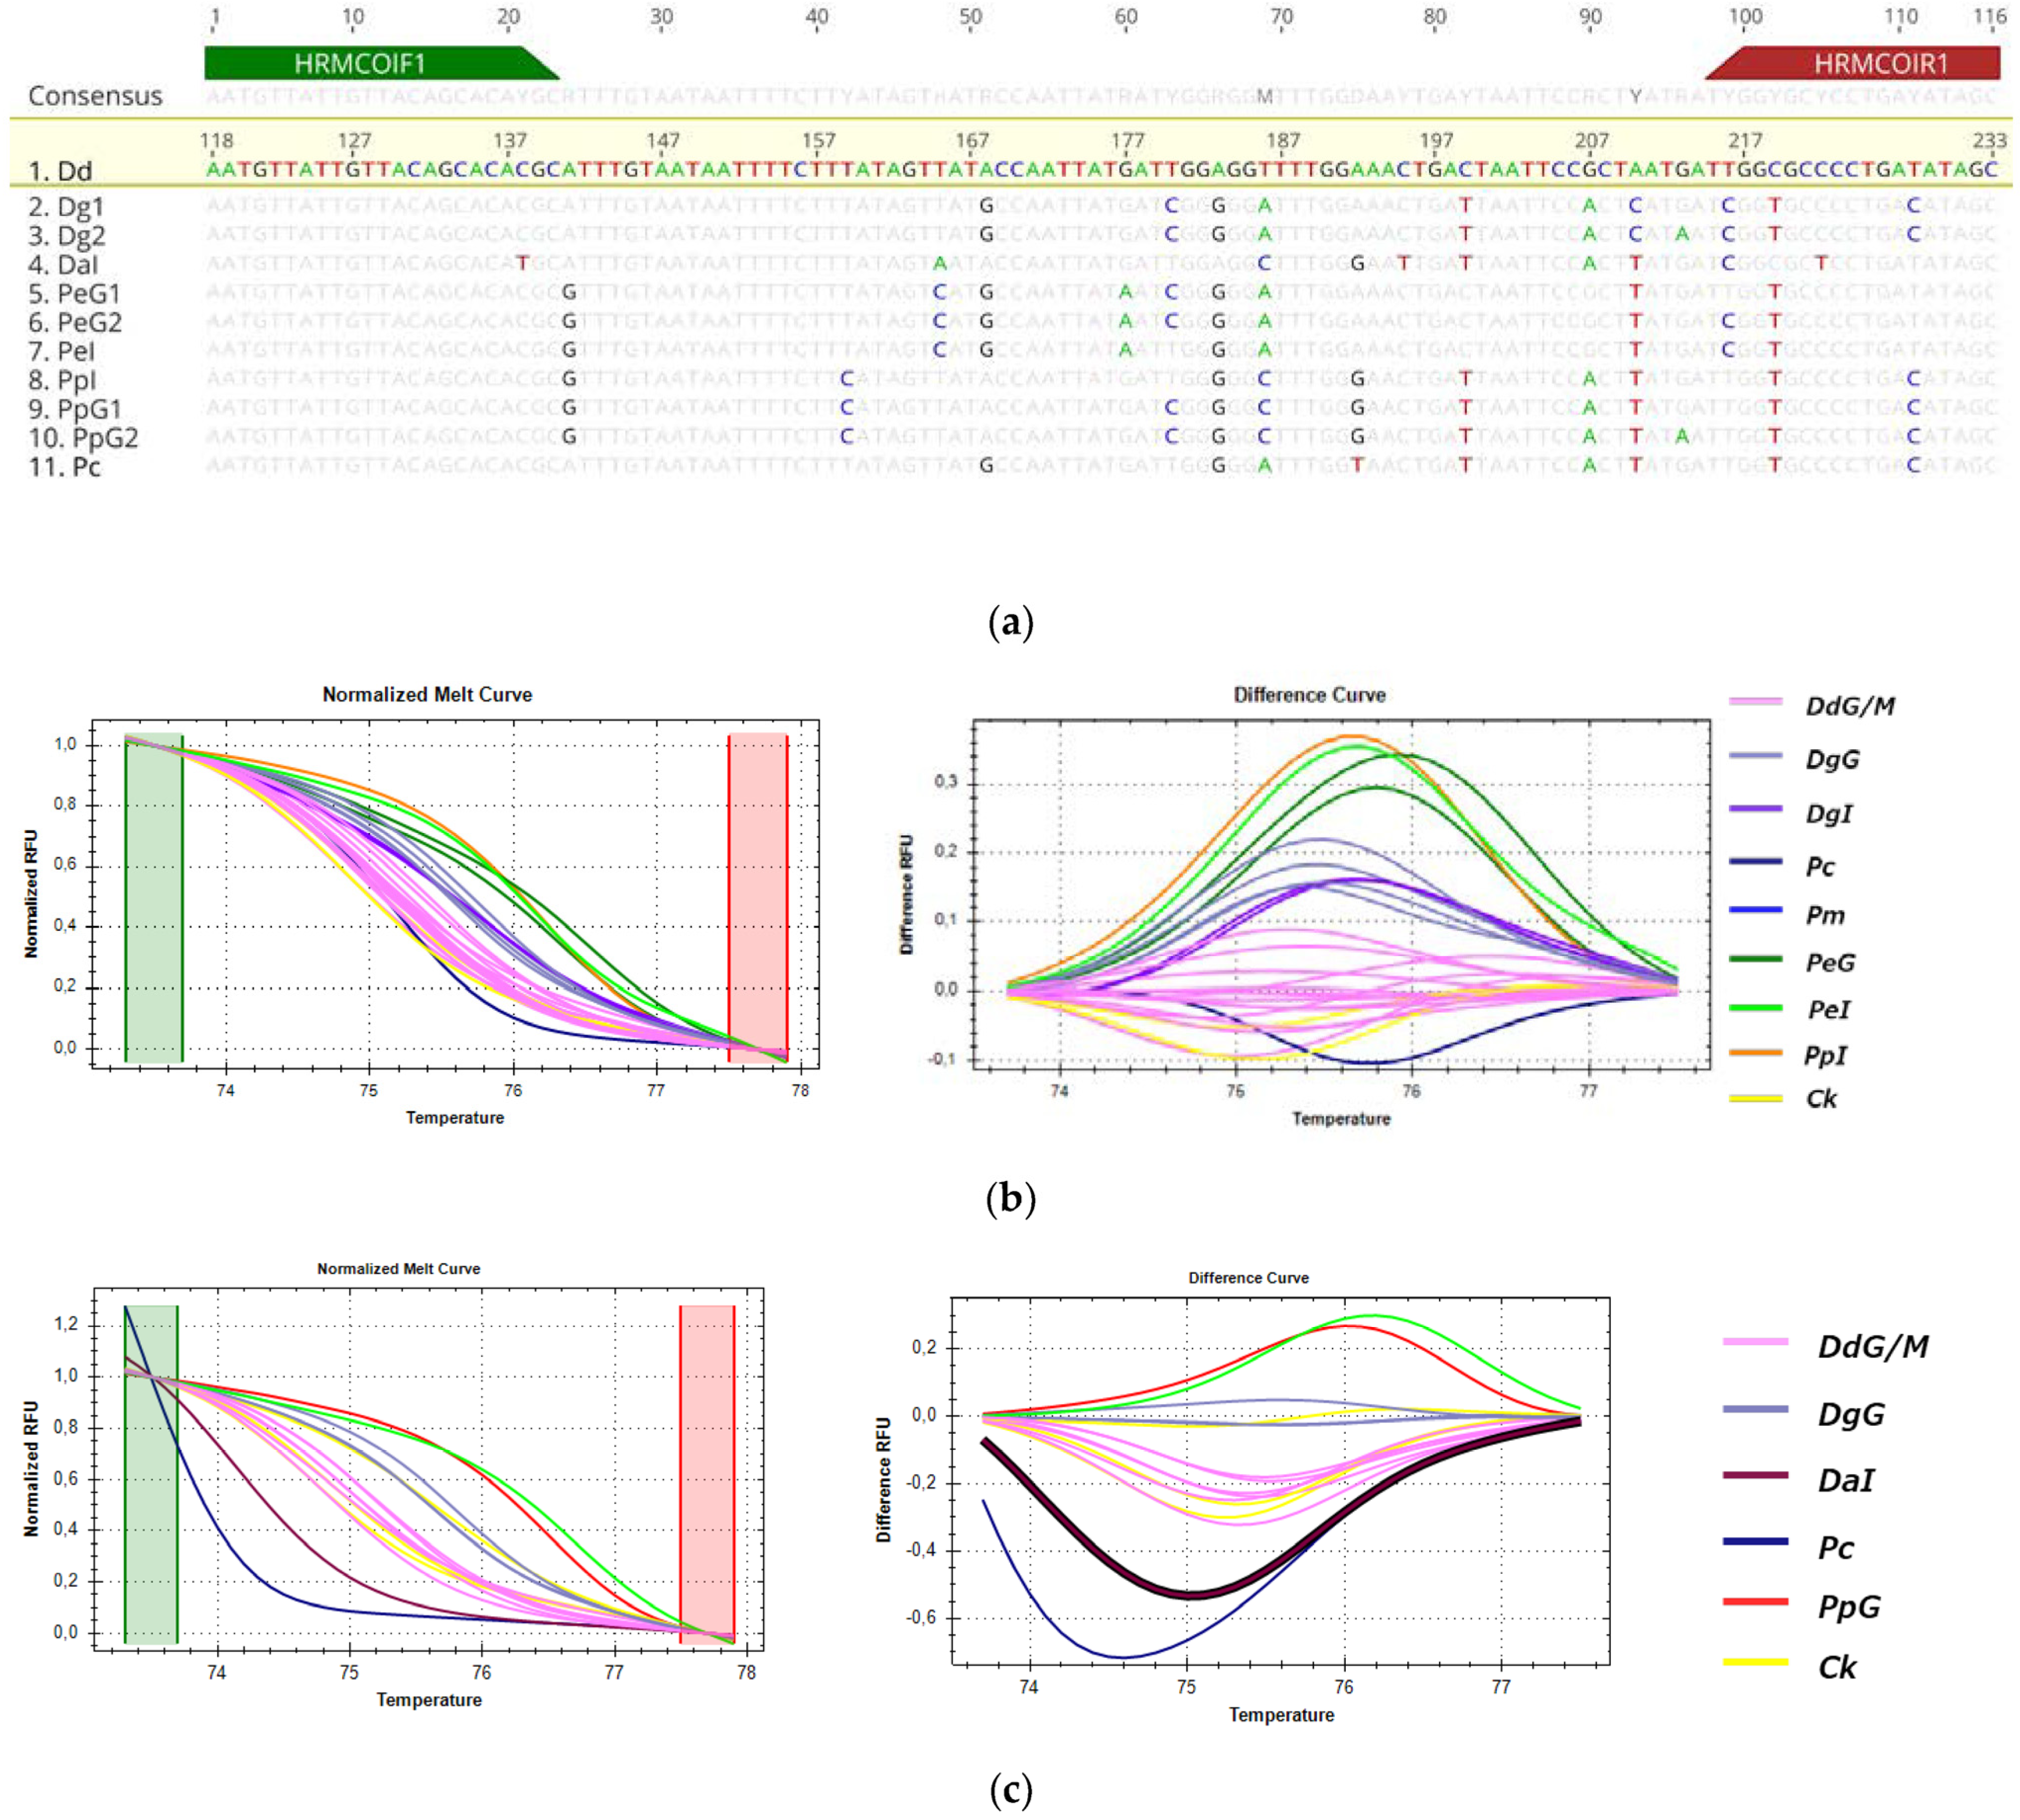
3.3.4. HRM Analysis for the Detection of D. dentex from Greek Fisheries

For D. dentex, two fragments, COI (Figure 8) and 16s (Figure 9), were chosen for the discrimination of DdG from other Sparidae species. The amplification of cytb fragment was not efficient for D. dentex specimens. The only imported samples of D. dentex that were available for the analysis were one sold in the Greek market from Tunisia and one sample from Spain. In HRM of COI, analysis parameters were adjusted manually: a pre-melt range of 73.3–73.8, post-melt range of 77.5–78.0, melting curve shape sensitivity at 75% and Tm difference threshold at 0.5. Under these parameters, confidence levels for the D. demtex cluster ranged from 98 to 99.6%. The 16s melt region was automatically set by the software, whereas, in order to achieve maximum confidence levels (96.0–99.8%), the melting curve shape sensitivity and Tm difference threshold were set manually at 75% and 0.2, respectively. For both COI and 16s fragments, D. dentex samples (DdG/M-pink) were assembled in one cluster and separated from other species, as shown in Figure 8b and Figure 9b, even when cooked samples were incorporated into the analysis (Figure 8c and Figure 9c). The correct clustering of samples was in accordance with sequencing results for all tested samples.
Primers used for the amplification of COI and 16s showed mismatches in the binding region for some Sparidae species; however, all tested samples were efficiently amplified for both fragments. The percent identity of D. dentex compared to other species is 89.6–91.3% for the COI fragment and 90.3–94.2 % for 16s. In 16s, D. dentex and P. caeruleostictus sequences have one nucleotide insertion compared to other Sparidae species. The observed sequence variations did not affect the correct clustering of the species for both mtDNA regions tested. The percentage of sequence identity for the fragments is presented in Figure S4.

4. Discussion

Both species, P. pagrus and D. dentex, selected for this study are widely traded and consumed in Greek fish markets and restaurants, especially during summertime when local consumers and tourists are keen on tasting high-quality fresh domestic fish. As a result of high demand, the price of fresh Greek products is increased, and substitution incidents can occur especially when fish are offered filleted or cooked and covered with sauces in a delicious dish of high price. The close morphological resemblance of P. pagrus and D. dentex with other local or imported Sparidae species of a lower price, as well as aquaculture products, all traded in the Greek markets, leads to the hypothesis that they can be used in substitution events with economic profit.
Currently, DNA sequencing-based methods, and, more particularly, DNA barcoding, are indispensable tools for species identification, providing the highest accuracy and certainty of the results [39]. Therefore, in this study, DNA barcoding was used to precisely identify the species of all specimens that were used as reference samples in the subsequent analyses.
A large number of barcodes are available for the Sparidae in BOLD and GenBank databases; however, there are few for P. pagrus and D. dentex from Greek seas. For P. pagrus, all DNA barcodes sequenced from fish caught in Greek seas show up to 100% identity with barcodes of fished individuals from Turkey [54], Israel, the Central Mediterranean, Egypt and Spain [54,55,56,57] but lower with those from the Atlantic Ocean. [58]. The same results were also obtained for D. dentex with 99.67–100% identity with other Mediterranean samples mined from GenBank and Bold databases [57,59,60]. The homogeneity of P. Pagrus populations in the Mediterranean and their differences with the Atlantic populations have been described in population studies [58,61]. The Strait of Gibraltar is a natural border between the Mediterranean Sea and the Atlantic Ocean, and several studies have shown a barrier to gene flow for several species’ populations, including Pagrus [61]. In this study, two samples collected from the Greek market, or served filleted at a restaurant and identified as D. gibbosus, were labeled and sold as P. pagrus. Although D. gibbosus is a tasty fish, appreciated by recreational fishermen, it is not as popular as P. pagrus or D. dentex to regular consumers, its price is lower and imported fish of this species are traded in the Greek market, indicating that these findings are mislabeling incidents. All samples sold as Greek aquaculture products or from lagoon fish traps were identified as P. major. Since P. major is the only Pagrus species in Greek aquaculture, it is clear that fish from lagoon fish traps are not wild P. pagrus as claimed but fish introduced from aquaculture farms. The presence of four samples of P. major in the Ionian Sea, near the entrance of Amvrakikos Gulf [15], a location which is in proximity to aquaculture farms and lagoon fish traps, indicates the dispersal of this non-native species in the area. In our study, two samples fished in Cyclades (CY) and Crete (CR) were offered by recreational fishermen as P. pagrus, but they were identified as P. major. The presence of P. major has already been reported in the Adriatic Sea [62] and eastern Mediterranean [63], but its presence is now confirmed also in the east coasts of the Greek mainland and South Aegean. The use of P. major as a common species in Greek porgy aquaculture, and the occurrence of this species in the Greek seas, raises the question about the environmental impact of the rearing of a non-native species. Moreover, in four cases examined in this study, these fish were sold in the market and in restaurants under the genus name without clearly identifying the species. P. major aquaculture products as well as LFT fish have lower prices (16–17 EUR/kg for AQ fish and 20–22 EUR/kg for LFT fish) compared to wild catches of P. pagrus (EUR 25–30), indicating cases of mislabeling. However, it remains uncertain whether it was unintentional, since this species is also found in the wild, or whether these were cases of fraud. For D. dentex, only one case of mislabeling was detected regarding an imported fish that was identified as P. erythrinus, and one sample donated by a recreational fisherman was erroneously identified as D. dentex but assigned by barcoding as D. gibbosus, outlining the difficulty of Sparidae species identification by morphological characteristics.
The high occurrence of mislabeling, especially for P. pagrus, raises the need for extensive market control. In this study, three methods (PCR-RFLPs, multiplex PCR and HRM) were used to discriminate between closely related species and between populations of different geographic origin within species, aiming to analyze a large number of samples with low cost and in a time-effective experimental procedure. Fresh, frozen and cooked samples were used to estimate the sensitivity, tolerance, efficiency and consistency of each method and finally to propose the most suitable protocol applicable to market controls. When conventional PCR methods (PCR-RFLPs and multiplex PCR) were applied, P. pagrus and D. dentex were identified compared to other Sparidae species, and the methods proved to be cost effective compared to sequencing methods. However, both methodologies require the amplification of fragments ranging from 150 to 1292 bp, and a robust PCR product is necessary in order to be visible on agarose gels. RFLPs analysis is time consuming as several steps are required—amplification, digestion reactions and two electrophoresis procedures—thus restricting the number of samples analyzed per day. Multiplex PCR is faster and cheaper than RFLPs, but nonspecific amplification was detected, and optimal PCR products were not consistently obtained for bigger fragments (>400 bp), especially when frozen or cooked samples were analyzed. This could be attributed to DNA partial degradation in fish tissues, a procedure that starts at the moment the fish die [64] and continues until the sampling time. In the case of samples collected from the market, the exact time between organism death and tissue storage, as well as conservation procedures on a vessel, is usually unknown. Although storage in ice or refrigeration delays DNA degradation, post-mortem interval can affect DNA integrity [64,65]. In the case of frozen samples, although low temperatures can slow down this procedure, long periods of storage or defrosting can affect DNA quality [64]. For cooked samples, we have to consider that when DNA undergoes thermal treatment, it can be partially degraded into fragments ranging from less than 100 bp up to about 500 bp [29] and that a number of compounds present in processed or cooked foods may act as inhibitors in PCR [34].
Since our study involves commercially available and cooked samples, in order to overcome the limitation of DNA integrity, real-time PCR coupled with HRM analysis was used. Targeting shorter DNA regions (113–156 bp) ensures amplification even if DNA is degraded, the use of next-generation fluorescence dyes such as EvaGreen gives the method high sensitivity [43], and melt curve analysis gives the possibility of discriminating between two PCR products with one SNP.
A suitable marker for species authentication must be variable even between the closest species and display either low or ideally no intra-specific variations across the geographic distribution area. Moreover, it should be widely studied to enable comparison between the nucleotide sequence from an unknown sample against reference sequences in a database [34]. Based on the intra-species and inter-species polymorphisms of the Sparidae representatives, the selected 16s fragment best satisfies these criteria, and the analysis method was optimized for the identification of an unknown sample either as P. pagrus or D. dentex from domestic catches. All mislabeled samples precisely identified by sequencing were equally discriminated in HRM analysis, and the best results were obtained with the 16s fragment. Amplicons were obtained consistently and effectively either from small amounts of tissues or from partially degraded samples when larger fragments failed to amplify. The clustering of each species showing characteristic peaks for each reference species was consistent regardless of the tissue used, its state or the DNA extraction protocol. The latter analysis, in the case of D. dentex, could discriminate the species from other representatives of the Sparidae family, whereas in the case of P. pagrus, it could discriminate domestic samples from other Sparidae species and from imported P. pagrus fished in the Atlantic Ocean. The protocols in this study are optimized for P. Pagrus or D. dentex from the Mediterranean; therefore, when an unknown sample is not clustered as such, the species can be determined by subsequent sequencing. However, our results show that by applying the same analysis, samples of P. major can also be identified, as they form a consistently separate and identifiable cluster. This suggests that the approach could be applied for monitoring the presence of P. major escapes in the Mediterranean Sea. The analysis was equally efficient even when frozen or cooked samples were tested. Therefore, boiling, frying, adding sauces or long periods of ice frosting and defrosting does not affect the amplification of the mtDNA regions tested. As in the case of DNA barcoding, HRM failed to discriminate between populations from the Greek seas and other Mediterranean Sea areas; however, fresh samples from other Mediterranean countries are not often found in the Greek market or are sold at a high price (20–25 EUR/kg) compared to the imported frozen P. pagrus (5–8 EUR/kg). Therefore, the possibility of using them for fraudulent actions with economic profit is low.
HRM analysis has previously been used for fish species identification in Gadidae [33,45], hake [66], Takifugu pufferfish [31], Macrourus [32], sharks [67], pangasius [68] and sepias [69]. It has been validated for mussels [70] and salmonids [71], for which it has been applied to market surveys, showing the potential of a common approach for seafood authentication throughout the supply chain. HRM is carried out in a single reaction in one apparatus, and a large number of samples (95 max) can be analyzed within three hours, as post-PCR melt curve profiles are rapidly processed by the analysis software. The advantages of being applied on samples when no morphological identification is possible (i.e., filleted or juvenile fish) or for those that are cooked and canned [70] rapidly in real-time observation of the results in a cost-effective manner, eliminating the necessity of large-number sequencing reactions, are obvious. Moreover, using a single piece of equipment for analysis offers the advantage of enabling the technique to be established in multiple control laboratories [71] across the supply chain.

5. Conclusions

Fisheries play an important socioeconomic role in Greece, providing the market with wild fish of high nutritional value. In order to enable consumers to make informed choices, it is necessary to provide clear and comprehensive information about the species and validate the origin of the traded fish. European food legislation is particularly strict, and traceability systems based on product labeling are mandatory in all European countries, as described in Regulation (EU) No. 1379/2013 [24]. Labels must provide clear and accurate information on the product’s origin, species, catch or farming method and production method. In this study, incidents of intentional or unintentional mislabeling for P. pagrus and D. dentex have been identified in the Greek market, either in raw or cooked samples. In order to protect the consumers’ preference for local products, extensive sampling in fish markets and restaurants needs to be operated. We propose HRM analysis as a fast, effective, sensitive, repeatable and cost-effective method that can be applied in systematic market controls as a rapid tool against fish fraud and mislabeling detection.

Supplementary Materials

The following supporting information can be downloaded at: https://www.mdpi.com/article/10.3390/genes14061255/s1, Figure S1: qPCR amplification curves of the samples tested with HRM; Table S1: Mean Cq values and SD for the examined species in HRM analysis; Figure S2: Maximum Confidence Percent values; Figure S3: Percentage of sequence identity for the fragments used in HRM analysis of P. pagrus identification; Figure S4: Percentage of sequence identity for the fragments used in HRM analysis of D. dentex identification.

Author Contributions

Conceptualization, H.M., A.E., R.S. and A.P.A.; methodology, E.C. and N.T.; software, E.C. and E.E.M.; validation, I.A.G., M.T., G.A.G. and J.S.; formal analysis, E.C. and N.T.; investigation, E.C., H.M. and G.T.; resources, G.T. and N.T.; data curation, E.E.M.; writing—original draft preparation, E.C.; writing—review and editing, H.M., A.P.A., R.S., A.E., E.E.M. and G.T.; visualization, A.E. and R.S.; supervision, H.M. and A.P.A.; project administration, E.C. and G.T.; funding acquisition, H.M. and G.T. All authors have read and agreed to the published version of the manuscript.

Funding

This work was supported by the Greek Operational Programme Maritime & Fisheries 2014–2020, which is co-financed by the EU European Maritime and Fisheries Fund and the Hellenic Republic Ministry of Rural Development and Food, under the title: MOLECULAR IDENTIFICATION OF FISH AUTHENTICITY AND ADULTΕRATION IN GREEK MARKET—FISH MID (MIS 5033599).

Institutional Review Board Statement

Not applicable.

Informed Consent Statement

Not applicable.

Data Availability Statement

The data presented in this study are available in the GenBank NIH genetic sequence database under the accession numbers: OQ208746-OQ208756, OQ211305-OQ211329, OQ272113-OQ272123, OQ865594-OQ865603, OQ208828-OQ208830, OQ281602, OQ272124, OQ281603-OQ281609, OQ860775-OQ860777, OQ860773, OQ860774, OQ888163, OQ888164, OQ861107, OQ861152-OQ861162, OQ890738, OQ862795-OQ862820, OQ880490-OQ880493, OQ880557-OQ880559, OQ888790, OQ892284-OQ892292, OQ915022-OQ915035, and OQ903885-OQ903890.

Acknowledgments

The authors thank Gaetano Catanese for the supply of samples used in control experiments.

Conflicts of Interest

The authors declare no conflict of interest.

References

  1. Molina-Vega, M.; Gómez-Pérez, A.M.; Tinahones, F.J. Fish in the Mediterranean Diet. In The Mediterranean Diet, 2nd ed.; Preedy, V.R., Watson, R.R., Eds.; Elsevier Inc.: Amsterdam, The Netherlands, 2020; pp. 275–284. ISBN 9780128186497. [Google Scholar]
  2. FAO. World Fisheries and Aquaculture; FAO: Rome, Italy, 2022; pp. 1–11. [Google Scholar] [CrossRef]
  3. Lawrence, S.; Elliott, C.; Huisman, W.; Dean, M.; van Ruth, S. The 11 sins of seafood: Assessing a decade of food fraud reports in the global supply chain. Compr. Rev. Food Sci. Food Saf. 2022, 21, 3746–3769. [Google Scholar] [CrossRef] [PubMed]
  4. Ryburn, S.J.; Ballantine, W.M.; Loncan, F.M.; Manning, O.G.; Alston, M.A.; Steinwand, B.; Bruno, J.F. Public awareness of seafood mislabeling. PeerJ 2022, 10, e13486. [Google Scholar] [CrossRef] [PubMed]
  5. Cermakova, E.; Lencova, S.; Mukherjee, S.; Horka, P.; Vobruba, S.; Demnerova, K.; Zdenkova, K. Identification of Fish Species and Targeted Genetic Modifications Based on DNA Analysis: State of the Art. Foods 2023, 12, 228. [Google Scholar] [CrossRef] [PubMed]
  6. Warner, K.; Mustain, P.; Lowell, B.; Geren, S.; Talmage, S. Deceptive Dishes: Seafood Swaps Found Worldwide. Oceana 2016. Available online: https://usa.oceana.org/reports/deceptive-dishes-seafood-swaps-found-worldwide/ (accessed on 7 May 2023).
  7. Blanco-Fernandez, C.; Ardura, A.; Masiá, P.; Rodriguez, N.; Voces, L.; Fernandez-Raigoso, M.; Roca, A.; Machado-Schiaffino, G.; Dopico, E.; Garcia-Vazquez, E. Fraud in highly appreciated fish detected from DNA in Europe may undermine the Development Goal of sustainable fishing in Africa. Sci. Rep. 2021, 11, 11423. [Google Scholar] [CrossRef]
  8. Verrez-Bagnis, V.; Sotelo, C.G.; Mendes, R.; Silva, H.; Kappel, K.; Schröder, U. Methods for Seafood Authenticity Testing in Europe. In Bioactive Molecules in Food; Mérillon, J.M., Ramawat, K., Eds.; Springer: Berlin/Heidelberg, Germany, 2019; pp. 2063–2117. ISBN 9783319780306. [Google Scholar] [CrossRef]
  9. Rasmussen, R.S.; Morrissey, M.T. Application of DNA-Based Methods to Identify Fish and Seafood Substitution on the Commercial Market. Compr. Rev. Food Sci. Food Saf. 2009, 8, 118–154. [Google Scholar] [CrossRef]
  10. EUMOFA. EU Consumer Habits Regarding Fishery and Aquaculture Products—Annex 1 Mapping and analysis of existing studies on consumer habits. Eur. Mark. Obs. Fish. Aquac. Prod. 2017, 46. Available online: https://data.europa.e (accessed on 1 March 2023).
  11. Manooch, C.S.; Hassler, W.W. Synopsis of Biological Data on the Red Porgy, Pagrus Pagrus (Linnaeus); Penn State University: State College, PA, USA, 2013. [Google Scholar] [CrossRef]
  12. Froese, R.D.P. (Ed.) FishBase. Version (02/2023); World Wide Web Electronic Publication 2023. Available online: www.fishbase.org (accessed on 1 March 2023).
  13. European Commission Council Regulation (EC). No 1967/2006 of 21 December 2006 Concerning Management Measures for the Sustainable Exploitation of Fishery Resources in the Mediterranean Sea. Off. J. Eur. Union. 2019. Available online: http://data.europa.eu/eli/reg/2006/1967/2019-08-14 (accessed on 7 May 2023).
  14. Hellenic Aquaculture Producers Organization. Greek Aquaculture 2022 Annual Report. Available online: https://fishfromgreece.com/en/kathgoria/exhibitions/greek-aquaculture-annual-report-2022/ (accessed on 21 April 2023).
  15. Cladas, Y.; Spalla, K.; Doudoumis, V.; Ketsilis-Rinos, V.; Batargias, C.; Koutsikopoulos, C. Presence Confirmation of Non-Native Species Pagrus major (Temminck And Schlegel, 1843) in the Eastern Mediterranean. Oceanogr. Fish. Open Access J. 2019, 9, 555756. [Google Scholar] [CrossRef]
  16. European Commission Council Regulation (EC). No. 535/2008 Laying down Detailed Rules for the Implementation of Council Regulation (EC) No. 708/2007 Concerning Use of Alien and Locally Absent Species in Aquaculture. Off. J. Eur. Union 2008, 2008, 6–9. [Google Scholar]
  17. Cocolin, L.; D’Agaro, E.; Manzano, M.; Lanari, D.; Comi, G. Rapid PCR-RFLP Method for the Identification of Marine Fish Fillets (Seabass, Seabream, Umbrine, and Dentex). J. Food Sci. 2000, 65, 1315–1317. [Google Scholar] [CrossRef]
  18. Schiefenhövel, K.; Rehbein, H. Differentiation of Sparidae species by DNA sequence analysis, PCR-SSCP and IEF of sarcoplasmic proteins. Food Chem. 2013, 138, 154–160. [Google Scholar] [CrossRef]
  19. Marengo, M.; Durieux, E.D.; Marchand, B.; Francour, P. A review of biology, fisheries and population structure of Dentex dentex (Sparidae). Rev. Fish Biol. Fish. 2014, 24, 1065–1088. [Google Scholar] [CrossRef]
  20. Carpenter, K.E.; Russel, B. Dentex Dentex. The IUCN Red List of Threatened Species 2014. 2014; 8235, e.T170245A1300534(accessed on 19 April 2023). [Google Scholar] [CrossRef]
  21. Koumoundouros, G.; Carrillo, J.; Divanach, P.; Kentouri, M. The rearing of common dentex Dentex dentex (L.) during the hatchery and on-growing phases. Aquaculture 2004, 240, 165–173. [Google Scholar] [CrossRef]
  22. Rueda, F.; Martinez, F. A review on the biology and potential aquaculture of Dentex dentex. Rev. Fish Biol. Fish. 2001, 11, 57–70. [Google Scholar] [CrossRef]
  23. Katavic, I.; Grubiŝíc, L.; Skakelja, N. Growth performance of pink dentex as compared to four other sparids reared in marine cages in Croatia. Aquac. Int. 2000, 8, 455–461. [Google Scholar] [CrossRef]
  24. European Commission Council Regulation (EU). No 1379/2013 on the Common Organization of the Markets in Fishery and Aquaculture Products, Amending Council Regulations (EC) No 1184/2006 and (EC) No 1224/2009 and Repealin. Off. J. Eur. Union 2013, L354, 1–21. [Google Scholar]
  25. Teletchea, F. Molecular identification methods of fish species: Reassessment and possible applications. Rev. Fish Biol. Fish. 2009, 19, 265–293. [Google Scholar] [CrossRef]
  26. Angers, A.; Ballin, N.; Hofherr, J.; Kagkli, D.; Lievens, A.; Maquet, A.; Martinsohn, J.; Paracchini, V.; Petrillo, M.; Puertas Gallardo, A. Enhancing Fish Species Identification Using Novel Markers and Emerging Technologies; EUR 28505 EN; Publications Office of the European Union: Luxembourg, 2017; ISBN 978-92-79-66293-5. [Google Scholar]
  27. Ward, R.D.; Hanner, R.; Hebert, P.D.N. The campaign to DNA barcode all fishes, FISH-BOL. J. Fish Biol. 2009, 74, 329–356. [Google Scholar] [CrossRef]
  28. Di Pinto, A.; Marchetti, P.; Mottola, A.; Bozzo, G.; Bonerba, E.; Ceci, E.; Bottaro, M.; Tantillo, G. Species identification in fish fillet products using DNA barcoding. Fish. Res. 2015, 170, 9–13. [Google Scholar] [CrossRef]
  29. Rasmussen, R.S.; Morrissey, M.T. DNA-Based Methods for the Identification of Commercial Fish and Seafood Species. Compr. Rev. Food Sci. Food Saf. 2008, 7, 280–295. [Google Scholar] [CrossRef] [PubMed]
  30. Tomás, C.; Ferreira, I.; Faria, M. Codfish authentication by a fast Short Amplicon High Resolution Melting Analysis (SA-HRMA) method. Food Control 2017, 71, 255–263. [Google Scholar] [CrossRef]
  31. Chen, C.; Ding, Y.; Wang, Y.; Jiang, Q.; Wang, F.; Lu, C.; Zhang, L.; Zhu, C. High-Resolution Melting Analysis of COI Sequences Distinguishes Pufferfish Species (Takifugu spp.) in China. J. Agric. Food Chem. 2021, 69, 794–804. [Google Scholar] [CrossRef]
  32. Fitzcharles, E. Rapid discrimination between four Antarctic fish species, genus Macrourus, using HRM analysis. Fish. Res. 2012, 127–128, 166–170. [Google Scholar] [CrossRef]
  33. Fernandes, T.J.; Costa, J.; Oliveira, M.B.P.; Mafra, I. DNA barcoding coupled to HRM analysis as a new and simple tool for the authentication of Gadidae fish species. Food Chem. 2017, 230, 49–57. [Google Scholar] [CrossRef]
  34. Teletchea, F.; Maudet, C.; Hänni, C. Food and forensic molecular identification: Update and challenges. Trends Biotechnol. 2005, 23, 359–366. [Google Scholar] [CrossRef]
  35. Barcaccia, G.; Lucchin, M.; Cassandro, M. DNA Barcoding as a Molecular Tool to Track Down Mislabeling and Food Piracy. Diversity 2015, 8, 2. [Google Scholar] [CrossRef] [Green Version]
  36. Sayers, E.W.; Bolton, E.E.; Brister, J.R.; Canese, K.; Chan, J.; Comeau, D.C.; Connor, R.; Funk, K.; Kelly, C.; Kim, S.; et al. Database resources of the national center for biotechnology information. Nucleic Acids Res. 2021, 50, D20–D26. [Google Scholar] [CrossRef]
  37. Handy, S.M.; Deeds, J.R.; Ivanova, N.V.; Hebert, P.D.N.; Hanner, R.H.; Ormos, A.; Weigt, L.A.; Moore, M.M.; Yancy, H.F. A single-laboratory validated method for the generation of DNA barcodes for the identification of fish for regulatory compliance. J. AOAC Int. 2011, 94, 201–211. [Google Scholar] [CrossRef] [Green Version]
  38. Silva, A.J.; Hellberg, R.S. DNA-Based Techniques for Seafood Species Authentication. In Advances in Food and Nutrition Research; Toldrá, F., Ed.; Elsevier Inc.: Cambridge, MA, USA, 2021; Volume 95, pp. 207–255. ISBN 9780128215203. [Google Scholar]
  39. Fernandes, T.J.R.; Amaral, J.S.; Mafra, I. DNA Barcode Markers Applied to Seafood Authentication: An Updated Review. Crit. Rev. Food Sci. Nutr. 2021, 61, 3904–3935. [Google Scholar] [CrossRef]
  40. Wolf, C.; Burgener, M.; Hübner, P.; Lüthy, J. PCR-RFLP Analysis of Mitochondrial DNA: Differentiation of Fish Species. LWT-Food Sci. Technol. 2000, 33, 144–150. [Google Scholar] [CrossRef]
  41. Hellberg, R.S.R.; Morrissey, M.T. Advances in DNA-Based Techniques for the Detection of Seafood Species Substitution on the Commercial Market. JALA J. Assoc. Lab. Autom. 2011, 16, 308–321. [Google Scholar] [CrossRef]
  42. Wittwer, C.T. High-resolution DNA melting analysis: Advancements and limitations. Hum. Mutat. 2009, 30, 857–859. [Google Scholar] [CrossRef]
  43. Bio-Rad Laboratories, Inc. Precision Melt Analysis TM Software Instruction Manual; Bio-Rad Laboratories, Inc.: Hercules, CA, USA, 2019. [Google Scholar]
  44. Fernandes, T.J.; Costa, J.; Oliveira, M.B.P.; Mafra, I. Exploiting 16S rRNA gene for the detection and quantification of fish as a potential allergenic food: A comparison of two real-time PCR approaches. Food Chem. 2018, 245, 1034–1041. [Google Scholar] [CrossRef]
  45. Shi, R.; Xiong, X.; Huang, M.; Xu, W.; Li, Y.; Cao, M.; Xiong, X. High resolution melting (HRM) analysis of a 12S rRNA mini barcode as a novel approach for codfish species authentication in processed fish products. Eur. Food Res. Technol. 2020, 246, 891–899. [Google Scholar] [CrossRef]
  46. Bariche, M. Field Identification Guide to the Living Marine Resources of the Eastern and Southern Mediterranean. FAO Species Identification Guide for Fishery Purposes. 2012. Available online: http://www.fao.org/3/i1276b/i1276b00.htm (accessed on 19 April 2023).
  47. Chen, Y.; Liu, J.; Wu, R. A new record of blue-spotted seabream Pagrus caeruleostictus from Chinese coastal waters documented from morphology and DNA barcoding. Chin. J. Oceanol. Limnol. 2014, 33, 500–505. [Google Scholar] [CrossRef]
  48. Carpenter, K.E.; De Angelis, N. The Living Marine Resources of the Eastern Central Atlantic. In Bony Fishes Part 2 (Perciformes to Tetradontiformes) and Sea Turtles; Carpenter, K.E., De Angelis, N., Eds.; Food and Agriculture Organisation: Rome, Italy, 2016; Volume 4, pp. 1511–2350. ISBN 9789251064771. [Google Scholar]
  49. Geneious Prime 2023.0.3. Available online: https://www.geneious.com (accessed on 7 May 2023).
  50. Ivanova, N.V.; Zemlak, T.S.; Hanner, R.H.; Hebert, P.D.N. Universal primer cocktails for fish DNA barcoding. Mol. Ecol. Notes 2007, 7, 544–548. [Google Scholar] [CrossRef]
  51. Ceruso, M.; Mascolo, C.; De Luca, P.; Venuti, I.; Biffali, E.; Ambrosio, R.L.; Smaldone, G.; Sordino, P.; Pepe, T. Dentex dentex Frauds: Establishment of a New DNA Barcoding Marker. Foods 2021, 10, 580. [Google Scholar] [CrossRef]
  52. McGinnis, S.; Madden, T.L. BLAST: At the core of a powerful and diverse set of sequence analysis tools. Nucleic Acids Res. 2004, 32, 20–25. [Google Scholar] [CrossRef]
  53. Sievers, F.; Wilm, A.; Dineen, D.; Gibson, T.J.; Karplus, K.; Li, W.; Lopez, R.; McWilliam, H.; Remmert, M.; Söding, J.; et al. Fast, scalable generation of high-quality protein multiple sequence alignments using Clustal Omega. Mol. Syst. Biol. 2011, 7, 539. [Google Scholar] [CrossRef]
  54. Keskin, E.; Atar, H.H. DNA barcoding commercially important fish species of Turkey. Mol. Ecol. Resour. 2013, 13, 788–797. [Google Scholar] [CrossRef] [PubMed]
  55. Armani, A.; Guardone, L.; Castigliego, L.; D’Amico, P.; Messina, A.; Malandra, R.; Gianfaldoni, D.; Guidi, A. DNA and Mini-DNA barcoding for the identification of Porgies species (family Sparidae) of commercial interest on the international market. Food Control 2015, 50, 589–596. [Google Scholar] [CrossRef]
  56. Landi, M.; Dimech, M.; Arculeo, M.; Biondo, G.; Martins, R.; Carneiro, M.; Carvalho, G.R.; Brutto, S.L.; Costa, F. DNA Barcoding for Species Assignment: The Case of Mediterranean Marine Fishes. PLoS ONE 2014, 9, e106135. [Google Scholar] [CrossRef] [PubMed]
  57. Abbas, E.M.; Soliman, T.; El-Magd, M.A.; Farrag, M.M.; Ismail, R.F.; Kato, M. Phylogeny and DNA Barcoding of the Family Sparidae Inferred from Mitochondrial DNA of the Egyptian Waters. J. Fish. Aquat. Sci. 2017, 12, 73–81. [Google Scholar] [CrossRef] [Green Version]
  58. Ball, A.O.; Beal, M.G.; Chapman, R.W.; Sedberry, G.R. Population structure of red porgy, Pagrus pagrus, in the Atlantic Ocean. Mar. Biol. 2007, 150, 1321–1332. [Google Scholar] [CrossRef]
  59. Viret, A.; Tsaparis, D.; Tsigenopoulos, C.S.; Berrebi, P.; Sabatini, A.; Arculeo, M.; Fassatoui, C.; Magoulas, A.; Marengo, M.; Morales-Nin, B.; et al. Absence of spatial genetic structure in common dentex (Dentex dentex Linnaeus, 1758) in the Mediterranean Sea as evidenced by nuclear and mitochondrial molecular markers. PLoS ONE 2018, 13, e0203866. [Google Scholar] [CrossRef]
  60. Ceruso, M.; Mascolo, C.; Palma, G.; Anastasio, A.; Pepe, T.; Sordino, P. The complete mitochondrial genome of the common dentex, Dentex dentex (perciformes: Sparidae). Mitochondrial DNA Part B 2018, 3, 391–392. [Google Scholar] [CrossRef] [Green Version]
  61. Bargelloni, L.; Alarcon, J.A.; Alvarez, M.C.; Penzo, E.; Magoulas, A.; Reis, C.A.F.; Patarnello, T. Discord in the family Sparidae (Teleostei): Divergent phylogeographical patterns across the Atlantic-Mediterranean divide. J. Evol. Biol. 2003, 16, 1149–1158. [Google Scholar] [CrossRef] [Green Version]
  62. Dulčić, J.; Kraljevic, M. On the record of Red seabream Pagrus major (Temminck and Schlegel, 1843) (Osteichthyes: Sparidae) in the Adriatic Sea. Sci. Mar. 2007, 71, 15–17. [Google Scholar] [CrossRef] [Green Version]
  63. Saad, A.; Sabour, W.; Masri, M.; Barakat, I.; Capapé, C. On the Occurrence of Red Seabream Pagrus major (Osteichthyes: Sparidae) in the Eastern Mediterranean Sea, First Record from the Syrian Coast. Cah. Biol. Mar. 2022, 63, 89–92. [Google Scholar] [CrossRef]
  64. Rodriguez-Ezpeleta, N.; Mendibil, I.; Álvarez, P.; Cotano, U. Effect of Fish Sampling and Tissue Storage Conditions in DNA Quality. Rev. Investig. Mar. AZTI-Tecnalia 2013, 20, 77–87. [Google Scholar]
  65. Oosting, T.; Hilario, E.; Wellenreuther, M.; Ritchie, P.A. DNA degradation in fish: Practical solutions and guidelines to improve DNA preservation for genomic research. Ecol. Evol. 2020, 10, 8643–8651. [Google Scholar] [CrossRef] [PubMed]
  66. Fernandes, T.J.; Costa, J.; Oliveira, M.B.P.; Mafra, I. COI barcode-HRM as a novel approach for the discrimination of hake species. Fish. Res. 2018, 197, 50–59. [Google Scholar] [CrossRef]
  67. Morgan, J.A.T.; Welch, D.J.; Harry, A.V.; Street, R. A mitochondrial species identification assay for Australian blacktip sharks (Carcharhinus tilstoni, C. limbatus and C. amblyrhynchoides) using real-time PCR and high-resolution melt analysis. Mol. Ecol. Resour. 2011, 11, 813–819. [Google Scholar] [CrossRef]
  68. Buddhachat, K.; Attakitbancha, C.; Ritbamrung, O.; Chanthap, K.; Suwannapoom, C.; Nganvongpanit, K. Using mini-barcodes coupled with high resolution melting (minibar-HRM) method for species discrimination across Pangasianodon gigas, Pangasianodon hypophthalmus and Pangasius larnaudii. Aquaculture 2020, 530, 735773. [Google Scholar] [CrossRef]
  69. Zhao, Y.; Song, W.; Li, R.; Wang, C.; Mu, C. A high-resolution melting analysis method for the effective discrimination of three Sepia species. J. Consum. Prot. Food Saf. 2020, 15, 383–385. [Google Scholar] [CrossRef]
  70. Quintrel, M.; Jilberto, F.; Sepúlveda, M.; Marín, M.E.; Véliz, D.; Araneda, C.; Larraín, M.A. Development and Validation of a Multi-Locus PCR-HRM Method for Species Identification in Mytilus Genus with Food Authenticity Purposes. Foods 2021, 10, 1684. [Google Scholar] [CrossRef]
  71. Monteiro, C.S.; Deconinck, D.; Eljasik, P.; Sobczak, M.; Derycke, S.; Panicz, R.; Kane, N.; Mazloomrezaei, M.; Devlin, R.H.; Faria, M.A. A fast HRMA tool to authenticate eight salmonid species in commercial food products. Food Chem. Toxicol. 2021, 156, 112440. [Google Scholar] [CrossRef]
Figure 1. Sampling areas of Sparidae specimens (a) from Greek seas; Google Map; CM: Chios-Mytilene, CR: Crete, CY: Cyclades, DO: Dodecanese, IO: Ionian Sea, NA: North Aegean Sea, SG: Saronic Gulf, SP: Sporades, TG: Thermaikos Gulf; (b) the Mediterranean Sea according to FAO geographical classification of the Mediterranean Sea (area 37). Division captions: 37.1.1 Balearic; 37.1.2 Gulf of Lions; 37.1.3 Sardinia; 37.2.1 Adriatic; 37.2.2 Ionian; 37.3.1 Aegean; (c) eastern Atlantic Ocean according to FAO geographical classification; 34.1 Atlantic Ocean Northern Coastal.
Genes 14 01255 g001
Figure 2. Representative samples for the Sparidae family collected for this study. (a) Whole fish collected from Greek fisheries and Greek market. (b) Examples of frozen or filleted samples sold in the Greek market and cooked samples served at Greek restaurants.
Genes 14 01255 g002
Figure 3. Restriction Enzyme Fragment length polymorphism (RFLP) for mtDNA fragments from Pagrus and other Sparidae species: (a) cytb (583 bp) digested with Sau3AI (b) COI barcode (706 bp) digested with Hind III. (c) CR (1292 bp) digested with XbaI. Pc: P. caeruleostictus, Pp: P. pagrus, Pm: P. major, Pe: P. erythrinus, Dg: D. gibbosus, G: fish caught in Greek seas, I: imported in Greek markets. M1: 50 bp ladder, M2: 100 bp ladder, *: cooked samples.
Genes 14 01255 g003aGenes 14 01255 g003b
Figure 4. Restriction Enzyme Fragment length polymorphism (RFLP) for mtDNA fragments from Dentex sp. and other Sparidae species: COI barcode (706 bp) digested with HindIII. Dd: D. dentex, Da: D. angolensis, Dg: D. gibbosus, Pe: P. erythrinus, Pc: P. caeruleostictus, G: fish caught in Greek seas, S: Spain. M: 50 bp ladder, G: fish caught in Greek seas, I: imported in Greek markets, M: fish caught in the Mediterranean Sea. M1: 50 bp ladder, *: cooked samples.
Genes 14 01255 g004
Figure 5. Multiplex PCR reactions electrophoresis for the Sparidae species. (a) For the detection of P. pagrus; Pp: P. pagrus, Pm: P. major, Pc: P. caeruleostictus, Pe: P. erythrinus, Dg: D. gibbosus, (b). For the detection of D. dentex; Dd: D. dentex, Da: D. angolensis, Dg: D. gibbosus, Pe: P.s erythrinus, Pc: P. caeruleostictus. G: fish caught in Greek seas, I: imported in Greek markets, M: fish caught in the Mediterranean Sea, M2: 100 bp ladder, *: cooked/frozen samples.
Genes 14 01255 g005
Figure 6. HRM reactions for the discrimination of P. pagrus from Greek fisheries (reference cluster in red) compared from other Sparidae species sold in the Greek market with cytb fragment: (a) alignment of the tested fragment for all used species; (b) HRM analysis of fresh and frozen samples; (c) HRM analysis of fresh, frozen and cooked samples; Pp: P. pagrus, Pm: P. major, Pc: P. caeruleostictus, Pe: P. erythrinus, Dg: D. gibbosus, Ck: cooked samples, G: fish caught in Greek seas, I: imported in Greek markets, M: fish caught in the Mediterranean Sea.
Genes 14 01255 g006
Figure 7. HRM reactions for the discrimination of P. pagrus from Greek fisheries compared to other Sparidae species sold in the Greek market with 16s fragment: (a) alignment of the tested fragment for all used species; (b) HRM analysis of fresh and frozen samples; (c) HRM analysis of fresh, frozen and cooked samples; Pp: P. pagrus, Pm: P. major, Pc: P. caeruleostictus, Pe: P. erythrinus, Dg: D. gibbosus, Ck: cooked samples, G: fish caught in Greek seas, I: imported in Greek markets, M: fish caught in the Mediterranean Sea.
Genes 14 01255 g007
Figure 8. HRM reactions for the discrimination of D. dentex from Greek fisheries (reference cluster in pink) compared to other Sparidae species sold in the Greek market using the COI fragment: (a) alignment of the tested fragment for all used species; (b) HRM analysis of fresh, frozen and cooked samples; (c) HRM analysis of fresh and cooked samples; Dd: D. dentex, Dg: D. gibbosus, Da: D. angolensis, Pp: P. pagrus, Pm: P. major, Pc: P. caeruleostictus, Pe: P. erythrinus, Ck: cooked samples, G: fish caught in Greek seas, I: imported in Greek markets, M: fish caught in the Mediterranean Sea.
Genes 14 01255 g008
Figure 9. HRM reactions for the discrimination of D. dentex from Greek fisheries compared to other Sparidae species sold in the Greek market with 16s fragment: (a) alignment of the tested fragment for all used species; (b) HRM analysis of fresh, frozen and cooked samples; (c) HRM analysis of fresh and cooked samples; Dd: D. dentex, Dg: D. gibbosus, Da: D. angolensis, Pp: P. pagrus, Pm: P. major, Pc: P. caeruleostictus, Pe: P. erythrinus, Ck: cooked samples, G: fish caught in Greek seas, I: imported in Greek markets, M: fish caught in the Mediterranean Sea.
Genes 14 01255 g009
Table 1. List of samples used for molecular identification. CM: Chios-Mytilene, CR: Crete, CY: Cyclades, DO: Dodecanese, IO: Ionian Sea, NA: North Aegean Sea, SG: Saronic Gulf, SP: Sporades, TG: Thermaikos Gulf, ME: Mediterranean Sea, IMP: Imported in the Greek fish market, AQ: Aquaculture products, LFT: lagoon fish traps. Fish were either fished or collected directly from fishermen (FC), local fish markets (FM), supermarkets (SM) or restaurants (RE).
SpeciesSample
Id
Greek Seas/Other
Region
FAO
Region
Total
Number
of
Samples
FC
Out of Total
FM/SM
Out of Total
RE
Out of Total
Frozen/
Filleted Out of Total
Cooked/
Out of Total
P. pagrusPpGCY37.3.11212 2
(Pp)PpGSP37.3.125241 13
PpGSG37.3.11110 1 2
PpGDO37.3.11082 2
PpGCR37.3.1321 2
PpGTG37.3.111 11
PpGCM37.3.111 1
PpGIO37.2.288 12
PpIIMP34.110 10 93
PpMME37.1.133 3
P. majorPmAQ 16 14222
(Pm)PmLFT 3 3 2
PmCR37.1.111 11
PmSP37.1.111 11
P. caeruleostictus
(Pc)
PcIMP 1 1 11
P. erythrinus
(Pe)
PeSP37.1.1211 2
PeDO37.1.1843 3
PeIIMP34.11 1 11
D. dentexDdGCY37.3.16411 2
(Dd)DdGSP37.3.1321 1
DdGSG37.3.17511 2
DdGDO37.3.122 2
DdGCR37.3.166 4
DdGΝA37.3.144 2
DdGIO37.2.22929 6
DdMME37.1.133 3
D. gibbosusDgSP 211 11
(Dg)DgCY 312 1
DgIO 211 21
DgSG 2 211
DgIIMP34.13 3 32
D. angolensis
(Da)
DaIMP34.12 2 1
Table 2. Primers used for PCR amplifications and sequencing of Sparidae mtDNA.
Name PrimerTm °C
COIppTCAACCAACCATAAAGACATCGGCAC63.2primers from [37] modified in this study
COIUnRTAGACTTCTGGGTGGCCRAARAAYCA64.0primers from [50]
cytbF1CATGCTAACGGAGCATCCTTCT60.3This study
cytbURGCAAATAGGAARTATCAYTCRGG58.0This study
16sF2AGTATGRGCGACAGAAAAGGA56.9This study
16SR2GATTCGGTGGTTGGTCCGTTC61.8This study
cytbF2CATATTAAACCCGAATGATATTT51.7This study
CRRGGGAAGAAACAGCATATTATG54This study
COI4FUCTAGGCGACGACCAGATTTATAATGT60.8This study
COIR3ACTCCTGAGGAGGCAAGTAGG61.8This study
COIR4UGTTAGGTCTACTGATGCTCCTGC62.4This study
COIR5GACTGGCAGGGACAGAAGG61.0This study
COIIFCGCCTAAACCAAACAGCATTC58.4This study
ATP6RGTAAAGGTRTAAGGGAGGAG55.5This study
ND2FdCACCCTAGCTATCCTCCCCCTCATAGC66.9primers from [51]
ND2RdAATAACTTCGGGGAGTCACGAGTGTAGG65.7primers from [51]
HRMCOIF1AATGTTATTGTTACAGCACACGC57.1This study
HRMCOIR1GCTATGTCAGGGGCACCAA58.8This study
HRMcytbF2GCAGGCGTAATTATTCTATTAAC55.3This study
HRMcytbR1GGTTTAATATGAGGGGGTGTAAC58.9This study
HRM16sF1GTAAAGATCATAATTAACCCAAG53.5This study
HRM16sR1GTTTGCAGCGGATAGTCTGATAT58.9This study
Table 3. Primers used for PCR amplification and sequencing of Sparidae mtDNA. Positions are indicated.
GENE Forward PrimerReverse PrimerAmplicon LengthAnnealing T/°CRestriction
Enzyme
COICOIppCOIUnR70654HindIII or Sau3AI
cytbcytbF1cytbUR58354Sau3AI
CRcytbF2CRR129253XbaI
Table 4. Primers used for multiplex PCR amplification of mtDNA fragments of Sparidae.
SpeciesForward
Primer
Reverse
Primer
Length
(bp)
Annealing T °C
P. pagrus vs. other Sparidae speciesCOI4FUCOIR546157
COI4FUCOI4RU295
COI4FUCOIR3211
D. dentex vs. other Sparidae speciesCOIIFATP6R67352
cytbF1cytbUR583
COI4FUCOI4RU295
ND2FdND2Rd249
Table 5. Primers used for HRM analysis of Sparidae mtDNA fragments.
GENEForward
Primer
Reverse
Primer
Fragment Length (bp)Annealing
T °C
COIHRMCOIF1HRMCOIR1116 53
cytbHRMcytbF2HRMcytbR1113 52
16sHRM16sF1HRM16sR1156 53
Disclaimer/Publisher’s Note: The statements, opinions and data contained in all publications are solely those of the individual author(s) and contributor(s) and not of MDPI and/or the editor(s). MDPI and/or the editor(s) disclaim responsibility for any injury to people or property resulting from any ideas, methods, instructions or products referred to in the content.

