Article

Deciphering the Immunostimulatory Effects of β-Glucan on a Rainbow Trout (Oncorhynchus mykiss) Macrophage-like Cell Line (RTS11) by Whole Transcriptome Analysis

1
Scottish Fish Immunology Research Centre, School of Biological Sciences, University of Aberdeen, Aberdeen AB24 2TZ, UK
2
Skretting Aquaculture Innovation, Sjøhagen 3, 4016 Stavanger, Norway
*
Author to whom correspondence should be addressed.
Genes 2023, 14(6), 1261; https://doi.org/10.3390/genes14061261
Submission received: 20 February 2023 / Revised: 17 May 2023 / Accepted: 10 June 2023 / Published: 14 June 2023
(This article belongs to the Special Issue Epigenetic Regulation in Teleost Development)

Abstract

:
β-glucans are a commonly used immunostimulant/prebiotic in many aquaculture applications for boosting the immune status in fish. However, the method of action as an immunostimulant has not been fully deciphered. To determine the immunomodulatory effects of β-glucans on the innate immune response, we stimulated the rainbow trout spleen macrophage-like cell line (RTS11) with β-1,3/1,6-glucans for 4 h. This study uses a whole transcriptomic approach to analyse the immunomodulatory properties of β-glucans. Several proinflammatory pathways were found to be enriched after stimulation, demonstrating the immunomodulatory effects of β-glucan supplementation. Several pathways relating to responses to bacteria were also found to be enriched. This study clearly demonstrates the immunomodulatory effects of the supplementation of β-glucans within an aquaculture setting and further validates the use of cell lines as predictive models to interpret the responses caused by dietary intervention.

1. Introduction

With the global population rising, increased food sources are needed to match the demand for dietary protein sources [1]. Aquaculture is the fastest-growing protein source and has a lower carbon footprint per Kg protein produced compared to traditional terrestrial meat farming practices [2]. With this increased production, there are ongoing risks involved with disease outbreaks [3]. Many bacterial pathogens are controlled by vaccination, but where no vaccines are available, or for newly emerging pathogens, the antibiotics used may lead to antimicrobial resistance [4]. As a part of health management in aquaculture, functional feeds are routinely used with a desire to improve fish health and immune competence to enable better outcomes following pathogenic challenges during production. Functional feeds can contain several different components that can modulate the immune response such as prebiotics, probiotics, immunostimulants, and other micronutrients [5].
β-glucans are well-studied immunostimulants/prebiotics that offer the host improved protection against several diseases such as Aeromonas salmonicida and viral hemorrhagic septicemia virus (VHSV) [6,7,8,9,10]. β-glucans are complex polysaccharides, made up of repeating units of glucose linked by glycosidic bonds, and are sourced from the cell walls of plants, yeast, or fungi. β-glucan’s immunostimulatory properties are well characterised in fish, with β-glucan supplementation causing the upregulation of proinflammatory genes such as IL-1β, TNFα, and COX-2 [7,10,11,12]. However, to date, there is little information regarding the mechanisms of action of these important molecules in fish [13,14]. Several studies have suggested there may be a slight improvement in immune tolerance after treating with β-glucans before bacterial challenges [6,10,15]. However, the relationship between β-glucans and immune tolerance has not yet been fully explored. Recent studies using whole transcriptome analysis in both rainbow trout (Oncorhynchus mykiss) [9] and common carp (Cyprinus carpio) [16] have identified key molecular pathways that are modulated by β-glucan supplementation. A recent study in rainbow trout examined the impact of a β-glucan diet on fish that were infected with A. salmonicida, demonstrating that several immunostimulatory pathways were upregulated to a greater extent in fish fed with the β-glucan-supplemented diet after infection, with complement and coagulation, PI3K-AKT signalling, platelet activation, and T-cell receptor signalling pathways all enriched in the fish fed the β-glucan-supplemented diet [9]. In carp head kidney macrophages, C-type lectin type 4 was suggested as a novel β-glucan receptor, potentially leading to the direct activation of the C-type lectin signalling pathway. Other pathways relating to the proinflammatory response; cytokine-cytokine receptor interactions, apoptosis, NOD-like receptor signalling pathway, and ECM–receptor interaction were also upregulated in this species [16].
Innate immune cells recognise pathogen-associated molecular patterns (PAMPS) through pathogen recognition receptors (PRRs) which include C-type lectins (CLRs) and Toll-like receptors (TLRs), which activate defence mechanisms. In humans, macrophages express the CLRs: macrophage inducible C-type “calcium-dependent” lectin, CLEC4E (Mincle), macrophage C-type lectin (MCL) (CLEC4D), macrophage mannose receptor (MMR, CD206), and Dectins 1 (CLEC7A) and 2 (CLEC6A) [17,18]. CLRs have been characterised in salmonids, with CLEC4T being highly expressed in monocytes/macrophages in rainbow trout [19]. A study in carp head kidney macrophages by Petit et al., 2019, identified two C-type lectin domain encoding genes—C-type lectin family 4 member C (CLEC4C) and salmon C-type lectin A (SCLRA)—as candidate receptors for β-glucan binding [16]. M1 macrophages are typically the first line of defence against intracellular pathogens and promote proinflammatory signalling [20]. As a result, they play a key role in the recognition of molecules in the salmonid gut-associated lymphoid tissue (GALT) and are found in high numbers in the salmonid intestine [20,21]. M2 macrophages are involved in parasite parasitic infections and tissue repair [20]. In salmonids, there is a lack of cell lines specific to an individual immune cell type [22]. Cellular models are needed to understand the mechanisms of action and provide a fast-predictive model of immune function upon stimulation with functional ingredients.
In this study, the direct effect on cells for β-glucan is examined using the RTS11 (rainbow trout spleen macrophage-like 11) cell line [23], which has been used in many studies to examine immune responses [24,25,26]. The RTS11 cell line was kindly donated as a gift to researchers at the Scottish Fish Immunology Research Centre and has been kept in liquid nitrogen (N2) for long-term storage. The RTS11 cell line is characterised as a monocyte/macrophage-like cell line due to the presence of two distinct cell populations: small non-adherent cells and larger granular cells that are thought to be macrophages [23]. Β-1,3/1,6-glucans (M-glucans) was used due to its known ability to modulate RTS11 cells [10,12] and its commercial importance within aquaculture as a source of an immunostimulant in functional diets. Previous studies by Ordas et al. have shown that RTS11 cells are responsive to β-glucan stimulation after 24 h from concentrations of 30 to 120 μg/mL after 24 h, whilst the RTgutGC cell line only demonstrated an innate immune response when stimulated with the 120 μg/mL concentration after 24 h. The previous study by Porter et al. demonstrates that the duration of stimulation with M-glucans on RTS11 is effective after 4 h in producing an innate immune response, with key innate immune cytokine genes (interleukin-1β, interleukin-8, tumour necrosis factor-α, and serum amyloid A) being significantly upregulated, and it is a timepoint that allows for comparisons to be made against primary gut leucocyte cultures. To investigate the whole transcriptional response to β-glucan, RNA-seq followed by gene set enrichment was carried out, which identified several proinflammatory and CLR signalling pathways enriched in the RTS11 cell line. This study shows that macrophages stimulated with β-glucans can trigger a distinct proinflammatory and antimicrobial profile within the innate immune response within macrophages.

2. Methodology

2.1. In Vitro Cell Culture

RTS11 cells were cultured in flasks (75 cm2) at 20 °C in growth media (Leibovitz L-15 media + 30% FBS + 1% Penicillin/Streptomycin (P/S)). RTS11 cells were grown up from stocks stored in liquid nitrogen which showed similar phenotypes as those described by Ganassin and Bols [23] and had a passage number of 11. Before the stimulation, RTS11 cells were collected in two parts; the first step was to collect the media containing detached cells, after which 5 mL of fresh growth media was added to the flask and was used to aspirate the attached cells from the flask; this was then added to the media containing the detached cells. The cell suspension was centrifuged at 500× g for 10 min at 4 °C before being resuspended in fresh stimulation media (Leibovitz L-15 media + 1% FBS + 1% P/S). Cell concentrations were adjusted to 5 × 10⁵ cells/mL before 1 mL was added to 24 well plates. Stimulants were added as described below.

2.2. Stimulation with β-Glucans

The cells were stimulated using 100 µg/mL of M-glucans (Biotec, Norway) for 4 h. M-glucans is a commercially available form of β-glucans comprising β-1,3/1,6-glucans from yeast. Fresh M-glucan stock solutions were made from a powdered version, suspended in L-15 media, and stored at 4 °C until use. Stock solutions were then added to wells containing cells diluted in media to give the working solutions. Unstimulated RTS11 cells were used as a negative control. All experiments were performed in a randomised design in 24-well plates with a single well per sample, and the samples were treated independently through the entire protocol (n = 4).

2.3. RNA Extraction

RNA was extracted from cells in individual wells using 750 µL of TRI Reagent (Sigma, UK), following the manufacturer’s instructions. The RNA pellet was washed using 80% ethanol, dissolved in RNase-free water, and stored at −80 °C until use. The quality control of the samples was determined by a nanodrop spectrophotometer for the quantity and Agilent bioanalyser 2100 to determine the RNA integrity, where samples were ensured to be above 7.0 RIN (9.5–9.8 in all samples) before being used for library generation and sequencing.

2.4. Transcriptional Analysis: RNA-seq

RNA samples were enriched for Poly A+ RNA and used to generate True seq libraries (library preparation and sequencing was performed by Novogene Ltd., Cambridge, UK; sequencing was performed on the Novaseq platform with paired end sequencing PE150. The samples were sequenced at a depth of 40 M reads per sample, with a Q30 score of above 94%. All raw sequences have been deposited in the ArrayExpress repository under accession number E-MTAB-12643. RNA-seq datasets were processed using the Nextflow (v21.04.0) [27] NFcore RNAseq pipeline (v3.2) [28], with the option ”aligner star_RSEM” [29,30] and the ENSEMBL Rapid Release genome and annotation for rainbow trout (USDA_OmykA_1.1 (GCA_013265735.3)). Raw reads were trimmed within the NFcore pipeline using Trim Galore, with ~0.2% of all base pairs being removed. Raw counts were generated using the subread feature_counts [31]. The bioinformatic quality control of mapped reads and raw counts was carried out using MultiQC through graphical representation [32]. There were 64,944 rainbow trout transcripts identified in total with ENSEMBL gene ID annotation after the NFcore pipeline. At the time of writing, the ENSEMBL rapid release genomes were not annotated; hence, further annotation of the genes was required. These genes were used as the input to perform the DESeq2 package (v3.15) in R (v4.1.0) [33] to determine differentially expressed transcripts (DEGs) compared to unstimulated controls. During DESeq2 analysis, one control sample (RTS11_04) was removed from further downstream analysis (n = 3 for control samples). All in silico-derived proteins were subjected to BlastP analysis against the ENSEMBL genes of Zebrafish and Humans to generate Human genome nomenclature committee IDs (HGNC IDs) (official gene symbols) for each protein-coding gene. Genes were considered differentially expressed if they met the following criteria: padj < 0.05; log2fold change ≥ 1 = upregulated or ≤ −1 = downregulated (Supplementary Table S1). For gene set enrichment, Gene Ontology (GO) analysis and Kyoto Encyclopaedia of Genes and Genomes (KEGG) pathway analysis were performed using DEGs using the web interface DAVID [34,35]. Only protein-coding genes with unique HGNC gene identifiers were subject to GO and KEGG pathway analysis. The GO terms and KEGG pathways predicted were based on the HGNCs inputted into DAVID without using expression values. Upregulated DEGs and downregulated DEGs were inputted into DAVID separately so that the effect on the pathways was able to be identified, as no expression values are used. The visualisation of DEGs was carried out using a principal component analysis plot and a volcano plot in R (v4.1.0) using the ggplot2 package (v3.3.6). For the visualisation of enriched GO terms, a dotplot was generated using ggplot2 (v3.3.6). For KEGG pathway analysis, the web service Pathview was used to visualise pathways with DEGs imposed on top [36].

3. Results

After sequencing, approximately 40 million paired-end reads were generated per sample (Min = 39.0 million reads, Max = 57.7 million reads). The Q20 and Q30 values of all samples were approximately 98% and 94%, respectively, and the GC content was approximately 49–51%. For whole transcription analysis, the ENSEMBL genomes for rainbow trout (USDA_OmykA_1.1 (GCA_013265735.3) had 48,326 unique ENSEMBL identifiers. At the time of writing, these identifiers were not fully annotated; therefore, BlastP was used to quantify the rainbow trout proteome against both the human and zebrafish proteomes. A total of 46,065 genes were annotated in rainbow trout, with 47,330 and 48,079 genes mapping to human and zebrafish in silico-derived proteomes, respectively. HGNC identifiers for all genes mapped to humans were manually extracted, with these identifiers being used for downstream gene set enrichment by gene ontology and KEGG pathway enrichment analysis.

3.1. Identification of Gene Expression Patterns in RTS11

To visualise the transcriptome response to the β-glucan, a principal component analysis (PCA) plot was performed on RTS11 genes, which revealed the clustering of M-glucan-stimulated samples and unstimulated controls, showing a 95% variance between the two clusters (Figure 1A). A total of 28,644 genes were identified after filtering to remove genes where there were <10 counts. These genes were subjected to differential expression analysis (DESeq2), which resulted in the identification of 1635 genes with increased expression and 1057 genes with decreased expression following incubation with M-glucans (Figure 1B). The top 20 up- and downregulated protein-coding genes are presented in Table 1. The most upregulated gene encoded the nuclear receptor subfamily 4 group A member 3 (NR4A3), being upregulated 10.8 log2 fold change, respectively. A key inflammatory chemokine gene, CXCL2 (C-X-C motif chemokine ligand 2), and the proinflammatory gene, TNFα (tumour necrosis factor-α), were upregulated 6.6 and 6-log2 fold change, respectively. The most downregulated gene was the gene encoding for the zinc finger BED-type containing 4 (ZBED4) protein, which was downregulated 4.6-log2 fold change.
Of the RTS11 DEGs, 1635 upregulated and 1057 downregulated genes were represented by 1093 and 866 annotated protein coding genes annotated for HGNC identifiers. Prior to gene set enrichment, using these identifiers, HGNC duplicates were removed to ensure that the GO and KEGG pathway analyses were not affected by overrepresentation.

3.2. Gene Set Enrichment Using Gene Ontology

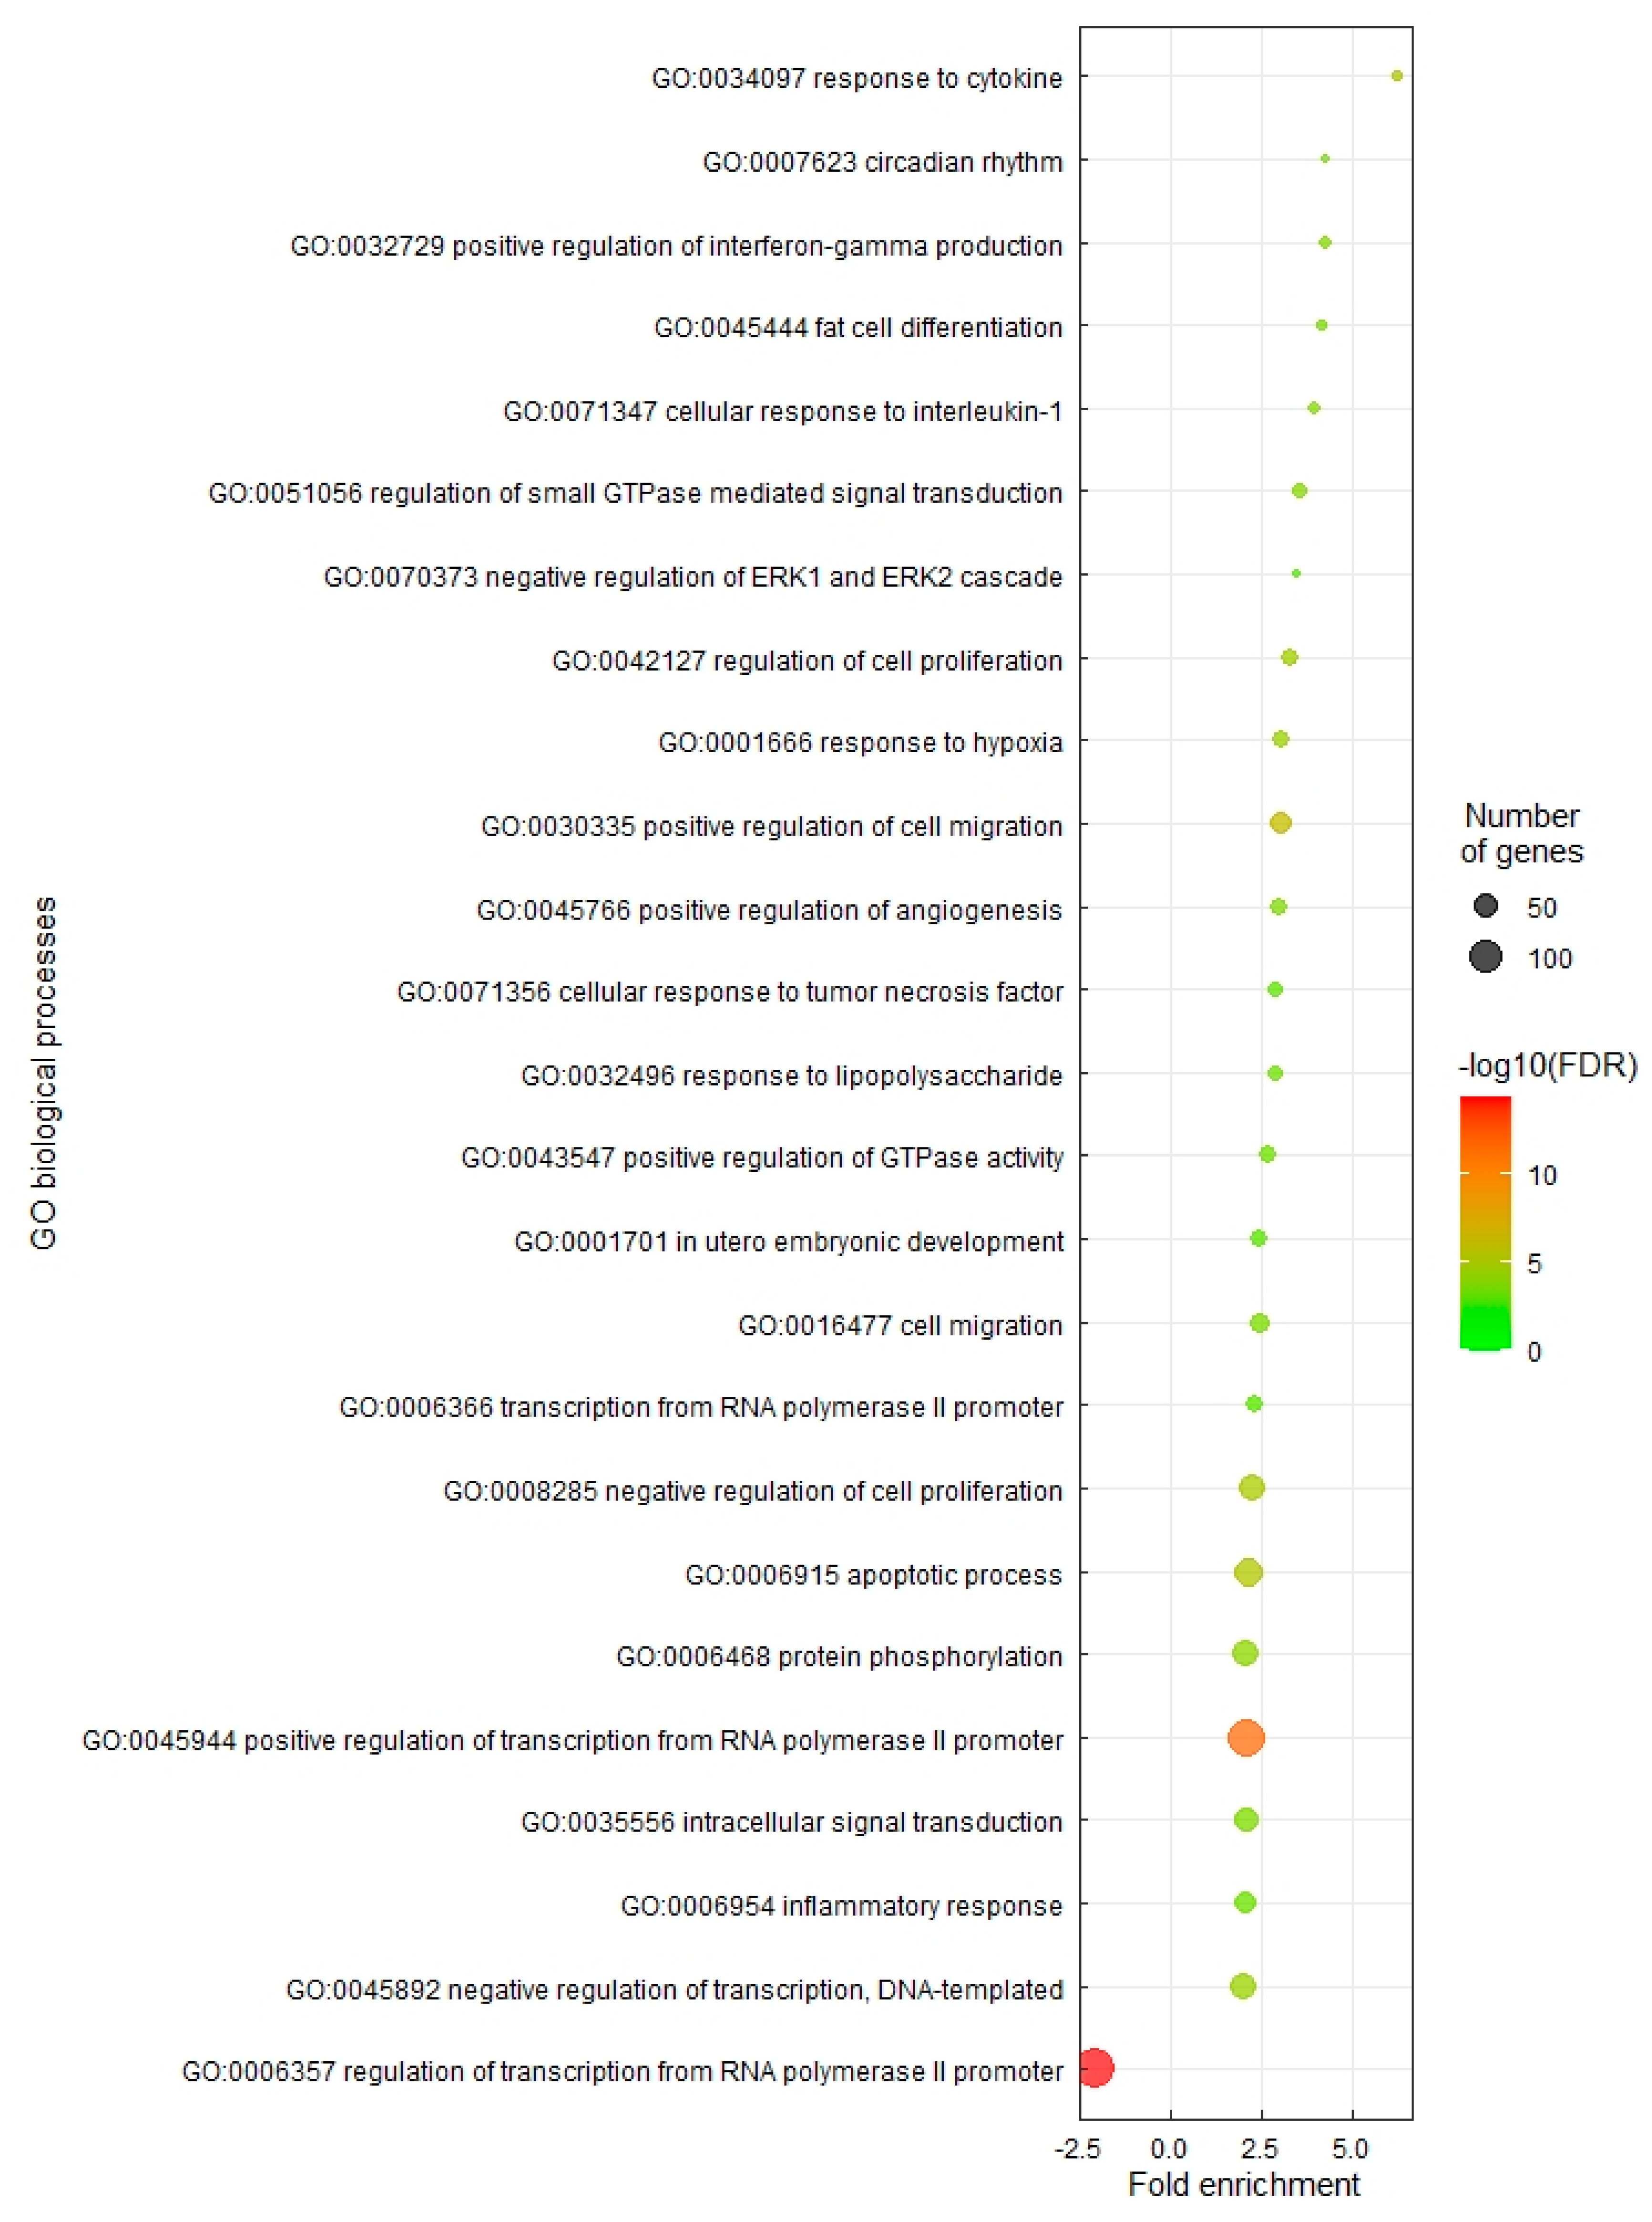
The biological interpretation of transcriptomic changes in RTS11 following stimulation with M-glucans was performed using gene set enrichment. For GO enrichment, 25 Biological Processes terms were significantly enriched in RTS11 cells stimulated with M-glucans for 4 h (Figure 2). Many biological processes that were upregulated were related to the proinflammatory response; the GO:0034097 response to cytokine (6.25-fold change, 17/51 genes), the GO:0071347 cellular response to interleukin 1 (3.95-fold change, 19/90 genes); the GO:0071356 cellular response to tumour necrosis factor (TNF) (2.88-fold enrichment, 22/143 genes); the GO:0032496 response to lipopolysaccharide (2.88-fold enrichment, 24/156 genes); and the GO:0006954 inflammatory response (2.05-fold enrichment, 45/411 genes). For the downregulated DEGs, only a single GO biological process was significantly enriched: the GO term GO:0006357 regulation of transcription from RNA polymerase II promoters, which was enriched by 2.01-fold in this group. The GO terms relating to cellular components and molecular function can be found in Supplementary Tables S2 and S3.
Gene ontology of the proinflammatory response to M-glucan supplementation: To further analyse the proinflammatory response being enriched, the two most upregulated pathways relating to the proinflammatory response, “response to cytokines” and “response to interleukin-1”, were selected to examine if there were differential responses between gene copies. For the GO “response to cytokines”, Fos Proto-Oncogene (FOS), FOS ligand-1 (FOSL1), and Nuclear Factor Kappa B Subunit 2 (NFKB2) show an upregulation of 4.65, 5.06, and 2.42-log2 fold change, respectively, as shown in Table 2. The GO term “response to interleukin-1” was enriched by 3.96-fold, with the key genes CD40, prostaglandin I2 Synthase (PTGIS), Cys-Cys motif (C-C) chemokine ligand 20 (CCL20), CCL8, and CCL4 showing upregulations of 1.34, 2.85, 1.70, 2.65, and 3.31 log2 fold change, respectively, as shown in Table 3. Further analysis showing all rainbow trout paralogs of each significantly upregulated gene is found in Supplementary Table S4 (response to cytokine) and Table S5 (response to interleukin 1).

3.3. KEGG Pathway Analysis

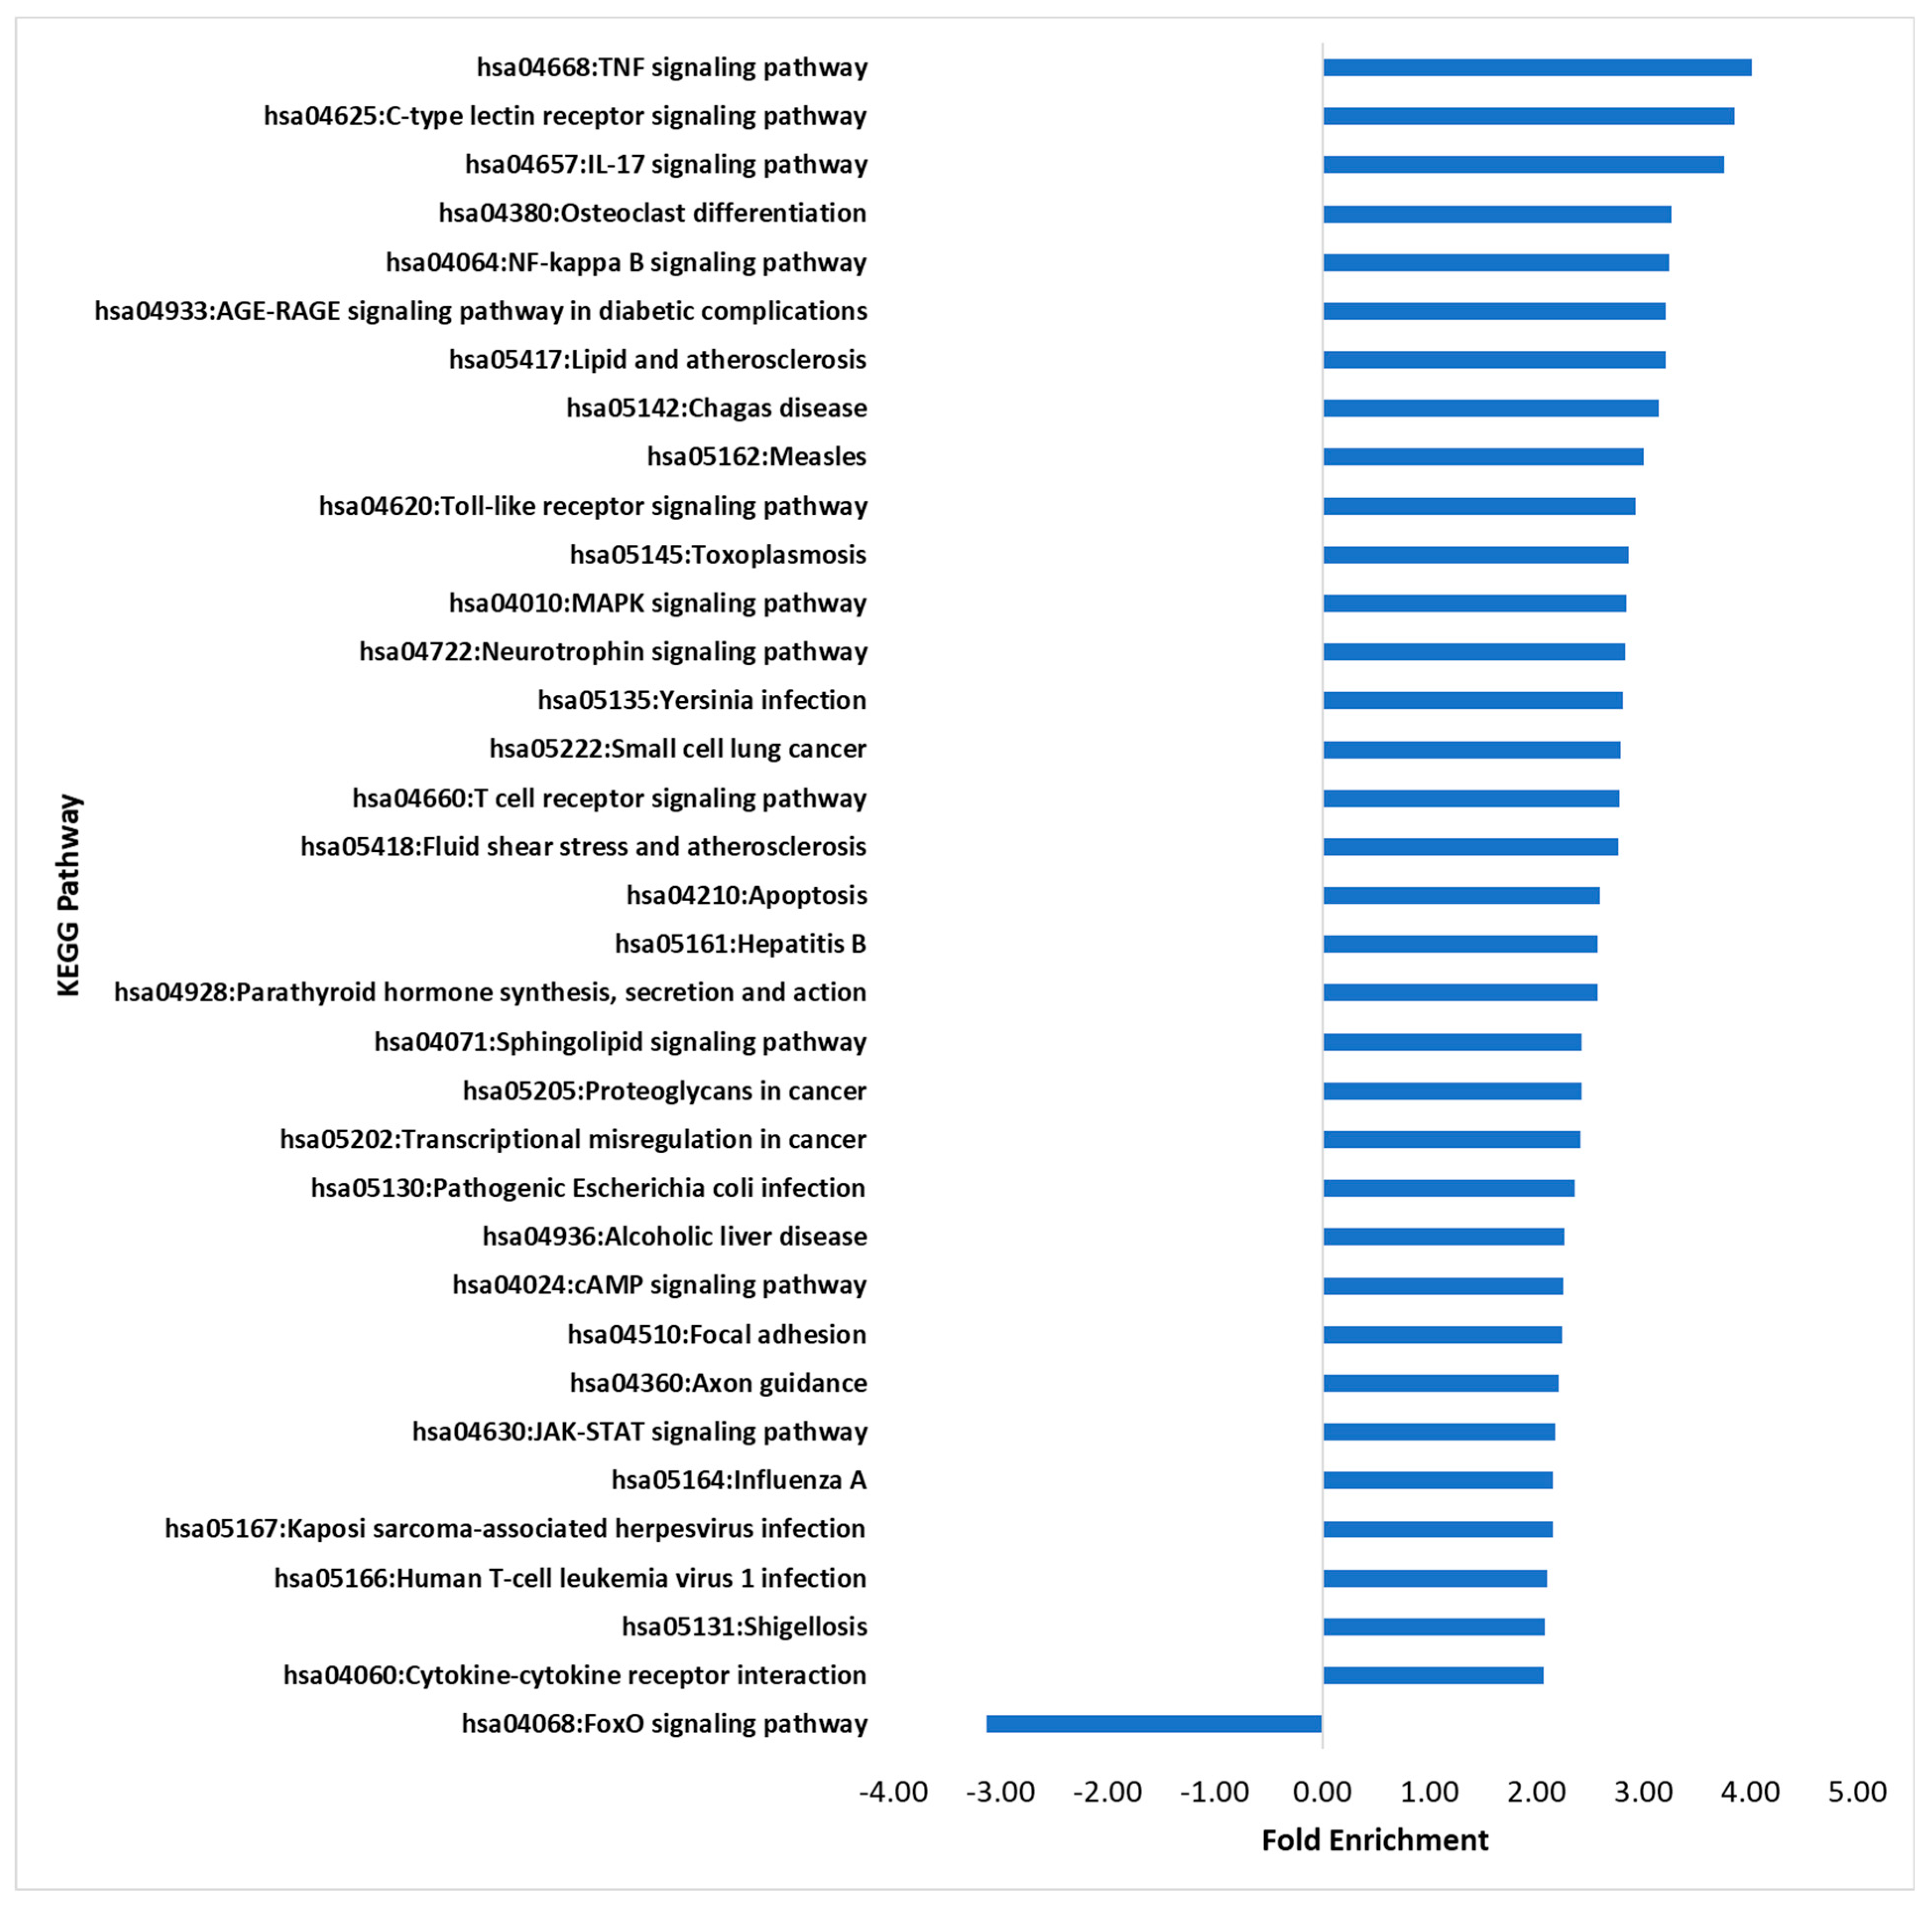
KEGG pathway analysis was carried out to detect significantly enriched pathways helping infer functional responses to the M-glucan. Nine pathways were enriched (Figure 3), with those relating to the immune response or inflammation being identified; these pathways included TNF (4.0-fold, 28/112 genes), IL-17 signalling (3.8-fold, 22/94 genes), T-cell receptor signalling (2.8-fold. 18/104 genes), and NF-κB signalling (3.2-fold, 21/104 genes). The pathways involved in pathogen recognition were enriched with the C-type lectin signalling (3.9-fold, 25/104 genes) and toll-like receptor signalling (2.93-fold, 19/104 genes), both being significantly upregulated. The pathways modulated in response to bacterial pathogens were also enriched, such as Yersinia infection (2.8-fold, 24/137 genes), pathogenic Escherichia coli infection (2.36-fold, 29/197 genes), and Shigellosis (2.1-fold, 32/247 genes). Only one pathway was found to be downregulated significantly, the FoxO signalling pathway (−3.13-fold, 16/131 genes).
To further assess the extent to which the immune response was being enriched by M-glucans, three specific pathways were selected.
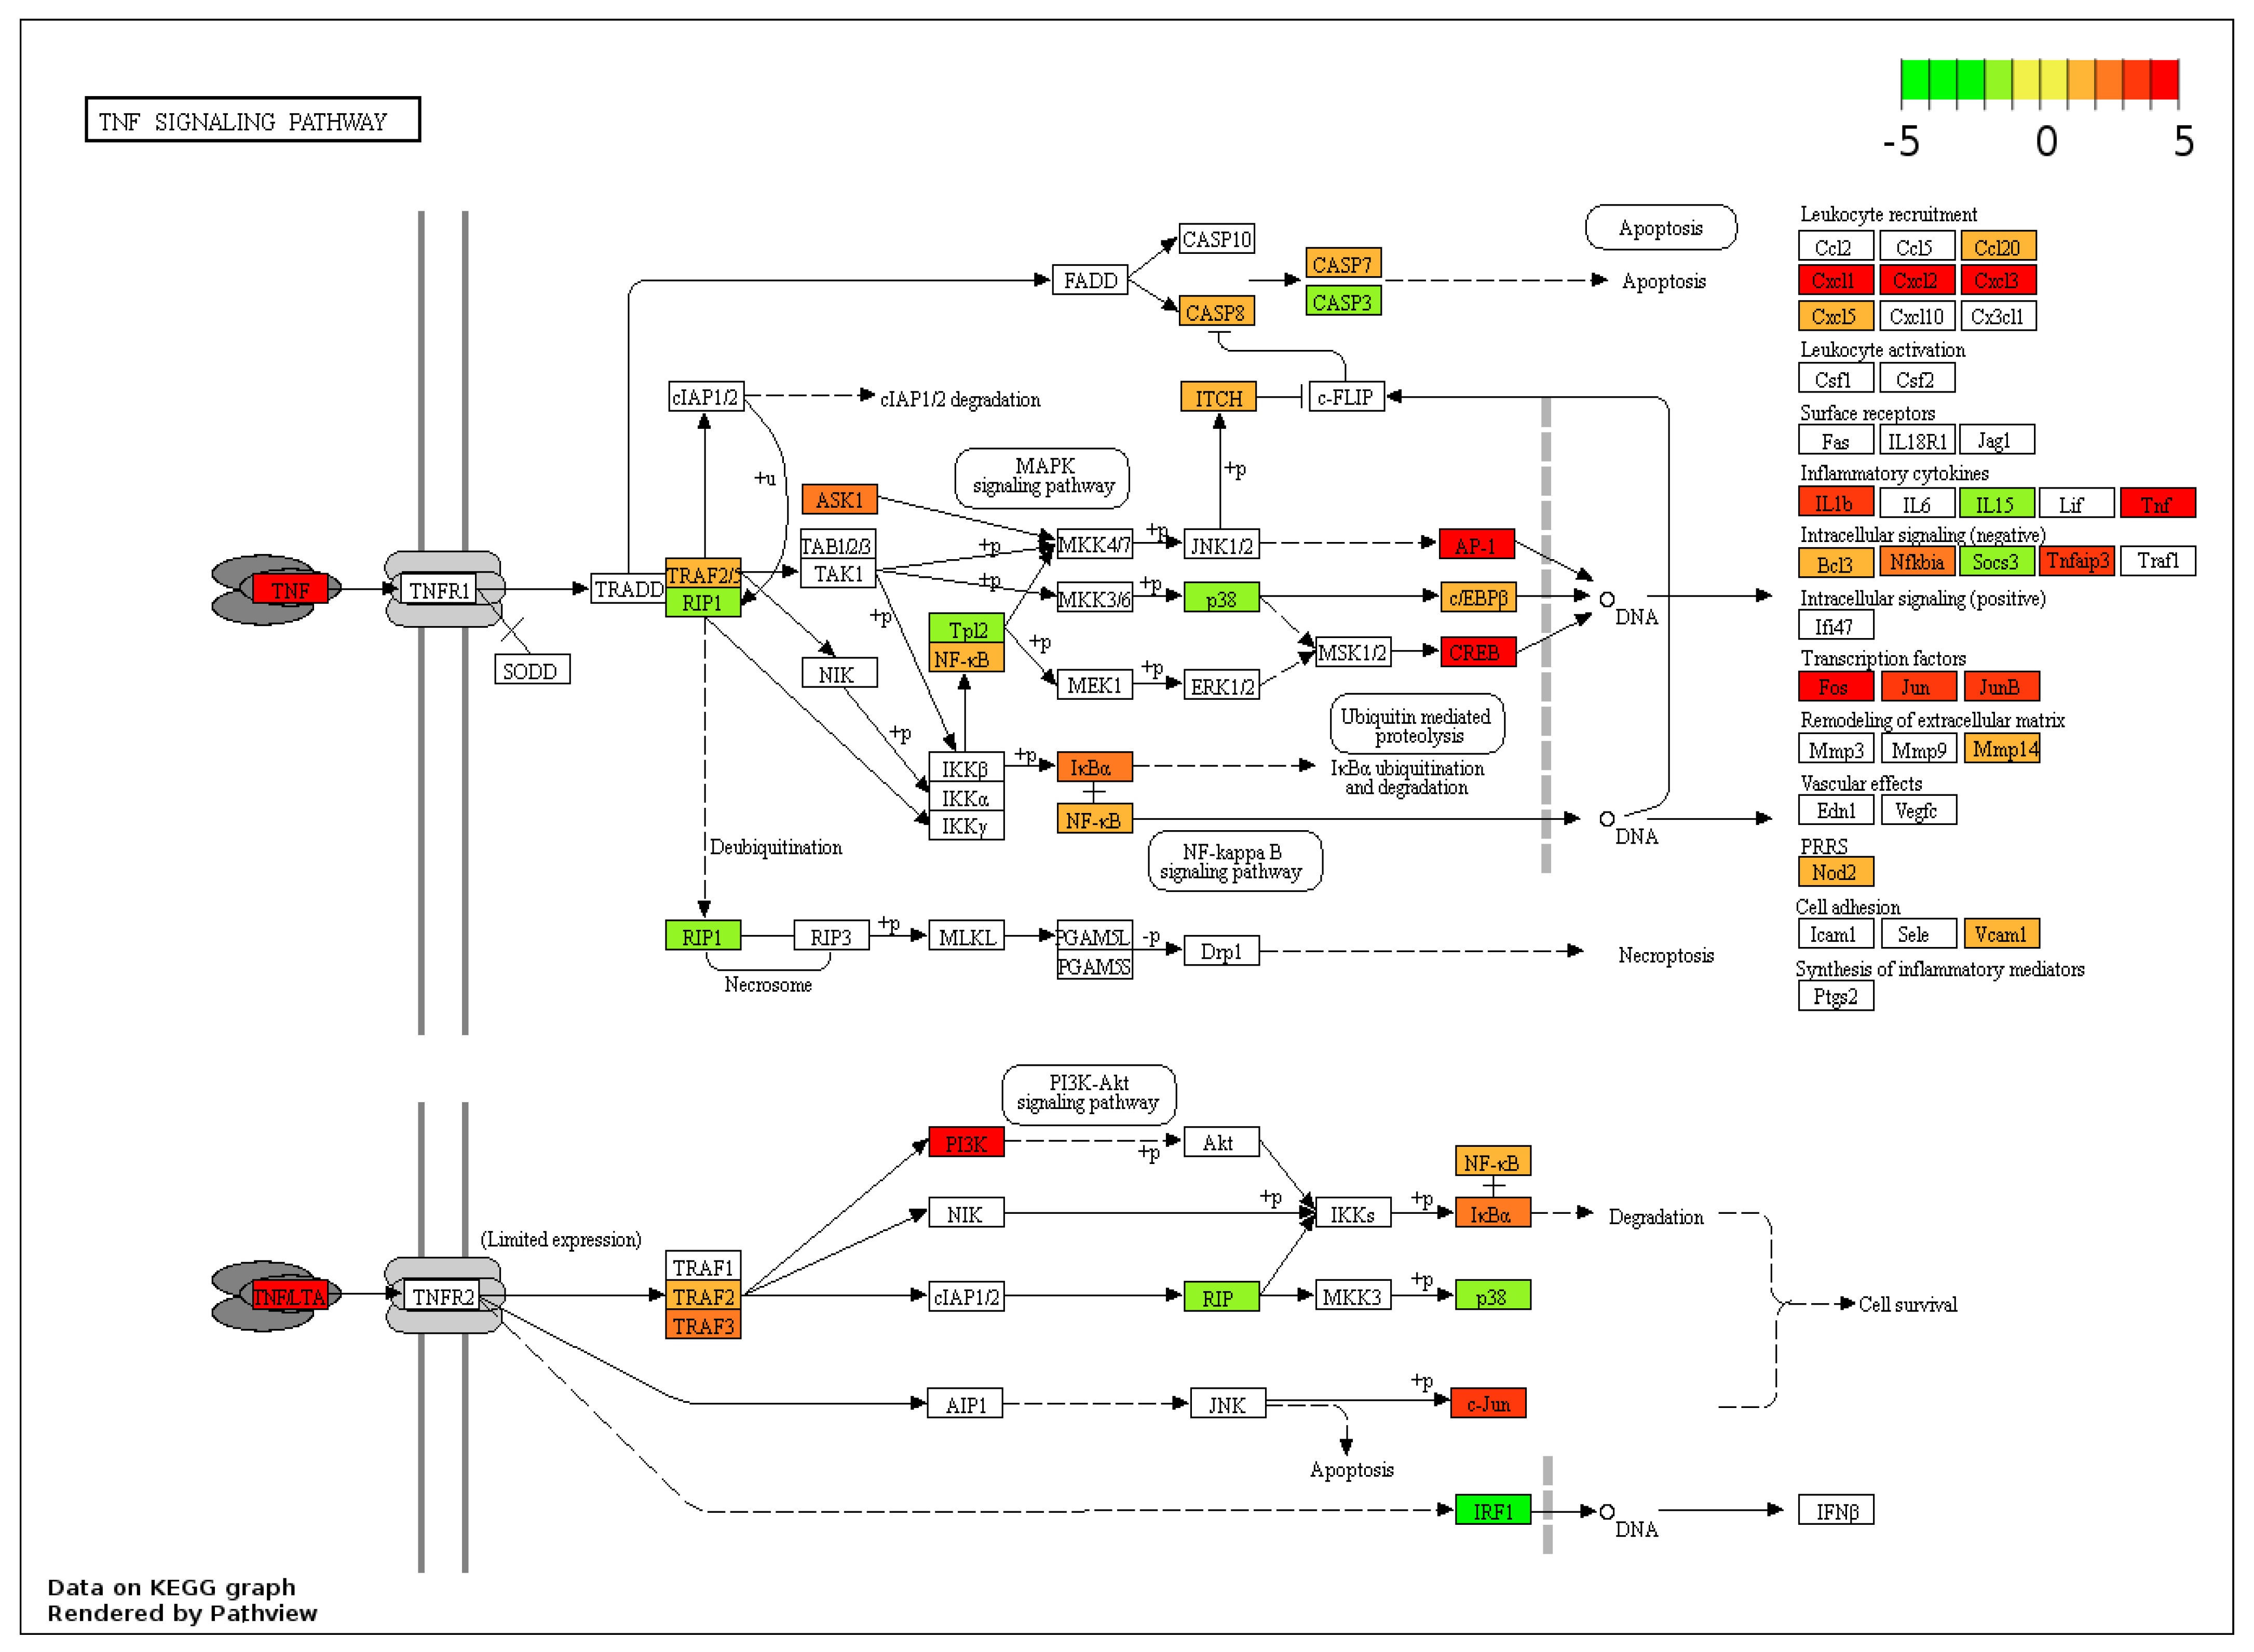
The “TNF signalling pathway” is a key anti-bacterial pathway induced by the chemokine tumour necrosis factor-α (TNFα), with downstream effects dependent on the cell type (Figure 4). The KEGG pathway map for the TNF signalling pathway was enriched by 4-fold, with 28 out of 112 genes showing significant upregulation, illustrating that many genes modulated within this pathway, including cytokines (TNFα and interleukin 1-β (IL1β)), genes involved with caspase (CASP) production (CASP7 and CASP8), genes involved in leucocyte recruitment (CCL20, Cys-X-Cys motif (CXC) chemokine ligand (CXCL)11, 12, 13, 14, and 15), and genes involved with transcription factors (FOS, jun proto-oncogene (JUN), and junb proto-oncogene (JUNB)), were all upregulated.
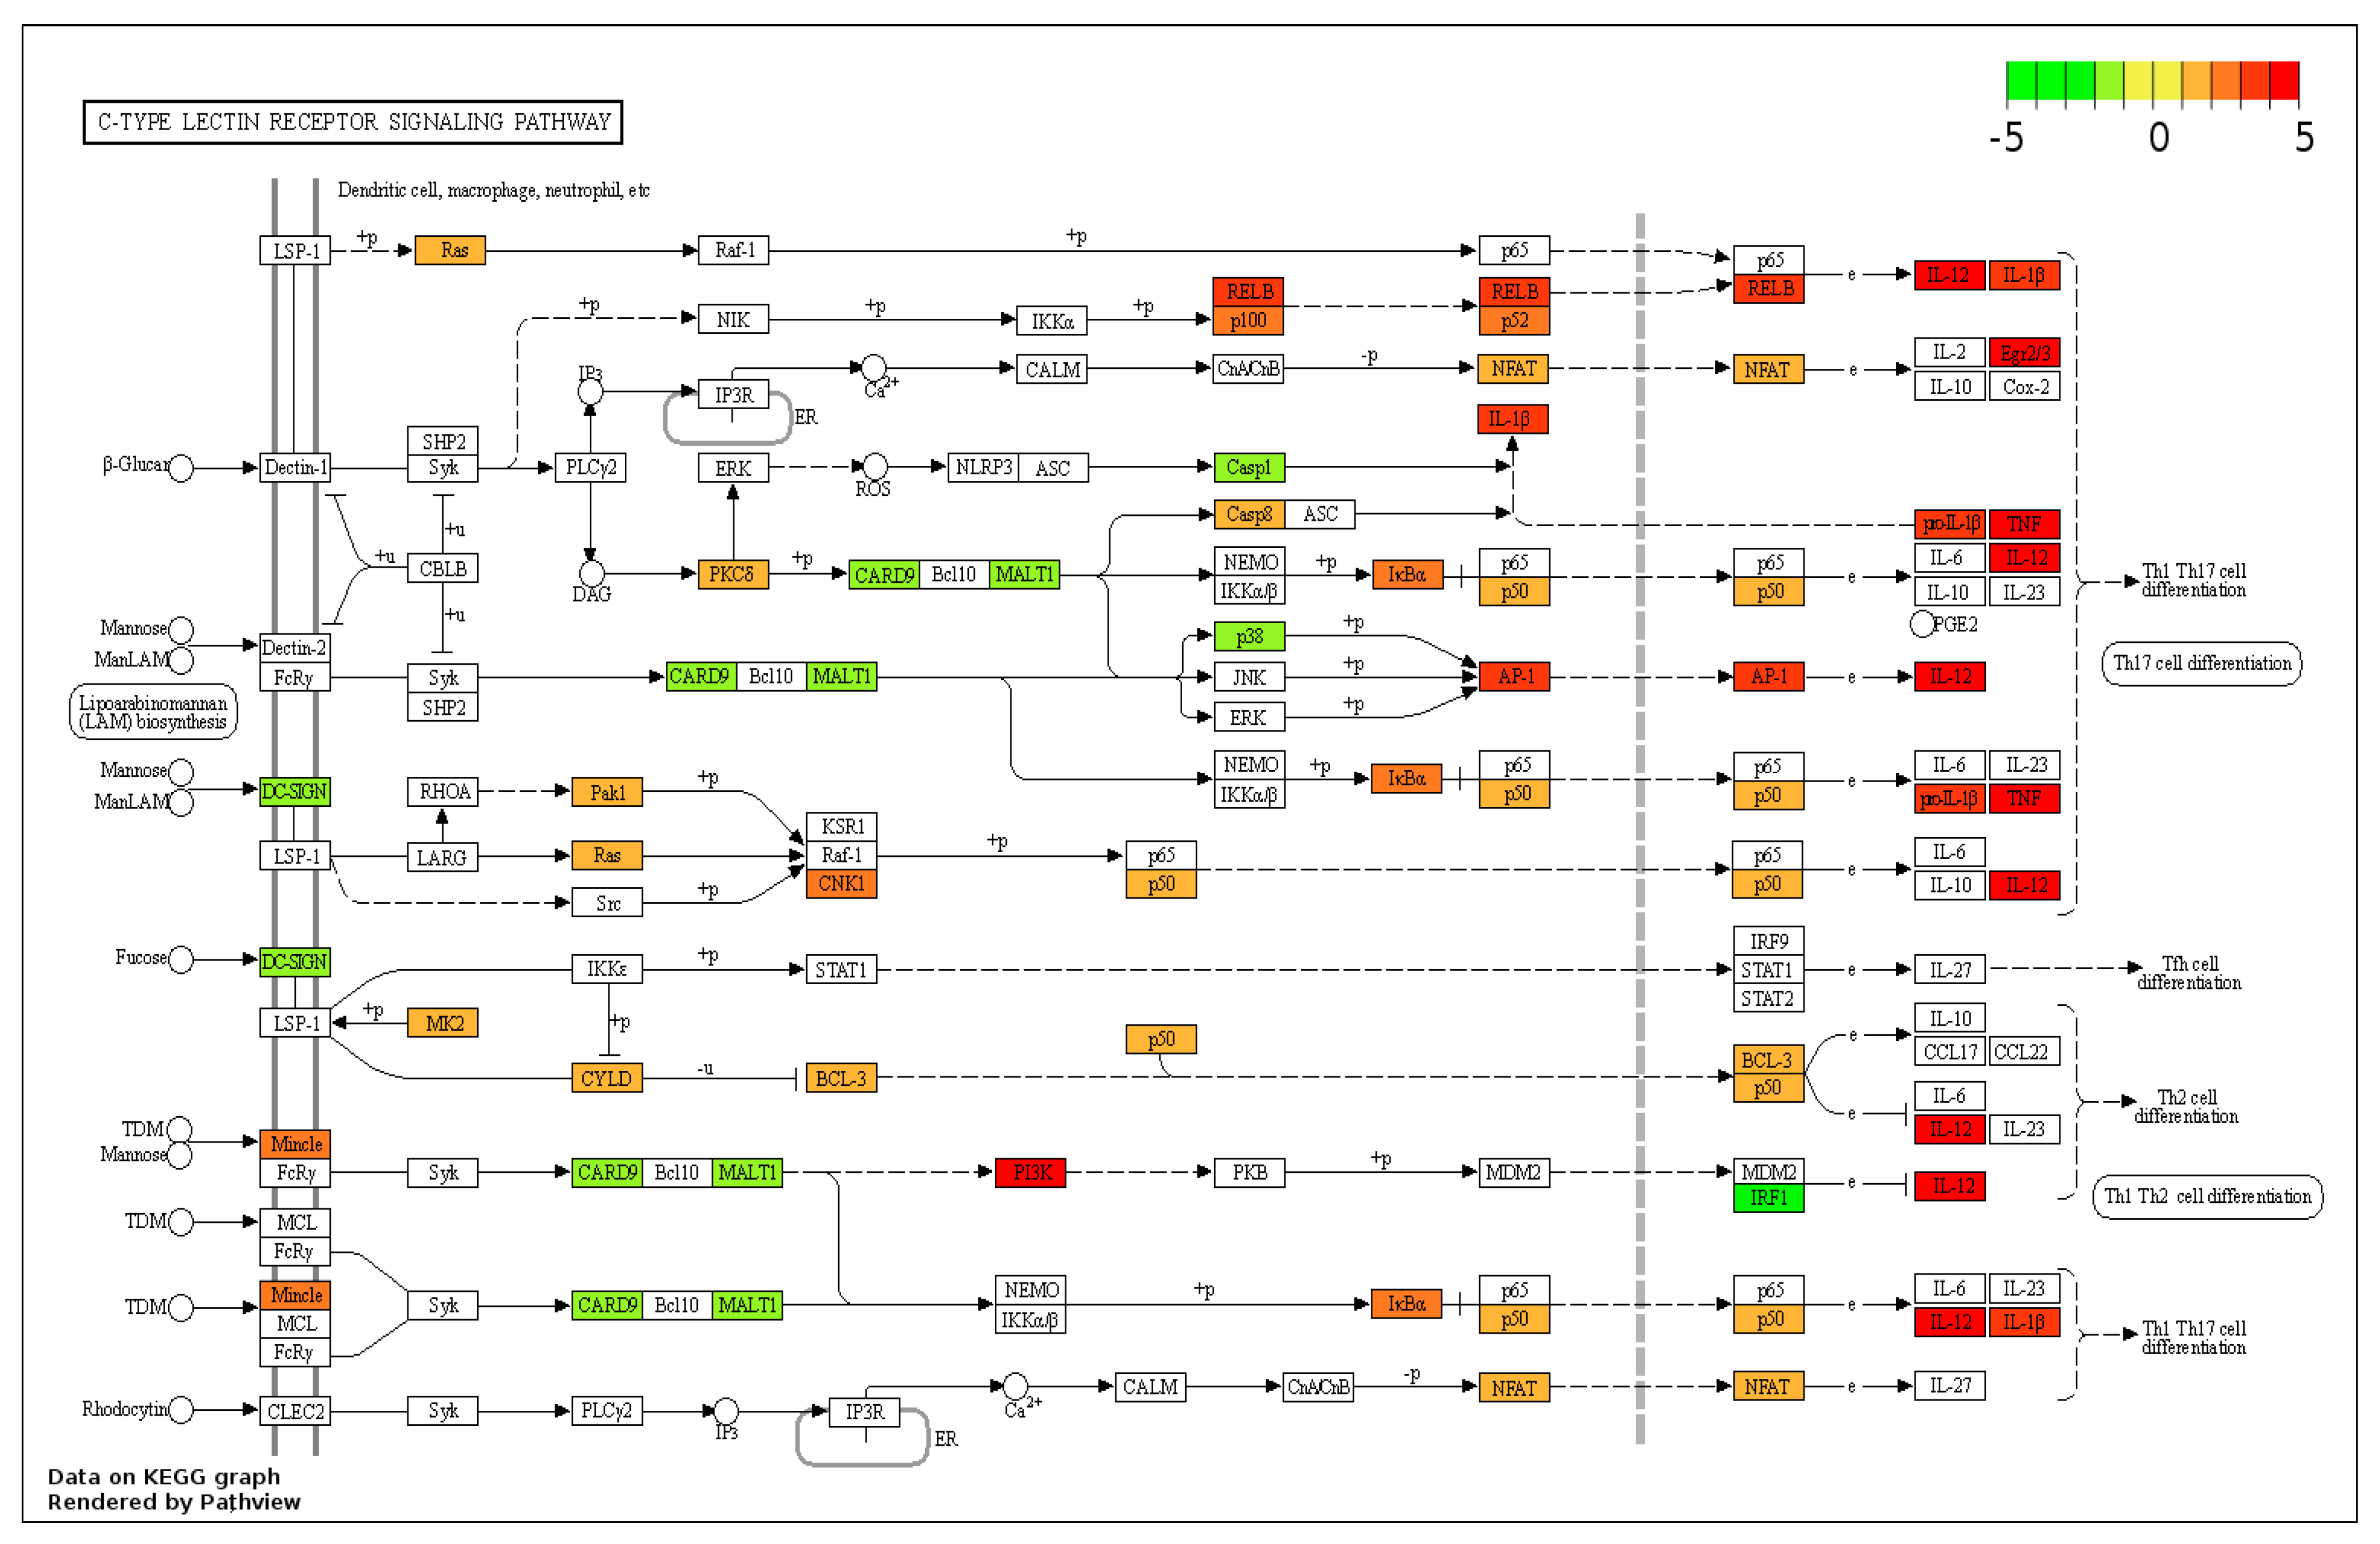
The KEGG pathway analysis of the C-type lectin signalling pathway in rainbow trout showed that 25/104 genes were upregulated with a 3.85-fold enrichment (Figure 5). The CLEC4E receptor was increased by 2.31-log2fold, with the additional downstream targets interleukin 12 (IL12), TNFα, and IL1β being upregulated.
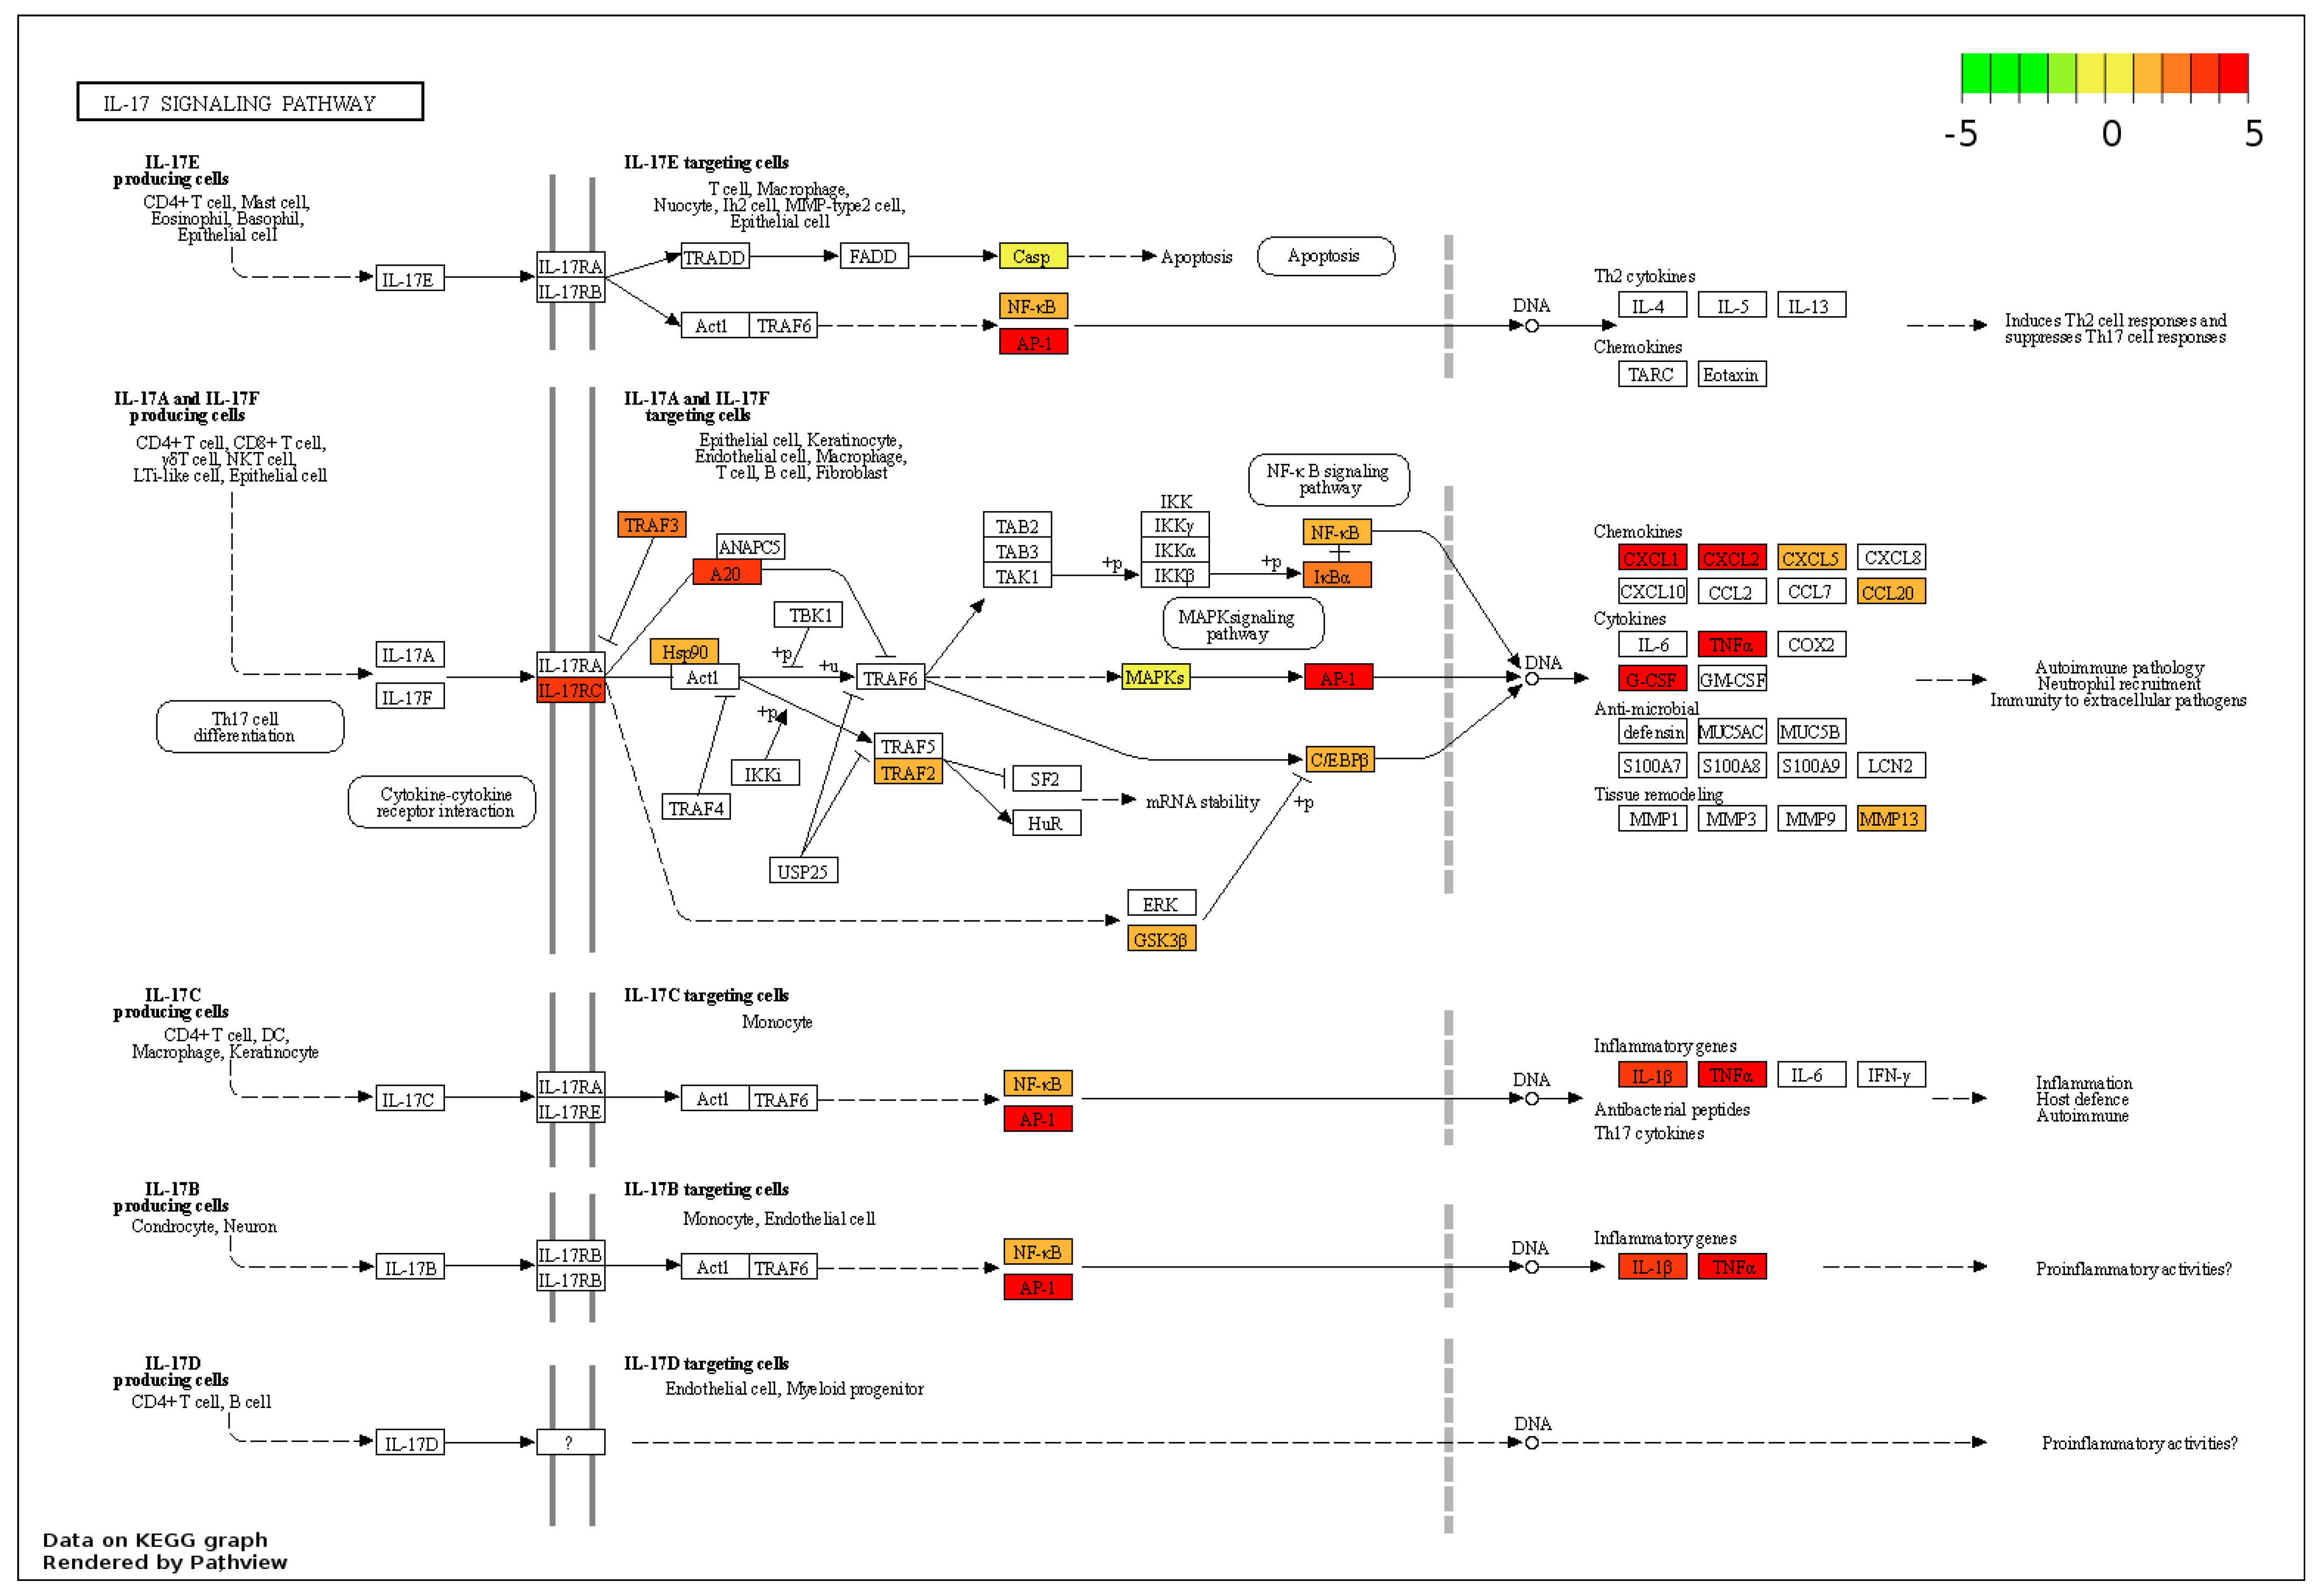
The other pathogen recognition receptor pathway to be upregulated was the toll-like receptor signalling pathway (Supplementary Figure S1). This pathway showed key downstream targets being upregulated: IL-1β, TNFα, IL-12, and AP-1; however, the receptors for this pathway showed no significant differences, except for TLR5 and TLR8, which showed a 1.4 and 1.7 log2fold change downregulation. Immune pathways such as the IL-17 signalling pathway were also enriched by 3.75-fold, with the key molecules NF-κB, heat shock protein 90 (HSP90), CXCL1, CXCL2, and TNFα all being upregulated, as shown in Figure 6.

4. Discussion

This study further highlights the immune modulatory effect of β-glucans in rainbow trout by demonstrating the modulation of the innate immune system through the direct interaction with macrophage-like cells. This work expands on previous studies where targeted gene expression has been carried out by limited gene sets using real-time PCR in RTS11 cells [10,12]. Here, we clearly demonstrate that β-glucans cause the distinct immunomodulation of innate immune pathways relating to the proinflammatory response, most likely by binding to cellular receptors and resulting in multiple signalling pathways, rather than changes in the cellular metabolism. This is shown in both the gene ontology and KEGG pathway analysis of RTS11 samples. GO demonstrated that five overlapping biological processes were significantly upregulated, related to the proinflammatory response: the inflammatory response, response to lipopolysaccharide, cellular response to the tumour necrosis factor, cellular response to interleukin 1, and response to cytokines. This confirms previous studies in carp macrophages, which also showed differential expression in the same GO terms; inflammatory response and response to cytokines [16], showing that there are common responses across different fish species. Our results also complement previous in vivo experiments in the spleen where rainbow trout fed a β-glucan-supplemented diet and then infected with A. salmonicida showed KEGG enrichment in the complement signalling pathway, toll-like receptor signalling pathway, antigen processing and presentation, and T cell receptor signalling pathway [9]. There is a clear signature of inflammation, with specific immune transcripts (IL1β, TNFα, IL8) being upregulated that have also been observed in experiments with β-glucans before [7,8,10,11,12].
It is of interest that pathways related to innate cell surface receptors specifically, the C-type lectin signalling pathway and the toll-like receptor signalling pathways were strongly enriched by β-glucans in reports on both trout and carp [9,16]. In carp, the C-type lectin 4C (CLEC4C) and Salmon C-type lectin receptor C (SCLRC) were suggested to be potential candidate genes for a β-glucan receptor in carp [16]. SCLR genes, SCLRA, SCLRB, and SCLRC, were found to be upregulated after 7 days in the distal intestine of Atlantic salmon after being intubated with MacroGard®, a β-1,3/1,6-glucans from Saccharomyces cerevisiae [37]. In our analysis of RTS11 cells, both KEGG pathways relating to the TLR and CLR signalling pathways were enriched. Upon a closer examination of the TLR pathway, only downstream targets were significantly upregulated and not the receptors themselves, suggesting that a different pathway was causing the upregulation of certain cytokines. Within the CLR signalling pathway, both receptors and downstream targets were increased in expression. Of the significantly upregulated genes, two potential receptors were found to show significant upregulation: C-type lectin domain family 4 member E (CLEC4E/HGNC:14555) and C-type lectin domain containing 17A (CLEC17A/HGNC:34520). Interestingly, this is the same family of genes, C-type lectin family 4, that was seen to be potential candidate genes in the study by Petit et al., 2019. In human macrophages, CLEC4E has been shown to bind to trehalose-6,6′-dimycolate (TDM), a virulence factor found in the cell walls of Mycobacterium tuberculosis [17]. TDM is a disaccharide of two D-glucose molecules linked by a glycosidic bond, found predominantly in the α,α-1,1-trehalose form of the molecule [38]. TDM has some similarities to the molecular structure of β-glucans, a polysaccharide chain made from several D-glucose molecules linked by 1–3 β-glycosidic bonds, and, as such, may have similar binding receptors, further enhancing the likelihood of the CLEC4 family being a potential β-glucan receptor in rainbow trout. Further analysis of the C-type lectin family type 4 gene’s role in β-glucan responses will help determine the precise immunoregulatory roles of β-glucans.
The analysis of the GO and KEGG pathway analysis indicates that genes that are modulated by a bacterial response are also being driven by M-glucans. Here, the enrichment of GO terms, response to LPS, response to TNF, cellular response to IL1β, positive regulation of IFN-γ, response to cytokine, and inflammatory response are all highly enriched. These gene groups are all related to the proinflammatory response driven by bacterial PAMPs such as LPS or the upregulation of key cytokines, TNF, IL-1β, and IFNγ. KEGG pathway analysis demonstrates this further through the positive enrichment of the TNF signalling pathway, Yersinia infection, Pathogenic Escherichia coli infection, and Shigellosis pathways. Interestingly, these three bacterial pathways are all Gram-negative, facultatively anaerobic, non-motile bacteria belonging to the order Enterobacterales. A. salmonicida and Vibrio anguillarum are etiological agents for fish diseases and present threats to aquaculture. β-glucan supplementation was shown to improve the innate immune response to Aeromonas infection in rainbow trout [9,10], potentially by activating the antibacterial response that we show here, priming the fish to efficiently deal with the bacterial infection. The study by Petit et al., 2019a has demonstrated that the structure of the β-glucans used can modulate different pathways, with MacroGard®, a β-1,3/1,6-glucan, modulating more KEGG pathways compared to Curdlan, a β-1,3-glucan.
This experiment only focuses on one concentration (100 μg/mL) and type of β-glucan (β-1,3/1,6-glucans), with further experiments needed to identify the effectiveness at lower concentrations or verify if other compositions of β-glucans would act more effectively. Nevertheless, the results of this study can provide a starting point for further research into β-glucans in aquaculture. In this study, “omics: technology was used to enhance the understanding of the immunomodulatory nature of β-glucans. Whilst “omic” data are useful in highlighting pathways of interest, further studies are needed to confirm the predictions provided by RNA-seq in this study. Further research is needed within aquaculture research to confirm the specific β-glucan recognition pathways, thought to be related to the C-type lectin signalling pathways in both the present study and that by Petit et al. [16], to allow β-glucans to be effectively used within feed production.
This study further demonstrates the effectiveness of using cell culture models to establish baseline responses to functional ingredients. The use of cell culture models to replace in vivo experiments would help towards reducing the 3Rs and importantly provide an effective screening method for new functional ingredients that may benefit fish health. RTS11 has been used to establish innate immune responses due to its macrophage-like phenotype, which is found in the intestine of salmonids [21]. However, this cell line does not represent the cellular phenotype of the gut due to it being derived from the spleen, and as a cell line, it may only possess one or two clonal cell types. Alternatively, other intestinal cell lines such as the rainbow trout distal intestine (RTdi-MI), rainbow trout proximal intestine (RTpi-MI), or rainbow trout epithelial cell line (RTgutGC) could be used as novel models to identify immunomodulation in response to β-glucans [39,40]. Host immune responses are likely to be much more complex through the interaction of other antigen-presenting molecules, such as dendritic cells, interactions with the microbiome, and the respective short-chain fatty acids that are produced by β-glucan fermentation [41] and may overrepresent immune modulation due to the singular cell type. Further time points, such as 24 and 48 h, could also be tested to establish the responses of RTS11 at different phases of the innate immune response. The data shown here solely reflect rainbow trout, with further research needed to identify if the similar responses are expected in other commercial species.
Conclusions: In the current study, β-glucans are shown to promote proinflammatory responses, with key proinflammatory pathways being upregulated, as demonstrated in many previous studies when using targeted gene expression [7,8,10,12]. RTS11 represents a macrophage-like cell line and provides a well-characterised, robust model for studying the implications of β-glucan supplementation on the innate immune response. RTS11 could be utilised, as in the present study, as a strong predictive model to understand immunomodulation and study immune responses to β-glucans alongside infection with Aeromonas or Vibrio.

Supplementary Materials

The following supporting information can be downloaded at: https://www.mdpi.com/article/10.3390/genes14061261/s1, Supplementary Methods; Figure S1: Regulation of the Toll-like receptor signaling pathway by M-glucans; Table S1: All transcripts that were differentially expressed (padj <0.05, log2 fold change ≥ 1 = upregulated or ≤−1 = downregulated) and their relevant HGNC IDs; Table S2: Gene ontology analysis showing Cellular Component; Table S3—Gene ontology analysis showing Molecular Function; Table S4: All paralogs that are expressed in the GO:0034097 response to cytokine; Table S5: All paralogs that are expressed in the GO:0071347 cellular response to Interleukin-1.

Author Contributions

D.P. (Dean Porter): Methodology, Validation, Formal Analysis, Investigation, Writing—Original Draft Preparation. S.N.: Formal Analysis, Software. D.P. (David Peggs): Conceptualisation, Writing—Review, Supervision. C.M. Conceptualisation, Writing—Review, Supervision. S.A.M.M.: Conceptualisation, Investigation, Writing—Review & Editing, Supervision. All authors have read and agreed to the published version of the manuscript.

Funding

This work was funded by the University of Aberdeen and Skretting AI.

Data Availability Statement

The RNA-seq data have been deposited in the ArrayExpress repository (http://www.ebi.ac.uk/arrayexpress/) under accession number E-MTAB-12643.

Acknowledgments

The technical support provided by Dawn Shewring was greatly appreciated. The RTS11 cells were donated as a gift from Niels Bols to researchers at the Scottish Fish Immunology Research Centre, University of Aberdeen.

Conflicts of Interest

C. McGurk and D. Peggs are employees of Skretting AI. The remaining authors declare that the research was conducted in the absence of any commercial or financial relationships that could be construed as a potential conflict of interest. The authors declare that this study received funding from Skretting AI. The funder had the following involvement in the study: review of the manuscript and provision of β-glucan samples.

References

  1. Hunter, M.C.; Smith, R.G.; Schipanski, M.E.; Atwood, L.W.; Mortensen, D.A. Agriculture in 2050: Recalibrating Targets for Sustainable Intensification. BioScience 2017, 67, 386–391. [Google Scholar] [CrossRef] [Green Version]
  2. Jones, A.R.; Alleway, H.K.; McAfee, D.; Reis-Santos, P.; Theuerkauf, S.J.; Jones, R.C. Climate-Friendly Seafood: The Potential for Emissions Reduction and Carbon Capture in Marine Aquaculture. BioScience 2022, 72, 123–143. [Google Scholar] [CrossRef] [PubMed]
  3. Rodger, H.D. Fish Disease Causing Economic Impact in Global Aquaculture. In Fish Vaccines; Birkhäuser Advances in Infectious Diseases; Adams, A., Ed.; Springer: Basel, Switzerland, 2016; pp. 1–34. ISBN 978-3-0348-0980-1. [Google Scholar]
  4. Reverter, M.; Sarter, S.; Caruso, D.; Avarre, J.-C.; Combe, M.; Pepey, E.; Pouyaud, L.; Vega-Heredía, S.; de Verdal, H.; Gozlan, R.E. Aquaculture at the Crossroads of Global Warming and Antimicrobial Resistance. Nat. Commun. 2020, 11, 1870. [Google Scholar] [CrossRef] [PubMed] [Green Version]
  5. Leal, M.C.; Calado, R. The Key Role of Functional Aquafeeds to Achieve a More Sustainable Aquaculture. J. World Aquac. Soc. 2019, 50, 1044–1047. [Google Scholar] [CrossRef]
  6. Cornet, V.; Khuyen, T.D.; Mandiki, S.N.M.; Betoulle, S.; Bossier, P.; Reyes-López, F.E.; Tort, L.; Kestemont, P. GAS1: A New β-Glucan Immunostimulant Candidate to Increase Rainbow Trout (Oncorhynchus Mykiss) Resistance to Bacterial Infections With Aeromonas Salmonicida Achromogenes. Front. Immunol. 2021, 12, 693613. [Google Scholar] [CrossRef]
  7. Douxfils, J.; Fierro-Castro, C.; Mandiki, S.N.M.; Emile, W.; Tort, L.; Kestemont, P. Dietary β-Glucans Differentially Modulate Immune and Stress-Related Gene Expression in Lymphoid Organs from Healthy and Aeromonas Hydrophila-Infected Rainbow Trout (Oncorhynchus Mykiss). Fish Shellfish Immunol. 2017, 63, 285–296. [Google Scholar] [CrossRef]
  8. Ji, L.; Fu, S.; Sun, G.; Li, X.; Liu, Y. Dietary β-Glucan Modulate Haematological Parameters, Cytokines and Gene Expression in TLR and ERK Pathways of Rainbow Trout (Oncorhynchus Mykiss) during Infection by Aeromonas Salmonicida. Aquac. Res. 2020, 51, 906–917. [Google Scholar] [CrossRef]
  9. Ji, L.; Sun, G.; Li, X.; Liu, Y. Comparative Transcriptome Analysis Reveals the Mechanism of β-Glucan in Protecting Rainbow Trout (Oncorhynchus Mykiss) from Aeromonas Salmonicida Infection. Fish Shellfish Immunol. 2020, 98, 87–99. [Google Scholar] [CrossRef]
  10. Ordás, M.C.; González-Torres, L.; Arense, P.; Heavyside, R.; Zarza, C.; Tafalla, C. Analysis of Immunostimulatory Responses and Immune Tolerance to β-Glucans in Rainbow Trout Cell Lines. Aquaculture 2021, 541, 736805. [Google Scholar] [CrossRef]
  11. Løvoll, M.; Fischer, U.; Mathisen, G.S.; Bøgwald, J.; Ototake, M.; Dalmo, R.A. The C3 Subtypes Are Differentially Regulated after Immunostimulation in Rainbow Trout, but Head Kidney Macrophages Do Not Contribute to C3 Transcription. Vet. Immunol. Immunopathol. 2007, 117, 284–295. [Google Scholar] [CrossRef]
  12. Porter, D.; Peggs, D.; McGurk, C.; Martin, S.A.M. Gut Associated Lymphoid Tissue (GALT) Primary Cells and Stable Cell Lines as Predictive Models for Intestinal Health in Rainbow Trout (Oncorhynchus Mykiss). Front. Immunol. 2022, 13, 1023235. [Google Scholar] [CrossRef] [PubMed]
  13. Hadiuzzaman, M.; Moniruzzaman, M.; Shahjahan, M.; Bai, S.C.; Min, T.; Hossain, Z. β-Glucan: Mode of Action and Its Uses in Fish Immunomodulation. Front. Mar. Sci. 2022, 9, 905986. [Google Scholar] [CrossRef]
  14. Porter, D.; Peggs, D.; McGurk, C.; Martin, S.A.M. Immune Responses to Prebiotics in Farmed Salmonid Fish: How Transcriptomic Approaches Help Interpret Responses. Fish Shellfish Immunol. 2022, 127, 35–47. [Google Scholar] [CrossRef]
  15. Mu, D.; Yang, J.; Jiang, Y.; Wang, Z.; Chen, W.; Huang, J.; Zhang, Y.; Liu, Q.; Yang, D. Single-Cell Transcriptomic Analysis Reveals Neutrophil as Orchestrator during β-Glucan–Induced Trained Immunity in a Teleost Fish. J. Immunol. 2022, 209, 783–795. [Google Scholar] [CrossRef]
  16. Petit, J.; Bailey, E.C.; Wheeler, R.T.; de Oliveira, C.A.F.; Forlenza, M.; Wiegertjes, G.F. Studies Into β-Glucan Recognition in Fish Suggests a Key Role for the C-Type Lectin Pathway. Front. Immunol. 2019, 10, 280. [Google Scholar] [CrossRef]
  17. Furukawa, A.; Kamishikiryo, J.; Mori, D.; Toyonaga, K.; Okabe, Y.; Toji, A.; Kanda, R.; Miyake, Y.; Ose, T.; Yamasaki, S.; et al. Structural Analysis for Glycolipid Recognition by the C-Type Lectins Mincle and MCL. Proc. Natl. Acad. Sci. USA 2013, 110, 17438–17443. [Google Scholar] [CrossRef] [Green Version]
  18. Patin, E.C.; Orr, S.J.; Schaible, U.E. Macrophage Inducible C-Type Lectin As a Multifunctional Player in Immunity. Front. Immunol. 2017, 8, 861. [Google Scholar] [CrossRef] [Green Version]
  19. Johansson, P.; Wang, T.; Collet, B.; Corripio-Miyar, Y.; Monte, M.M.; Secombes, C.J.; Zou, J. Identification and Expression Modulation of a C-Type Lectin Domain Family 4 Homologue That Is Highly Expressed in Monocytes/Macrophages in Rainbow Trout (Oncorhynchus Mykiss). Dev. Comp. Immunol. 2016, 54, 55–65. [Google Scholar] [CrossRef]
  20. Wiegertjes, G.F.; Wentzel, A.S.; Spaink, H.P.; Elks, P.M.; Fink, I.R. Polarization of Immune Responses in Fish: The ‘Macrophages First’ Point of View. Mol. Immunol. 2016, 69, 146–156. [Google Scholar] [CrossRef]
  21. Salinas, I. The Mucosal Immune System of Teleost Fish. Biology 2015, 4, 525–539. [Google Scholar] [CrossRef] [PubMed] [Green Version]
  22. Goswami, M.; Yashwanth, B.S.; Trudeau, V.; Lakra, W.S. Role and Relevance of Fish Cell Lines in Advanced in Vitro Research. Mol. Biol. Rep. 2022, 49, 2393–2411. [Google Scholar] [CrossRef]
  23. Ganassin, R.C.; Bols, N.C. Development of a Monocyte/Macrophage-like Cell Line, RTS11, from Rainbow Trout Spleen. Fish Shellfish Immunol. 1998, 8, 457–476. [Google Scholar] [CrossRef]
  24. Martin, S.A.; Zou, J.; Houlihan, D.F.; Secombes, C.J. Directional responses following recombinant cytokine stimulation of rainbow trout (Oncorhynchus mykiss) RTS-11 macrophage cells as revealed by transcriptome profiling. BMC Genom. 2007, 8, 15025. [Google Scholar] [CrossRef] [PubMed] [Green Version]
  25. de Bruijn, I.; Belmonte, R.; Anderson, V.L.; Saraiva, M.; Wang, T.; van West, P.; Secombes, C.J. Immune Gene Expression in Trout Cell Lines Infected with the Fish Pathogenic Oomycete Saprolegnia Parasitica. Dev. Comp. Immunol. 2012, 38, 44–54. [Google Scholar] [CrossRef] [PubMed]
  26. Zou, J.; Secombes, C.J. The Function of Fish Cytokines. Biology 2016, 5, 23. [Google Scholar] [CrossRef] [PubMed] [Green Version]
  27. Di Tommaso, P.; Chatzou, M.; Floden, E.W.; Barja, P.P.; Palumbo, E.; Notredame, C. Nextflow Enables Reproducible Computational Workflows. Nat. Biotechnol. 2017, 35, 316–319. [Google Scholar] [CrossRef] [PubMed]
  28. Ewels, P.A.; Peltzer, A.; Fillinger, S.; Patel, H.; Alneberg, J.; Wilm, A.; Garcia, M.U.; Di Tommaso, P.; Nahnsen, S. The Nf-Core Framework for Community-Curated Bioinformatics Pipelines. Nat. Biotechnol. 2020, 38, 276–278. [Google Scholar] [CrossRef]
  29. Dobin, A.; Davis, C.A.; Schlesinger, F.; Drenkow, J.; Zaleski, C.; Jha, S.; Batut, P.; Chaisson, M.; Gingeras, T.R. STAR: Ultrafast Universal RNA-Seq Aligner. Bioinformatics 2013, 29, 15–21. [Google Scholar] [CrossRef]
  30. Li, B.; Dewey, C.N. RSEM: Accurate Transcript Quantification from RNA-Seq Data with or without a Reference Genome. BMC Bioinformatics 2011, 12, 323. [Google Scholar] [CrossRef] [Green Version]
  31. Liao, Y.; Smyth, G.K.; Shi, W. FeatureCounts: An Efficient General Purpose Program for Assigning Sequence Reads to Genomic Features. Bioinformatics 2014, 30, 923–930. [Google Scholar] [CrossRef] [Green Version]
  32. Ewels, P.; Magnusson, M.; Lundin, S.; Käller, M. MultiQC: Summarize Analysis Results for Multiple Tools and Samples in a Single Report. Bioinformatics 2016, 32, 3047–3048. [Google Scholar] [CrossRef] [PubMed] [Green Version]
  33. Love, M.I.; Huber, W.; Anders, S. Moderated Estimation of Fold Change and Dispersion for RNA-Seq Data with DESeq2. Genome Biol. 2014, 15, 550. [Google Scholar] [CrossRef] [Green Version]
  34. Huang, D.W.; Sherman, B.T.; Lempicki, R.A. Systematic and Integrative Analysis of Large Gene Lists Using DAVID Bioinformatics Resources. Nat. Protoc. 2009, 4, 44–57. [Google Scholar] [CrossRef]
  35. Sherman, B.T.; Hao, M.; Qiu, J.; Jiao, X.; Baseler, M.W.; Lane, H.C.; Imamichi, T.; Chang, W. DAVID: A Web Server for Functional Enrichment Analysis and Functional Annotation of Gene Lists (2021 Update). Nucleic Acids Res. 2022, 50, W216–W221. [Google Scholar] [CrossRef]
  36. Luo, W.; Pant, G.; Bhavnasi, Y.K.; Blanchard, S.G., Jr.; Brouwer, C. Pathview Web: User Friendly Pathway Visualization and Data Integration. Nucleic Acids Res. 2017, 45, W501–W508. [Google Scholar] [CrossRef] [PubMed] [Green Version]
  37. Kiron, V.; Kulkarni, A.; Dahle, D.; Vasanth, G.; Lokesh, J.; Elvebo, O. Recognition of Purified β 1,3/1,6 Glucan and Molecular Signalling in the Intestine of Atlantic Salmon. Dev. Comp. Immunol. 2016, 56, 57–66. [Google Scholar] [CrossRef] [PubMed] [Green Version]
  38. Vanaporn, M.; Titball, R.W. Trehalose and Bacterial Virulence. Virulence 2020, 11, 1192–1202. [Google Scholar] [CrossRef]
  39. Kawano, A.; Haiduk, C.; Schirmer, K.; Hanner, R.; Lee, L.E.J.; Dixon, B.; Bols, N.C. Development of a Rainbow Trout Intestinal Epithelial Cell Line and Its Response to Lipopolysaccharide. Aquac. Nutr. 2011, 17, e241–e252. [Google Scholar] [CrossRef]
  40. Pasquariello, R.; Verdile, N.; Pavlovic, R.; Panseri, S.; Schirmer, K.; Brevini, T.A.L.; Gandolfi, F. New Stable Cell Lines Derived from the Proximal and Distal Intestine of Rainbow Trout (Oncorhynchus Mykiss) Retain Several Properties Observed In Vivo. Cells 2021, 10, 1555. [Google Scholar] [CrossRef] [PubMed]
  41. Petit, J.; de Bruijn, I.; Goldman, M.R.G.; van den Brink, E.; Pellikaan, W.F.; Forlenza, M.; Wiegertjes, G.F. β-Glucan-Induced Immuno-Modulation: A Role for the Intestinal Microbiota and Short-Chain Fatty Acids in Common Carp. Front. Immunol. 2022, 12, 761820. [Google Scholar] [CrossRef] [PubMed]
Figure 1. Identification of gene expression patterns. (A) Principal component analysis plot showing the distribution of RTS11 cells stimulated with M-glucans vs. control samples, where n = 4 and 3, respectively. (B) Volcano plot of all genes identifying differentially expressed genes (log2foldchange > 1, Padj < 0.05). Red represents an upregulated DEG, blue represents a downregulated DEG, whilst black represents a non-significantly expressed gene.
Genes 14 01261 g001
Figure 2. Gene ontology analysis of RTS11 stimulated with M-glucans for 4 h. GO terms have been filtered to show results with greater than 15 counts, greater than or less than twofold enrichment, and a Benjamini statistical score of less than 0.01. Colours represent −log10 (False Discovery Rate), with red being the highest, whilst the size of the dot represents the number of genes involved within each biological process.
Genes 14 01261 g002
Figure 3. KEGG Pathway Analysis of RTS11 stimulated with M-glucans for 4 h. KEGG Pathway terms have been filtered to show results with greater than 15 counts, greater than or less than twofold enrichment, and a Benjamini statistical score of less than 0.05.
Genes 14 01261 g003
Figure 4. Regulation of the TNF signalling pathway by M-glucans. DEG datasets were mapped onto the pathway using Pathview. Genes regulated by M-glucans are shown in colour, with green showing downregulation and red showing upregulation. Black solid lines represent known molecular interaction or relation (▸: activating, |: inhibiting); dotted lines represent indirect links or unknown reactions, where +p, −p, +u, and −u represent phosphorylation, dephosphorylation, ubiquitination, and deubiquitination, respectively. The symbol O represents chemical compounds, DNA, or other molecules.
Genes 14 01261 g004
Figure 5. Regulation of the C-type lectin pathway by M-glucans. DEG datasets were mapped onto the pathway using Pathview. Genes regulated by M-glucans are shown in colour, with green showing downregulation and red showing upregulation. Black solid lines represent known molecular interaction or relation (▸: activating, |: inhibiting); dotted lines represent indirect links or unknown reactions, where +p, −p, +u, and −u represent phosphorylation, dephosphorylation, ubiquitination, and deubiquitination, respectively. The symbol O represents chemical compounds, DNA, or other molecules.
Genes 14 01261 g005
Figure 6. Regulation of the IL-17 signalling pathway by M-glucans. DEG datasets were mapped onto the pathway using Pathview. Genes regulated by M-glucans are shown in colour, with green showing downregulation and red showing upregulation. Black solid lines represent known molecular interaction or relation (▸: activating, |: inhibiting); dotted lines represent indirect links or unknown reactions, where +p, −p, +u, and −u represent phosphorylation, dephosphorylation, ubiquitination, and deubiquitination, respectively. The symbol O represents chemical compounds, DNA, or other molecules.
Genes 14 01261 g006
Table 1. The top 20 up- or downregulated protein-coding genes detected against the rainbow trout genome after the DESeq2 analysis of RTS11 samples and a comparison between control and stimulated genes. Genes were selected based on Padj < 0.05 and those showing the greatest up- or downregulation in relation to log2foldchange.
HGNC IDGene DescriptionENSEMBL Gene IDlog2FoldChangePadj
NR4A3nuclear receptor subfamily 4, group A, member 3ENSOMYG0000001695710.842.47 × 10 −24
NR4A3nuclear receptor subfamily 4, group A, member 3ENSOMYG000000569829.502.48 × 10 −19
EGR3early growth response 3ENSOMYG000000033978.011.31 × 10 −12
DUSP2dual specificity phosphatase 2ENSOMYG000000151187.971.81 × 10 −13
SYT11synaptotagmin 11ENSOMYG000000213927.951.85 × 10 −12
EGR1early growth response 1ENSOMYG000000156377.931.08 × 10 −73
OCSTAMPosteoclast stimulatory transmembrane proteinENSOMYG000000331877.906.59 × 10 −25
INHBAinhibin subunit β AENSOMYG000000535807.847.24 × 10 −43
CNTFciliary neurotrophic factorENSOMYG000000338687.711.45 × 10−138
CCL4L2C-C motif chemokine ligand 4 like 2ENSOMYG000000260697.552.01 × 10−44
TRIOtrio Rho guanine nucleotide exchange factorENSOMYG000000371437.035.13 × 10−292
NAB2NGFI-A binding protein 2 (EGR1 binding
protein 2)
ENSOMYG000000127216.725.32 × 10−272
EGR3early growth response 3ENSOMYG000000458066.643.34 × 10−122
CXCL2C-X-C motif chemokine ligand 6ENSOMYG000000224446.606.8 × 10−213
SPRY4sprouty RTK signalling antagonist 4ENSOMYG000000318626.351.84 × 10−30
TNFtumour necrosis factor aENSOMYG000000583466.044.29 × 10−254
AMER2APC membrane recruitment protein 2ENSOMYG000000619586.010.00000239
PRDM1PR/SET domain 1ENSOMYG000000115835.922.88 × 10−10
RNF208ring finger protein 208ENSOMYG000000094195.890.00000372
TMCC3transmembrane and coiled-coil domain family 3ENSOMYG000000058475.840.00000231
TIMM13translocase of inner mitochondrial membrane 13ENSOMYG00000009641−3.480.030884
TESK2Testis-associated actin remodelling kinase 2ENSOMYG00000066315−3.495.72 × 10−11
HHLA1HERV-H LTR-associating 1ENSOMYG00000045198−3.500.019347
GPX2glutathione peroxidase 2ENSOMYG00000015731−3.630.015558
CCNIcyclin IENSOMYG00000006476−3.754.85 × 10−59
ARMH4Armadillo-like helical domain containing 4ENSOMYG00000000520−3.820.007779
C1orf21chromosome 1 open reading frame 21ENSOMYG00000003998−3.850.010249
CD93CD93 moleculeENSOMYG00000014356−3.861.01 × 10−6
ADORA2Aadenosine A2a receptorENSOMYG00000041298−3.960.0024
IGKCimmunoglobulin kappa constantENSOMYG00000062277−4.090.002041
TIRAPTIR domain containing adaptor proteinENSOMYG00000047353−4.195.59 × 10−9
HES6hes family bHLH transcription factor 6ENSOMYG00000047424−4.203.67 × 10−10
TMEM132Dtransmembrane protein 132DENSOMYG00000046943−4.280.004874
ZBTB45zinc finger and BTB domain containing 45ENSOMYG00000011021−4.311.29 × 10−21
MYCMYC proto-oncogene, bHLH transcription factorENSOMYG00000039293−4.387.09 × 10−13
LHX4LIM homeobox 4ENSOMYG00000031792−4.400.006305
PDXPpyridoxal phosphataseENSOMYG00000015314−4.450.001192
MFSD11major facilitator superfamily domain containing 11ENSOMYG00000003467−4.469.54 × 10−7
RPE65retinoid isomerohydrolase RPE65ENSOMYG00000015503−4.910.000398
ZBED4zinc finger BED-type containing 4ENSOMYG00000069563−4.937.16 × 10−5
Table 2. Table showing the most differentially upregulated genes in the GO term GO:0034097-response to cytokine. The Log2foldchange displayed represents the most upregulated gene copy of the gene where paralogs are present (see Supplementary Table S2 for all copies of each gene).
HGNCGene DescpritionENSEMBL_IDlog2foldchangepadj
TIMP3TIMP Metallopeptidase Inhibitor 3ENSOMYG000000110293.200
JUNJun Proto-OncogeneENSOMYG000000368614.069.9 × 10−223
RELBRELB Proto-OncogeneENSOMYG000000219443.071.3 × 10−195
FOSL1FOS ligand 1ENSOMYG000000259155.076.6 × 10−126
NFKB2Nuclear Factor Kappa B Subunit 2ENSOMYG000000021882.422.5 × 10−124
FOSFos Proto-OncogeneENSOMYG000000298854.655.4 × 10−103
ALDH1A2Aldehyde Dehydrogenase 1 Family Member A2ENSOMYG000000460404.657.6 × 10−99
PMLPML Nuclear Body ScaffoldENSOMYG000000274722.453.08 × 10−42
CD274Programmed death-ligand 1ENSOMYG000000328621.286.31 × 10−42
MAPKAPK2MAPK Activated Protein Kinase 2ENSOMYG000000322521.287.44 × 10−36
BCL2L1BCL2 ligand 1ENSOMYG000000433102.376.37 × 10−32
ITIH4Inter-α-Trypsin Inhibitor Heavy Chain 4ENSOMYG000000170682.408.07 × 10−30
SKILSKI-Like Proto-OncogeneENSOMYG000000425482.155.68 × 10−21
RARARetinoic Acid Receptor αENSOMYG000000411231.839.96 × 10−15
MAPKAPK3MAPK Activated Protein Kinase 3ENSOMYG000000420131.065.17 × 10−8
BCL2BCL2 Apoptosis RegulatorENSOMYG000000388261.481.71 × 10−6
SRFSerum Response FactorENSOMYG000000384451.382.84 × 10−5
Table 3. Table showing the differentially upregulated genes expressed in the GO:0071347 Cellular response to Interleukin-1. The Log2foldchange displayed represents the most upregulated gene copy of the gene where paralogs are present (see supplementary Table S3 for all copies of each gene).
HGNCGene DescriptionENSEMBL_IDlog2foldchangepadj
NFKB1 Nuclear Factor Kappa B Subunit 1ENSOMYG000000406021.861.75 × 10−152
ZC3H12A Zinc Finger CCCH-Type Containig 12AENSOMYG000000383853.322.34 × 10−105
CCL4 C-C Motif Chemokine Ligand 4ENSOMYG000000082413.317.05 × 10−86
CCL3L1 C-C Motif Chemokine Ligand 3 Like 1ENSOMYG000000260697.552.01 × 10−44
SOX9 SRY-Box Transcription Factor 9ENSOMYG000000714213.486.63 × 10−39
CCL8C-C Motif Chemokine Ligand 8ENSOMYG000000027312.652.68 × 10−32
HIF1A Hypoxia Inducible Factor 1 Subunit αENSOMYG000000402051.192.42 × 10−31
CEBPB CCAAT Enhancer Binding Protein βENSOMYG000000198881.285.05 × 10−28
CD40 CD40 MoleculeENSOMYG000000292431.341.92 × 10−27
MYCMYC Proto-OncogeneENSOMYG000000413442.203.08 × 10−23
RC3H1 Ring Finger And CCCH-Type Domains 1ENSOMYG000000299821.521.1 × 10−21
KLF2 KLF Transcription Factor 2ENSOMYG000000391841.374.29 × 10−17
TANK TRAF Family Member Associated NFKB ActivatorENSOMYG000000471381.181.83 × 10−13
GBP1 Guanylate Binding Protein 1ENSOMYG000000364001.752.18 × 10−11
CCL20 C-C Motif Chemokine Ligand 20ENSOMYG000000269661.700.0000010
ACOD1 Aconitate Decarboxylase 1ENSOMYG000000287195.620.0000023
ADAMTS7ADAM Metallopeptidase with Thrombospondin Type 1 Motif 7ENSOMYG000000631191.170.00034
PTGIS Prostaglandin I2 SynthaseENSOMYG000000271712.850.02
NR1D1 Nuclear Receptor Subfamily 1 Group D Member 1ENSOMYG000000244342.230.046
Disclaimer/Publisher’s Note: The statements, opinions and data contained in all publications are solely those of the individual author(s) and contributor(s) and not of MDPI and/or the editor(s). MDPI and/or the editor(s) disclaim responsibility for any injury to people or property resulting from any ideas, methods, instructions or products referred to in the content.