Article

Genetic Diversity and Sequence Conservation of Peptide-Binding Regions of MHC Class I Genes in Pig, Cattle, Chimpanzee, and Human

1
Department of Stem Cell and Regenerative Biotechnology, Konkuk University, Gwangjin-gu, Seoul 05029, Republic of Korea
2
Genetic & Breeding Department, Korea Animal Improvement Association, Seocho, Seoul 06668, Republic of Korea
*
Author to whom correspondence should be addressed.
Submission received: 30 November 2023 / Revised: 13 December 2023 / Accepted: 13 December 2023 / Published: 20 December 2023
(This article belongs to the Section Animal Genetics and Genomics)

Abstract

:
Comparative analyses of MHC gene diversity and evolution across different species could offer valuable insights into the evolution of MHC genes. Intra- and inter-species sequence diversity and conservation of 12 classical major histocompatibility complex (MHC) class I genes from cattle, chimpanzees, pigs, and humans was analyzed using 20 representative allelic groups for each gene. The combined analysis of paralogous loci for each species revealed that intra-locus amino-acid sequence variations in the peptide-binding region (PBR) of MHC I genes did not differ significantly between species, ranging from 8.44% for SLA to 10.75% for BoLA class I genes. In contrast, intraspecies differences in the non-PBRs of these paralogous genes were more pronounced, varying from 4.59% for SLA to 16.89% for HLA. Interestingly, the Shannon diversity index and rate of nonsynonymous substitutions for PBR were significantly higher in SLA and BoLA than those in Patr and HLA. Analysis of peptide-binding pockets across all analyzed MHC class I genes of the four species indicated that pockets A and E showed the lowest and highest diversity, respectively. The estimated divergence times suggest that primate and artiodactyl MHC class I genes diverged 60.41 Mya, and BoLA and SLA genes diverged 35.34 Mya. These results offer new insights into the conservation and diversity of MHC class I genes in various mammalian species.

1. Introduction

The major histocompatibility complex (MHC) encodes glycoproteins responsible for delivering peptide fragments derived from various antigens to the cell surface. These fragments are then presented to T-cells and serve as antigen-recognition receptors in the adaptive immune system [1,2,3]. MHC class I molecules are expressed on nearly all cells and primarily induce immune responses in cytotoxic T-cells (CD8+ T-cells) [4,5]. Conversely, MHC class II molecules are predominantly expressed on antigen-presenting cells (APCs), such as dendritic cells or B-cells, and stimulate immune responses from CD4+ T-cells in response to peptides derived from extracellular pathogens, facilitating antibody production and local hypersensitivity reactions [4,5,6].
In mammals, classical MHC class I genes typically comprise eight exons, each encoding distinct functional domains. The presentation of peptides is primarily facilitated by the peptide-binding region (PBR), consisting of α1 and α2 domains encoded by exons 2 and 3. Due tothese functional characteristics, the sequences of MHC classes I and II within the PBR exhibit extensive sequence variations. Specifically, the PBR of MHC class I molecules contains six distinct binding pockets labeled A through F, which anchor antigenic peptides [7,8,9,10].
The genetic diversity of MHC molecules plays a crucial role in the adaptive immune responses of vertebrates, with numerous studies exploring how MHC polymorphisms influence the resistance and susceptibility of animals to infectious and autoimmune diseases [11,12,13,14,15]. However, most studies have focused on analyzing the genetic diversity within single species, as there are limited numbers of species with sufficiently diverse allelic groups to enable a comparative analysis of MHC gene diversity [16,17,18].
The evolutionary dynamics of MHC genes adhere to the birth and death model of genes, in which new genes emerge through repeated gene duplications [19,20]. Some of these duplicated genes remain stable over long evolutionary periods, while others are either deleted or become pseudogenes [21]. In addition, balancing selection is considered to play a key role in maintaining MHC gene diversity [22]. However, positive selection strongly influences genetic variation in the epitope-binding region [23]. Previous studies have shown that nonsynonymous substitutions are more frequent in the PBR of MHC than in the non-PBR in humans, mice, birds, cattle, and pigs [24,25,26,27,28]. However, the degree of differences or similarities between different species remains to be investigated.
The human MHC, also known as the human leukocyte antigen (HLA) [29], is considered to have evolved through replication, followed by diversification, coevolution, and sequence exchange. HLA-A, HLA-B, and HLA-C are the major classical MHC class I genes, with 7712, 9164, and 7672 alleles, respectively (Immuno Polymorphism Database IPD, “https://www.ebi.ac.uk/ipd/imgt/hla” (accessed on 5 October 2023). This indicates the extreme genetic diversity of MHC genes [30]. Chimpanzees (Pan troglodytes), the closest genetic relative to humans, show approximately 99% genomic similarity to humans. However, MHC class I genes consisting of Patr-A, Patr-B, and Patr-C exhibit only 86% sequence identity to class I genes in humans [31,32,33]. Progress in understanding the genetic diversity of MHC systems of cattle and pigs, known as the bovine leukocyte antigen (BoLA) and swine leukocyte antigen (SLA), respectively, have also been made using comprehensive typing methods [18,30,34,35,36,37,38,39].
MHC-A (homologs of HLA-A) and MHC-B (homologs of HLA-B) in primates have been present for at least 30 million years, as indicated by their presence in New and Old World primates [40,41,42]. However, the MHC-C locus (homolog of HLA-C), which exhibits sequence similarity to the MHC-B locus, is only found in gorillas, chimpanzees, and humans [43,44]. MHC-C locus is considered to have arisen due to replication of the MHC-B locus in the lineage leading to Old World primates and after a split between Old World primates and Hominidaea approximately 22.3 million years ago [45,46]. However, the divergence time of the MHC class I genes in pigs and cattle has not been investigated.
Here, we performed comparative inter-species analyses of the genetic diversity and conservation of MHC class I genes in pigs, cattle, humans, and chimpanzees. This analysis was based on many reported allelic sequences to IPD for each species. Our results broaden our understanding of species-specific differences and inter-species similarities in the genetic diversity and antigen-recognition capabilities of MHC class I genes in mammals.

2. Materials and Methods

2.1. Acquisition of DNA Sequences

A total of 25,735 nucleotide sequences of three classical MHC class I genes (SLA-1, SLA-2, SLA-3, BoLA-1, BoLA-2, BoLA-3, Ovar-N, Patr-A, Patr-B, Patr-C, HLA-A, HLA-B, HLA-C) of pigs (Sus scrofa, NCBI Taxonomy ID = 9823), cattle (Bos taurus, NCBI Taxonomy ID = 9913, sheep (Ovis aries, NCBI Taxonomy ID = 9940), chimpanzees (Pan troglodytes, NCBI Taxonomy ID = 9598), and humans (Homo sapiens, NCBI Taxonomy ID = 9606) were downloaded from the Immuno Polymorphism Database (IPD, “https://www.ebi.ac.uk/ipd/mhc” (accessed on 5 October 2023)) (Table S1). Sequences with loss-of-function characteristics, including premature stop codons, were excluded.

2.2. Sequence Alignment and Phylogenetic Analysis

In the MHC allele naming nomenclature, the first two digits of the 6-digit allele names following the locus name indicate the allelic group designated by the MHC nomenclature committee for each species [47,48,49,50]. Thus, alleles that are identical in the first 2-digits of allele names indicate high sequence similarity. Datasets for the peptide-binding region (PBR) and non-PBR regions were prepared separately. PBR corresponds to exons 2 (270 nucleotides, 89 amino acids) and 3 (276 nucleotides, 92 amino acids), and non-PBR corresponds to the remaining exons, including exons 1 and 4–8. For the PBR dataset, one sequence per allelic group with the lowest sequence similarity to the sequences of other allelic groups was selected, resulting in 20 sequences for loci with 20 or more 2-digit allelic groups (SLA-1, BoLA-2, BoLA-3, Patr-A, Patr-B, HLA-A, HLA-B, and Ovar-N). However, for loci with fewer than 20 allelic groups (HLA-C, Patr-C, BoLA-1, and SLA-3), additional sequences with the lowest similarity to the selected sequences were selected from the redundant allelic groups. Most BoLA sequences were from Bos taurus, except for three sequences from Bos indicus (Table S2). Finally, 258 sequences were prepared to be included in the PBR sequence dataset, yielding an equal number of alleles (n = 20) (Table S2). For the non-PBR dataset, 120 sequences consisted of 10 allelic sequences for each gene, as the number of alleles containing the full-length sequence information of all eight exons was limited, except for HLA. All sequence alignments were performed using the DNA alignment tool CLC Main Workbench 3 (CLC Bio, Aarhus, Denmark). Phylogenetic analysis was conducted using the neighbor-joining method implemented in MEGA11: Molecular Evolutionary Genetic Analysis, version 11 [51]. A total of 1000 bootstrap replicates were used to estimate support for the nodes in the obtained tree. The dataset for the phylogenetic analysis constitutes with a single representative sequence for each allelic group deduced from the alignment all alleles for all available allelic groups of each gene including SLA-1 (n = 24), SLA-2 (n = 22), SLA-3 (n = 7), BoLA-1 (n = 16), BoLA-2 (n = 32), BoLA-3 (n = 27), Patr-A (n = 24), Patr-B (n = 37), Patr-C (n = 15), HLA-A (n = 21), HLA-B (n = 36), and HLA-C (n = 14) (Table S2).

2.3. Determination of Consensus Amino-Acid Sequences and Genetic Distance Analysis

Consensus amino-acid sequences for each MHC gene were determined by sequence alignment using the CLC Main Workbench 3 (CLC Bio, Aarhus, Denmark). Sequence differences and similarities in the allelic sequences were determined by aligning them to the consensus amino-acid sequence of each MHC gene. Pairwise sequence differences were estimated by counting the number of nucleotide and amino-acid differences between the two sequences. Genetic distances between different loci were computed using the between-group mean distance option in MEGA11 [51] and expressed as percentages relative to the total sequence length.

2.4. Computation of Amino-Acid Conservation, Diversity, and Nucleotide Substitution Rate

Amino-acid frequencies at each amino-acid position and amino-acid conservation rates were estimated from the input alignment file using the Biopython v.1.81 SeqIO and AlignIO packages [52]. The amino-acid diversity for each MHC class I locus was estimated using the Shannon diversity index and Protein Variability Server (PVS) program [53]. The number of nonsynonymous substitutions for nonsynonymous sites (Ka), synonymous substitutions for synonymous sites (Ks), and Ka/Ks ratios for each MHC gene were calculated using DNAsp v6.12.0 [54]. The average Ka/Ks ratio was calculated by averaging the Ka/Ks ratios at all sites for each allele.

2.5. Estimation of Gene Divergence Times

The divergence times of MHC class I genes were estimated with 10 amino-acid sequences of different allelic groups for each gene using RelTime-ML in MEGA11 [51]. Platypus Ornithorhynchus anatinus (NCBI Taxonomy ID: 9258) was used as the outgroup. Calibration times were set according to previous estimations [40,45,46], in which 30 million years ago [55] were used as the calibration times between MHC-A and MHC-B [55].

2.6. Statistical Analysis

The statistical significance of differences in the levels of sequence diversity of MHC class I genes between different species was tested by Student’s t-test, considering each MHC class I paralogous gene of each species as experimental repeats. Statistical significance for differences in the degree of sequence variation of classical MHC class I genes among different species was tested using one-way ANOVA, while paralogous genes of each species were considered to be experimental repeats. Differences in the sequence diversity of the peptide-binding pockets were tested for the Shannon diversity index of each gene using two-way ANOVA, while paralogous genes and binding pockets were tested as two different parameters. Subsequently, a post hoc analysis of the ANOVA results was conducted using Tukey’s HSD. All analyses were conducted using R [22].

3. Results

3.1. Intraspecies Variation of Nucleotide Diversity in the Peptide-Binding Region of Classical MHC Class I Genes

The IPD database, “https://www.ebi.ac.uk/ipd/mhc” (accessed on 5 October 2023) includes 21 HLA-A, 36 HLA-B, 14 HLA-C, 24 SLA-1, 22 SLA-2, 7 SLA-3, 24 Patr-A, 37 Patr-B, 15 Patr-C, 15 BoLA-1, 32 BoLA-2, and 27 BoLA-3 allelic groups based on the 2-digit MHC nomenclature system (Table S2). Then, 20 representative sequences from each of these genes were analyzed to understand the intraspecies species variations in the genetic diversity of the peptide-binding region (PBR), except BoLA-1, for which only 15 allelic groups of 18 alleles were available. The analysis included (Table S1) a total of 238 sequences with alength of 546 bp (181 amino acids) (Table S2, Figure S1).
The number of variable nucleotide sites identified across the PBR of the three MHC class I genes for each species was 7.82–8.79% for SLA, 9.51–12.31% for BoLA, 8.83–11.22% for Patr, and 7.42–9.86% for HLA, showing variations among class I paralogous genes within each species. The number of variable sites was lowest for SLA and highest for BoLA, yet the difference was not statistically significant (p = 0.162) (Figure 1A). The inter-species nucleotide sequence difference of PBR across the genes of the four different species was the lowest between HLA and Patr, as expected, while the differences were 5.10%, 6.65%, and 3.85% for HLA-A and Patr-A, HLA-B and Patr-B, and HLA-C and Patr-C, respectively (Table 1). The largest difference (average 16.56%) was observed between BoLA-1 and Patr-A, in line with their phylogenetic distances. A significant difference was also found between BoLA and SLA (average 14.85%) despite both the cattle and pigs containing artiodactyls.

3.2. High Amino-Acid Sequence Diversity in the PBR of Pigs and Cattle MHC Class I Genes

We next analyzed the levels of amino-acid sequence variation in the PBR and non-PBRs of the SLA, BoLA, Patr, and HLA class I genes. The average amino-acid sequence differences between the PBR of the three paralogous MHC class I genes of each species, calculated by pairwise comparisons of alleles of paralogous genes, ranged from 15.3% to 17.68% for SLA, 17.25% to 22.04% for BoLA, 15.38% to 17.96% for Patr, and 13.77% to 18.16% for HLA (Figure 1B), indicating smaller differences at the amino-acid level than at the nucleotide sequence level (Table 1 and Table S3). In addition, sequence differences between paralogous non-PBRs for each species ranged from 4.59% to 6.27% for SLA, 10.11% to 12.64% for BoLA, 11.25% to 16.31% for Patr, and 12.06% to 16.89% for HLA (Figure 1C), indicating a significantly higher level of intraspecies diversity than that of PBR, likely due to differences in species divergence times.
We calculated the Shannon diversity index (H) for PBR and non-PBRs for each MHC class I gene (Table 2). The average H values of the three paralogous PBRs for SLA, BoLA, Patr, and HLA class I genes were 0.34, 0.33, 0.19, and 0.20, respectively. In contrast, the H values for the paralogous non-PBR SLA, BoLA, Patr, and HLA were 0.07, 0.10, 0.06, and 0.08, respectively, indicating a higher level of sequence conservation of non-PBR compared to PBR for all four species. In addition, the H values of the α1 and α2 domains constituting the PBR were similar in all analyzed genes except for Patr-B (Hα1 = 0.37, Hα2 = 0.2, p-value = 0.04), indicating that sequence variations are observed in the entire sequence of PBR of MHC class I genes. Interestingly, the H value of PBR of SLA and BoLA genes was significantly higher with an average of 0.34 and 0.33, respectively, compared to the result for Patr (0.19) and HLA genes (0.20), indicating higher diversity of PBR in artiodactyls than hominid species. PBR diversity was significantly low in Patr-A, Patr-C, and HLA-C, with H values of 0.15, 0.14, and 0.15, respectively. This indicates that the number of residing polymorphic sites per allele was larger for SLA and BoLA class I genes than for Patr and HLA.
Since the HLA-B allelic group included the highest number of alleles (n = 36), we further analyzed the inter-species diversity of MHC class I genes with increasing numbers of participating allelic groups to evaluate a potential effect of the size of participating allelic groups on PBR diversity(Table S4). The obtained result was consistent with that obtained using 20 allelic groups, suggesting that inter-species differences observed in H values were not due to differences in the number of participating allelic groups or alleles.

3.3. Increased Nonsynonymous Substitutions in MHC Class I PBR in Artiodactyl Species than in Primates

Next, we determined nonsynonymous (Ka) and synonymous substitution (Ks) sites in the PBR sequences of 13 pig, cattle, sheep, chimpanzee, and human MHC class I genes (Table 3). The average number of nonsynonymous substitution sites in the PBR of HLA and Patr class I genes was 39.67 and 38.33, respectively. In contrast, 62 and 58 nonsynonymous substitution sites were detected for SLA and BoLA, respectively, indicating a significant increase in nonsynonymous mutations in artiodactyls compared to hominid species. Among the HLA and Patr class I genes, Patr-B showed the highest nonsynonymous substitution sites (58), similar to the values in artiodactyl species. Patr-B also showed a higher number of synonymous substitutions than other MHC class I genes in humans and chimpanzees. Ka/Ks ratios for the α1 and α2 domains of 12 MHC class I genes were higher than 1 for the PBR α2 domain of all five species (Table 3), indicating the occurrence of positive selection. However, the value for the PBR α1 domain of HLA-C, Patr-A, Patr-C, and BoLA-1 was lower than 1. The numbers of shared nonsynonymous substitution sites across paralogous genes in each species for SLA and BoLA were 17 and 19, respectively, which was higher than those in other species (Table S5). Human and chimpanzee MHC class I genes were found to share only four and two intraspecies conserved nonsynonymous sites, respectively. BoLA class I genes and Ovar-N, which wereincluded to evaluate the similarity in the nucleotide substitution rates of MHC class I genes between cattle and sheep, shared 11 conserved nonsynonymous substitution sites. Only one nonsynonymous site (position 349 of the α2 domain) was shared across SLA, BoLA, and Ovar-N. Interestingly, no shared nonsynonymous substitution sites were observed between Patr and HLA class I genes when 20 sequences from different allelic groups were compared. This may be due to the smaller number of variable sites between Patr and HLA class I genes than among the artiodactyls.

3.4. Phylogenetics Analysis

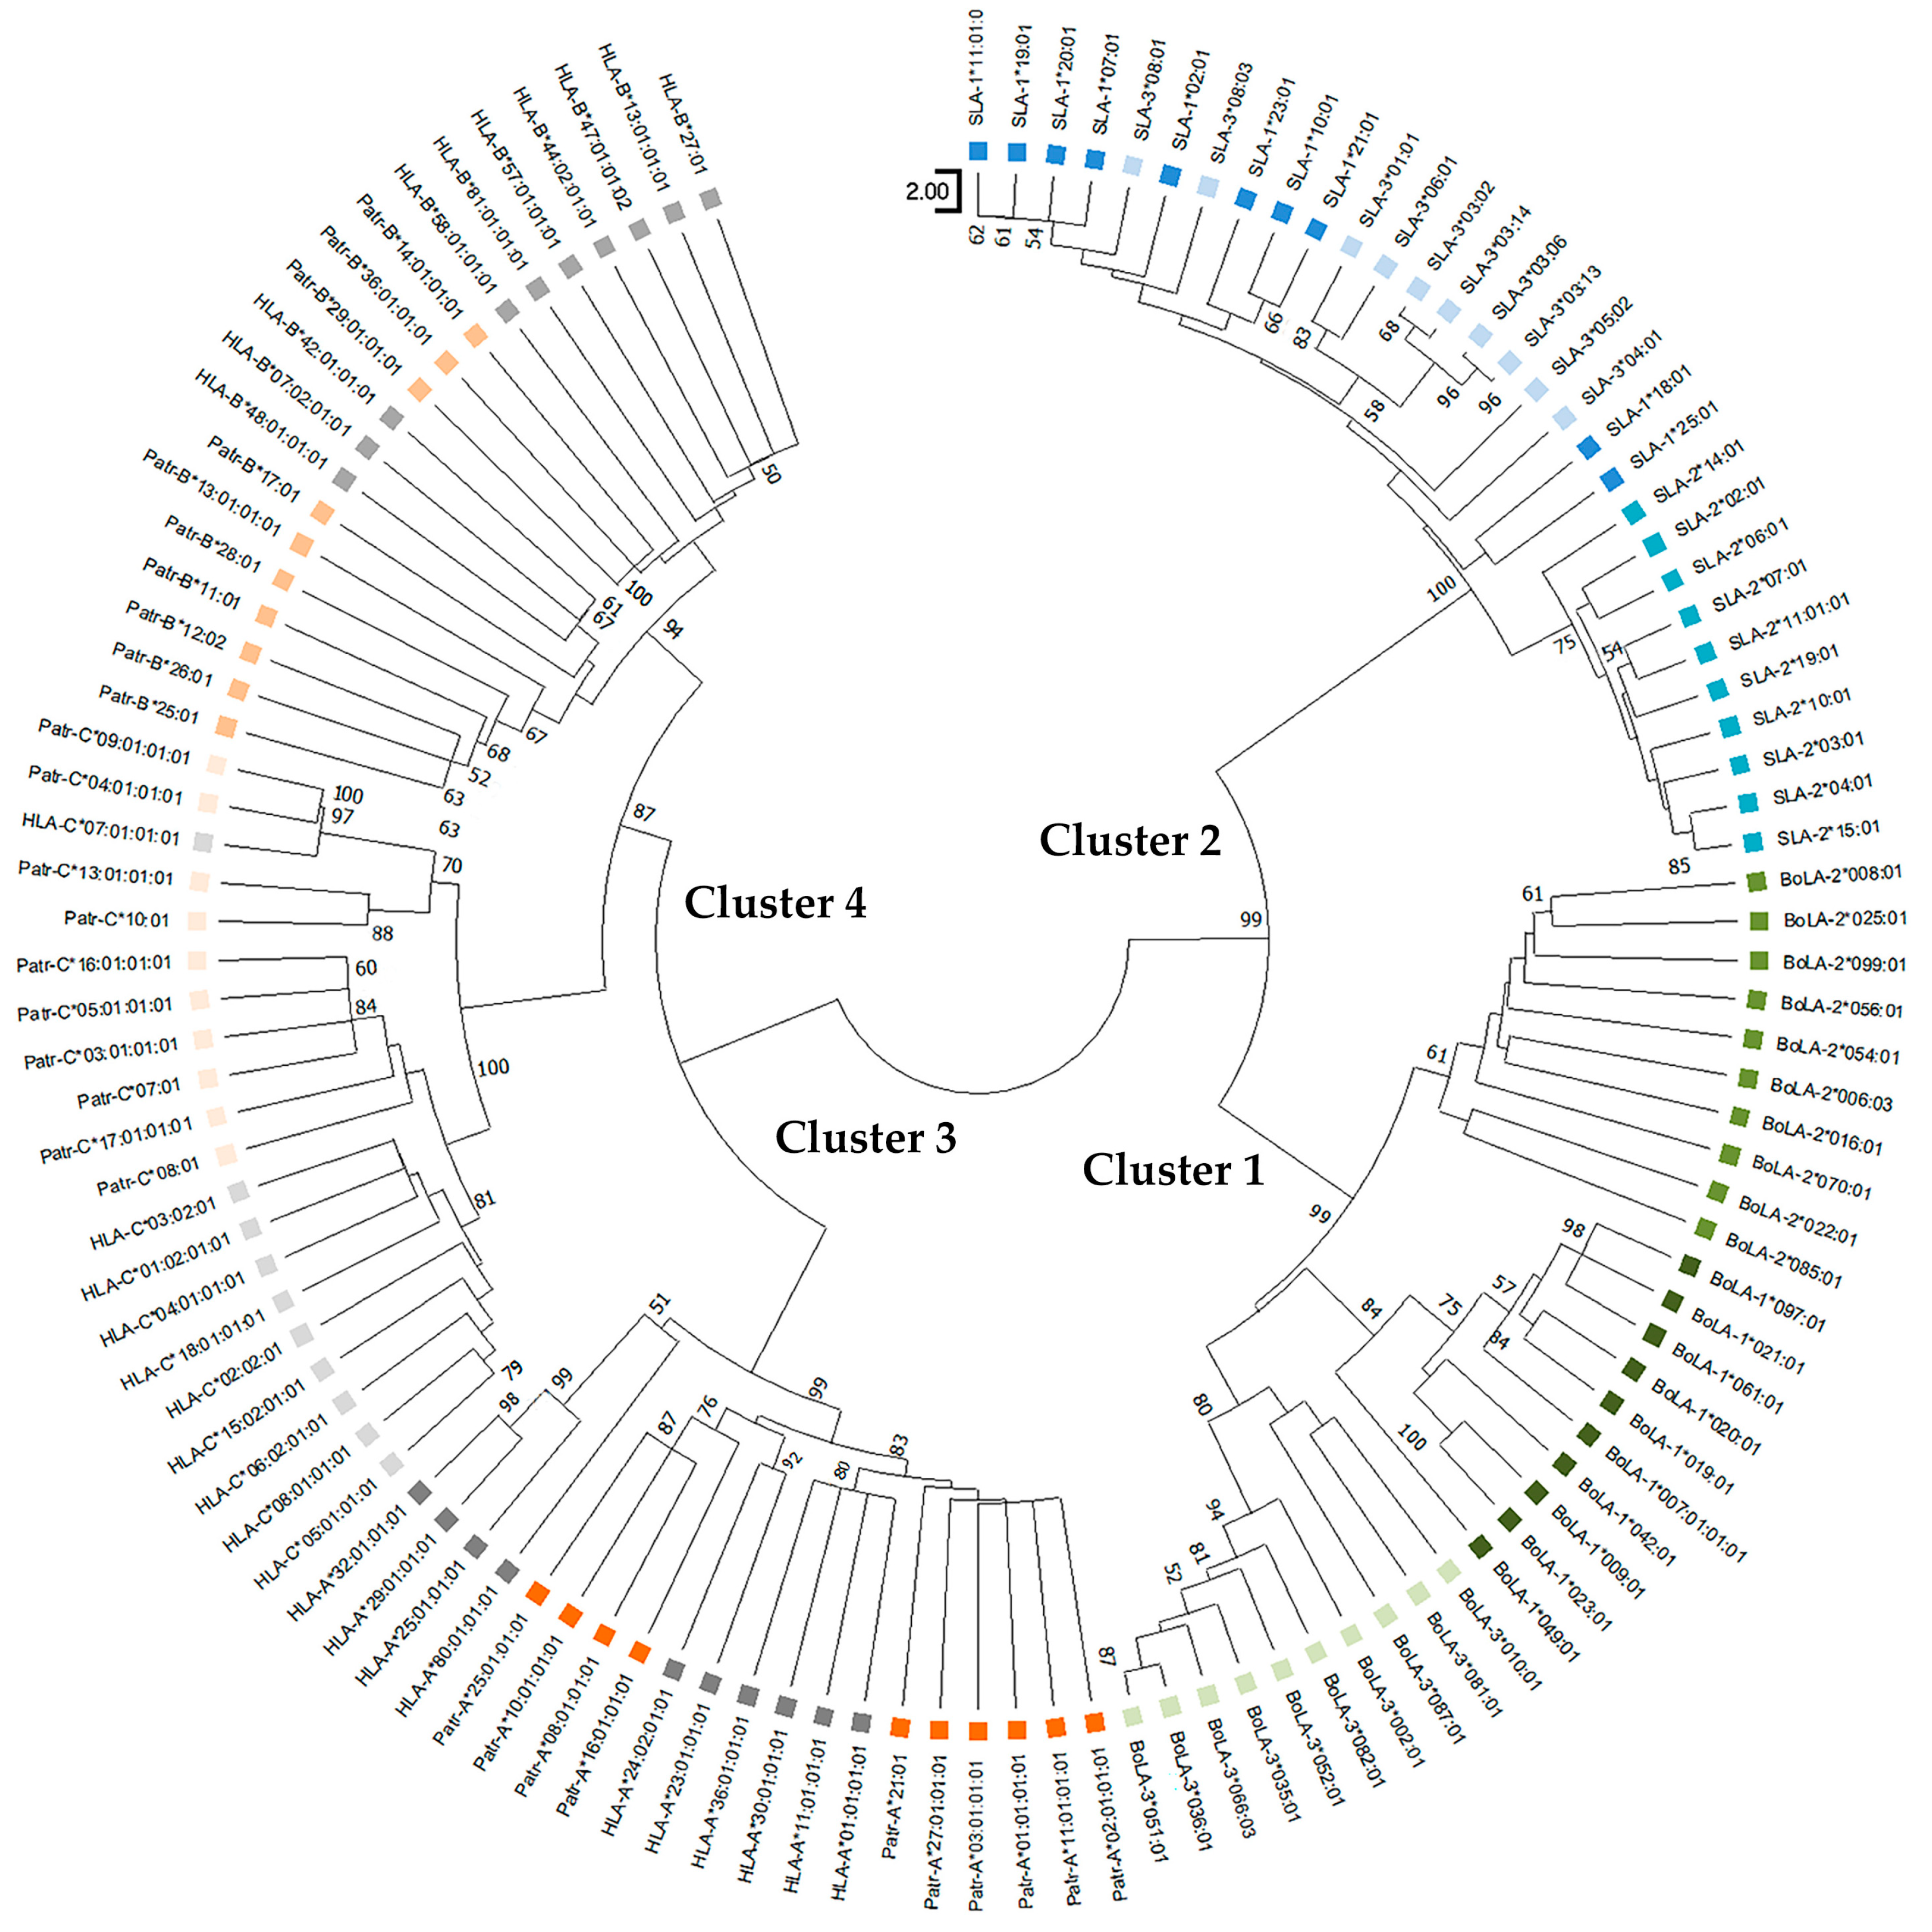
Phylogenetic trees were constructed using the amino-acid sequences of orthologous PBRs (181 amino acids) and non-PBR (176–186 amino acids) sequences of the SLA, BoLA, Patr, and HLA class I genes (Figure 2 and Figure 3). The neighbor-joining tree constructed using PBR sequences yielded four main branches/clusters (Clusters 1–4) (Figure 2). Cluster 1 consisted of only BoLA alleles, although locus-specific sub-clustering of the three paralogous genes (BoLA-1, BoLA-2, and BoLA-3) was incomplete. For example, the BoLA-1 and -2, including BoLA-2*03:01, BoLA-1*049:01, BoLA-1*067:01, BoLA-2*046*01, BoLA-2*043:01, and BoLA-2*047:01, was not found to cluster to specific loci together. Cluster 2 was composed only of SLA class I genes; however, the consistency of the locus-specific clustering of SLA-1, -2, and -3 was lower than that of BoLA in Cluster 1. Cluster 3 consisted of the Patr-A and HLA-A alleles, together with several Patr-B alleles. Most of the Patr-A and HLA-A alleles formed two separate subclusters yet shared the same branch at a higher level, suggesting a close genetic relationship between the two genes. However, Patr-B formed separate subclusters from Patr-A and HLA-A within Cluster 3. Cluster 4 consisted of HLA-B, Patr-B, HLA-C, and Patr-C alleles. Although sequences belonging to the same locus mostly clustered together, several HLA-B and HLA-C alleles were intermixed with Patr-B and Patr-C, further supporting a common ancestry between HLA-B and Patr-B and between HLA-C and Patr-C.
The phylogenetic tree of the non-PBR also formed four main clusters (Clusters 1–4), similar to that of the PBR (Figure 3). Cluster 1 of the non-PBR tree comprised locus-specific subclusters of the BoLA-1, BoLA-2, and BoLA-3 alleles. Cluster 2 exhibited locus-specific subclusters for SLA-2; however, the SLA-1 and SLA-3 alleles were intermixed and shared branches at a deeper level. Cluster 3 contained alleles of Patr-A and HLA-A loci. Cluster 4 comprised alleles of Patr-B and HLA-B as well as Patr-C and HLA-C. Tree of non-PBR sequences. Locus specificity was clearer than that of PBR, and paralogous genes formed subclusters more tightly in a locus-specific manner than in PBR.

3.5. Intraspecies Conservation of the Genetic Diversity Level for Peptide-Binding Pockets A and E

We determined the residues constituting the peptide-binding pockets (A to F) in the PBR of pig, cattle, and chimpanzee MHC class I sequences based on available HLA structures [7,8,56,57] (Table S6). We then calculated the H values of the pocket residues (Table 4). The mean H of SLA-1, -2, and -3 for the six pockets ranged from 0.54 for pocket A to 1.55 for pocket E, showing significant differences across pockets (Table S7). The sequence diversity of peptide-binding pockets varied somewhat among species; however, the characteristic feature of A and E pockets, being the pockets of lowest and highest diversity, respectively, were well conserved across all 13 MHC class I molecules of five different species, including sheep. The diversity levels in pockets B, C, and F were variable, with larger variations in SLA and BoLA than in Patr and HLA, in line with our results of the inter-species comparison of PBR diversity.

3.6. Presence of Conserved Sites in the Epitope-Binding Region of MHC Class I Genes across Different Species

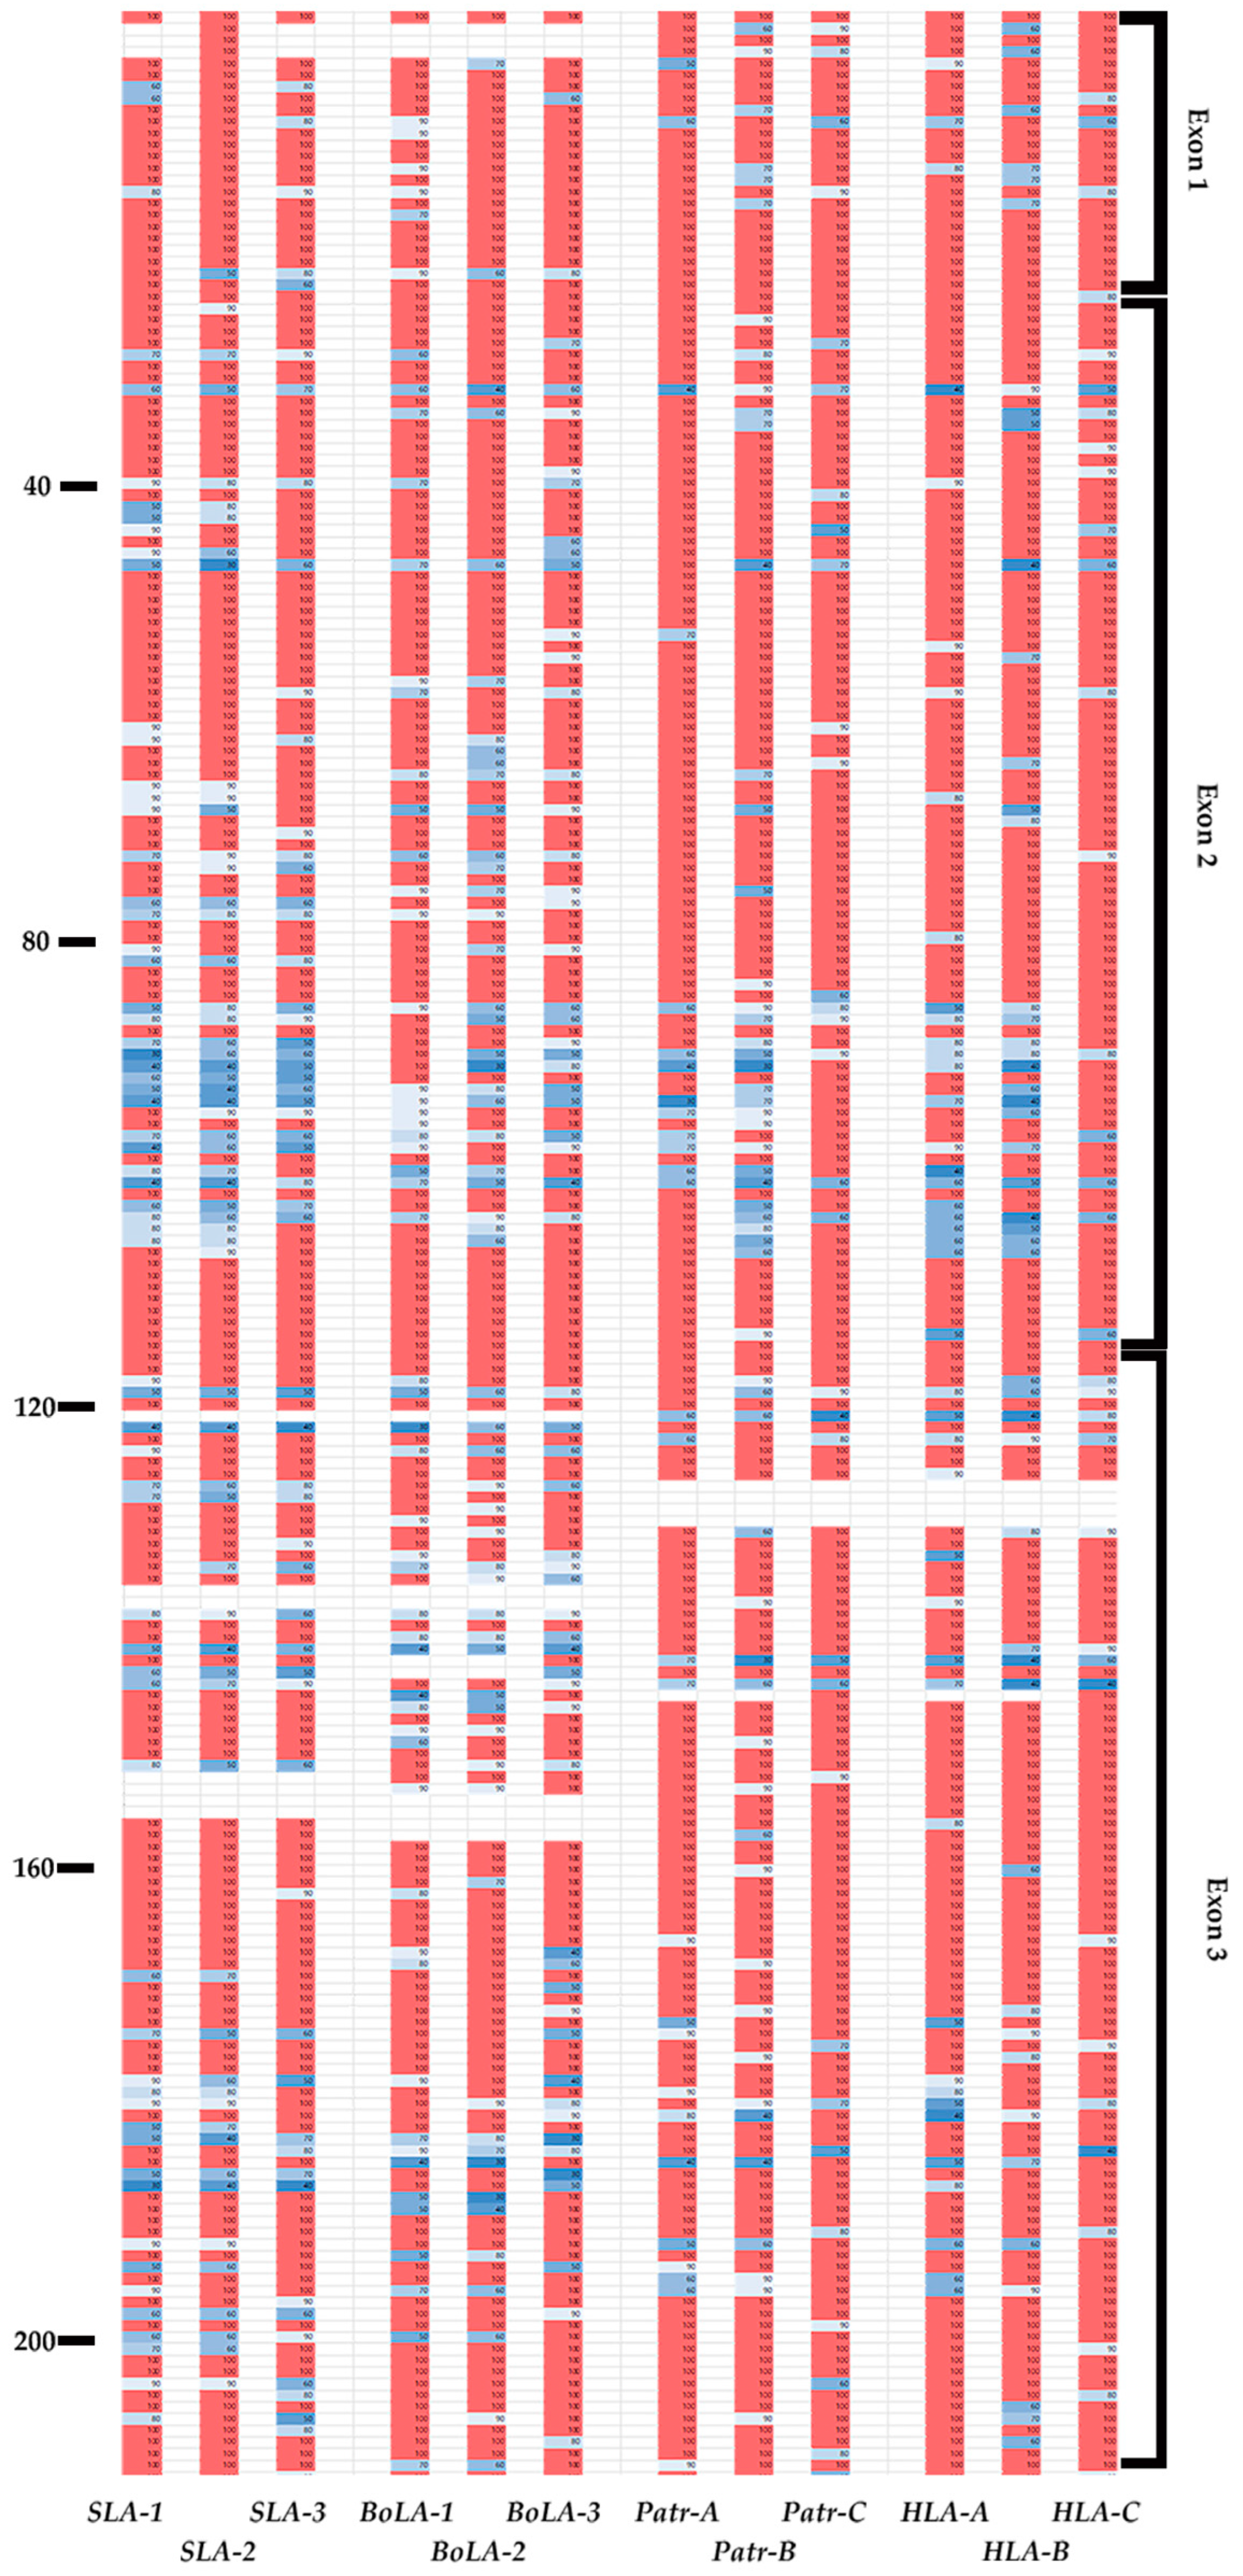
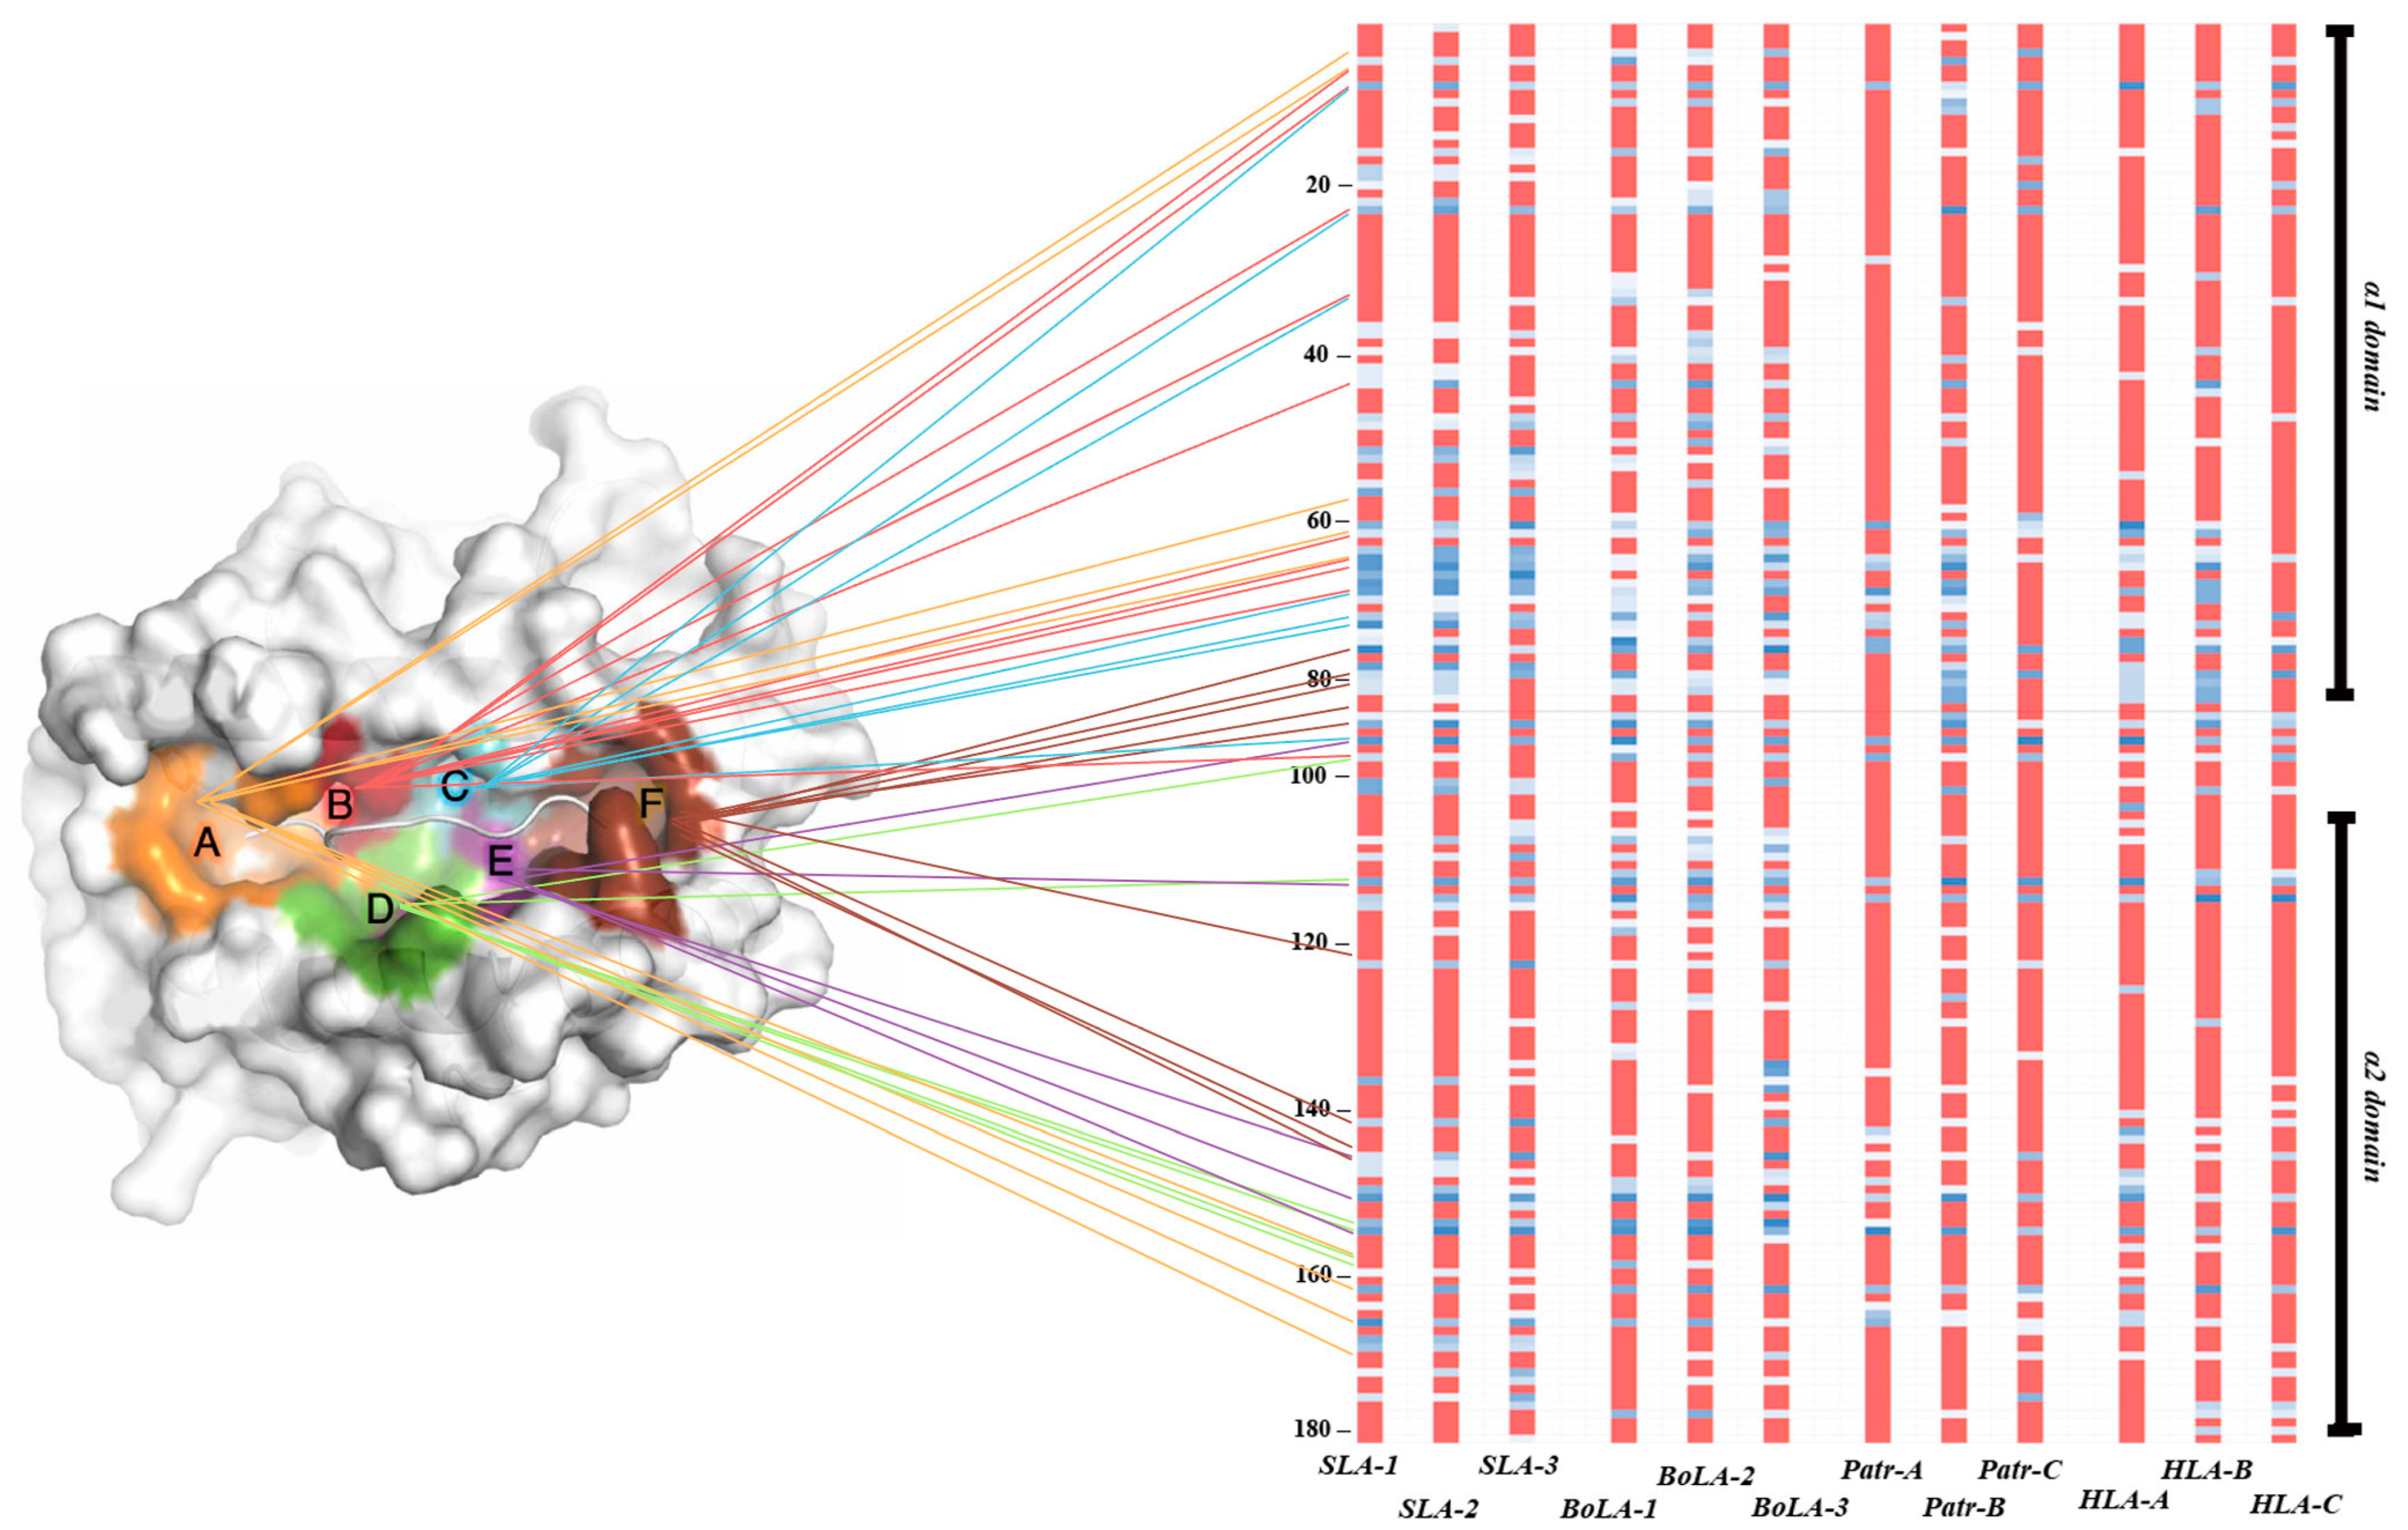
We analyzed inter-species conservation of the amino-acid sequences of MHC class I proteins across pigs, cattle, chimpanzees, and humans (Figure 4 and Figure 5). Most amino-acid variations were found to be located between positions 86 and 115 in the α1 domain in exon 2 and positions 170 and 200 in the α2 domain in exon 3 (Figure 4). In the PBR, we observed the complete conservation of amino acids across all four species at positions 24–36, 82–92, and 117–134, which constitutes 23.76% (42 positions) of exons 2 and 3 (Figure 5). Among these conserved positions, seven (A pocket: positions 6, 58, and 158; B pocket: position 6; D pocket: position 158; and F pocket: positions 83, 122, and 145) were involved in peptide-binding. Except for positions 6 and 158, the remaining positions were involved in the formation of the A or F pockets. Gln in position 114 was conserved across all four species, whereas Asp in position 121 was conserved except for BoLA-2, which included Asn in this position. Glu in position 127 was conserved except for Patr-B, which included Glu, Gln, and Lys, and BoLA-2 Glu and Gln in this position. In SLA, positions 139, 146, and 152 showed complete conservation of Gln, Asp, and Glu across SLA-1, -2, and -3, respectively (Tables S8–S11). This was also observed in BoLA-1, BoLA-3, Patr-A, Patr-C, HLA-A, HLA-B, and HLA-C, except for BoLA-2, which included Ala and Patr-B, which included Ala and Pro in these positions.

3.7. Divergence Time of MHC Class I Genes between Artiodactyls and Primate Lineages

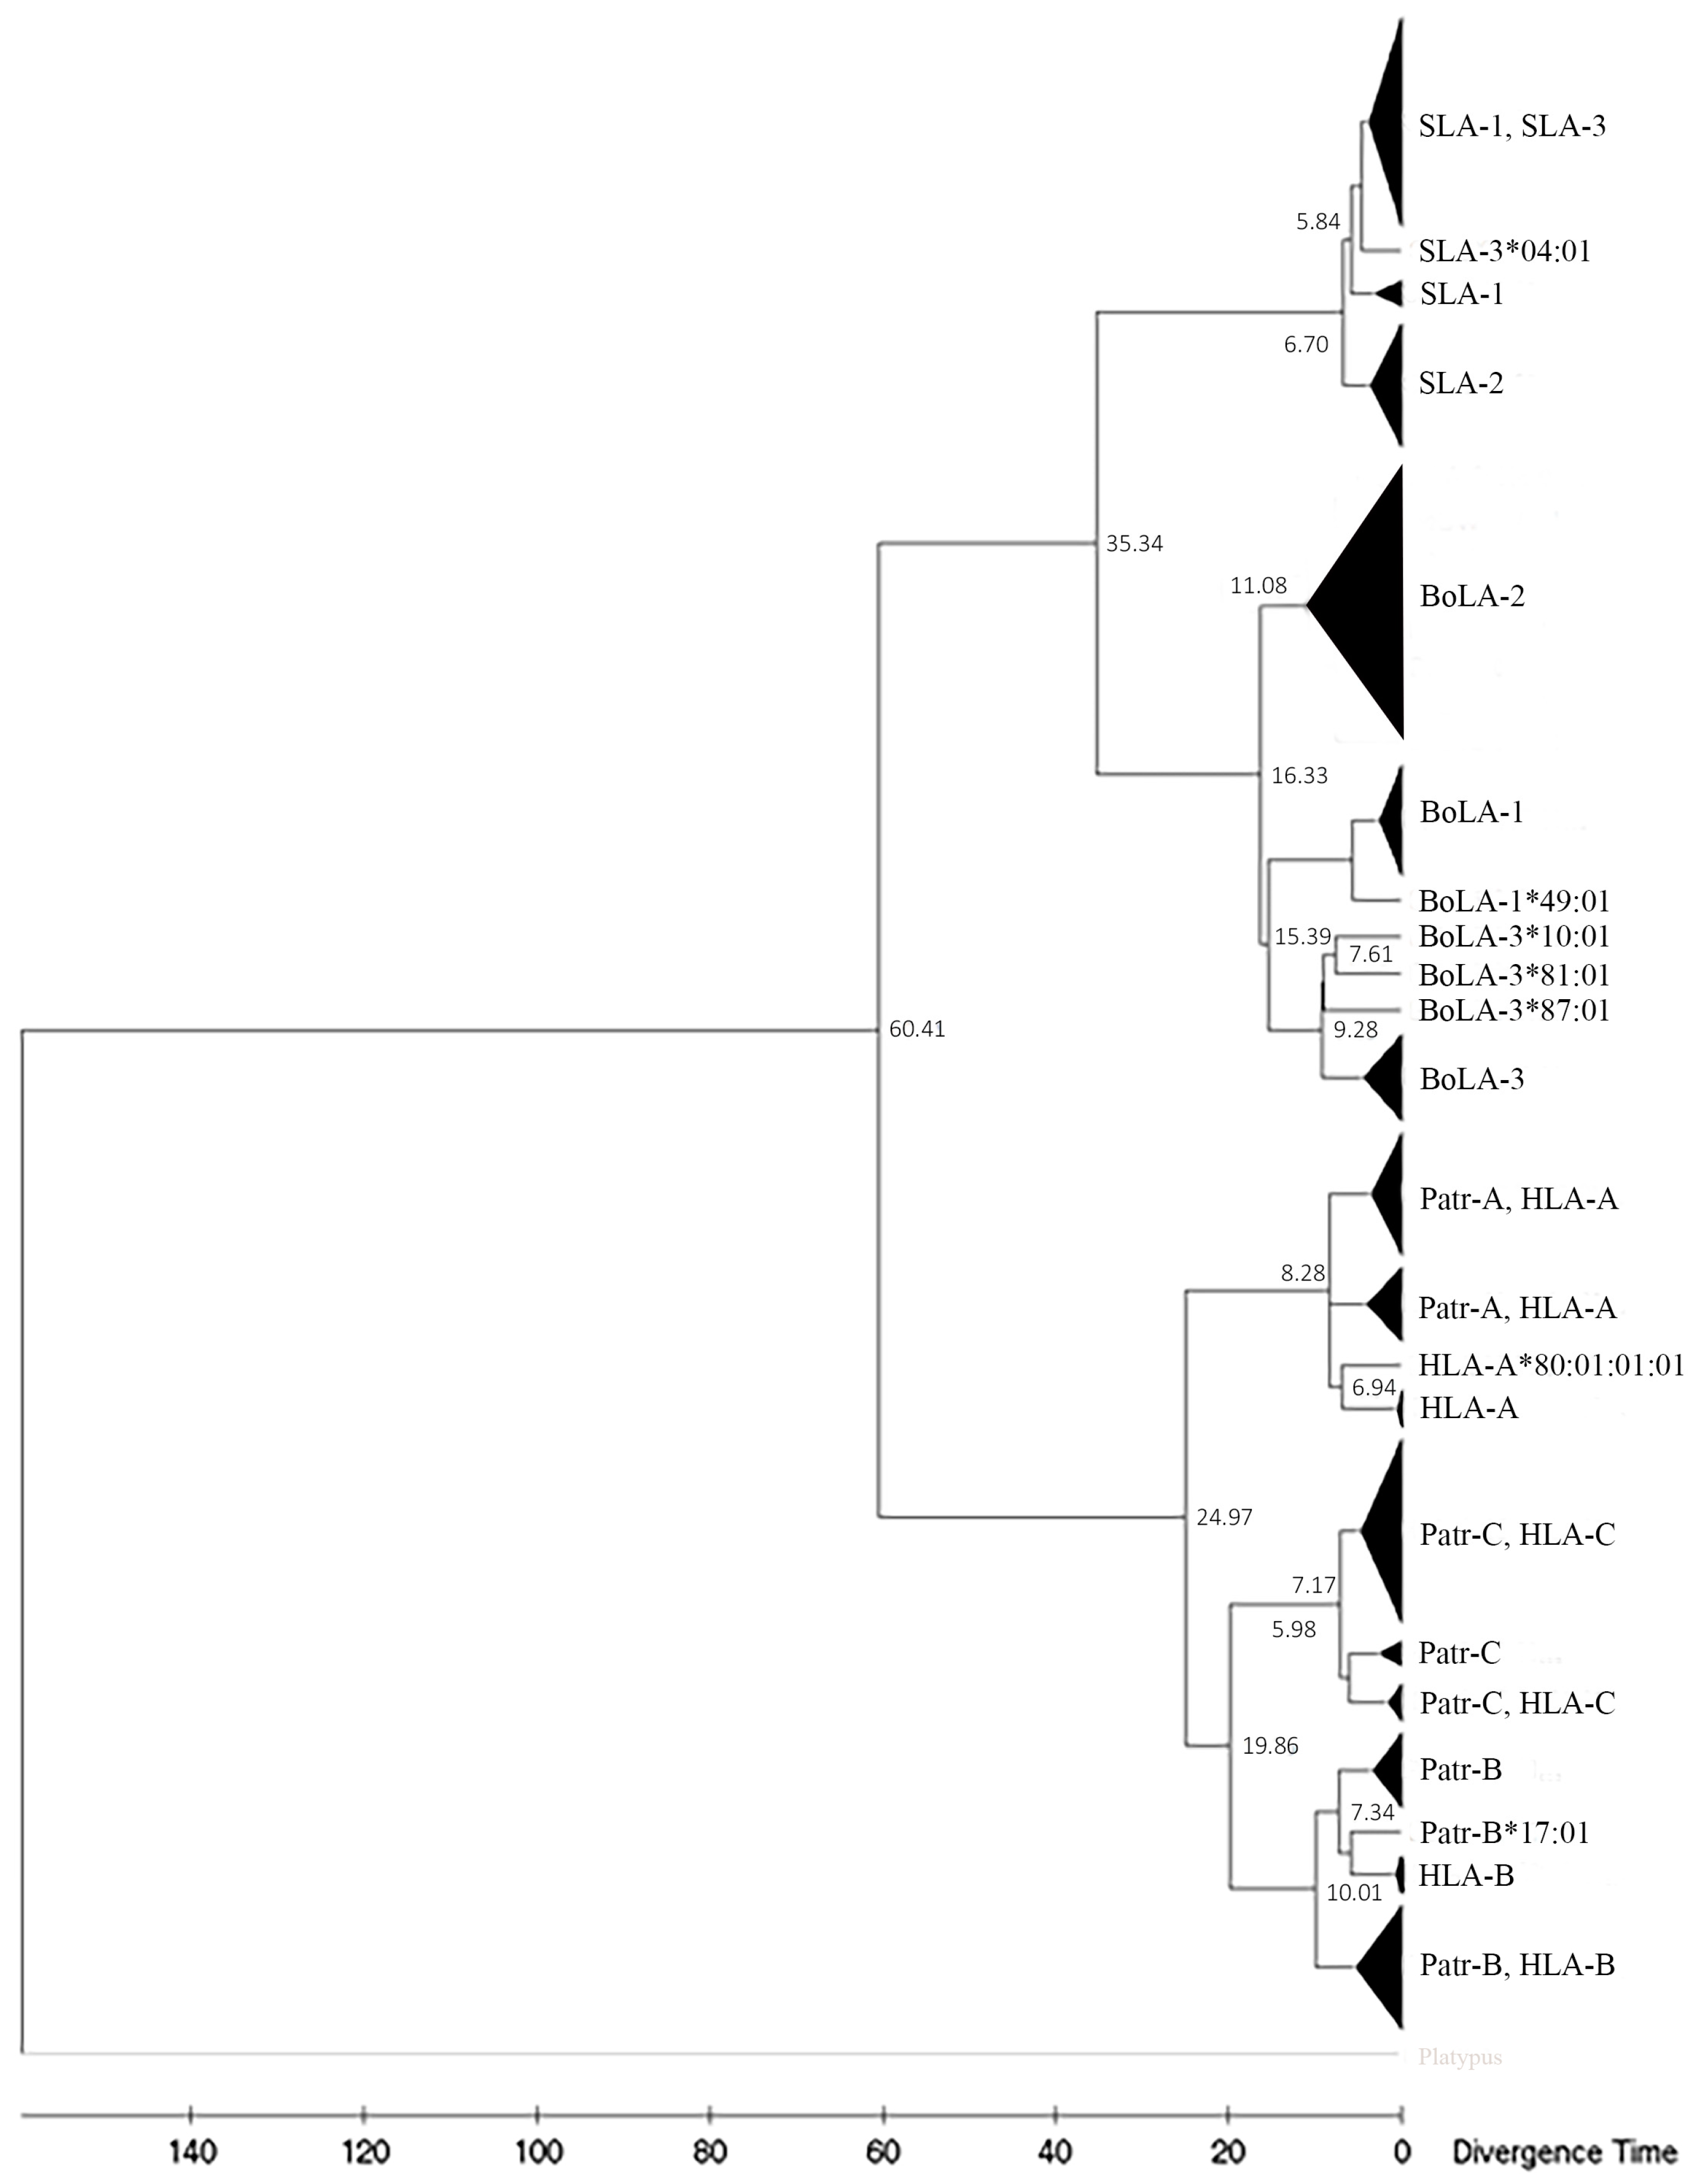
We estimated the divergence time of classical MHC class I genes in pigs, cattle, chimpanzees, sheep, and humans, along with platypus as an outgroup, using 131 non-PBR sequences consisting of 10 non-PBR sequences of different allelic groups for each gene (Figure 6). PBR was excluded to minimize the estimation bias from evolutionary forces on the MHC genes. The divergence between primate and artiodactyl MHC class I genes was estimated to be approximately 60.41 Mya. In the artiodactyl lineage, the separation of BoLA and SLA was estimated to be 35.34 Mya, and subsequently, BoLA-2 was estimated to be separated from the ancestral gene of BoLA-1 and BoLA-3 around 16.33 mya. The divergence between BoLA-1 and BoLA-3 was estimated to be 15.39 Mya. In pigs, the divergence of SLA-1, -2, and -3 occurred more recently around 6.70 Mya. In the primate lineage, the divergence of MHC-A (HLA-A, Patr-A, and related genes) from the common ancestral gene MHC-B (HLA-B, Patr-B, and related genes) and the MHC-C locus (HLA-C, Patr-C, and related genes) was estimated to be 24.97 Mya. The subsequent separation of MHC-B and MHC-C was estimated to be 19.86 Mya.

4. Discussion

Most studies on the evolution and diversity of MHC genes have centered on population studies within a single species under varying demographic or environmental conditions, highlighting the role of MHC genetic variation in resistance to pathogens and parasites and animal survival [16,17,18]. Previous studies have also suggested that MHC variability is driven by pathogen-driven selection, either through heterozygote advantage or frequency-dependent selection [58,59]. To this end, comparative analyses of MHC gene diversity and evolution across different species could offer valuable insights into the evolution of MHC genes. However, challenges in MHC allele typing due to extensive polymorphisms in MHC genes hamper the accumulation and interpretation of large-scale typing results from diverse species.
Here, we conducted a comparative analysis of genetic variations in three major MHC class I genes in pigs, cattle, chimpanzees, and humans. These species were chosen due to the relatively extensive amount of information available on their MHC genetic diversity. Despite unclear orthologous relationships among the paralogous MHC genes of these species, we compared sequence variations in the major classical MHC class I genes both within and across species. We confirmed that consistent with previous reports, the PBR of all analyzed MHC genes harbored much higher variability than non-PBRs across all analyzed species [60,61,62,63]. Additionally, our analysis revealed differences in genetic diversity among the MHC class I genes of different species, showing more substitution sites in classical MHC class I genes in pigs and cattle compared to humans and chimpanzees when an equal number of allelic groups from the IPD were analyzed. Our results may have been affected by a bias in assigning allelic groups of MHC class I genes to different species. However, because the number of allelic groups (n = 20) used in this study represents most of the allelic groups reported for the analyzed species, we reasoned that our results represent the evolutionary consequences of MHC class I genes in these species. Furthermore, the analysis results from the sequences of all allelic groups (n = 36) in HLA-B were consistent with those obtained using 20 allelic groups (Table S4), supporting the hypothesis that the rate of nonsynonymous substitution was higher in artiodactyls than in hominid species, raising questions regarding the underlying mechanism.
It is noteworthy that pigs and cattle exhibit a higher rate of nonsynonymous substitutions in the PBR of MHC class I genes than humans and chimpanzees despite the identical role of MHC in antigen recognition across mammals. Only several differences in the adaptive immune system between the two groups have been reported, including a larger number of γ delta T-cells in pigs and cattle than in humans [64,65,66], yet it remains unclear whether such differences could be related to the genetic diversity of MHC genes. Previous studies have indicated that the number of MHC alleles and their genetic diversity are not always correlated, as demonstrated by a high degree of divergence between MHC alleles in bottlenecked species such as Przewalski’s horse, Arabian oryx, and South African bontebok, despite their low allele numbers [67,68,69]. Certain promiscuous MHC molecules can bind to a much wider range of peptides or show an elevated peptide-binding repertoire than others and, therefore, promote immune responses against a broad range of pathogens. This is a complex aspect of the genetic diversity of MHC [70,71]. Manczinger et al. [72] demonstrated a direct relationship between MHC diversity and pathogens, revealing high levels of promiscuous HLA alleles in Southeast Asia, an important hotspot for emerging infectious diseases.
The diversity of MHC molecules should also be related to the diversity of pathogens that infect a species. Therefore, the increased number of substitution sites and rate of nonsynonymous substitution in the PBR of artiodactyl compared to hominid species may indicate the presence of larger pathogen diversity in the former than in the latter. Environmental conditions, such as habitats with a lower chance of pathogen exposure, might have influenced the reduction of antigenic repertoires and resulted in the lower genetic diversity of HLA and Patr compared to SLA and BoLA. However, no clear evidence supporting this hypothesis has been obtained to date.
Our phylogenetic analysis of HLA and Patr MHC I sequences revealed trans-species polymorphisms in MHC, which are often ancient and predate speciation events. Several class I MHC alleles from humans and chimpanzees belong to the allelic lineage that has persisted since before these two species diverged 5–7 Mya (Figure 6) [73,74,75]. However, none of the class I MHC alleles of SLA and BoLA formed shared clusters, consistent withtheir later divergence, 35.34 Mya, after the speciation of pigs and cattle 60 Mya [76].
Theoretically, under identical selection pressure, the level of genetic diversity of orthologous genes should be the same between two mammalian sublineages. Although accurate assessments of the evolutionary forces affecting the genetic diversity of MHC genes are best conducted in free-ranging animal populations in their natural environments, our results nevertheless imply that the number of variable sites in MHC class I genes is significantly higher in SLA and BoLA than in Patr and HLA. This may indicate differences in selective pressures, population structures, or genetic diversity between these two lineages.
Gene duplication, mutation, or other processes can generate new genes and alleles and, therefore, increase genetic variation [77,78]. New genetic variations can emerge within generations in a population, and populations with rapid reproductive rates are likely to exhibit high genetic variation. The shorter generation intervals in artiodactyl species compared to hominid species may contribute to the higher genetic variation observed in SLA and BoLA MHC class I genes.
Here, we observed the conservation of several polymorphic sites within the peptide-binding region of paralogous MHC class I proteins of the same species and among orthologous proteins of different species. These conserved sites are likely important for the function of MHC molecules. For example, the conserved amino-acid positions 114, 121, and 127 have been reported to be crucial for interactions between HLA class I molecules and CD8+ T-cells [79]. Understanding the functional roles of other conserved sites in the PBR across different species in this study could help delineate the interactions between MHC molecules and antigenic peptides as well.
In conclusion, we compared the genetic diversity of MHC class I paralogous and orthologous genes of pigs, cattle, humans, and chimpanzees using representative sequences of diverse allelic groups. We identified characteristics of MHC diversity between artiodactyl and hominid species. These findings stem from comparative analyses conducted on the largest collection of MHC alleles to date, encompassing numerous allelic groups across multiple species. Additionally, we identified potentially important amino-acid residues crucial for the function of MHC class I molecules in the adaptive immune system of mammals. The insights gained from this study enhance our understanding of the conservation and diversity of MHC class I genes across different mammalian species.

Supplementary Materials

The following supporting information can be downloaded at: https://www.mdpi.com/article/10.3390/genes15010007/s1, Figure S1: Alignment of the exons 2 and 3 sequences (546 bp) of 238 representative MHC class I alleles of 20 different allelic groups for each gene from pigs, cattle, chimpanzees, and humans together with a platypus sequence; Table S1: The number of annotated alleles for each MHC class I gene of pigs, cattle, sheep, chimpanzees, and humans available in IPD; Table S2 The list of alleles in different allelic groups of MHC class I genes from different species; Table S3: Pairwise nucleotide sequence differences in the exons 2 and 3 region of the classical MHC class I genes of pigs, cattle, chimpanzees, and humans; Table S4: Comparison of the levels of estimated genetic diversity for classical MHC class I genes of humans, chimpanzees, cattle and pigs between the analysis using all allelic groups and 20 representative allelic groups; Table S5: Identified variable sites for the peptide-binding region of classical MHC class I genes of pigs, cattle, sheep, chimpanzee, and human; Table S6: Identified peptide-binding pockets of MHC class I proteins based on the structure of HLA class I; Table S7: Comparison of the amino-acid sequence diversity among the predicted peptide-binding pocket sites of classical MHC class I genes of pigs, cattle, chimpanzee, and human; Table S8: The frequency of amino acid of PBR from BoLA-2 selected 20 alleles; Table S9: The frequency of amino acid of PBR from SLA-1 selected 20 alleles; Table S10: The frequency of amino acid of PBR from SLA-2 selected 20 alleles; Table S11. The frequency of amino acids in the PBR from SLA-3 was selected as 20 alleles.

Author Contributions

Conceptualization, C.P. and Y.K.; methodology, S.Y., M.K., B.A. and C.P.; investigation, S.Y. and Y.K.; data curation, S.Y. and B.A.; writing—original draft preparation, S.Y. and C.P.; visualization, S.Y.; project administration, C.P.; funding acquisition, C.P. All authors have read and agreed to the published version of the manuscript.

Funding

This research was supported by a National Research Foundation of Korea (NRF) grant funded by the Korean Government (MSIT) (grant number 2021R1A2C3010505), Cooperative Research Program for Agriculture Science and Technology Development (project no. PJ016221), the Rural Development Administration, Republic of Korea, and the Konkuk University Researcher Fund in 2022.

Institutional Review Board Statement

Not applicable.

Informed Consent Statement

Not applicable.

Data Availability Statement

Data are contained within the article and Supplementary Materials.

Conflicts of Interest

The authors declare no conflict of interest.

References

  1. Trowsdale, J. Both man & bird & beast: Comparative organization of MHC genes. Immunogenetics 1995, 41, 1–17. [Google Scholar] [CrossRef] [PubMed]
  2. Flajnik, M.F.; Kasahara, M. Comparative genomics of the MHC: Glimpses into the evolution of the adaptive immune system. Immunity 2001, 15, 351–362. [Google Scholar] [CrossRef] [PubMed]
  3. Kulski, J.K.; Shiina, T.; Anzai, T.; Kohara, S.; Inoko, H. Comparative genomic analysis of the MHC: The evolution of class I duplication blocks, diversity and complexity from shark to man. Immunol. Rev. 2002, 190, 95–122. [Google Scholar] [CrossRef] [PubMed]
  4. Benacerraf, B. Role of MHC gene products in immune regulation. Science 1981, 212, 1229–1238. [Google Scholar] [CrossRef] [PubMed]
  5. Lechler, R.; Batchelor, R.; Lombardi, G. The relationship between MHC restricted and allospecific T cell recognition. Immunol. Lett. 1991, 29, 41–50. [Google Scholar] [CrossRef] [PubMed]
  6. Ting, J.P.-Y.; Trowsdale, J. Genetic Control of MHC Class II Expression. Cell 2002, 109, S21–S33. [Google Scholar] [CrossRef]
  7. Sette, A.; Sidney, J. Nine major HLA class I supertypes account for the vast preponderance of HLA-A and-B polymorphism. Immunogenetics 1999, 50, 201–212. [Google Scholar] [CrossRef]
  8. Sidney, J.; Peters, B.; Frahm, N.; Brander, C.; Sette, A. HLA class I supertypes: A revised and updated classification. BMC Immunol. 2008, 9, 1. [Google Scholar] [CrossRef]
  9. Trägärdh, L.; Rask, L.; Wiman, K.; Fohlman, J.; Peterson, P.A. Amino acid sequence of an immunoglobulin-like HLA antigen heavy chain domain. Proc. Natl. Acad. Sci. USA 1979, 76, 5839–5842. [Google Scholar] [CrossRef]
  10. Bjorkman, P.J.; Saper, M.A.; Samraoui, B.; Bennett, W.S.; Strominger, J.T.; Wiley, D.C. Structure of the human class I histocompatibility antigen, HLA-A2. Nature 1987, 329, 506–512. [Google Scholar] [CrossRef]
  11. Nikolich-Zugich, J.; Fremont, D.H.; Miley, M.J.; Messaoudi, I. The role of mhc polymorphism in anti-microbial resistance. Microbes Infect. 2004, 6, 501–512. [Google Scholar] [CrossRef] [PubMed]
  12. Hirano, M.; Das, S.; Guo, P.; Cooper, M.D. Chapter 4—The Evolution of Adaptive Immunity in Vertebrates. In Advances in Immunology; Alt, F.W., Ed.; Academic Press: Cambridge, MA, USA, 2011; Volume 109, pp. 125–157. [Google Scholar]
  13. Lu, X.; Wu, S.; Blackwell, C.E.; Humphreys, R.E.; Von Hofe, E.; Xu, M. Suppression of major histocompatibility complex class II-associated invariant chain enhances the potency of an HIV gp120 DNA vaccine. Immunology 2007, 120, 207–216. [Google Scholar] [CrossRef] [PubMed]
  14. Kubinak, J.L.; Ruff, J.S.; Hyzer, C.W.; Slev, P.R.; Potts, W.K. Experimental viral evolution to specific host MHC genotypes reveals fitness and virulence trade-offs in alternative MHC types. Proc. Natl. Acad. Sci. USA 2012, 109, 3422–3427. [Google Scholar] [CrossRef]
  15. MacKay, K.; Eyre, S.; Myerscough, A.; Milicic, A.; Barton, A.; Laval, S.; Barrett, J.; Lee, D.; White, S.; John, S.; et al. Whole-genome linkage analysis of rheumatoid arthritis susceptibility loci in 252 affected sibling pairs in the United Kingdom. Arthritis Rheum. 2002, 46, 632–639. [Google Scholar] [CrossRef]
  16. Takeshima, S.-N.; Corbi-Botto, C.; Giovambattista, G.; Aida, Y. Genetic diversity of BoLA-DRB3 in South American Zebu cattle populations. BMC Genet. 2018, 19, 33. [Google Scholar] [CrossRef] [PubMed]
  17. Satapornpong, P.; Jinda, P.; Jantararoungtong, T.; Koomdee, N.; Chaichan, C.; Pratoomwun, J.; Na Nakorn, C.; Aekplakorn, W.; Wilantho, A.; Ngamphiw, C.; et al. Genetic Diversity of HLA Class I and Class II Alleles in Thai Populations: Contribution to Genotype-Guided Therapeutics. Front. Pharmacol. 2020, 11, 78. [Google Scholar] [CrossRef]
  18. Le, M.T.; Choi, H.; Lee, H.; Le, V.C.Q.; Ahn, B.; Ho, C.-S.; Hong, K.; Song, H.; Kim, J.-H.; Park, C. SLA-1 Genetic Diversity in Pigs: Extensive Analysis of Copy Number Variation, Heterozygosity, Expression, and Breed Specificity. Sci. Rep. 2020, 10, 743. [Google Scholar] [CrossRef]
  19. Tsuji, K.; Aizawa, M.; Sasazuki, T. HLA 1991: In Proceedings of the Eleventh International Histocompatibility Workshop and Conference, Yokohama, Japan, 6–13 November 1991; Oxford University Press: Oxford, UK, 1992; Volume 2. [Google Scholar]
  20. Nei, M.; Gu, X.; Sitnikova, T. Evolution by the birth-and-death process in multigene families of the vertebrate immune system. Proc. Natl. Acad. Sci. USA 1997, 94, 7799–7806. [Google Scholar] [CrossRef]
  21. Basham, T.Y.; Nickoloff, B.J.; Merigan, T.C.; Morhenn, V.B. Recombinant gamma interferon induces HLA-DR expression on cultured human keratinocytes. J. Investig. Dermatol. 1984, 83, 88–90. [Google Scholar] [CrossRef]
  22. Palankar, R.; Skirtach, A.G.; Kreft, O.; Bedard, M.; Garstka, M.; Gould, K.; Mohwald, H.; Sukhorukov, G.B.; Winterhalter, M.; Springer, S. Controlled intracellular release of peptides from microcapsules enhances antigen presentation on MHC class I molecules. Small 2009, 5, 2168–2176. [Google Scholar] [CrossRef]
  23. Takahata, N.; Nei, M. Allelic genealogy under overdominant and frequency-dependent selection and polymorphism of major histocompatibility complex loci. Genetics 1990, 124, 967–978. [Google Scholar] [CrossRef] [PubMed]
  24. Hughes, A.L.; Nei, M. Pattern of nucleotide substitution at major histocompatibility complex class I loci reveals overdominant selection. Nature 1988, 335, 167–170. [Google Scholar] [CrossRef] [PubMed]
  25. Hughes, A.L.; Nei, M. Evolution of the major histocompatibility complex: Independent origin of nonclassical class I genes in different groups of mammals. Mol. Biol. Evol. 1989, 6, 559–579. [Google Scholar] [CrossRef] [PubMed]
  26. Zeng, Q.-Q.; He, K.; Sun, D.-D.; Ma, M.-Y.; Ge, Y.-F.; Fang, S.-G.; Wan, Q.-H. Balancing selection and recombination as evolutionary forces caused population genetic variations in golden pheasant MHC class I genes. BMC Evol. Biol. 2016, 16, 42. [Google Scholar] [CrossRef] [PubMed]
  27. Lee, C.; Moroldo, M.; Perdomo-Sabogal, A.; Mach, N.; Marthey, S.; Lecardonnel, J.; Wahlberg, P.; Chong, A.Y.; Estellé, J.; Ho, S.Y.W.; et al. Inferring the evolution of the major histocompatibility complex of wild pigs and peccaries using hybridisation DNA capture-based sequencing. Immunogenetics 2018, 70, 401–417. [Google Scholar] [CrossRef] [PubMed]
  28. Babiuk, S.; Horseman, B.; Zhang, C.; Bickis, M.; Kusalik, A.; Schook, L.B.; Abrahamsen, M.S.; Pontarollo, R. BoLA class I allele diversity and polymorphism in a herd of cattle. Immunogenetics 2007, 59, 167–176. [Google Scholar] [CrossRef] [PubMed]
  29. Sckisel, G.D.; Bouchlaka, M.N.; Monjazeb, A.M.; Crittenden, M.; Curti, B.D.; Wilkins, D.E.; Alderson, K.A.; Sungur, C.M.; Ames, E.; Mirsoian, A.; et al. Out-of-Sequence Signal 3 Paralyzes Primary CD4(+) T-Cell-Dependent Immunity. Immunity 2015, 43, 240–250. [Google Scholar] [CrossRef] [PubMed]
  30. Svitek, N.; Nzau, B.; Steinaa, L.; Nene, V. A method to discriminate between closely related bovine major histocompatibility complex class I alleles by combining established PCR-SSP assays with RFLPs. Tissue Antigens 2015, 85, 278–282. [Google Scholar] [CrossRef]
  31. Adams, E.J.; Cooper, S.; Parham, P. A novel, nonclassical MHC class I molecule specific to the common chimpanzee. J. Immunol. 2001, 167, 3858–3869. [Google Scholar] [CrossRef]
  32. Anzai, T.; Shiina, T.; Kimura, N.; Yanagiya, K.; Kohara, S.; Shigenari, A.; Yamagata, T.; Kulski, J.K.; Naruse, T.K.; Fujimori, Y. Comparative sequencing of human and chimpanzee MHC class I regions unveils insertions/deletions as the major path to genomic divergence. Proc. Natl. Acad. Sci. USA 2003, 100, 7708–7713. [Google Scholar] [CrossRef]
  33. Geller, R.; Adams, E.J.; Guethlein, L.A.; Little, A.-M.; Madrigal, A.J.; Parham, P. Linkage of Patr-AL to Patr-A and-B in the major histocompatibility complex of the common chimpanzee (Pan troglodytes). Immunogenetics 2002, 54, 212–215. [Google Scholar] [CrossRef] [PubMed]
  34. Choi, H.; Le, M.T.; Lee, H.; Choi, M.K.; Cho, H.S.; Nagasundarapandian, S.; Kwon, O.J.; Kim, J.H.; Seo, K.; Park, J.K.; et al. Sequence variations of the locus-specific 5’ untranslated regions of SLA class I genes and the development of a comprehensive genomic DNA-based high-resolution typing method for SLA-2. Tissue Antigens 2015, 86, 255–266. [Google Scholar] [CrossRef] [PubMed]
  35. Le, M.; Choi, H.; Choi, M.K.; Cho, H.; Kim, J.H.; Seo, H.G.; Cha, S.Y.; Seo, K.; Dadi, H.; Park, C. Development of a simultaneous high resolution typing method for three SLA class II genes, SLA-DQA, SLA-DQB1, and SLA-DRB1 and the analysis of SLA class II haplotypes. Gene 2015, 564, 228–232. [Google Scholar] [CrossRef] [PubMed]
  36. Youk, S.; Le, M.T.; Kang, M.; Ahn, B.; Choi, M.; Kim, K.; Kim, T.H.; Kim, J.H.; Ho, C.S.; Park, C. Development of a high-resolution typing method for SLA-3, swine MHC class I antigen 3. Anim. Genet. 2022, 53, 166–170. [Google Scholar] [CrossRef] [PubMed]
  37. Sawhney, S.M.S.; Taylor, D.W.; Russell, G.C. Polymorphism of bovine major histocompatibility complex (MHC) class I genes revealed by polymerase chain reaction (PCR) and restriction enzyme analysis. Anim. Genet. 2001, 32, 27–31. [Google Scholar] [CrossRef] [PubMed]
  38. Ellis, S.A.; Staines, K.A.; Stear, M.J.; Hensen, E.J.; Morrison, W.I. DNA typing for BoLA class I using sequence-specific primers (PCR-SSP). Eur. J. Immunogenet. 1998, 25, 365–370. [Google Scholar] [CrossRef] [PubMed]
  39. Ellis, S.A.; Holmes, E.C.; Staines, K.A.; Smith, K.B.; Stear, M.J.; McKeever, D.J.; MacHugh, N.D.; Morrison, W.I. Variation in the number of expressed MHC genes in different cattle class I haplotypes. Immunogenetics 1999, 50, 319–328. [Google Scholar] [CrossRef] [PubMed]
  40. Boyson, J.E.; Shufflebotham, C.; Cadavid, L.F.; Urvater, J.A.; Knapp, L.A.; Hughes, A.L.; Watkins, D.I. The MHC class I genes of the rhesus monkey. Different evolutionary histories of MHC class I and II genes in primates. J. Immunol. 1996, 156, 4656–4665. [Google Scholar] [CrossRef]
  41. Wroblewski, E.E.; Parham, P.; Guethlein, L.A. Two to tango: Co-evolution of hominid natural killer cell receptors and MHC. Front. Immunol. 2019, 10, 177. [Google Scholar] [CrossRef]
  42. Klein, J.; Figueroa, F. Evolution of the major histocompatibility complex. Crit. Rev. Immunol. 1986, 6, 295–386. [Google Scholar] [CrossRef]
  43. Lawlor, D.A.; Ward, F.E.; Ennis, P.D.; Jackson, A.P.; Parham, P. HLA-A and B polymorphisms predate the divergence of humans and chimpanzees. Nature 1988, 335, 268–271. [Google Scholar] [CrossRef] [PubMed]
  44. McAdam, S.N.; Boyson, J.E.; Liu, X.; Garber, T.L.; Hughes, A.L.; Bontrop, R.E.; Watkins, D.I. A uniquely high level of recombination at the HLA-B locus. Proc. Natl. Acad. Sci. USA 1994, 91, 5893–5897. [Google Scholar] [CrossRef] [PubMed]
  45. Adams, E.J.; Thomson, G.; Parham, P. Evidence for an HLA-C-like locus in the orangutan Pongo pygmaeus. Immunogenetics 1999, 49, 865–871. [Google Scholar] [PubMed]
  46. Fukami-Kobayashi, K.; Shiina, T.; Anzai, T.; Sano, K.; Yamazaki, M.; Inoko, H.; Tateno, Y. Genomic evolution of MHC class I region in primates. Proc. Natl. Acad. Sci. USA 2005, 102, 9230–9234. [Google Scholar] [CrossRef] [PubMed]
  47. Ho, C.S.; Franzo-Romain, M.H.; Lee, Y.J.; Lee, J.H.; Smith, D.M. Sequence-based characterization of swine leucocyte antigen alleles in commercially available porcine cell lines. Int. J. Immunogenet. 2009, 36, 231–234. [Google Scholar] [CrossRef] [PubMed]
  48. Davies, C.J.; Andersson, L.; Mikko, S.; Ellis, S.A.; Hensen, E.J.; Lewin, H.A.; Muggli-Cockett, N.E.; Poel, J.J.V.D.; Russell, G.C. Nomenclature for factors of the BoLA system, 1996: Report of the ISAG BoLA Nomenclature Committee. Anim. Genet. 1997, 28, 159–168. [Google Scholar] [CrossRef]
  49. Maccari, G.; Robinson, J.; Bontrop, R.E.; Otting, N.; de Groot, N.G.; Ho, C.-S.; Ballingall, K.T.; Marsh, S.G.E.; Hammond, J.A. IPD-MHC: Nomenclature requirements for the non-human major histocompatibility complex in the next-generation sequencing era. Immunogenetics 2018, 70, 619–623. [Google Scholar] [CrossRef]
  50. Marsh, S.G.E.; Albert, E.D.; Bodmer, W.F.; Bontrop, R.E.; Dupont, B.; Erlich, H.A.; Fernández-Viña, M.; Geraghty, D.E.; Holdsworth, R.; Hurley, C.K.; et al. Nomenclature for factors of the HLA system, 2010. Tissue Antigens 2010, 75, 291–455. [Google Scholar] [CrossRef]
  51. Tamura, K.; Stecher, G.; Kumar, S. MEGA11: Molecular Evolutionary Genetics Analysis Version 11. Mol. Biol. Evol. 2021, 38, 3022–3027. [Google Scholar] [CrossRef]
  52. Cock, P.J.A.; Antao, T.; Chang, J.T.; Chapman, B.A.; Cox, C.J.; Dalke, A.; Friedberg, I.; Hamelryck, T.; Kauff, F.; Wilczynski, B.; et al. Biopython: Freely available Python tools for computational molecular biology and bioinformatics. Bioinformatics 2009, 25, 1422–1423. [Google Scholar] [CrossRef]
  53. Garcia-Boronat, M.; Diez-Rivero, C.M.; Reinherz, E.L.; Reche, P.A. PVS: A web server for protein sequence variability analysis tuned to facilitate conserved epitope discovery. Nucleic Acids Res. 2008, 36, W35–W41. [Google Scholar] [CrossRef] [PubMed]
  54. Rozas, J.; Ferrer-Mata, A.; Sánchez-DelBarrio, J.C.; Guirao-Rico, S.; Librado, P.; Ramos-Onsins, S.E.; Sánchez-Gracia, A. DnaSP 6: DNA Sequence Polymorphism Analysis of Large Data Sets. Mol. Biol. Evol. 2017, 34, 3299–3302. [Google Scholar] [CrossRef] [PubMed]
  55. Mahmud, A.K.M.F.; Delhomme, N.; Nandi, S.; Fällman, M. ProkSeq for complete analysis of RNA-Seq data from prokaryotes. Bioinformatics 2021, 37, 126–128. [Google Scholar] [CrossRef] [PubMed]
  56. Chujoh, Y.; Sobao, Y.; Miwa, K.; Kaneko, Y.; Takiguchi, M. The role of anchor residues in the binding of peptides to HLA-A* 1101 molecules. Tissue Antigens 1998, 52, 501–509. [Google Scholar] [CrossRef] [PubMed]
  57. Nguyen, A.T.; Szeto, C.; Gras, S. The pockets guide to HLA class I molecules. Biochem. Soc. Trans. 2021, 49, 2319–2331. [Google Scholar] [CrossRef] [PubMed]
  58. Sommer, S. The importance of immune gene variability (MHC) in evolutionary ecology and conservation. Front. Zool. 2005, 2, 16. [Google Scholar] [CrossRef] [PubMed]
  59. Apanius, V.; Penn, D.; Slev, P.R.; Ruff, L.R.; Potts, W.K. The Nature of Selection on the Major Histocompatibility Complex. Crit. Rev. Immunol. 1997, 17, 179–224. [Google Scholar] [CrossRef]
  60. Reche, P.A.; Reinherz, E.L. Sequence Variability Analysis of Human Class I and Class II MHC Molecules: Functional and Structural Correlates of Amino Acid Polymorphisms. J. Mol. Biol. 2003, 331, 623–641. [Google Scholar] [CrossRef]
  61. Bernatchez, L.; Landry, C. MHC studies in nonmodel vertebrates: What have we learned about natural selection in 15 years? J. Evol. Biol. 2003, 16, 363–377. [Google Scholar] [CrossRef]
  62. Gaudieri, S.; Dawkins, R.L.; Habara, K.; Kulski, J.K.; Gojobori, T. SNP Profile within the Human Major Histocompatibility Complex Reveals an Extreme and Interrupted Level of Nucleotide Diversity. Genome Res. 2000, 10, 1579–1586. [Google Scholar] [CrossRef]
  63. Cruz-López, M.; Fernández, G.; Hipperson, H.; Palacios, E.; Cavitt, J.; Galindo-Espinosa, D.; Gómez del Angel, S.; Pruner, R.; Gonzalez, O.; Burke, T.; et al. Allelic diversity and patterns of selection at the major histocompatibility complex class I and II loci in a threatened shorebird, the Snowy Plover (Charadrius nivosus). BMC Evol. Biol. 2020, 20, 114. [Google Scholar] [CrossRef] [PubMed]
  64. Mackay, C.R.; Hein, W.R. A large proportion of bovine T cells express the γδ T cell receptor and show a distinct tissue distribution and surface phenotype. Int. Immunol. 1989, 1, 540–545. [Google Scholar] [CrossRef] [PubMed]
  65. Šinkora, M.; Butler, J.E. The ontogeny of the porcine immune system. Dev. Comp. Immunol. 2009, 33, 273–283. [Google Scholar] [CrossRef] [PubMed]
  66. Born, W.; Cady, C.; Jones-Carson, J.; Mukasa, A.; Lahn, M.; O’brien, R. Immunoregulatory Functions of γδ T Cells. In Advances in Immunology; Dixon, F.J., Ed.; Academic Press: Cambridge, MA, USA, 1998; Volume 71, pp. 77–144. [Google Scholar]
  67. Sommer, S.; Hommen, U. Modelling the effects of life-history traits and changing ecological conditions on the population dynamics and persistence of the endangered Malagasy giant jumping rat (Hypogeomys antimena). Anim. Conserv. Forum 2000, 3, 333–343. [Google Scholar] [CrossRef]
  68. Sommer, S.; Volahy, A.T.; Seal, U.S. A population and habitat viability assessment for the highly endangered giant jumping rat (Hypogeomys antimena), the largest extant endemic rodent of Madagascar. Anim. Conserv. Forum 2002, 5, 263–273. [Google Scholar] [CrossRef]
  69. Sommer, S. Effects of habitat fragmentation and changes of dispersal behaviour after a recent population decline on the genetic variability of noncoding and coding DNA of a monogamous Malagasy rodent. Mol. Ecol. 2003, 12, 2845–2851. [Google Scholar] [CrossRef]
  70. Chappell, P.E.; Meziane, E.K.; Harrison, M.; Magiera, Ł.; Hermann, C.; Mears, L.; Wrobel, A.G.; Durant, C.; Nielsen, L.L.; Buus, S.; et al. Expression levels of MHC class I molecules are inversely correlated with promiscuity of peptide binding. eLife 2015, 4, e05345. [Google Scholar] [CrossRef]
  71. Kaufman, J. Generalists and Specialists: A New View of How MHC Class I Molecules Fight Infectious Pathogens. Trends Immunol. 2018, 39, 367–379. [Google Scholar] [CrossRef]
  72. Manczinger, M.; Boross, G.; Kemény, L.; Müller, V.; Lenz, T.L.; Papp, B.; Pál, C. Pathogen diversity drives the evolution of generalist MHC-II alleles in human populations. PLoS Biol. 2019, 17, e3000131. [Google Scholar] [CrossRef]
  73. Leakey, M.G.; Feibel, C.S.; McDougall, I.; Ward, C.; Walker, A. New specimens and confirmation of an early age for Australopithecus anamensis. Nature 1998, 393, 62–66. [Google Scholar] [CrossRef]
  74. Glazko, G.V.; Nei, M. Estimation of Divergence Times for Major Lineages of Primate Species. Mol. Biol. Evol. 2003, 20, 424–434. [Google Scholar] [CrossRef] [PubMed]
  75. Kumar, S.; Filipski, A.; Swarna, V.; Walker, A.; Hedges, S.B. Placing confidence limits on the molecular age of the human–chimpanzee divergence. Proc. Natl. Acad. Sci. USA 2005, 102, 18842–18847. [Google Scholar] [CrossRef] [PubMed]
  76. Murphy, W.J.; Pevzner, P.A.; O’Brien, S.J. Mammalian phylogenomics comes of age. Trends Genet. 2004, 20, 631–639. [Google Scholar] [CrossRef] [PubMed]
  77. Force, A.; Lynch, M.; Pickett, F.B.; Amores, A.; Yan, Y.-L.; Postlethwait, J. Preservation of Duplicate Genes by Complementary, Degenerative Mutations. Genetics 1999, 151, 1531–1545. [Google Scholar] [CrossRef]
  78. van Oosterhout, C. A new theory of MHC evolution: Beyond selection on the immune genes. Proc. R. Soc. B Biol. Sci. 2008, 276, 657–665. [Google Scholar] [CrossRef]
  79. Salter, R.D.; Benjamin, R.J.; Wesley, P.K.; Buxton, S.E.; Garrett, T.P.J.; Clayberger, C.; Krensky, A.M.; Norment, A.M.; Littman, D.R.; Parham, P. A binding site for the T-cell co-receptor CD8 on the α3 domain of HLA-A2. Nature 1990, 345, 41–46. [Google Scholar] [CrossRef]
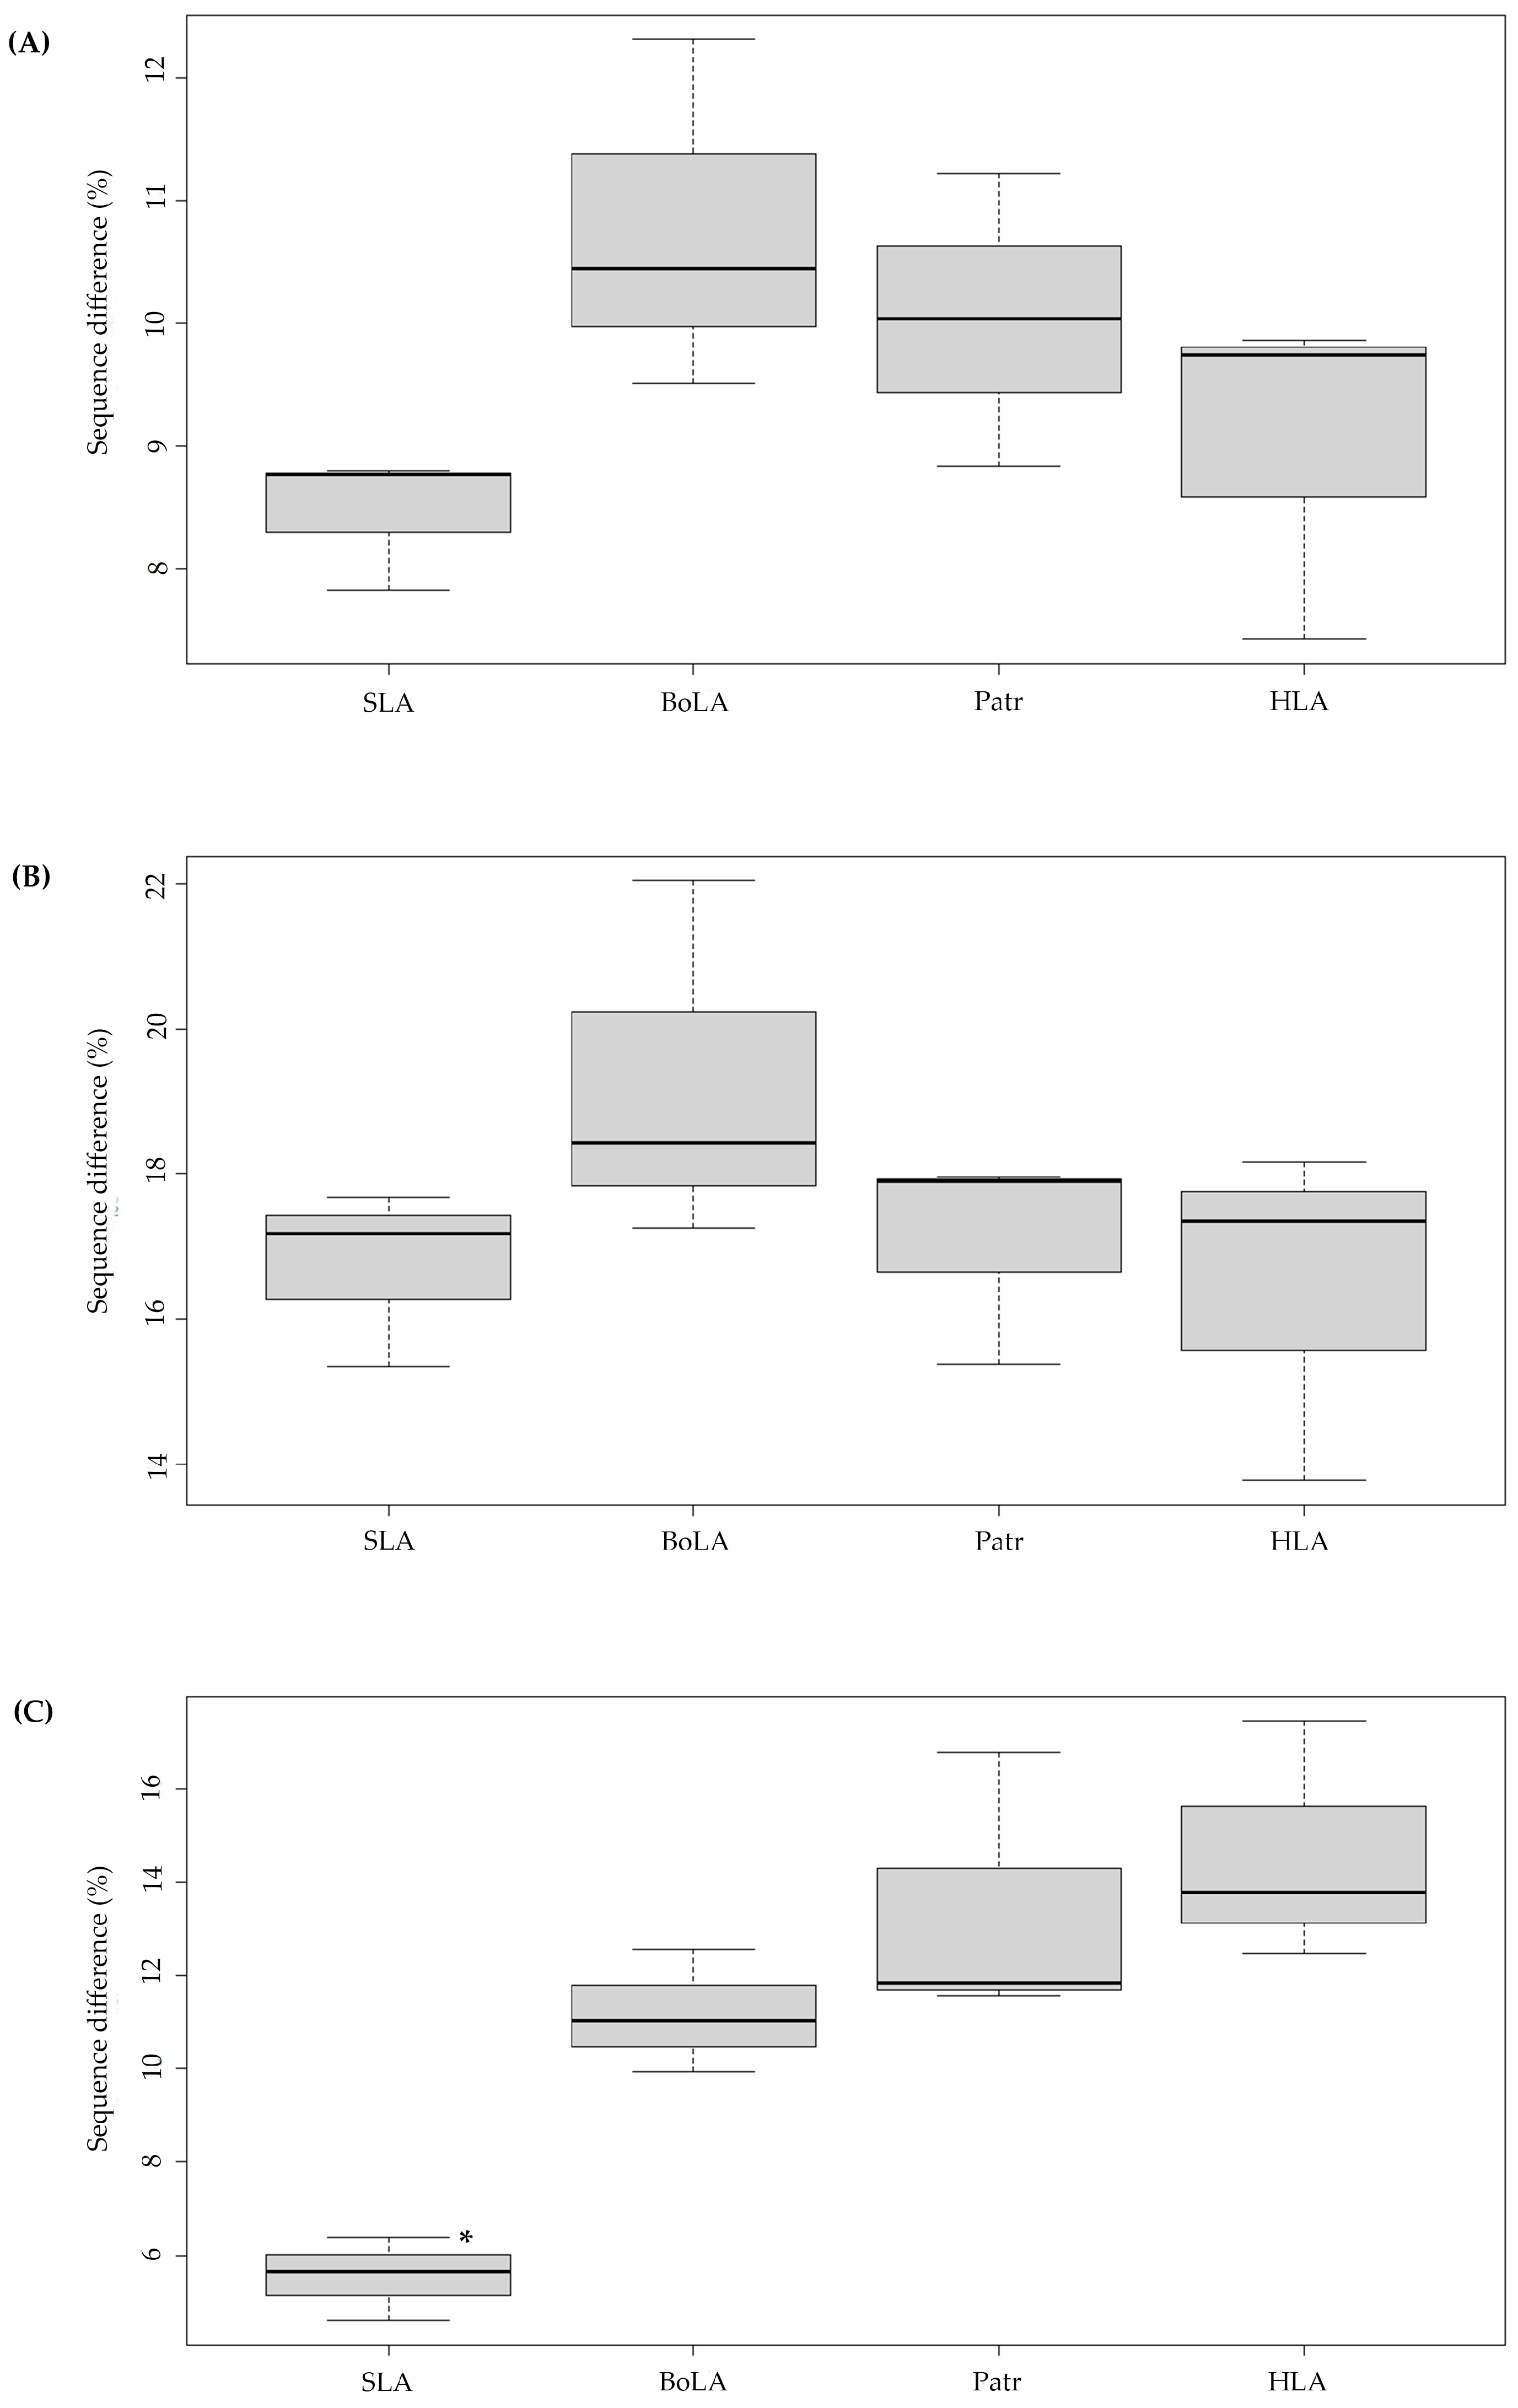
Figure 1. Boxplots showing the degree of sequence variations in the peptide-binding region and non-peptide-binding region of classical MHC class I paralogous genes in pigs, cattle, chimpanzees, and humans. SLA, Swine leukocyte antigen; BoLA, Bovine leukocyte antigen; Patr, Pan troglodytes leukocyte antigen; HLA, Human leukocyte antigen. SLA indicates the results of pairwise comparisons of selected SLA-1, -2, -3 alleles; BoLA indicates the results of BoLA-1, -2, and -3; Patr indicates the results of Patr-A, -B, and -C; HLA indicates the results of HLA-A, -B, and -C. Y-axis indicates the difference in pairwise comparisons of the nucleotide (A) and amino-acid sequences (B) of the peptide-binding region between the alleles (n = 20) of each paralogous MHC gene (n = 3). (C) Pairwise amino-acid sequence differences in the nonpeptide-binding region between the alleles (n = 10) of each paralogous MHC gene (n = 3). “*” indicates statistical significance (p < 0.05) of the inter-species difference for the level of sequence variation.
Genes 15 00007 g001
Figure 2. Phylogenetic tree of the peptide-binding region of classical MHC class I genes for pigs, cattle, chimpanzees, and humans. Twenty amino-acid sequences of different allelic groups were used for each gene. Boxes in different colors indicate different species; green, blue, orange, and gray represent cattle, pigs, chimpanzees, and humans, respectively. Therefore, paralogous genes of the same species are also depicted in the same color. Bootstrap values > 50 in 1000 repeats are shown above the nodes.
Genes 15 00007 g002
Figure 3. Phylogenetic relationships of the nonpeptide-binding region of classical MHC class I genes for pigs, cattle, chimpanzees, and humans. Ten amino-acid sequences of different allelic groups were used for each gene. Boxes in different colors indicate different species; green, blue, orange, and gray represent cattle, pigs, chimpanzees, and humans, respectively. Therefore, paralogous genes of the same species are also depicted in the same color. Bootstrap values > 50 in 1000 repeats are shown above the nodes.
Genes 15 00007 g003
Figure 4. Sequence conservation patterns in the coding region of classical MHC class I genes of pigs, cattle, chimpanzees, and humans. The levels of amino-acid sequence conservation for each residue from exons 1 to 8 of 12 MHC class I genes are indicated in the column for each gene and shown with different colors; pink and white represent 100% and 90–95% conservation, respectively. Colors darken to blue (30 to 90%) as conservation decreases. Amino-acid positions with no values represent gaps in the multiple alignment. The position number of amino acids is indicated on the left, and corresponding exon names are indicated on the right. The gene names are indicated at the bottom.
Genes 15 00007 g004aGenes 15 00007 g004b
Figure 5. Sequence conservation patterns of the peptide-binding region of classical MHC class I genes relative to peptide-binding pockets in pigs, cattle, chimpanzees, and humans. The 3D structure of the MHC protein is illustrated on the left. Peptide-binding pockets A to F are color-coded (orange, A; red, B; blue, C; green, D; purple, E; brown, F) and adopted from Nguyen et al. [57]. Amino-acid positions corresponding to each pocket are marked with the same color. The sequence alignment on the right represents the level of sequence conservation. Pink and white represent 100% and 90–95% conservation, respectively. Colors darken to blue (50 to 95%) as conservation decreases. The positions of amino acids, gene names, and domain names are indicated on the left, bottom, and right of the alignment, respectively.
Genes 15 00007 g005
Figure 6. Estimation of divergence times for MHC class I genes of pigs, cattle, sheep, chimpanzees, and humans. A total of 131 amino-acid sequences of the nonpeptide-binding region of MHC class I genes consisting of 10 sequences each for different genes was used. Alleles in the same cluster are merged and represented by black triangles. The X-axis indicates time. The divergence times of each lineage are shown next to each node. Gene names are indicated at branch tips.
Genes 15 00007 g006
Table 1. Inter-species pairwise amino-acid sequence differences for the peptide-binding and non-binding regions of the classical MHC class I genes of pigs, cattle, chimpanzees, and humans.
Sequence Differences (%) a
BoLAHLAPatrSLA
123ABCABC123
BoLA-1
BoLA-2non-PBR b9.94
PBR c18.43
BoLA-3non-PBR12.5711.02
PBR22.0417.25
HLA-Anon-PBR27.6625.8429.94
PBR25.1023.6926.72
HLA-Bnon-PBR24.8623.0426.2813.79
PBR22.4023.0625.4618.16
HLA-Cnon-PBR29.0227.0129.9917.4512.47
PBR23.7521.9223.5517.3413.77
Patr-Anon-PBR26.2024.3928.624.2612.8316.86
PBR24.6923.1626.299.8419.0917.41
Patr-Bnon-PBR24.2422.2725.6212.973.9911.6811.83
PBR22.7023.2625.6317.3412.5113.8617.90
Patr-Cnon-PBR29.2627.2130.1817.2712.225.3216.7711.56
PBR24.6622.9824.6018.5715.477.9317.9615.38
SLA-1non-PBR21.1821.0523.8028.4727.2729.7227.2227.4429.67
PBR26.2824.6227.0226.6926.7325.5026.3026.6226.15
SLA-2non-PBR22.4621.6424.1429.2927.2830.1728.0027.4430.135.66
PBR25.8724.6126.8326.9026.1225.2926.5626.1226.0715.34
SLA-3non-PBR21.5721.1223.6029.1727.7829.8227.8227.9229.814.596.38
PBR25.2924.3126.4326.7425.7024.9226.0525.5525.2417.6817.18
a The numbers indicate the mean nucleotide sequence differences (%) in the pairwise comparison of the analyzed alleles (n = 20 and 10 for PBR and non-PBR, respectively) for each gene. b Corresponding to exons 1, 4, and 8 of classical MHC class I genes. c Corresponds to the exons 2 and 3 of the classical MHC class I genes. Note. SLA, Swine leukocyte antigen; BoLA, Bovine leukocyte antigen; Patr, Pan troglodytes leukocyte antigen; HLA, Human leukocyte antigen.
Table 2. Amino-acid sequence diversities in the classical MHC class I genes of pigs, cattle, chimpanzees, and humans.
Shannon Diversity Index (H)
RegionBoLAHLAPatrSLA
1 *2 *3 *A *B *C *A *B *,**C1 *2 *3 *
PBR aEntire region0.300.350.330.210.250.150.150.280.140.360.370.30
α1 domain0.310.40.340.210.30.130.150.370.120.440.440.31
α2 domain0.330.340.350.230.220.180.160.210.160.330.340.3
Non-PBR b0.060.100.130.100.080.080.030.050.100.070.050.08
“*” and “**” following the locus name indicate the statistical significance of sequence diversity (p < 0.05) using the Shannon diversity index between PBR and non-PBR strains and between the a1 and a2 domains, respectively. The Student’s t-test was used. a Corresponds to exons 2 and 3 of classical MHC class I genes. b Corresponds to exons 1, 4, and 8 of classical MHC class I genes. Note. SLA, Swine leukocyte antigen; BoLA, Bovine leukocyte antigen; Patr, Pan troglodytes leukocyte antigen; HLA, Human leukocyte antigen.
Table 3. The level of genetic variation and substitution rates in the nucleotide sequence of the peptide-binding region for classical MHC class I genes of pigs, cattle, sheep, chimpanzees, and humans.
SpeciesLocusNo. of Variable Sites (%) aNo. of Synonymous Sites (%) b (A)No. of Nonsynonymous Sites (%) b (B)(A)/(B) RatioKa/Ks Ratio
α1 Domainα2 Domain
HumanHLA-A71 (13.00)12 (2.20)43 (7.88)0.281.741.57
HLA-B83 (15.20)17 (3.11)45 (8.24)0.381.401.20
HLA-C58 (10.62)13 (2.38)31 (5.68)0.420.751.18
Mean70.67 (12.94)14.00 (2.56)39.67 (7.26)0.361.301.32
ChimpanzeePatr-A54 (9.89)16 (2.93)27 (4.95)0.590.891.12
Patr-B100 (18.32)22 (4.03)58 (10.62)0.381.081.21
Patr-C52 (9.52)10 (1.83)30 (5.49)0.330.701.71
Mean68.67 (12.58)16.00 (2.93)38.33 (7.02)0.440.891.35
CattleBoLA-1128 (23.44)30 (5.49)59 (10.81)0.510.631.63
BoLA-2124 (22.71)23 (4.21)55 (10.07)0.421.051.65
BoLA-3119 (21.79)26 (4.76)60 (10.99)0.431.801.18
Mean123.67 (22.65)26.33 (4.82)58.00 (10.62)0.451.161.49
PigSLA-1125 (22.89)17 (3.11)56 (10.26)0.301.541.66
SLA-2135 (24.73%)29 (5.31%)59 (10.81%)0.491.161.86
SLA-3105 (19.23%)15 (2.75%)71 (13.00%)0.212.271.49
Mean121.67 (22.28%)20.33 (3.72%)62.00 (11.3%)0.341.661.67
SheepOvar-N c142 (26.01)26 (4.76)61 (11.17)0.431.411.93
a The number within parentheses indicates the percentage of variable sites across the entire peptide-binding region, 546 bp in size. b Numbers within parentheses indicate the percentages of synonymous or nonsynonymous substitution sites across the entire peptide-binding region. c indicates the combined results of all sheep MHC class I alleles because of the unavailability of annotated allelic information for individual classical MHC class I genes. Note. SLA, Swine leukocyte antigen; BoLA, Bovine leukocyte antigen; Patr, Pan troglodytes leukocyte antigen; HLA, Human leukocyte antigen; Ovar, Ovine leukocyte antigen.
Table 4. Sequence diversity of the peptide-binding pockets of classical MHC class I genes of pigs, cattle, sheep, chimpanzees, and humans.
Shannon Diversity Index (H)
LocusPeptide-Binding Pockets a
ABCDE *F
SLA-10.651.121.481.011.590.74
SLA-20.581.181.551.161.750.88
SLA-30.380.630.960.681.30.66
Mean0.540.981.330.951.550.76
BoLA-10.390.721.151.551.750.7
BoLA-20.721.341.21.651.890.66
BoLA-30.690.981.231.281.70.85
Mean0.61.011.191.491.780.74
Patr-A0.370.660.910.91.120.28
Patr-B0.411.050.920.841.490.8
Patr-C0.440.420.550.861.360.48
Mean0.410.710.790.871.320.46
HLA-A0.470.580.780.781.380.47
HLA-B0.451.070.970.641.080.88
HLA-C0.20.470.640.811.010.57
Mean0.370.710.80.741.150.64
Ovar-N0.891.131.191.241.810.88
a Peptide-binding pockets of non-human MHC class I genes were determined based on those of HLA genes. Note: The level of sequence variation in pockets was compared using the Shannon diversity index. Statistical significance of the differences between different peptide-binding pockets is indicated with “*” (p < 0.05). SLA, Swine leukocyte antigen; BoLA, Bovine leukocyte antigen; Patr, Pan troglodytes leukocyte antigen; HLA, Human leukocyte antigen; Ovar, Ovine leukocyte antigen. Ovar-N indicates the combined results of all sheep MHC class I alleles, owing to the unavailability of annotated allelic information for individual classical MHC class I genes.
Disclaimer/Publisher’s Note: The statements, opinions and data contained in all publications are solely those of the individual author(s) and contributor(s) and not of MDPI and/or the editor(s). MDPI and/or the editor(s) disclaim responsibility for any injury to people or property resulting from any ideas, methods, instructions or products referred to in the content.