


Molecular and Functional Assessment of TSC1 and TSC2 in Individuals with Tuberous Sclerosis Complex

 , , , ,
Abstract
:1. Introduction
2. Materials and Methods
2.1. Ethical Considerations
2.2. Patient Cohort
2.3. DNA Analysis
2.4. PCR and Sanger Sequencing
2.5. Next-Generation Sequencing (NGS)
2.6. Multiplex Ligation-Dependent Probe Amplification (MLPA)
2.7. Quantitative PCR
2.8. In Silico Analysis and Structural Assessment of DNA Variants
2.9. Functional Assessment of TSC2 Variants
3. Results
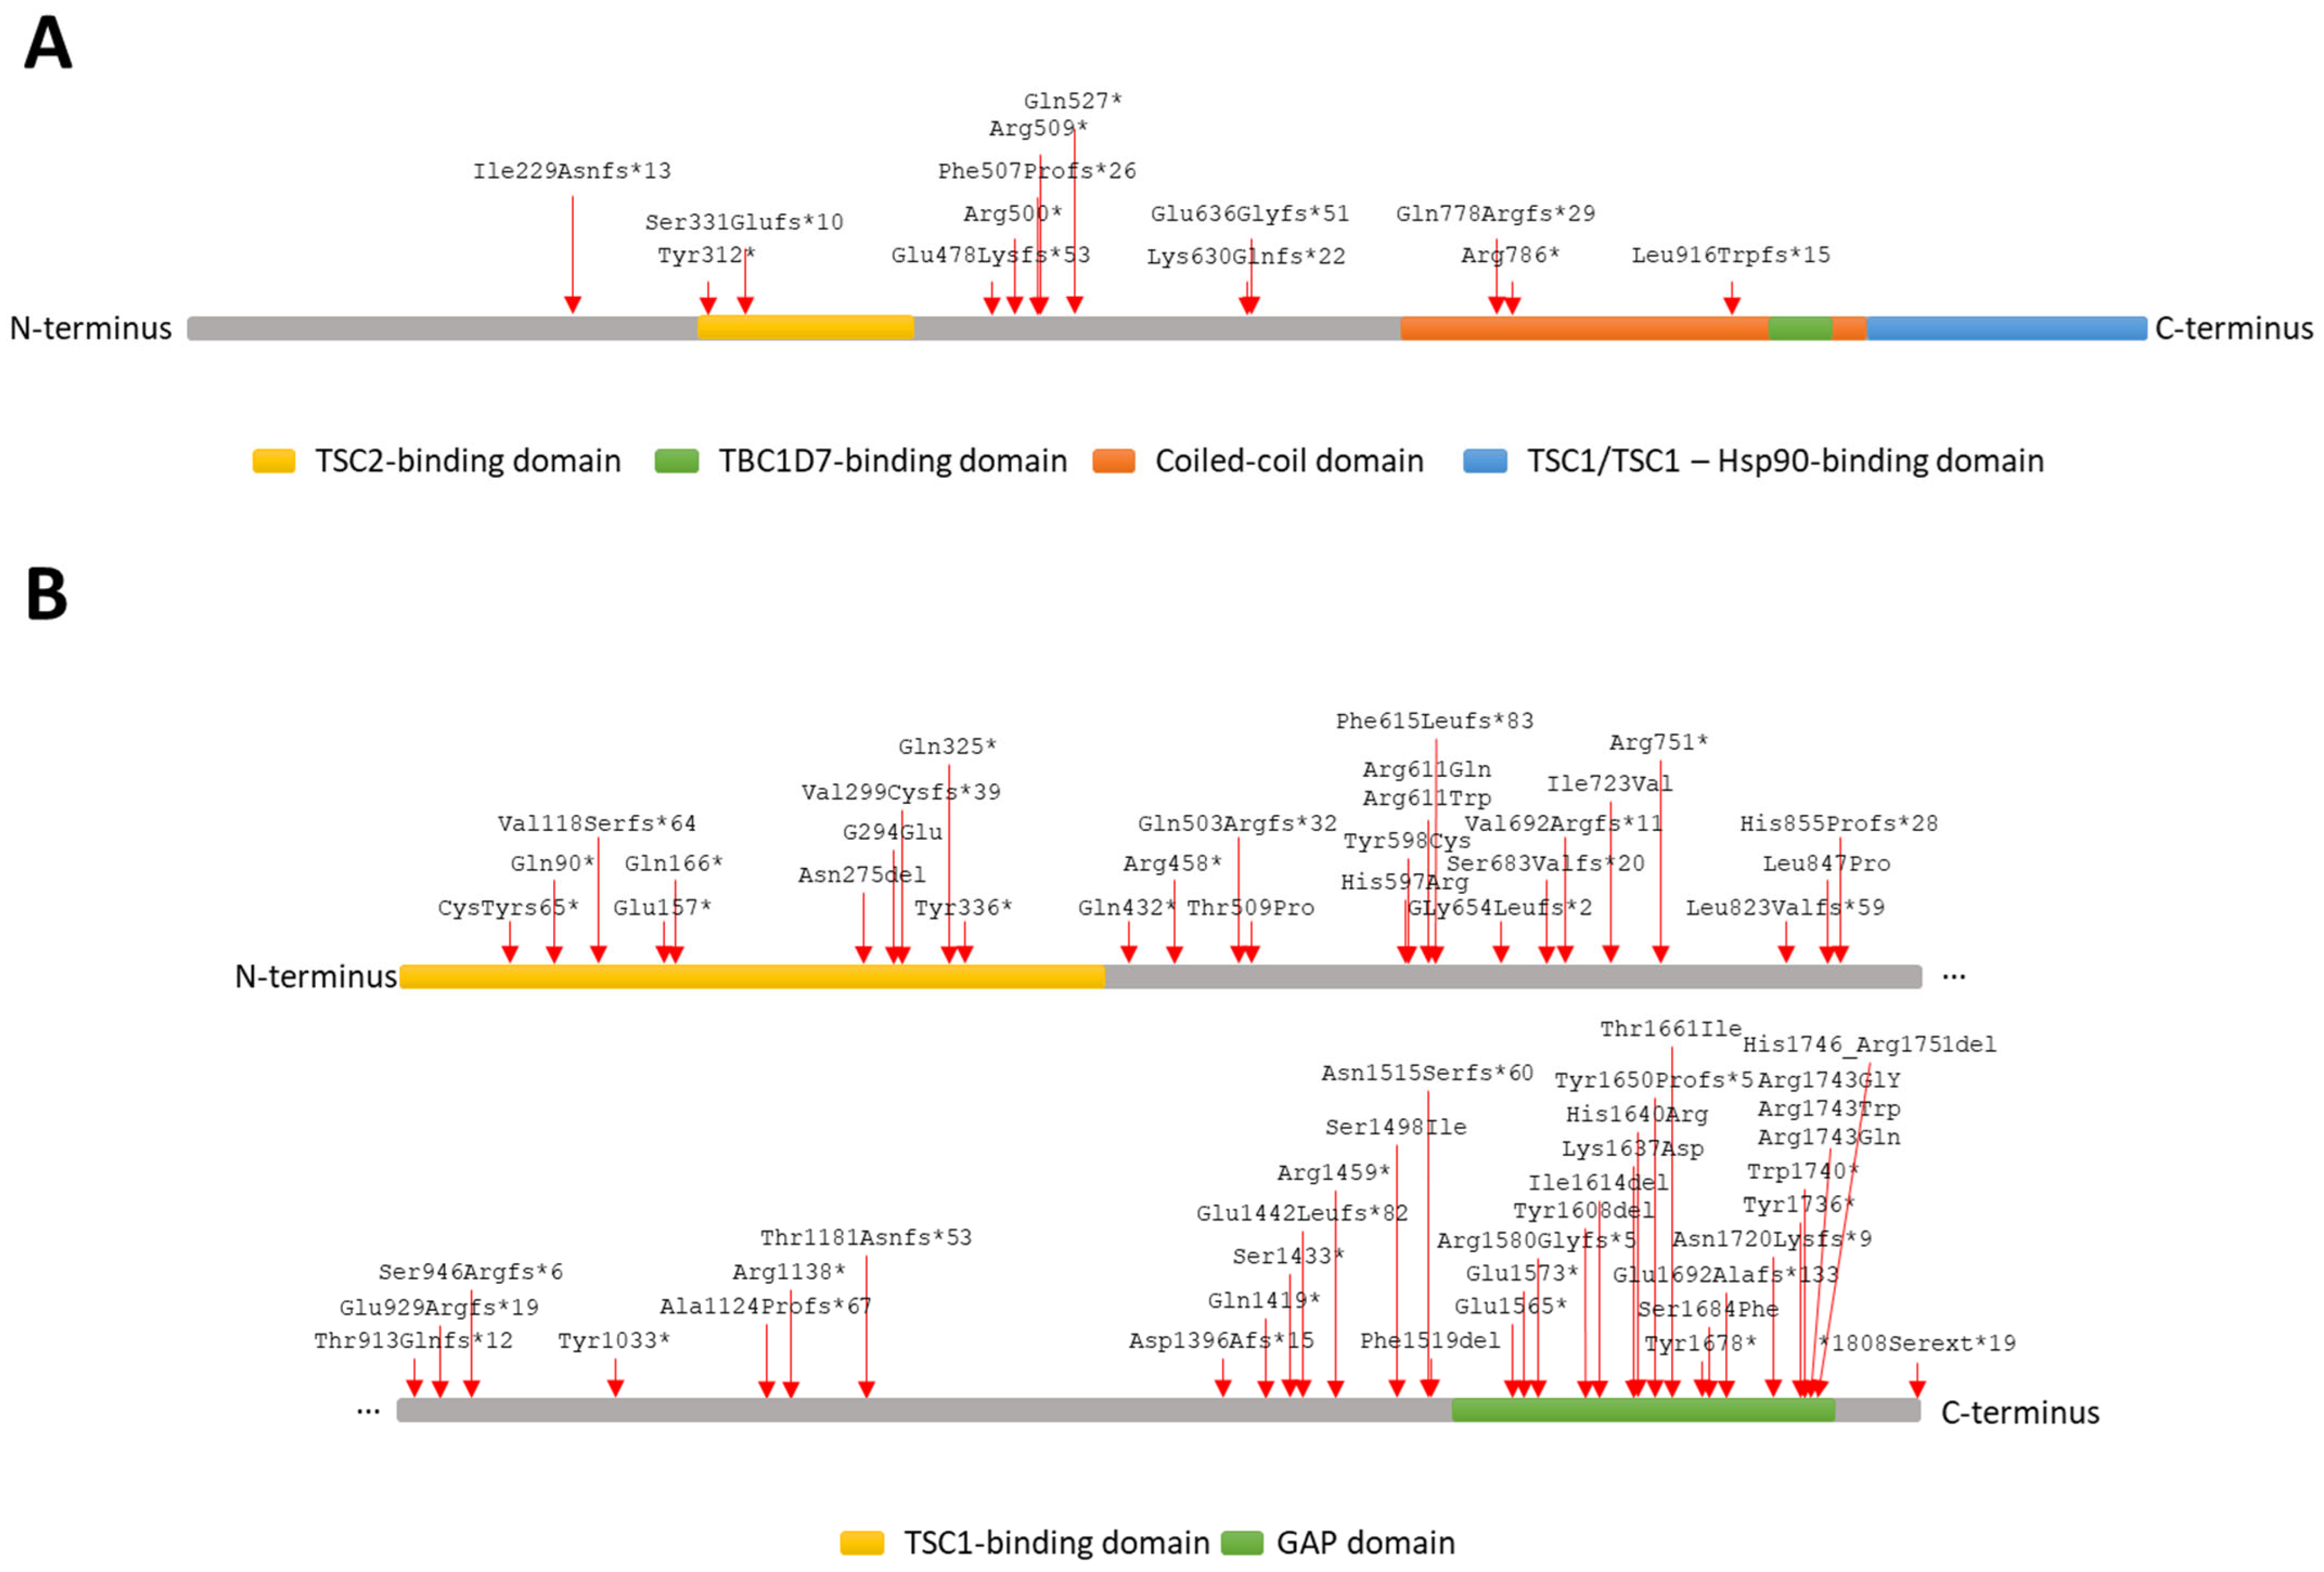
3.1. TSC1 and TSC2 Variant Identification
3.1.1. DNA Sequencing
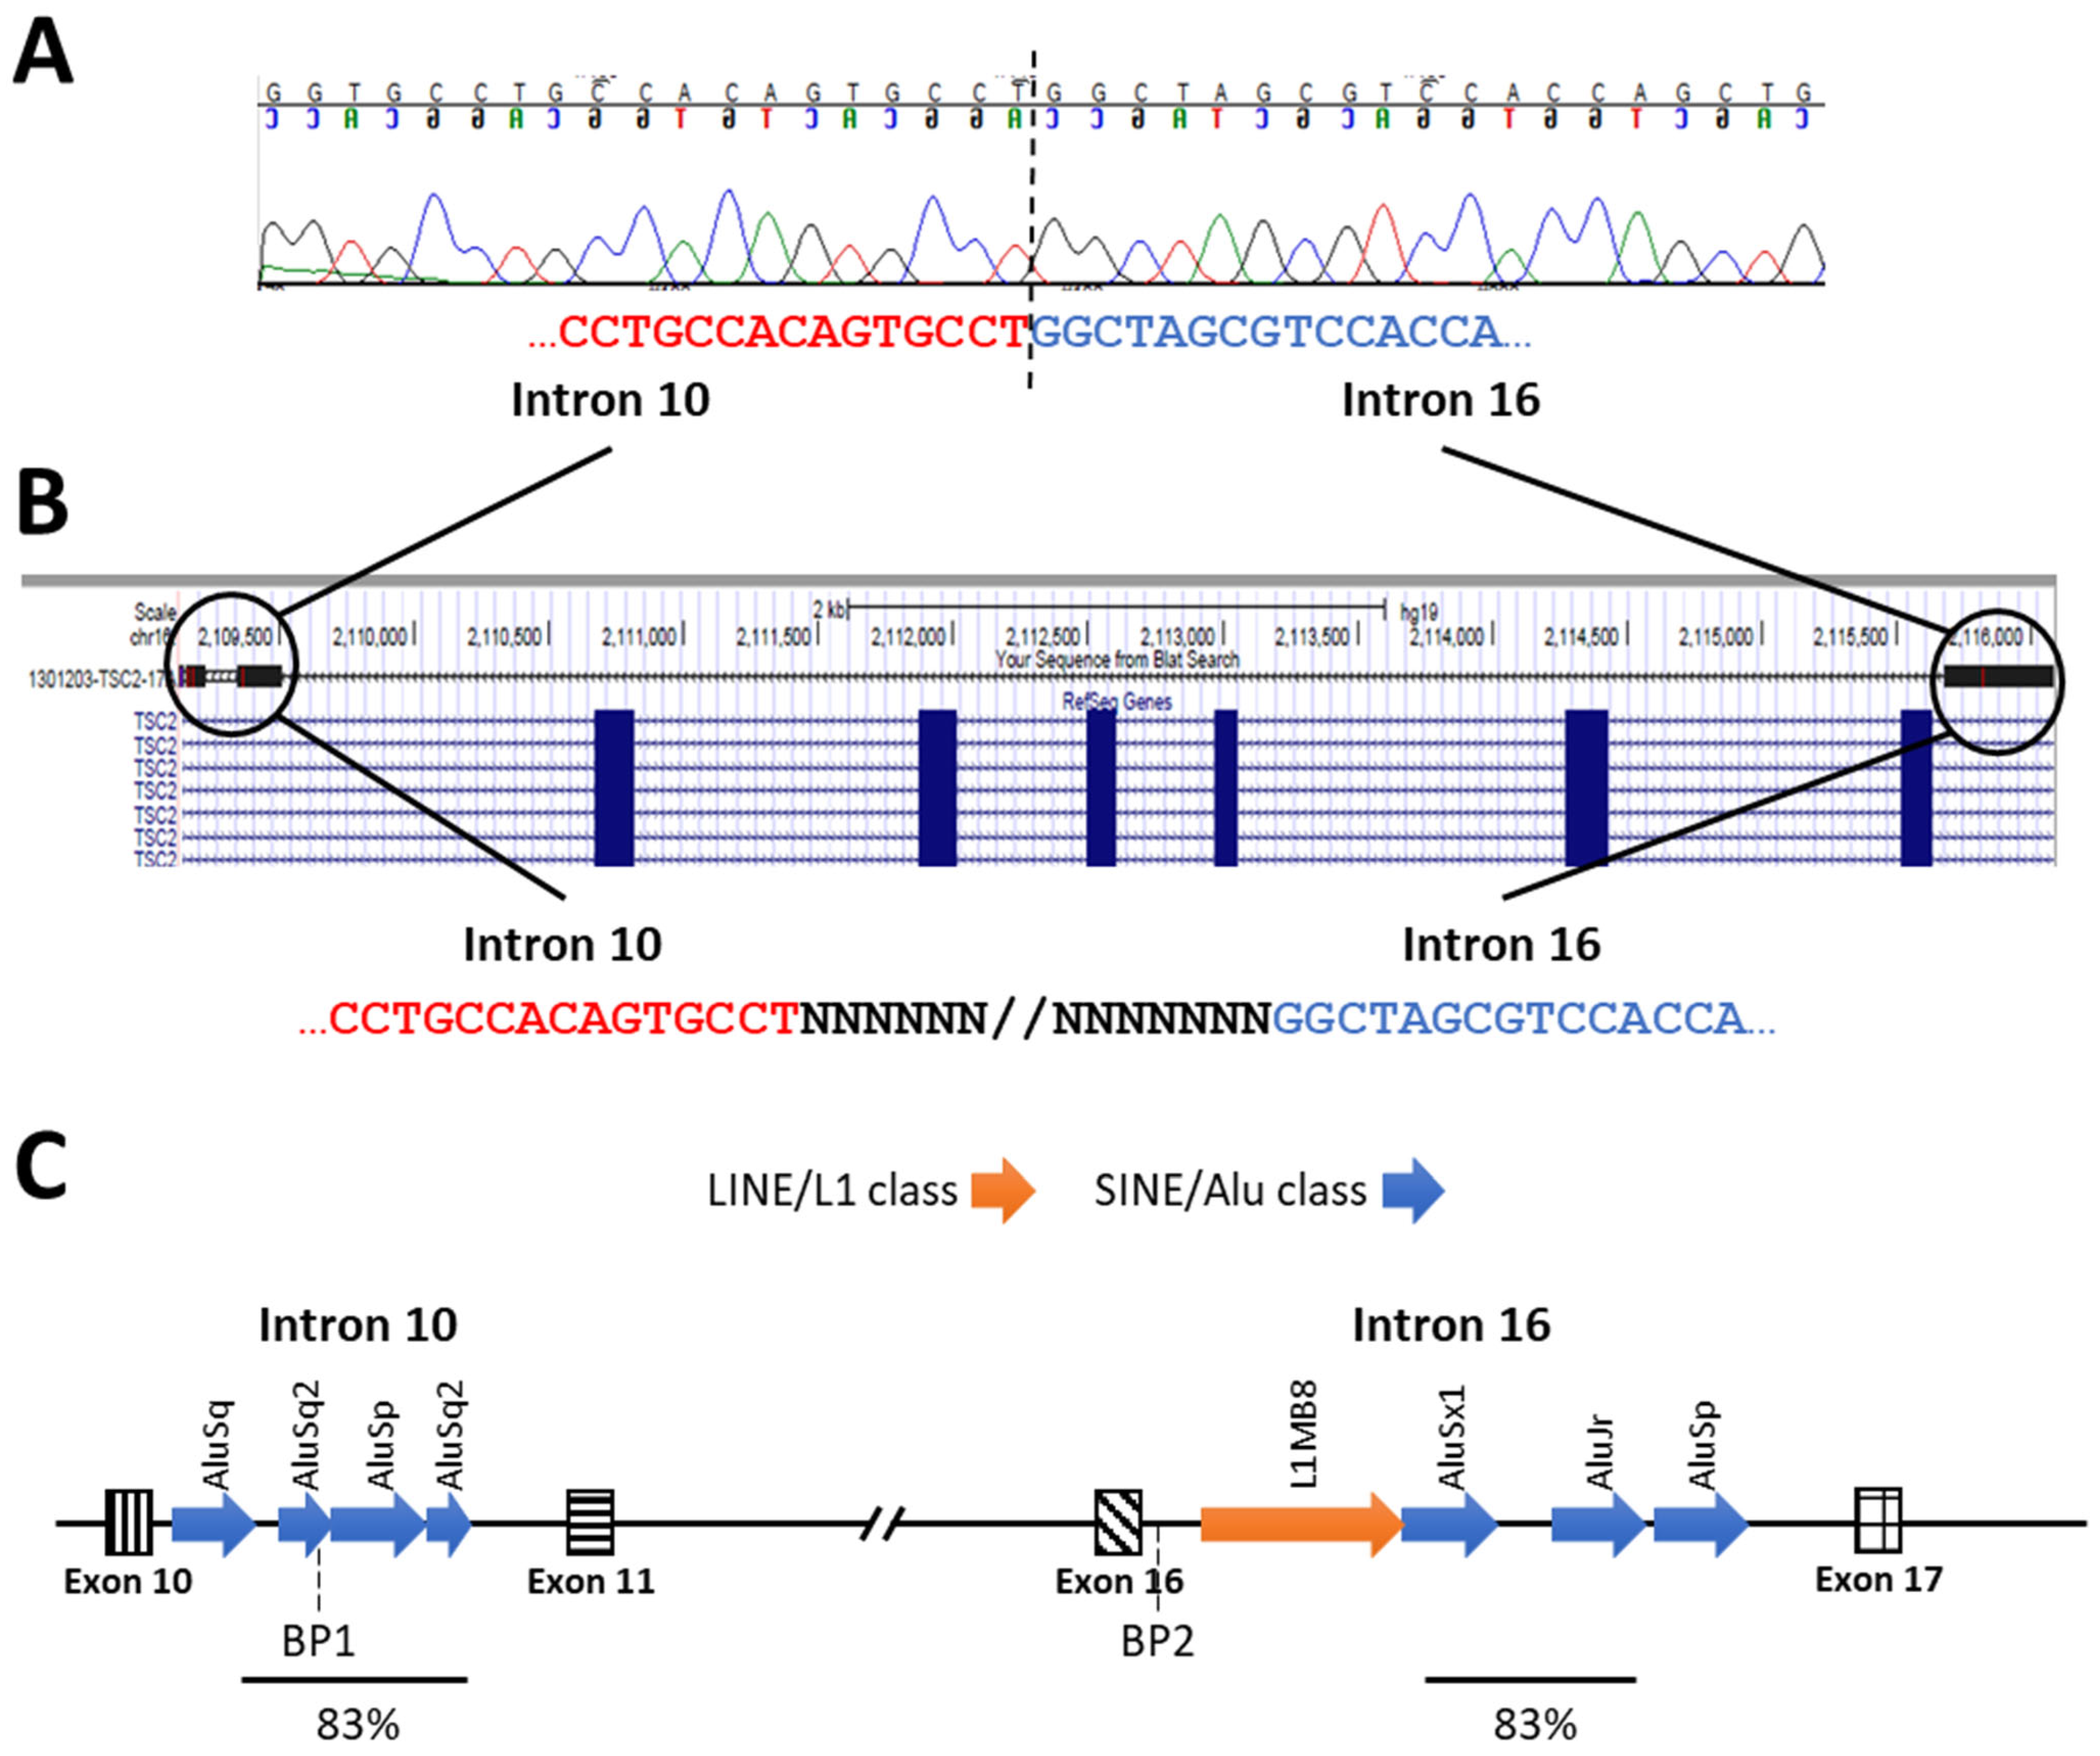
3.1.2. MLPA Analysis for Copy Number Variation Identification in TSC1 and TSC2
3.2. Functional Analyses of TSC2 Missense and In-Frame Deletion Variants
4. Discussion
Author Contributions
Funding
Institutional Review Board Statement
Informed Consent Statement
Data Availability Statement
Acknowledgments
Conflicts of Interest
Appendix A

| Targeted Segment | Name | Oligonucleotide Sequence (5′–3′) |
|---|---|---|
| Promoter + exon 01 | gTSC1_1S | AAATGTTTAGCCCAGGAAGGA |
| gTSC1_1A | GCCGGAGATAGCGTGTAATAA | |
| gTSC1_2A | CATCTTGGACGTACAGCACCT | |
| gTSC1_2S | CCGTCTATCCTTCCTTTCGAG | |
| Exon 02 | gTSC1_3S | TTGGATTTTAACCCGGAACTC |
| gTSC1_3A | TCAGGCACTGAATACAAGCAA | |
| Exon 03 | gTSC1_4A | GGGGTTCACTGCATGATTCT |
| gTSC1_4S | CCTCTTCATAAACTCGCCAAAG | |
| Exon 04 | gTSC1_5S | CAGAACTGTAATGCTGCACAAA |
| gTSC1_5A | TTCAAGAATCATGGGTCCTACA | |
| Exon 05 | gTSC1_6S | TTTTATCTGCATGACCCTTGC |
| gTSC1_6A | CCATACTTGCATGGACAAGGT | |
| Exon 06 | gTSC1_7S | CAGTAGAGTTGGGGCTCAGTG |
| gTSC1_7A | GCACCCAAGATATTCCCTCA | |
| Exons 07 + 08 | gTSC1_8S | CTGAAGAGGAGGGCAGAAGTT |
| gTSC1_8A | ATTAGTCCTCCGCCTGTGAA | |
| gTSC1_9A | AATTTCCCTGTCTGCCGTTA | |
| gTSC1_29S | CAATCCCTAGGCAGCCACTA | |
| Exon 09 | gTSC1_10S | TTTCCATTTTGAGGCTACACC |
| gTSC1_10A | TTCCAGAGACAAAGTTGCAAAA | |
| Exon 10 | gTSC1_28S | ACCTAAAACCACACACTAACCC |
| gTSC1_11A | GGAATGCTAAGTCATCCACGA | |
| Exons 11 + 12 | gTSC1_12S | GGGAAAATTTCACACTGCTCA |
| gTSC1_12A | CACACCTTGAGAGCAGCTTGT | |
| gTSC1_13A | CCCAGGGATTTGCAATAAGT | |
| gTSC1_13S | CGGCAGTTTTTCTAATAGTTGG | |
| Exons 13 + 14 | gTSC1_14S | CATCCCAACAATTTGAGAATCA |
| gTSC1_14A | GGCATCACTTTACCTGGCATA | |
| gTSC1_15A | TCCCAGAATTTCCTTGTTTCC | |
| gTSC1_15S | CCATGTCCAGCCTTCTCTGT | |
| Exon 15 | gTSC1_16S | GGATGCCACTTTTTCTCCTCT |
| gTSC1_16A | TCCCAATTTAGGTGCACAGAG | |
| gTSC1_17A | GATGACAAAATGATGGGCTGT | |
| gTSC1_17S | CACACCAAAGCAAGCCTTTAC | |
| Exons 16+17 | gTSC1_18S | TTATGCCATTGCAGATTTTGAC |
| gTSC1_18A | GGAAGGACTGGGAACTCTGAC | |
| gTSC1_19A | ACTTGGCAACACTTGAGATCCT | |
| gTSC1_19S | AAGCTAACAACACATGGGAAGG | |
| Exon 18 | gTSC1_20S | GCAAACTGATCCCTGAGAAGA |
| gTSC1_20A | AGTTGGGGAACCTCTGTCCTA | |
| Exon 19 | gTSC1_21S | CAGAATCTTTCTGCAGCATCC |
| gTSC1_21A | CAGCACCAAAAACATGAACCT | |
| Exon 20 | gTSC1_22S | CCATTATGTCAGGGACTGTGAA |
| gTSC1_22A | TAGCTGGACCACGGAGTAGTG | |
| Exons 21 + 22 | gTSC1_23S | GCTTGGGGATAGATTTCAAGG |
| gTSC1_23A | ACACGGAGTGAGCTGAGTGTT | |
| gTSC1_24A | TGCAGCTGTCCTCTGAAAGAT | |
| gTSC1_24S | GTCAAACTCCAGGCAAGGTAA | |
| Exon 23 | gTSC1_25S | CATATGGCCACAGGAAGTGTT |
| gTSC1_28A | CCGTCCCATTTCCACACATG | |
| gTSC1_26A | CAGAAAGGCTACTGGTCATGC | |
| gTSC1_26S | GGGAGACGACTATGGGAGAAG |
| Targeted Segment | Name | Oligonucleotide Sequence (5′–3′) |
|---|---|---|
| Promoter + exon 01 | gTSC2_1S | CGAGGACAGCAAGTTCACTG |
| gTSC2_1A | GTTTGCCGTCTCTCCTCTACC | |
| gTSC2_2A | GAGCTTGCTGGGAGTTGTAGTT | |
| gTSC2_2S | CTACCTGCTGCAGCCTCTCT | |
| Exon 02 | gTSC2_3S | GGTAGAGGAGAGACGGCAAAC |
| gTSC2_3A | AAGTGTGCCTGAACCAGGTC | |
| Exon 03 | gTSC2_4S | CGGCTCGTCAAGTGAATCTT |
| gTSC2_4A | GTCAGCTGTCAACCATGTTCC | |
| Exon 04 | gTSC2_5S | TGAGACTGTCCCATGACTTCC |
| gTSC2_5A | AGGGCAAAACAACACCGTAG | |
| Exon 05 | gTSC2_43S | CCTGCCCTGTACAATGCTGA |
| gTSC2_43A | CAAGCCCCAGAGACTCACAG | |
| Exon 06 | gTSC2_44S | GATCCTAGTGTCCGTGCGTAG |
| gTSC2_44A | CGGAGCTGAACTTAGGACCAT | |
| Exon 07 | gTSC2_8S | GCTCTCATCTGATGTCTTGGTT |
| gTSC2_8A | GTCATTGATGCTGTCATCCAC | |
| Exon 08 | gTSC2_9S | GTCCCCCATGTAAGTCAGGAT |
| gTSC2_9A | ATCTCCTCCCAAAGACAGAGG | |
| Exon 09 | gTSC2_10S | CTGTCTCCCATGAATGGTTGT |
| gTSC2_10A | GGCTAAGTAGTTGGGGAGCAC | |
| Exon 10 | gTSC2_45S | GTGTTACTGCTGGCCTCTGT |
| gTSC2_11A | CAGCTCACTGCACACAGAAAC | |
| Exon 11 | gTSC2_12S | GGATTCAGTTGCTGGTCTGTC |
| gTSC2_12A | ACTAATGCGGTCCTCCAAAGT | |
| Exon 12 | gTSC2_46S | CCTCTGGTGCCAAGTCCATG |
| gTSC2_45A | CCCTAAGCTGAGTGTTCCTGG | |
| Exon 13 | gTSC2_14S | CAGTTTCCTCCCACCTGTGT |
| gTSC2_14A | GGAGCATCTCTCCAGACGAC | |
| Exon 14 | gTSC2_15S | GTGCTAGCTTGCTTTCCAGTC |
| gTSC2_15A | AGACTGGCTGAAACGAACTCA | |
| Exon 15 | gTSC2_16S | GCTGCTCCTTGTGAGTTGTG |
| gTSC2_16A | ACTGTGCAGAAACCAAAATGC | |
| Exon 16 | gTSC2_17S | CTCAGAACCATGAGCCTGTGT |
| gTSC2_17A | AGCGTGTGCTACTGGTATGCT | |
| Exon 17 | gTSC2_18S | GTTGATGACTGCCCTGATGAT |
| gTSC2_18A | TTAGAGCGACAAGCCACAGAT | |
| Exon 18 | gTSC2_19S | CAGAGTCCTGTTCAGCCTGTC |
| gTSC2_19A | GAAGCAAGAGAAGCAGCTGAG | |
| Exon 19 | gTSC2_20S | CTACATGTACGCGGGACCTC |
| gTSC2_20A | GCCTTCTGGACCCTAGAGACA | |
| Exon 20 | gTSC2_21S | GTGCCCTACTCCCTGCTCTT |
| gTSC2_46A | GCTCGCAGTCTTTTGGGGAA | |
| Exon 21 | gTSC2_47S | GTGTGTTACTTGGCAGGCAC |
| gTSC2_22A | GTGGACAGGGAACACTGGAT | |
| Exon 22 | gTSC2_23S | GAGTCTGCTCGGGTAGCTCA |
| gTSC2_23A | ACCTGAGCTCCTGAAGTCACA | |
| Exon 23 | gTSC2_24S | TCACGGATCACACAAATGGTA |
| gTSC2_24A | GAGCCCACCTTAGTGATGAAA | |
| Exon 24 | gTSC2_25S | CGCACCTCTACAGGAACTTTG |
| gTSC2_25A | GAGTGAGCACACCCAGACAGT | |
| Exon 25 | gTSC2_26S | TCATCACTAAGGTGGGCTCAG |
| gTSC2_26A | AACCCCCAATTCCACAAGTAG | |
| Exon 26 | gTSC2_27S | ACCCACACACGTTTAATTTGC |
| gTSC2_27A | GAATACGAAAAGGCCAAAACC | |
| Exons 27 + 28 | gTSC2_28S | AATGTGGTCCACGTGATTCTC |
| gTSC2_28A | GACTTAGTCCCCAGGCTGGTA | |
| Exon 29 | gTSC2_29S | CGCTCCCTGTCTTCTAGGTCT |
| gTSC2_29A | CAGAGAAGGGCTCCAGGACT | |
| Exon 30 | gTSC2_48S | CTTGAGGCTGGTGGTTTTGC |
| gTSC2_47A | AGAGGGCCAAGTCTGCAATC | |
| Exon 31 | gTSC2_31S | TGAGGGGTGCAAAGAGTAGG |
| gTSC2_31A | GGAGAACAATGGTGCTGAGG | |
| Exon 32 | gTSC2_32S | GACGTCTATTCACGGGAGGA |
| gTSC2_32A | CTAAACAGCTGCCACCCATC | |
| Exon 33 | gTSC2_33S | GTTACGAGGGCTGGTTTCAG |
| gTSC2_33A | ACACTGCGTGAGCAGAGGTAT | |
| Exon 34 | gTSC2_34S | ATACCTCTGCTCACGCAGTGT |
| gTSC2_34A | AGCTGCAGGAACACGAAACT | |
| gTSC2_35A | CTCTTTAAGGCGTCCCTCTCT | |
| gTSC2_35S | CTGTGGACCTCTCCTTCCAG | |
| Exon 35 | gTSC2_36S | AGCCTCCAATGCAGAGAAAGT |
| gTSC2_36A | GTGTCGTATGATGGGATCTGG | |
| Exon 36 | gTSC2_37S | TGTTCCTGCAGCTCTACCATT |
| gTSC2_37A | TGTCAGCTCACTGACCAACAG | |
| Exon 37 | gTSC2_38S | GAGGGAAGAGAGGGAGTCAAG |
| gTSC2_38A | GGCACCTCCTGATTACTCCA | |
| Exon 38 | gTSC2_39S | CTCCCATCCAGTCCTGCTAC |
| gTSC2_39A | TCTGCACTTGCCAGTTACTCC | |
| Exons 39 + 40 | gTSC2_49S | CAGAGGGGAAAGTTCAGGGG |
| gTSC2_40A | GTAGATATCGGTGGGGTTGGA | |
| Exon 41 | gTSC2_41S | AAGTCTCCCCAGACATGGAG |
| gTSC2_41A | CACAAACTCGGTGAAGTCCTC | |
| Exon 42 | gTSC2_42S | CCGATATCTACCCCTCCAAGT |
| gTSC2_48A | CTTCTAGAGCCTCGACACCC |
| ID | Coverage. | Granular | Target Region Covered (%) | ||||
|---|---|---|---|---|---|---|---|
| Total | Mean | Third_Quartile | Median | First_Quartile | >10 Reads | >20 Reads | |
| 14 | 193108927 | 164.54 | 215 | 160 | 110 | 98.40% | 97.40% |
| 34 | 206241477 | 175.73 | 230 | 168 | 114 | 98.50% | 97.60% |
| 46 | 51912227 | 205.33 | 252 | 198 | 151 | 99.50% | 99.10% |
| 50 | 34975423 | 138.34 | 173 | 122 | 84 | 99.50% | 98.90% |
| 53 | 60450935 | 239.1 | 294 | 226 | 170 | 99.90% | 99.40% |
| 56 | 47703937 | 188.68 | 235 | 169 | 119 | 99.70% | 99.30% |
| 60 | 35594649 | 140.79 | 175 | 126 | 89 | 99.60% | 99.20% |
| 63 | 43388916 | 171.61 | 215 | 151 | 106 | 99.70% | 99.30% |
| 64 | 56625909 | 223.97 | 278 | 218 | 165 | 99.40% | 99.00% |
| 65 | 64631748 | 255.64 | 314 | 249 | 190 | 99.40% | 99.10% |
| 66 | 45574283 | 180.26 | 225 | 178 | 134 | 99.20% | 98.70% |
| 82 | 41660923 | 164.78 | 205 | 162 | 122 | 99.20% | 98.70% |
| 87 | 56281945 | 222.61 | 274 | 219 | 167 | 99.40% | 99.00% |
| 100 | 52273457 | 206.76 | 255 | 203 | 154 | 99.40% | 99.00% |
| 104 | 48197580 | 190.63 | 235 | 180 | 136 | 99.60% | 99.20% |
| 113 | 57003770 | 225.46 | 277 | 215 | 163 | 99.70% | 99.30% |
| 116 | 41915283 | 165.79 | 207 | 157 | 117 | 99.60% | 99.10% |
| 117 | 40770943 | 161.26 | 200 | 159 | 120 | 99.10% | 98.50% |
| 118 | 46434270 | 183.66 | 226 | 179 | 136 | 99.40% | 99.00% |
| 119 | 48891382 | 193.38 | 241 | 192 | 144 | 99.20% | 98.80% |
| 123 | 65664401 | 259.72 | 335 | 246 | 170 | 99.50% | 99.20% |
| 124 | 60099947 | 237.71 | 307 | 221 | 152 | 99.50% | 99.10% |
| Segment | Name | Oligonucleotide Sequence (5′–3′) |
|---|---|---|
| TSC1 | ||
| Exon 01 | qPCRgTSC1_1S | AGGGACTGTGAGGTAAACAGC |
| qPCRgTSC1_1A | AGGAAGCCCCCATAAAAAGGAG | |
| Exon 17 | qPCRgTSC1_4S | CAGATGAGATCCGCACCCTC |
| qPCRgTSC1_4A | AGCTGCTGCTTTGATCACCT | |
| TSC2 | ||
| Exon 12 | qPCRgTSC2_2S | TCCATGACCTGTTGACCACG |
| qPCRgTSC2_2A | CGCACATCTCTCCACCAGTT | |
| PKD1 | ||
| Exon 45 | qPCRgPKD1_1S | GGCTCTCTACCCTGTGTCCT |
| qPCRgPKD1_1A | CGGAGAATAACAGCCCCCAG | |
| Exon 46 | qPCRgPKD1_2S | TAGGTGTGGTGGCGTTATGG |
| qPCRgPKD1_2A | CTCTGGGGTGATGAGAGTGC | |
| GADPH | ||
| Intron 01 | gGAPDH_1S | GCTCCCACCTTTCTCATCC |
| gGAPDH_1A | CTGCAGCGTACTCCCCAC | |
| SPACA9 | ||
| Exon 04 | qPCRgSPACA9_1S | GAGGCCCGGAACCACTAC |
| qPCRgSPACA9_1A | GAGTGGGCGATCCATTCTTTC | |
| qPCRgSPACA9_2S | GAGGCCCGGAACCACTAC | |
| qPCRgSPACA9_2A | GAGTGGGCGATCCATTCTTTC | |
| Segment | Variant | Variant Type | Highest Reported Frequency/Database |
|---|---|---|---|
| TSC1 | |||
| 3′UTR | c.*1G>A | 3′ UTR | NR |
| 3′UTR | c.*191dup a | 3′ UTR | NR |
| 3′UTR | c.*1362C>T | 3′ UTR | NR |
| TSC2 | |||
| Exon 30 | c.3431T>A (p.V1144E) | Missense | NR |
| Segment | Variant | Variant Type | Highest Reported Frequency/Database |
|---|---|---|---|
| TSC1 | |||
| 5′ UTR | c.-606_-605delGCinsTG | 5′ UTR | NR |
| 5′ UTR | c.-568C>T | 5′ UTR | NR |
| 5′ UTR | c.-282_-281insC | 5′ UTR | NR |
| Intron 11 | c.1142-26_1142-25del | Intron variant | NR |
| TSC2 | |||
| Intron 07 | c.648+12C>A | Intron variant | NR |
| Intron 12 | c.1257+109dup | Intron variant | NR |
| Intron 15 | c.1599+85_1599+87del | Intron variant | NR |
| Intron 15 | c.1599+282_1599+283inCTGGGG b | Intron variant | NR |
| Intron 21 | c.2356-63A>G | Intron variant | NR |
| Intron 25 | c.2837+93G>A | Intron variant | 0.000008 |
| Intron 30 | c.3610+46dup a | Intron variant | NR |
| Intron 34 | c.4493+110G>A | Intron variant | NR |
| Intron 36 | c.4663-56C>G | Intron variant | 0.000004 |
| Intron 37 | c.4850-133C>T a | Intron variant | NR |
References
- Northrup, H.; Krueger, D.A.; International Tuberous Sclerosis Complex Consensus Group. Tuberous sclerosis complex diagnostic criteria update: Recommendations of the 2012 International Tuberous Sclerosis Complex Consensus Conference. Pediatr. Neurol. 2013, 49, 243–254. [Google Scholar] [CrossRef] [PubMed]
- Northrup, H.; Aronow, M.E.; Bebin, E.M.; Bissler, J.; Darling, T.N.; de Vries, P.J.; Frost, M.D.; Fuchs, Z.; Gosnell, E.S.; Gupta, N.; et al. Updated International Tuberous Sclerosis Complex Diagnostic Criteria and Surveillance and Management Recommendations. Pediatr. Neurol. 2021, 123, 50–66. [Google Scholar] [CrossRef] [PubMed]
- Sampson, J.R.; Scahill, S.J.; Stephenson, J.B.; Mann, L.; Connor, J.M. Genetic aspects of tuberous sclerosis in the west of Scotland. J. Med. Genet. 1989, 26, 28–31. [Google Scholar] [CrossRef] [PubMed]
- O’Callaghan, F.J.; Shiell, A.W.; Osborne, J.P.; Martyn, C.N. Prevalence of tuberous sclerosis estimated by capture-recapture analysis. Lancet 1998, 351, 1490. [Google Scholar] [CrossRef] [PubMed]
- Au, K.S.; Williams, A.T.; Roach, E.S.; Batchelor, L.; Sparagana, S.P.; Delgado, M.R.; Wheless, J.W.; Baumgartner, J.E.; Roa, B.B.; Wilson, C.M.; et al. Genotype/phenotype correlation in 325 individuals referred for a diagnosis of tuberous sclerosis complex in the United States. Genet. Med. 2007, 9, 88–100. [Google Scholar] [CrossRef]
- European Chromosome 16 Tuberous Sclerosis Consortium. Identification and characterization of the tuberous sclerosis gene on chromosome 16. Cell 1993, 75, 1305–1315. [Google Scholar] [CrossRef] [PubMed]
- van Slegtenhorst, M.; de Hoogt, R.; Hermans, C.; Nellist, M.; Janssen, B.; Verhoef, S.; Lindhout, D.; van den Ouweland, A.; Halley, D.; Young, J.; et al. Identification of the tuberous sclerosis gene TSC1 on chromosome 9q34. Science 1997, 277, 805–808. [Google Scholar] [CrossRef] [PubMed]
- Dibble, C.C.; Elis, W.; Menon, S.; Qin, W.; Klekota, J.; Asara, J.M.; Finan, P.M.; Kwiatkowski, D.J.; Murphy, L.O.; Manning, B.D. TBC1D7 is a third subunit of the TSC1-TSC2 complex upstream of mTORC1. Mol. Cell 2012, 47, 535–546. [Google Scholar] [CrossRef] [PubMed]
- Dibble, C.C.; Manning, B.D. Signal integration by mTORC1 coordinates nutrient input with biosynthetic output. Nat. Cell Biol. 2013, 15, 555–564. [Google Scholar] [CrossRef] [PubMed]
- Hoxhaj, G.; Hughes-Hallett, J.; Timson, R.C.; Ilagan, E.; Yuan, M.; Asara, J.M.; Ben-Sahra, I.; Manning, B.D. The mTORC1 Signaling Network Senses Changes in Cellular Purine Nucleotide Levels. Cell Rep. 2017, 21, 1331–1346. [Google Scholar] [CrossRef]
- Roach, E.S.; Gomez, M.R.; Northrup, H. Tuberous sclerosis complex consensus conference: Revised clinical diagnostic criteria. J. Child Neurol. 1998, 13, 624–628. [Google Scholar] [CrossRef] [PubMed]
- Peron, A.; Au, K.S.; Northrup, H. Genetics, genomics, and genotype-phenotype correlations of TSC: Insights for clinical practice. Am. J. Med. Genet. Part C Semin. Med. Genet. 2018, 178, 281–290. [Google Scholar] [CrossRef]
- Camposano, S.E.; Greenberg, E.; Kwiatkowski, D.J.; Thiele, E.A. Distinct clinical characteristics of tuberous sclerosis complex patients with no mutation identified. Ann. Hum. Genet. 2009, 73, 141–146. [Google Scholar] [CrossRef]
- Qin, W.; Kozlowski, P.; Taillon, B.E.; Bouffard, P.; Holmes, A.J.; Janne, P.; Camposano, S.; Thiele, E.; Franz, D.; Kwiatkowski, D.J. Ultra deep sequencing detects a low rate of mosaic mutations in tuberous sclerosis complex. Hum. Genet. 2010, 127, 573–582. [Google Scholar] [CrossRef]
- Kozlowski, P.; Roberts, P.; Dabora, S.; Franz, D.; Bissler, J.; Northrup, H.; Au, K.S.; Lazarus, R.; Domanska-Pakiela, D.; Kotulska, K.; et al. Identification of 54 large deletions/duplications in TSC1 and TSC2 using MLPA, and genotype-phenotype correlations. Hum. Genet. 2007, 121, 389–400. [Google Scholar] [CrossRef] [PubMed]
- Tyburczy, M.E.; Wang, J.A.; Li, S.; Thangapazham, R.; Chekaluk, Y.; Moss, J.; Kwiatkowski, D.J.; Darling, T.N. Sun exposure causes somatic second-hit mutations and angiofibroma development in tuberous sclerosis complex. Hum. Mol. Genet. 2013, 23, 20232029. [Google Scholar] [CrossRef]
- Nellist, M.; Brouwer, R.W.; Kockx, C.E.; van Veghel-Plandsoen, M.; Withagen-Hermans, C.; Prins-Bakker, L.; Hoogeveen-Westerveld, M.; Mrsic, A.; van den Berg, M.M.; Koopmans, A.E.; et al. Targeted Next Generation Sequencing reveals previously unidentified TSC1 and TSC2 mutations. BMC Med. Genet. 2015, 16, 10. [Google Scholar] [CrossRef]
- Tyburczy, M.E.; Dies, K.A.; Glass, J.; Camposano, S.; Chekaluk, Y.; Thorner, A.R.; Lin, L.; Krueger, D.; Franz, D.N.; Thiele, E.A.; et al. Mosaic and Intronic Mutations in TSC1/TSC2 Explain the Majority of TSC Patients with No Mutation Identified by Conventional Testing. PLoS Genet. 2015, 11, e1005637. [Google Scholar] [CrossRef] [PubMed]
- Klonowska, K.; Giannikou, K.; Grevelink, J.M.; Boeszoermenyi, B.; Thorner, A.R.; Herbert, Z.T.; Afrin, A.; Treichel, A.M.; Hamieh, L.; Kotulska, K.; et al. Comprehensive genetic and phenotype analysis of 95 individuals with mosaic tuberous sclerosis complex. Am. J. Hum. Genet. 2023, 110, 979–988. [Google Scholar] [CrossRef]
- Rozen, S.; Skaletsky, H.J. Primer3 on the WWW for general users and for biologist programmers. In Bioinformatics Methods and Protocols: Methods in Molecular Biology; Krawetz, S., Misener, S., Eds.; Humana Press: Totowa, NJ, USA, 2000; pp. 365–386. [Google Scholar]
- Gerstein, M.B.; Bruce, C.; Rozowsky, J.S.; Zheng, D.; Du, J.; Korbel, J.O.; Emanuelsson, O.; Zhang, Z.D.; Weissman, S.; Snyder, M. What is a gene, post-ENCODE? History and updated definition. Genome Res. 2007, 17, 669–681. [Google Scholar] [CrossRef]
- Frey, U.H.; Bachmann, H.S.; Peters, J.; Siffert, W. PCR-amplification of GC-rich regions: ‘Slowdown PCR’. Nat. Protoc. 2008, 3, 1312–1317. [Google Scholar] [CrossRef] [PubMed]
- Li, H.; Durbin, R. Fast and accurate short read alignment with Burrows—Wheeler Transform. Bioinformatics. Bioinformatics 2009, 25, 7. [Google Scholar] [CrossRef] [PubMed]
- McKenna, A.; Hanna, M.; Banks, E.; Sivachenko, A.; Cibulskis, K.; Kernytsky, A.; Garimella, K.; Altshuler, D.; Gabriel, S.; Daly, M.; et al. The Genome Analysis Toolkit: A MapReduce framework for analyzing next-generation DNA sequencing data. Genome Res. 2010, 20, 1297–1303. [Google Scholar] [CrossRef] [PubMed]
- Wang, K.; Li, M.; Hakonarson, H. ANNOVAR: Functional annotation of genetic variants from high-throughput sequencing data. Nucleic Acids Res. 2010, 38, e164. [Google Scholar] [CrossRef] [PubMed]
- Rendtorff, N.D.; Bjerregaard, B.; Frodin, M.; Kjaergaard, S.; Hove, H.; Skovby, F.; Brondum-Nielsen, K.; Schwartz, M.; The Danish Tuberous Sclerosis Group. Analysis of 65 tuberous sclerosis complex (TSC) patients by TSC2 DGGE, TSC1/TSC2 MLPA, and TSC1 long-range PCR sequencing, and report of 28 novel mutations. Hum. Mutat. 2005, 26, 374–383. [Google Scholar] [CrossRef] [PubMed]
- Padma Priya, T.; Dalal, A.B. Tuberous sclerosis: Diagnosis and prenatal diagnosis by MLPA. Indian J. Pediatr. 2012, 79, 1366–1369. [Google Scholar] [CrossRef]
- van Veghel-Plandsoen, M.M.; Wouters, C.H.; Kromosoeto, J.N.; den Ridder-Klunnen, M.C.; Halley, D.J.; van den Ouweland, A.M. Multiplex ligation-depending probe amplification is not suitable for detection of low-grade mosaicism. Eur. J. Hum. Genet. 2011, 19, 1009–1012. [Google Scholar] [CrossRef] [PubMed]
- Ambar, G.; Chiavegatto, S. Anabolic—androgenic steroid treatment induces behavioral disinhibition and downregulation of serotonin receptor messenger RNA in the prefrontal cortex and amygdala of male mice. Genes. Brain Behav. 2009, 8, 161–173. [Google Scholar] [CrossRef]
- Freeman, P.J.; Hart, R.K.; Gretton, L.J.; Brookes, A.J.; Dalgleish, R. VariantValidator: Accurate validation, mapping, and formatting of sequence variation descriptions. Hum. Mutat. 2018, 39, 61–68. [Google Scholar] [CrossRef]
- Wildeman, M.; van Ophuizen, E.; den Dunnen, J.T.; Taschner, P.E. Improving sequence variant descriptions in mutation databases and literature using the Mutalyzer sequence variation nomenclature checker. Hum. Mutat. 2008, 29, 6–13. [Google Scholar] [CrossRef]
- Richards, S.; Aziz, N.; Bale, S.; Bick, D.; Das, S.; Gastier-Foster, J.; Grody, W.W.; Hegde, M.; Lyon, E.; Spector, E.; et al. Standards and guidelines for the interpretation of sequence variants: A joint consensus recommendation of the American College of Medical Genetics and Genomics and the Association for Molecular Pathology. Genet. Med. Off. J. Am. Coll. Med. Genet. 2015, 17, 405–424. [Google Scholar] [CrossRef] [PubMed]
- Zerbino, D.R.; Achuthan, P.; Akanni, W.; Amode, M.R.; Barrell, D.; Bhai, J.; Billis, K.; Cummins, C.; Gall, A.; Giron, C.G.; et al. Ensembl 2018. Nucleic Acids Res. 2018, 46, D754–D761. [Google Scholar] [CrossRef] [PubMed]
- Adzhubei, I.A.; Schmidt, S.; Peshkin, L.; Ramensky, V.E.; Gerasimova, A.; Bork, P.; Kondrashov, A.S.; Sunyaev, S.R. A method and server for predicting damaging missense mutations. Nat. Methods 2010, 7, 248–249. [Google Scholar] [CrossRef] [PubMed]
- Schwarz, J.M.; Rodelsperger, C.; Schuelke, M.; Seelow, D. MutationTaster evaluates disease-causing potential of sequence alterations. Nat. Methods 2010, 7, 575–576. [Google Scholar] [CrossRef]
- Ng, P.C.; Henikoff, S. Predicting the effects of amino acid substitutions on protein function. Annu. Rev. Genom. Hum. Genet. 2006, 7, 61–80. [Google Scholar] [CrossRef] [PubMed]
- Kumar, P.; Henikoff, S.; Ng, P.C. Predicting the effects of coding non-synonymous variants on protein function using the SIFT algorithm. Nat. Protoc. 2009, 4, 1073–1081. [Google Scholar] [CrossRef]
- Choi, Y.; Chan, A.P. PROVEAN web server: A tool to predict the functional effect of amino acid substitutions and indels. Bioinformatics 2015, 31, 2745–2747. [Google Scholar] [CrossRef]
- Hornbeck, P.V.; Zhang, B.; Murray, B.; Kornhauser, J.M.; Latham, V.; Skrzypek, E. PhosphoSitePlus, 2014: Mutations, PTMs and recalibrations. Nucleic Acids Res 2015, 43, D512–D520. [Google Scholar] [CrossRef]
- Kircher, M.; Witten, D.M.; Jain, P.; O’Roak, B.J.; Cooper, G.M.; Shendure, J. A general framework for estimating the relative pathogenicity of human genetic variants. Nat. Genet. 2014, 46, 310–315. [Google Scholar] [CrossRef]
- Piva, F.; Giulietti, M.; Burini, A.B.; Principato, G. SpliceAid 2: A database of human splicing factors expression data and RNA target motifs. Hum. Mutat. 2012, 33, 81–85. [Google Scholar] [CrossRef]
- Desmet, F.O.; Hamroun, D.; Lalande, M.; Collod-Beroud, G.; Claustres, M.; Beroud, C. Human Splicing Finder: An online bioinformatics tool to predict splicing signals. Nucleic Acids Res. 2009, 37, e67. [Google Scholar] [CrossRef]
- Daumke, O.; Weyand, M.; Chakrabarti, P.P.; Vetter, I.R.; Wittinghofer, A. The GTPase-activating protein Rap1GAP uses a catalytic asparagine. Nature 2004, 429, 197–201. [Google Scholar] [CrossRef]
- Hoogeveen-Westerveld, M.; Ekong, R.; Povey, S.; Mayer, K.; Lannoy, N.; Elmslie, F.; Bebin, M.; Dies, K.; Thompson, C.; Sparagana, S.P.; et al. Functional assessment of TSC2 variants identified in individuals with tuberous sclerosis complex. Hum. Mutat. 2013, 34, 167–175. [Google Scholar] [CrossRef]
- Hoogeveen-Westerveld, M.; Wentink, M.; van den Heuvel, D.; Mozaffari, M.; Ekong, R.; Povey, S.; den Dunnen, J.T.; Metcalfe, K.; Vallee, S.; Krueger, S.; et al. Functional assessment of variants in the TSC1 and TSC2 genes identified in individuals with Tuberous Sclerosis Complex. Hum. Mutat. 2011, 32, 424–435. [Google Scholar] [CrossRef] [PubMed]
- Dufner Almeida, L.G.; Nanhoe, S.; Zonta, A.; Hosseinzadeh, M.; Kom-Gortat, R.; Elfferich, P.; Schaaf, G.; Kenter, A.; Kummel, D.; Migone, N.; et al. Comparison of the functional and structural characteristics of rare TSC2 variants with clinical and genetic findings. Hum. Mutat. 2019, 41, 759–773. [Google Scholar] [CrossRef]
- Overwater, I.E.; Swenker, R.; van der Ende, E.L.; Hanemaayer, K.B.; Hoogeveen-Westerveld, M.; van Eeghen, A.M.; Lequin, M.H.; van den Ouweland, A.M.; Moll, H.A.; Nellist, M.; et al. Genotype and brain pathology phenotype in children with tuberous sclerosis complex. Eur. J. Hum. Genet. 2016, 24, 1688–1695. [Google Scholar] [CrossRef] [PubMed]
- Blasco-Perez, L.; Iranzo-Nuez, L.; Lopez-Ortega, R.; Martinez-Cruz, D.; Camprodon-Gomez, M.; Tenes, A.; Antolin, M.; Tizzano, E.F.; Garcia-Arumi, E. An Integral Approach to the Molecular Diagnosis of Tuberous Sclerosis Complex: The Role of Mosaicism and Splicing Variants. J. Mol. Diagn. 2023, 25, 692–701. [Google Scholar] [CrossRef]
- Nellist, M.; Sancak, O.; Goedbloed, M.A.; Rohe, C.; van Netten, D.; Mayer, K.; Tucker-Williams, A.; van den Ouweland, A.M.; Halley, D.J. Distinct effects of single amino-acid changes to tuberin on the function of the tuberin-hamartin complex. Eur. J. Hum. Genet. 2005, 13, 59–68. [Google Scholar] [CrossRef]
- Kwiatkowski, D.J.; Palmer, M.R.; Jozwiak, S.; Bissler, J.; Franz, D.; Segal, S.; Chen, D.; Sampson, J.R. Response to everolimus is seen in TSC-associated SEGAs and angiomyolipomas independent of mutation type and site in TSC1 and TSC2. Eur. J. Hum. Genet. 2015, 23, 1665–1672. [Google Scholar] [CrossRef]
- Jones, A.C.; Shyamsundar, M.M.; Thomas, M.W.; Maynard, J.; Idziaszczyk, S.; Tomkins, S.; Sampson, J.R.; Cheadle, J.P. Comprehensive mutation analysis of TSC1 and TSC2—and phenotypic correlations in 150 families with tuberous sclerosis. Am. J. Hum. Genet. 1999, 64, 1305–1315. [Google Scholar] [CrossRef]
- Dabora, S.L.; Jozwiak, S.; Franz, D.N.; Roberts, P.S.; Nieto, A.; Chung, J.; Choy, Y.S.; Reeve, M.P.; Thiele, E.; Egelhoff, J.C.; et al. Mutational analysis in a cohort of 224 tuberous sclerosis patients indicates increased severity of TSC2, compared with TSC1, disease in multiple organs. Am. J. Hum. Genet. 2001, 68, 64–80. [Google Scholar] [CrossRef] [PubMed]
- Sancak, O.; Nellist, M.; Goedbloed, M.; Elfferich, P.; Wouters, C.; Maat-Kievit, A.; Zonnenberg, B.; Verhoef, S.; Halley, D.; van den Ouweland, A. Mutational analysis of the TSC1 and TSC2 genes in a diagnostic setting: Genotype–phenotype correlations and comparison of diagnostic DNA techniques in Tuberous Sclerosis Complex. Eur. J. Hum. Genet. 2005, 13, 731–741. [Google Scholar] [CrossRef]
- Hung, C.C.; Su, Y.N.; Chien, S.C.; Liou, H.H.; Chen, C.C.; Chen, P.C.; Hsieh, C.J.; Chen, C.P.; Lee, W.T.; Lin, W.L.; et al. Molecular and clinical analyses of 84 patients with tuberous sclerosis complex. BMC Med. Genet. 2006, 7, 72. [Google Scholar] [CrossRef] [PubMed]
- Rosengren, T.; Nanhoe, S.; de Almeida, L.G.D.; Schonewolf-Greulich, B.; Larsen, L.J.; Hey, C.A.B.; Duno, M.; Ek, J.; Risom, L.; Nellist, M.; et al. Mutational analysis of TSC1 and TSC2 in Danish patients with tuberous sclerosis complex. Sci. Rep. 2020, 10, 9909. [Google Scholar] [CrossRef] [PubMed]
- Reyna-Fabian, M.E.; Hernandez-Martinez, N.L.; Alcantara-Ortigoza, M.A.; Ayala-Sumuano, J.T.; Enriquez-Flores, S.; Velazquez-Aragon, J.A.; Varela-Echavarria, A.; Todd-Quinones, C.G.; Gonzalez-Del Angel, A. First comprehensive TSC1/TSC2 mutational analysis in Mexican patients with Tuberous Sclerosis Complex reveals numerous novel pathogenic variants. Sci. Rep. 2020, 10, 6589. [Google Scholar] [CrossRef] [PubMed]
- Rosset, C.; Vairo, F.; Bandeira, I.C.; Correia, R.L.; de Goes, F.V.; da Silva, R.T.B.; Bueno, L.S.M.; de Miranda Gomes, M.C.S.; Galvao, H.C.R.; Neri, J.; et al. Molecular analysis of TSC1 and TSC2 genes and phenotypic correlations in Brazilian families with tuberous sclerosis. PLoS ONE 2017, 12, e0185713. [Google Scholar] [CrossRef] [PubMed]
- Nunes, B.A.; Romano, A.; Pasa Morgan, M.A.; Goncalves, A.A.; Cardozo, L.F.M.; de Almeida, L.G.D.; Haddad, L.A.; Crippa, A.C.S.; Antoniuk, S.A.; Abagge, K.T. A dermatological assessment of pediatric patients with tuberous sclerosis complex (TSC). An. Bras. Dermatol. 2024. [Google Scholar] [CrossRef] [PubMed]
- Cardozo, L.F.M.; Schwind, M.R.; Pereira, A.P.A.; Dufner-Almeida, L.G.; Haddad, L.A.; Bruck, I.; Antoniuk, S.A. Neuropsychological profile in tuberous sclerosis complex: A study of clinical and cognitive variables in a cohort from Brazil. Arq. Neuropsiquiatr. 2024, 82, s00441787797. [Google Scholar] [CrossRef] [PubMed]
- Hoogeveen-Westerveld, M.; Ekong, R.; Povey, S.; Karbassi, I.; Batish, S.D.; den Dunnen, J.T.; van Eeghen, A.; Thiele, E.; Mayer, K.; Dies, K.; et al. Functional assessment of TSC1 missense variants identified in individuals with tuberous sclerosis complex. Hum. Mutat. 2012, 33, 476–479. [Google Scholar] [CrossRef]
- Abo-Dalo, B.; Kutsche, K.; Mautner, V.; Kluwe, L. Large intragenic deletions of the NF2 gene: Breakpoints and associated phenotypes. Genes Chromosomes Cancer 2010, 49, 171–175. [Google Scholar] [CrossRef]
- Abeysinghe, S.S.; Chuzhanova, N.; Krawczak, M.; Ball, E.V.; Cooper, D.N. Translocation and gross deletion breakpoints in human inherited disease and cancer I: Nucleotide composition and recombination-associated motifs. Hum. Mutat. 2003, 22, 229–244. [Google Scholar] [CrossRef] [PubMed]
- Gu, S.; Yuan, B.; Campbell, I.M.; Beck, C.R.; Carvalho, C.M.; Nagamani, S.C.; Erez, A.; Patel, A.; Bacino, C.A.; Shaw, C.A.; et al. Alu-mediated diverse and complex pathogenic copy-number variants within human chromosome 17 at p13.3. Hum. Mol. Genet. 2015, 24, 4061–4077. [Google Scholar] [CrossRef] [PubMed]


| DNA Variant Type | DNA Variant | Location | Reported e | Frequency f | CADD g |
|---|---|---|---|---|---|
| Frameshift | c.683dup (p.I229Nfs*13) a | Exon 08 | - | - | - |
| Frameshift | c.989dup (p.S331Efs*10) | Exon 10 | 30 | - | - |
| Frameshift | c.1431_1434del (p.E478Kfs*53) d | Exon 14 | 14 | - | - |
| Frameshift | c.1517_1518dup (p.F507Pfs*26) a | Exon 15 | - | - | - |
| Frameshift | c.1888_1891del (p.K630Qfs*22) | Exon 15 | 58 | - | - |
| Frameshift | c.1907_1908del (p.E636Gfs*51) | Exon 15 | 16 | 6.19 × 10⁻⁷ | - |
| Frameshift | c.2332del (p.Q778Rfs*29) a | Exon 18 | - | - | - |
| Frameshift | c.2746del (p.L916Wfs*15) a | Exon 21 | - | - | - |
| Nonsense | c.936C>G (p.Y312*) a | Exon 10 | - | - | 34 |
| Nonsense | c.1498C>T (p.R500*) d | Exon 15 | 44 | - | 39 |
| Nonsense | c.1525C>T (p.R509*) d | Exon 15 | 73 | - | 38 |
| Nonsense | c.1579C>T (p.Q527*) | Exon 16 | 7 | - | 36 |
| Nonsense | c.2356C>T (p.R786*) | Exon 18 | 48 | - | 41 |
| Nonsense | c.2626G>T (p.E876*) a | Exon 21 | - | 1.57 × 10⁻⁶ | 47 |
| Large deletion | c.(737+_738-)_(*1+_?)del b,c | Exons 9–23 | - | - | - |
| DNA Variant Type | DNA Variant | Functional Testing * | Location | Reported g | Frequency n | CADD o | ||
|---|---|---|---|---|---|---|---|---|
| 1. | Frameshift | c.352del (p.V118Sfs*64) a | NR | Exon 05 | - | - | - | |
| 2. | Frameshift | c.894dup (p.V299Cfs*39) | No | Exon 10 | 5 | - | - | |
| 3. | Frameshift | c.1507del (p.Q503Rfs*32) a | NR | Exon 15 | - | - | - | |
| 4. | Frameshift | c.1842del (p.F615Lfs*83) | NR | Exon 18 | - | - | - | |
| 5. | Frameshift | c.1959_1960del (p.G654Lfs*2) | No | Exon 19 | 5 | - | - | |
| 6. | Frameshift | c.2046dup (p.S683Vfs*20) | No | Exon 19 | 2 | - | - | |
| 7. | Frameshift | c.2073dup (p.V692Rfs*11) a | NR | Exon 19 | - | - | - | |
| 8. | Frameshift | c.2467_2476delinsGTGGATGA (p.L823Vfs*59) a | NR | Exon 21 | - | - | - | |
| 9. | Frameshift | c.2563dup (p.H855Pfs*28) a | NR | Exon 23 | - | - | - | |
| 10. | Frameshift | c.2737_2739delinsC (p.T913Qfs*12) a | NR | Exon 24 | - | - | - | |
| 11. | Frameshift | c.2784del (p.E929Rfs*19) | No | Exon 25 | 2 | - | - | |
| 12. | Frameshift | c.3370del (p.A1124Pfs*67) a | NR | Exon 29 | - | - | - | |
| 13. | Frameshift | c.3541dup (p.T1181Nfs*53) a | NR | Exon 30 | - | - | - | |
| 14. | Frameshift | c.4187del (p.D1396Afs*15) a | NR | Exon 34 | - | - | - | |
| 15. | Frameshift | c.4324_4327delinsCTTCT (p.E1442Lfs*82) a | NR | Exon 34 | - | - | - | |
| 16. | Frameshift | c.4544_4547del (p.N1515Sfs*60) | No | Exon 35 | 31 | - | - | |
| 17. | Frameshift | c.4738del (p.R1580Gfs*5) a | NR | Exon 37 | - | - | - | |
| 18. | Frameshift | c.4947_4948insCCATTGT (p.Y1650Pfs*5) a | NR | Exon 38 | - | - | - | |
| 19. | Frameshift | c.5075_5078del (p.E1692Afs*133) a | No | Exon 40 | 3 | - | - | |
| 20. | Frameshift | c.5159dup (p.N1720Kfs*9) a | NR | Exon 40 | - | - | - | |
| 21. | Nonsense | c.195T>A (p.C65*) a | NR | Exon 03 | - | - | 34 | |
| 22. | Nonsense | c.268C>T (p.Q90*) h | No | Exon 04 | 32 | - | 36 | |
| 23. | Nonsense | c.496C>T (p.Q166*) i | No | Exon 05 | 7 | - | 41 | |
| 24. | Nonsense | c.973C>T (p.Q325*) | No | Exon 10 | 4 | - | 36 | |
| 25. | Nonsense | c.1008T>G (p.Y336*) | No | Exon 11 | 3 | - | 32 | |
| 26. | Nonsense | c.1195G>T (p.E399*) | No | Exon 12 | 2 | - | 38 | |
| 27. | Nonsense | c.1294C>T (p.Q432*) | No | Exon 13 | 3 | - | 37 | |
| 28. | Nonsense | c.1372C>T (p.R458*) | No | Exon 14 | 50 | - | 38 | |
| 29. | Nonsense | c.2251C>T (p.R751*) | No | Exon 21 | 46 | - | 38 | |
| 30. | Nonsense | c.3099C>G (p.Y1033*) | No | Exon 27 | 10 | - | 33 | |
| 31. | Nonsense | c.3412C>T (p.R1138*) | No | Exon 30 | 62 | - | 46 | |
| 32. | Nonsense | c.4255C>T (p.Q1419*) | No | Exon 34 | 15 | - | 47 | |
| 33. | Nonsense | c.4298C>A (p.S1433*) | No | Exon 34 | 2 | - | 36 | |
| 34. | Nonsense | c.4375C>T (p.R1459*) | No | Exon 34 | 49 | 6.23 × 10⁻⁸ | 40 | |
| 35. | Nonsense | c.4693G>T (p.E1565*) | No | Exon 37 | 1 | - | 49 | |
| 36. | Nonsense | c.4716_4717delGGinTT (p.E1573*) a | NR | Exon 37 | - | - | - | |
| 37. | Nonsense | c.5034C>A (p.Y1678*) | No | Exon 39 | 2 | - | 27.4 | |
| 38. | Nonsense | c.5208C>G (p.Y1736*) a | NR | Exon 41 | - | - | 37 | |
| 39. | Nonsense | c.5220G>A (p.W1740*) | No | Exon 41 | 4 | - | 54 | |
| 40. | Missense | c.1525A>C (p.T509P) k | Yes | Exon 15 | 3 | 25.9 | ||
| 41. | Missense | c.1663G>C (p.A555P) j,k | Yes | Exon 16 | 3 | 3.09 × 10⁻⁶ | 22.7 | |
| 42. | Missense | c.1790A>G (p.H597R)k | Yes | Exon 17 | 9 | - | 23.6 | |
| 43. | Missense | c.1793A>G (p.Y598C) k | Yes | Exon 17 | 7 | - | 24.6 | |
| 44. | Missense | c.1831C>T (p.R611W) k | Yes | Exon 17 | 54 | - | 27.9 | |
| 45. | Missense | c.1832G>A (p.R611Q) d,k | Yes | Exon 17 | 101 | - | 28.8 | |
| 46. | Missense | c.2540T>C (p.L847P) k | Yes | Exon 22 | 8 | - | 29.4 | |
| 47. | Missense | c.4493G>T (p.S1498I) d | Yes | Exon 34 | 2 | - | 34 | |
| 48. | Missense | c.4909_4911delinsGAC (p.K1637D) l | Yes | Exon 38 | 2 | - | - | |
| 49. | Missense | c.4919A>G (p.H1640R) l | Yes | Exon 38 | 4 | - | 25.6 | |
| 50. | Missense | c.5024C>T (p.P1675L) h,l | Yes | Exon 39 | 63 | - | 28.4 | |
| 51. | Missense | c.5227C>G (p.R1743G) d,l | Yes | Exon 41 | 4 | - | 23.3 | |
| 52. | Missense | c.5227C>T (p.R1743W) l | Yes | Exon 41 | 57 | - | 25.2 | |
| 53. | Missense | c.5228G>C (p.R1743P) l | Yes | Exon 41 | 10 | - | 29.9 | |
| 54. | Missense | c.5228G>A (p.R1743Q) l | Yes | Exon 41 | 62 | - | 32 | |
| 55. | In-frame deletion | c.824_826del (p.N275del) k | Yes | Exon 09 | 6 | - | - | |
| 56. | In-frame deletion | c.4823_4825del (p.Y1608del) j,l | Yes | Exon 37 | 15 | - | - | |
| 57. | In-frame deletion | c.4842_4844del (p.I1614del) j,l | Yes | Exon 37 | 22 | - | - | |
| 58. | In-frame deletion | c.5238_5255del (p.H1746_R1751del) l | Yes | Exon 41 | 125 | 6.02 × 10⁻⁶ | - | |
| 59. | Large Deletion | c.(774+1_775-1)_(848+1_849-1)del a | No | Exon 09 | - | - | - | |
| 60. | Large Deletion | c.(975+628)_(1716+41)del a,b,c | No | Exon 11–16 | - | - | - | |
| 61. | Large Deletion | c.(1599+1_1600-1)_(2545+1_2546-1)del a | No | Exon 16–22 | - | - | - | |
| 62. | Large Deletion | c.(1716+1_1717-1)_(2545+1_2546-1)del a | No | Exon 17–22 | - | - | - | |
| 63. | Large Deletion | c.(5068+1_5069-1)_(*102_?)del | No | Exon 39-PKD1 | 1 | - | - | |
| 64. | Large Deletion | c.(?_-30)_(*102_?)del a | No | TSC2 | 2 | - | - | |
| 65. | Large Duplication | c.(2355+1_2356-1)_(*102_?)dup | No | Exon 22–42 | 1 | - | - | |
| 66. | Complex | c.5423G>C (p.*1808Sext*19) c | No | Exon 42 | 2 | - | 11.8 | |
| DNA variant type | DNA Variant | Predicted effects: [r.spl?] e or [r.(spl?)] f | ||||||
| 67. | Splicing | c.337-1G>A | [r.spl?]: exon 4 skipping, p.G113Lfs*20 | No | Intron 04 | 2 | - | 35 |
| 68. | Splicing | c.481+2T>C a | [r.spl?]: exon 4 skipping, p.G113Lfs*20 | NR | Intron 05 | - | - | 31 |
| 69. | Splicing | c.482-1G>A a | [r.spl?]: exon 6 skipping, p.A161Vfs*22 | NR | Intron 05 | - | - | 33 |
| 70. | Splicing | c.600-2A>G | [r.spl?] exon 7 skipping, p.Q200fs*3 | No | Intron 06 | 11 | - | 26.2 |
| 71. | Splicing | c.775-2A>G a | [r.spl?]: exon 9 skipping, p.L259* | NR | Intron 08 | - | - | 33 |
| 72. | Splicing | c.848+4_848+9del a | [r.(spl?)]: exon 8 skipping, p.L259Sfs*52 | NR | Intron 09 | - | - | - |
| 73. | Splicing | c.1119G>A (p.=) | [r.spl?]: exon 11 skipping, p.Ala326_Gln373del | Yes | Exon 11 | 4 | - | 19.54 |
| 74. | Splicing | c.1717-1G>A | [r.spl?]: exon 17 skipping, p.T573Sfs*5 | No | Intron 16 | 2 | - | 34 |
| 75. | Splicing | c.1947-2_ 1947-1delinsCC a | [r.spl?]: exon 19 skipping, p.M649fs*7 | NR | Intron 18 | - | - | - |
| 76. | Splicing | c.2355+2_2355+5del | r.[=,2166_2583ins2355+5_2355+7, 2166_2583ins(2355+1_2356-1)58] | Yes | Intron 21 | 17 | - | - |
| 77. | Splicing | c.2545+1G>A | [r.spl?] exon 21 skipping, p.L741_Q785del | No | Intron 22 | 5 | - | 35 |
| 78. | Splicing | c.2639+1G>A | [r.spl?] exon 22 skipping, p.R786Lfs45* | No | Intron 23 | 3 | - | 34 |
| 79. | Splicing | c.2838-122G>A h | [r.(2837_2838ins2838-120_2838-1)], p.S946Rfs*6 | Yes | Intron 25 | 11 | - | 36 |
| 80. | Splicing | c.3132-3T>G a,j | [r.(spl?)]: in-frame exon 28 skipping, p.1044del50 | Yes m | Intron 27 | - | - | 15.64 |
| 81. | Splicing | c.4493+1G>C a | [r.spl?]: exon 33 skipping, p.D1295Vfs*77 | NR | Intron 34 | - | - | 33 |
| 82. | Splicing | c.5160+1G>C | [r.spl?]: exon 39 skipping, p.D1690Dfs*6 | No | Intron 40 | 3 | - | 33 |
| 83. | Splicing | c.5160+1G>A | [r.spl?]: exon 39 skipping, p.D1690Dfs*6 | No | Intron 40 | 10 | - | 32 |
| MLPA | qPCR | ||||
|---|---|---|---|---|---|
| Segmental Deletion or Duplication | Exon | PS (p-Value) | Exon | RQ (SEM) | p-Value |
| c.(774+1_775-1)_(848+1_849-1)del | 09 | 0.58 (<0.01) | 9 | 0.45 (0.03) | <0.01 |
| c.(975+628)_(1716+41)del * | 11–16 | 0.74 (<0.01) | 12 | 0.62 (0.07) | 0.03 |
| c.(1599+1_1600-1)_(2545+1_2546-1)del | 16–22 | 0.56 (<0.01) | 19 | 0.54 (0.01) | <0.01 |
| c.(1716+1_1717-1)_(2545+1_2546-1)del | 17–22 | 0.56 (<0.01) | 19 | 0.63 (0.02) | <0.01 |
| c.(5068+1_5069-1)_(*102_?)del * | 39-PKD1 | 0.68 (<0.01) | 41 | 0.75 (0.02) | <0.01 |
| c.(?_-30)_(*102_?)del | 01–42 | 0.54 (<0.01) | 12 | 0.5 (0.03) | <0.01 |
| c.(2355+1_2356-1)_(*102_?)dup | 22–42 | 1.47 (<0.01) | 41 | 2.43 (0.07) | <0.01 |
| Variant Type | TSC1/TSC2 | Total |
|---|---|---|
| Nonsense | 8/22 | 30 |
| Frameshift | 9/20 | 29 |
| Splicing | 0/18 | 18 |
| Missense | 0/16 | 16 |
| Large deletion | 1/6 | 7 |
| In-frame deletion | 0/4 | 4 |
| Large duplication | 0/1 | 1 |
| Complex | 0/1 | 1 |
| Total | 18/88 | 106 (91.4%) |
| TSC1:TSC2 ratio | 1:4.9 | |
| No mutation identified (NMI) | 10 (8.6%) | |
| Total | 116 | |
| Benign Variant | Pathogenic Variant |
|---|---|
| c.52C>G (p.L18V) | c.4493G>T (p.Ser1498Ile) |
| c.499T>C (p.W167R) | c.4375C>T (p.Arg1459*) |
| c.2167A>G (p.I723V) | c.1195G>T (p.E399*) |
Disclaimer/Publisher’s Note: The statements, opinions and data contained in all publications are solely those of the individual author(s) and contributor(s) and not of MDPI and/or the editor(s). MDPI and/or the editor(s) disclaim responsibility for any injury to people or property resulting from any ideas, methods, instructions or products referred to in the content. |
© 2024 by the authors. Licensee MDPI, Basel, Switzerland. This article is an open access article distributed under the terms and conditions of the Creative Commons Attribution (CC BY) license (https://creativecommons.org/licenses/by/4.0/).
Share and Cite
Dufner-Almeida, L.G.; Cardozo, L.F.M.; Schwind, M.R.; Carvalho, D.; Almeida, J.P.G.; Cappellano, A.M.; Alegria, T.G.P.; Nanhoe, S.; Nellist, M.; Passos-Bueno, M.R.; et al. Molecular and Functional Assessment of TSC1 and TSC2 in Individuals with Tuberous Sclerosis Complex. Genes 2024, 15, 1432. https://doi.org/10.3390/genes15111432
Dufner-Almeida LG, Cardozo LFM, Schwind MR, Carvalho D, Almeida JPG, Cappellano AM, Alegria TGP, Nanhoe S, Nellist M, Passos-Bueno MR, et al. Molecular and Functional Assessment of TSC1 and TSC2 in Individuals with Tuberous Sclerosis Complex. Genes. 2024; 15(11):1432. https://doi.org/10.3390/genes15111432
Chicago/Turabian StyleDufner-Almeida, Luiz Gustavo, Laís F. M. Cardozo, Mariana R. Schwind, Danielly Carvalho, Juliana Paula G. Almeida, Andrea Maria Cappellano, Thiago G. P. Alegria, Santoesha Nanhoe, Mark Nellist, Maria Rita Passos-Bueno, and et al. 2024. "Molecular and Functional Assessment of TSC1 and TSC2 in Individuals with Tuberous Sclerosis Complex" Genes 15, no. 11: 1432. https://doi.org/10.3390/genes15111432
APA StyleDufner-Almeida, L. G., Cardozo, L. F. M., Schwind, M. R., Carvalho, D., Almeida, J. P. G., Cappellano, A. M., Alegria, T. G. P., Nanhoe, S., Nellist, M., Passos-Bueno, M. R., Chiavegatto, S., Silva, N. S., Rosemberg, S., Pereira, A. P. A., Antoniuk, S. A., & Haddad, L. A. (2024). Molecular and Functional Assessment of TSC1 and TSC2 in Individuals with Tuberous Sclerosis Complex. Genes, 15(11), 1432. https://doi.org/10.3390/genes15111432