Article

The Chicken HDAC4 Promoter and Its Regulation by MYC and HIF1A

1
Jiangsu Key Laboratory of Sericultural and Animal Biotechnology, School of Biotechnology, Jiangsu University of Science and Technology, Zhenjiang 212100, China
2
Key Laboratory of Silkworm and Mulberry Genetic Improvement, Ministry of Agriculture and Rural Affairs, Sericultural Scientific Research Center, Chinese Academy of Agricultural Sciences, Zhenjiang 212100, China
3
Jiangsu Province Key Laboratory of Animal Breeding and Molecular Design, College of Animal Science and Technology, Yangzhou University, Yangzhou 225009, China
*
Author to whom correspondence should be addressed.
Genes 2024, 15(12), 1518; https://doi.org/10.3390/genes15121518
Submission received: 21 September 2024 / Revised: 23 November 2024 / Accepted: 25 November 2024 / Published: 26 November 2024
(This article belongs to the Special Issue Genetic Breeding of Poultry)

Abstract

:
Background: Histone deacetylase 4 (HDAC4) is a member of the class II histone deacetylase family, whose members play a crucial role in various biological processes. An in-depth investigation of the transcriptional characteristics of chicken HDAC4 can provide fundamental insights into its function. Methods: We examined HDAC4 expression in chicken embryonic stem cells (ESC) and spermatogonial stem cells (SSC) and cloned a 444 bp fragment from upstream of the chicken HDAC4 transcription start site. Subsequently, we constructed pEGFP-HDAC4 and a series of 5′-deletion luciferase reporter constructs, which we transfected into DF-1 cells to measure their transcriptional activity. The regulatory mechanisms of chicken HDAC4 expression were investigated by performing trichostatin A (TSA) treatment, deleting putative transcription factor binding sites, and altering transcription factor expression levels. Results: HDAC4 exhibited higher expression in SSC than in ESC. We confirmed that the upstream region from −295 bp to 0 bp is the core transcriptional region of HDAC4. TSA effectively inhibited HDAC4 transcription, and bioinformatics analysis indicated that the chicken core HDAC4 promoter sequence exhibits high homology with those of other avian species. The myelocytomatosis viral oncogene homolog (MYC) and hypoxia-inducible factor 1 α (HIF1A) transcription factors were predicted to bind to this core region. Treatment with TSA for 24 h resulted in the upregulation of MYC and HIF1A, which repressed HDAC4 transcription. Conclusions: Our results provide a basis for subsequent investigations into the regulation of HDAC4 expression and biological function.

1. Introduction

Gene transcription is stringently regulated by histone acetylation [1], a process that plays a critical role in spermatogenesis, oogenesis, and gametogenesis [2]. Histone deacetylase 4 (HDAC4) is a pivotal enzyme that decreases histone acetylation levels at target gene promoters [3,4], thereby influencing various biological processes. HDAC4 expression differs between the sperm of patients with oligospermia and that of normospermic individuals [5]. Furthermore, HDAC4, together with CTNNB1, regulates the fate of spermatogonial progenitor cells [6]. HDAC4 expression levels have also been detected in spermatogonial stem cells (SSC) by polymerase chain reaction (PCR) [7] and RNA-seq [8], suggesting that HDAC4 may play an important role in the formation of chicken SSC. However, the function and regulation of the chicken HDAC4 gene remains poorly understood. Consequently, investigating the promoter and regulators of chicken HDAC4 could provide important information on its functional and regulatory mechanisms.
To date, the regulation of HDAC4 has been predominantly studied in humans and mice, with a focus on its miRNA-mediated regulation [9,10,11] and phosphorylation [12,13] and N6-methyladenosine (m6A) modifications [14]. Furthermore, upstream stimulatory factor 1 (USF1) is shown to activate p38 mitogen-activated protein kinase (MAPK) signaling by modulating HDAC4 promoter activity [15]. Additionally, Krüppel-like factor 7 (KLF7) and specificity protein-1 (SP1) transcription factors have been reported to bind to the HDAC4 promoter region to increase its expression [16,17]. In avian species, dim light (6 lux) at night increases HDAC4 expression in Indian house crows [18]. Additionally, miRNA-1 targets HDAC4, promoting the differentiation of duck myoblasts [19], whereas miR-365 directly suppresses HDAC4 protein expression in primary chicken chondrocytes [20]. Despite these findings, research on the promoter of chicken HDAC4 and its primary regulatory elements has been limited. Trichostatin A (TSA), a broad-spectrum deacetylase inhibitor, interacts efficiently with HDAC4 [21] and inhibits HDAC4 transcription [22], although the mechanism remains ill-defined.
In this study, we cloned a 444 bp fragment from upstream of the chicken HDAC4 transcription start site and substituted the CMV promoter region of the pEGFP-N1 vector with this fragment. We then generated 5′-deletion luciferase reporter constructs, transfected them into DF-1 cells, and assessed their promoter activities. To investigate how the HDAC4 expression is regulated, we treated cells with TSA, deleted putative transcription factor binding sites, and altered transcription factor levels. Our study provides a more comprehensive understanding of the function and regulatory mechanisms of the chicken HDAC4 gene.

2. Materials and Methods

2.1. Materials

Fertilized eggs were provided by the Institute of Poultry Science of the Chinese Academy of Agriculture Sciences for this study. The isolation of chicken embryonic stem cells (ESC) and spermatogonial stem cells (SSC) was performed according to the procedures described by Zhang et al. [8]. DF-1 cells, pEGFP-N1, pEGFP-N1-linker [23], pRL-SV40, PGL3-Basic, OE-MYC (MYC overexpression vector), OE-HIF1A (HIF1A overexpression vector), OE-NC (negative control of MYC and HIF1A overexpression vectors), KD-MYC (MYC knockdown vector), KD-HIF1A (HIF1A knockdown vector), and KD-NC (negative control of MYC and HIF1A knockdown vectors) were provided by our laboratory.

2.2. Bioinformatics Analysis of the HDAC4 Promoter

A number of 2000 bp upstream promoter sequences of HDAC4 (Gene ID: NM_204313.2) were retrieved from the NCBI website and analyzed using online prediction software including BDGP’s Neural Network Promoter Prediction [24], Promoter 2.0 Prediction Server [25], FPROM [26], TSSG, TSSP, and TSSW. Additionally, potential transcription factor binding sites within the HDAC4 core promoter region (from−295 bp to +1 bp) were predicted and analyzed using PROMO HOME PAGE [27] and JASPAR [28]. The website links for the prediction tools used are listed in Table S1.
The HDAC4 upstream sequence (from −295 bp to +1 bp) was obtained for 16 species including the chicken from the NCBI database (Table S2), and a homology analysis was conducted using MEGA7 to generate an evolutionary tree. Megalign was used to compare the HDAC4 promoter sequences of 16 species.

2.3. Amplification and Promoter Vectors Construction

Based on the results of promoter analysis of the proximal 2000 bp upstream region of HDAC4, the pEGFP-HDAC4 and 5′-deletion luciferase reporter constructs (PGL3-P1, PGL3-P2, and PGL3-P3) were generated (Figure 1A). Site-deletion analysis was conducted to identify the role of MYC and HIF1A putative binding sites in the chicken HDAC4 promoter using vectors bearing promoter deletions in MYC and HIF1A putative binding sites. NEBuilder (https://www.neb.com/, accessed on 29 October 2022) was used to design primers for vector construction, which were synthesized by Hangzhou Shangya Biotechnology. Each fragment was amplified using testicular DNA from 18.5-day-old Rugao yellow chicken embryos as a template. Table S3 lists the sequences of all primers used.
pEGFP-N1 was digested with AseI (New England Biolabs, Beverly, MA, USA) and BamHI (New England Biolabs, Beverly, MA, USA), whereas the PGL3-Basic was digested with KpnI (Takara, Tokyo, Japan) and HindIII (Takara, Tokyo, Japan). The ClonExpress Ultra One Step Cloning Kit (Vazyme Biotech Co., Ltd., Shanghai, China) was used to insert different fragments containing the HDAC4 promoter sequence into the corresponding linearized vector.

2.4. Cell Culture and Treatments

DF-1 cells were maintained in DMEM (Gibco, NY, USA) supplemented with 10% fetal bovine serum (FBS) (Gemini, Calabasas, CA, USA) (10% FBS-DMEM). A 12-well plate was seeded with 5 × 10⁵ cells per well. The medium was replaced after 24 h, and cells were cultured in 10% FBS-DMEM supplemented with trichostatin A (TSA) (MedChemExpress, NJ, USA) at concentrations of 10−5 M, 10−6 M, and 10−7 M. A control group was cultured in 10% FBS-DMEM without TSA. Cells were collected after 24 h and 48 h for qRT-PCR.
DF-1 cells were seeded in a 12-well plate at a density of 5 × 10⁵ cells per well, and transfection experiments were performed according to instructions provided with the Exfect® Transfection Reagent (Vazyme Biotech Co., Ltd., Shanghai, China) at a cell density of 60%. The ratio of VExfect/mplasmid (in μL/μg) was 3:1. Cells were collected after 48 h for qRT-PCR.
DF-1 cells were seeded in a 24-well plate at a density of 1 × 10⁵ cells per well, and transfections were performed at a cell density of 60%. The PGL3 recombinant vector (500 ng) and pRL-SV40 (14 ng) were co-transfected following the manufacturer’s protocol for the Exfect® Transfection Reagent. Additionally, a negative control group was set up by co-transfecting PGL3-Basic with pRL-SV40. Cells were collected after 48 h for the dual-luciferase assay.
The effect of transcription factors on the HDAC4 promoter was assessed by co-transfecting PGL3 -P2 (500 ng), transcription factor overexpression/knockdown vector (500 ng), and pRL-SV40 (14 ng) into DF-1 cells. A negative control group was also established by co-transfecting PGL3-P2, OE-NC (negative control of MYC and HIF1A overexpression vectors) or KD-NC (negative control of MYC and HIF1A knockdown vectors), and pRL-SV40. Each transfection was performed in triplicate. The experiments were repeated three times using different cell batches. Cells were collected after 48 h for the dual-luciferase assay. At least three replicates were performed in all of the above experiments.

2.5. Quantitative Real-Time PCR (qRT-PCR)

Total RNA was extracted from test samples with RNAiso Plus (Takara, Tokyo, Japan) according to the manufacturer’s instructions. Subsequently, reverse transcription of 1 μg of RNA was performed using the PrimeScript™ RT Reagent Kit with gDNA Eraser (Takara, Tokyo, Japan). Relative quantification of the target genes was conducted using NovoStart R SYBR qPCR SuperMix Plus (Novoprotein, Shanghai, China). The reverse-transcribed cDNA was diluted 5-fold. The qRT-PCR reaction system consisted of 10 µL of 2 × NovoStart SYBR qPCR mix, 0.4 µL of each gene-specific forward and reverse primer (10 µM) (Table 1), 2 µL of cDNA, and 7.2 µL of RNase-free H2O. The running program was as follows: 95 °C for 1 min (initial denaturation), 95 °C for 20 s, 60 °C for 20 s, and 72 °C for 30 s, for a total of 40 cycles. ACTB was used as an endogenous control. The data were analyzed using a 2−ΔΔCt analytical technique. qRT-PCR was performed in triplicate.

2.6. Dual-Luciferase Assay

The relative luciferase activity was measured using the Dual Luciferase Reporter Assay Kit (Vazyme Biotech Co., Ltd., Shanghai, China) according to the manufacturer’s instructions. After 48 h of transfection, the original medium was discarded, the cells were rinsed with PBS once, and 100 μL of 1× cell lysis buffer was added to each well. The cells were then lysed by shaking the plates for 5 min at room temperature. After centrifugation at 11,200 rpm for 2 min at room temperature, the cell lysates were transferred to 1.5 mL centrifuge tubes. Then, 10 μL of the supernatant was transferred to a new centrifuge tube and mixed with 50 μL of pre-equilibrated luciferase substrate at room temperature. The mixture was immediately used to measure firefly luciferase reporter gene activity using the Promega Glomax chemiluminescence detector. Subsequently, 50 μL of freshly prepared Renilla substrate working solution was added to the reaction mixture, followed by immediate mixing. Renilla luciferase reporter gene activity was then measured using the Promega fluorescence detector.

2.7. CCK8 Analysis

DF-1 cells were seeded into 96-well plates at a density of 2 × 10⁴ cells per well. After 24 h of culture, they were incubated with different concentrations of TSA/CoCl2 working solution. The effects of different concentrations of TSA on cells were assessed at 24 h and 48 h, whereas the effects of CoCl2 were assessed only at 24 h. Before the assay, the original medium was removed and replaced with 100 µL of normal medium per well. Then, 10 µL of CCK8 solution (Biosharp, Hefei, China) was added to each well. After 4 h of incubation at 37 °C, the absorbance at 450 nm was measured using a microplate reader. The absorbance values of each group were recorded for data analysis. Cell viability was calculated as (experimental well − blank well)/(control well − blank well) × 100%. Experimental wells were treated with different concentrations of TSA/CoCl2, control wells were untreated, and blank wells contained only medium without cells.

2.8. Statistical Analysis

All data are presented as the mean ± standard errors and were processed using the SPSS 19.0 statistical software. An independent sample t-test was deemed suitable for comparisons between two groups, whereas one-way analysis of variance and LSD test were chosen for comparisons among multiple groups. It was defined as significant at p < 0.05 and extreme significance at p < 0.01. GraphPad Prism 6 was used to generate data histograms.

3. Results

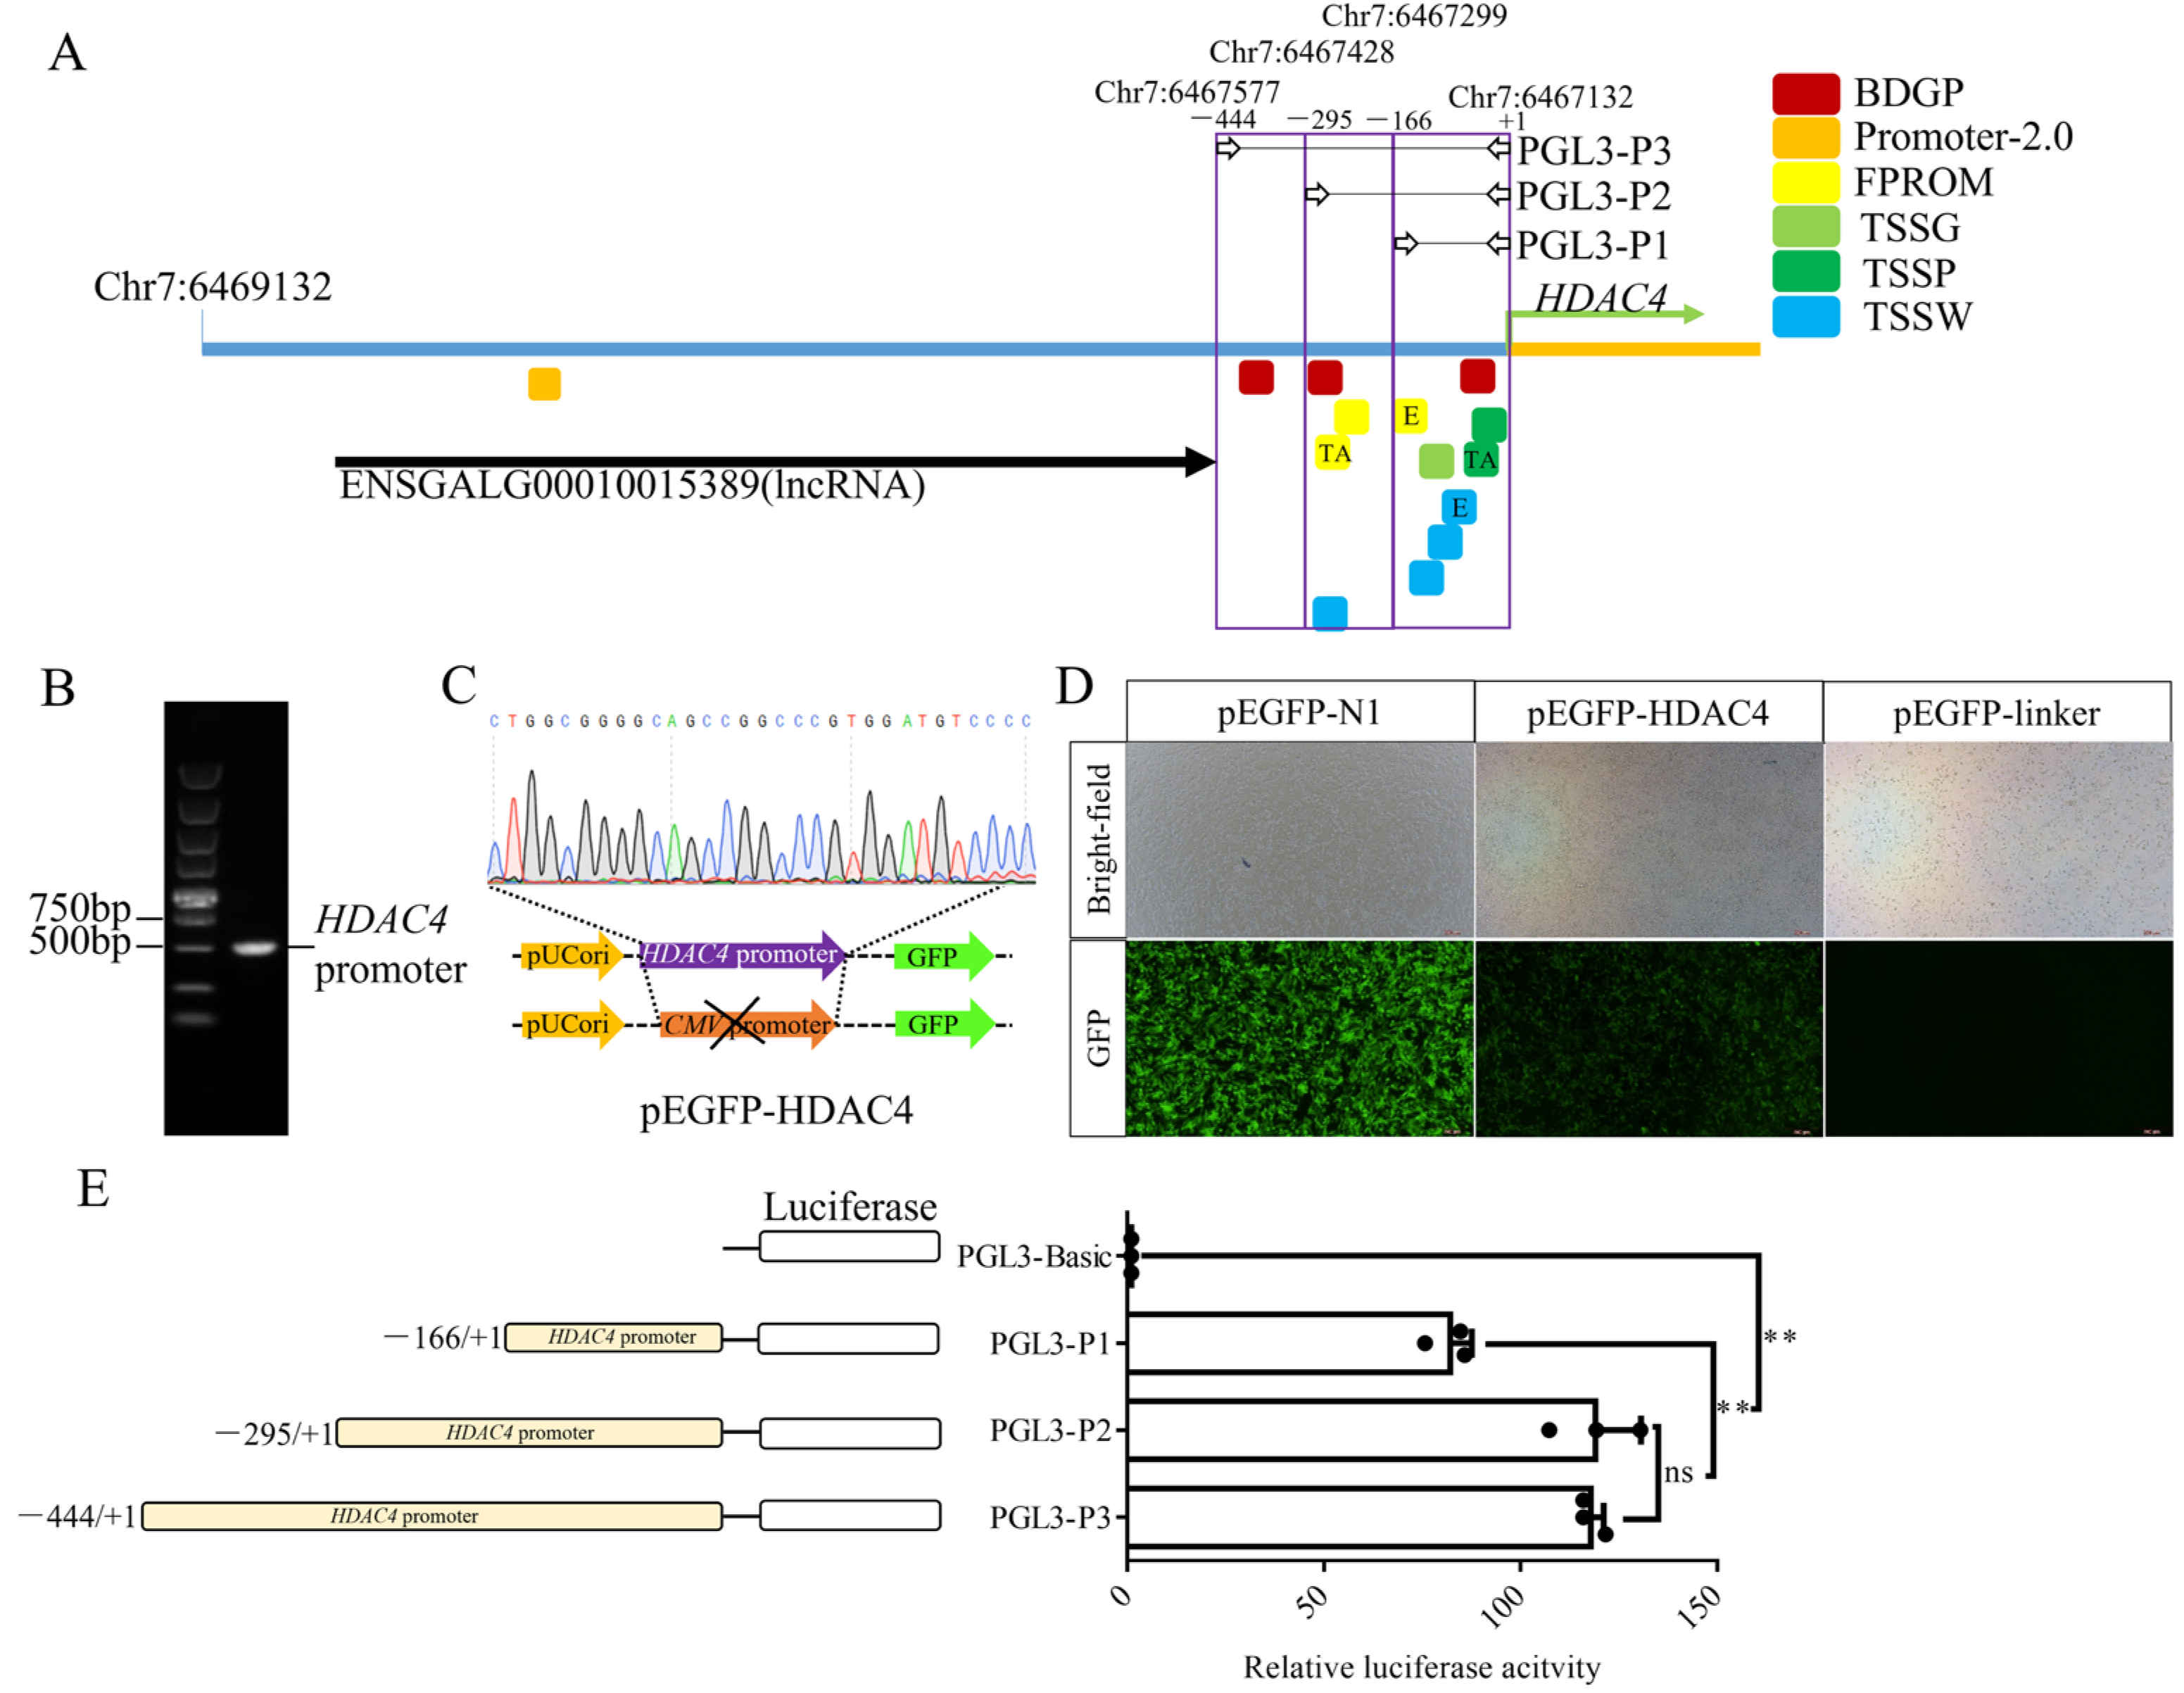
3.1. Deletion Analysis of the Upstream Region of the HDAC4 Gene

We found that HDAC4 expression was significantly higher in chicken spermatogonial stem cells (SSC) than in embryonic stem cells (ESC) (Figure S1, Table S4). To obtain a better understanding of the transcriptional regulation of the chicken HDAC4, we analyzed the 2000 bp sequence upstream of the HDAC4 transcription start site from NCBI and found an lncRNA (ENSGALG00010015389, Chr7:6468929-6467578) in the upstream −2000 to −444 bp region (Figure 1A). Additional analysis of this 2000 bp sequence using online prediction software such as BDGP revealed that the 444 bp sequence contained promoter elements such as a TATA box and an enhancer (Figure 1A). The 444 bp sequence was cloned (Figure 1B) and used to replace the CMV promoter of pEGFP-N1 to construct the pEGFP-HDAC4 (Figure 1C). We used pEGFP-N1-linker, which lacked a CMV promoter, as a negative control. After transfecting DF-1 cells with these vectors for 48 h, we observed that cells transfected with pEGFP-N1-linker did not exhibit fluorescence, whereas those transfected with pEGFP-HDAC4 exhibited weaker fluorescence than those transfected with pEGFP-N1 (Figure 1D).
Figure 1. HDAC4 promoter core region analysis. (A): Online prediction of the HDAC4 promoter region. Different color boxes correspond to the promoter positions predicted by different prediction software. TA means the predicted TATA box. E means the predicted enhancer. (B): Full-length amplification of the HDAC4 promoter (including PEGFP-N1 homologous arms). (C): Schematic diagram and sequencing chromatogram of the pEGFP-HDAC4 vector construction. (D): Validation of pEGFP-HDAC4 activity, DF-1 cells expressing green fluorescence. (E): The activity of each vector was measured by a dual-luciferase assay. Note: PGL3-P1: Fragment 1 (−166 bp to +1 bp, chr7:6467299-6467132) linked to the PGL3-Basic vector, PGL3-P2: Fragment 2 (−295 bp to +1 bp, chr7:6467428-6467132) linked to the PGL3-Basic vector, PGL3-P3: Fragment 3 (−444 bp to +1 bp, chr7:6467577-6467132) linked to the PGL3-Basic vector. ns: no significant difference, **: p < 0.01.
Genes 15 01518 g001
To further characterize the HDAC4 core promoter region, we generated a series of 5′-deletion luciferase reporter constructs, which were designed based on promoter prediction (Figure 1A). Luciferase activity was measured in transfected DF-1 cells 48 h after transfection. The results showed that cells transfected with PGL3-P1, -P2, or -P3 exhibited strong luciferase activity, with those transfected with PGL3-P2 or -P3 showing similar activity. Cells transfected with PGL3-P2 or -P3 had significantly higher activity than those transfected with PGL3-P1. This indicates the presence of important elements within the −166 to +1 bp and −295 to −166 bp regions.

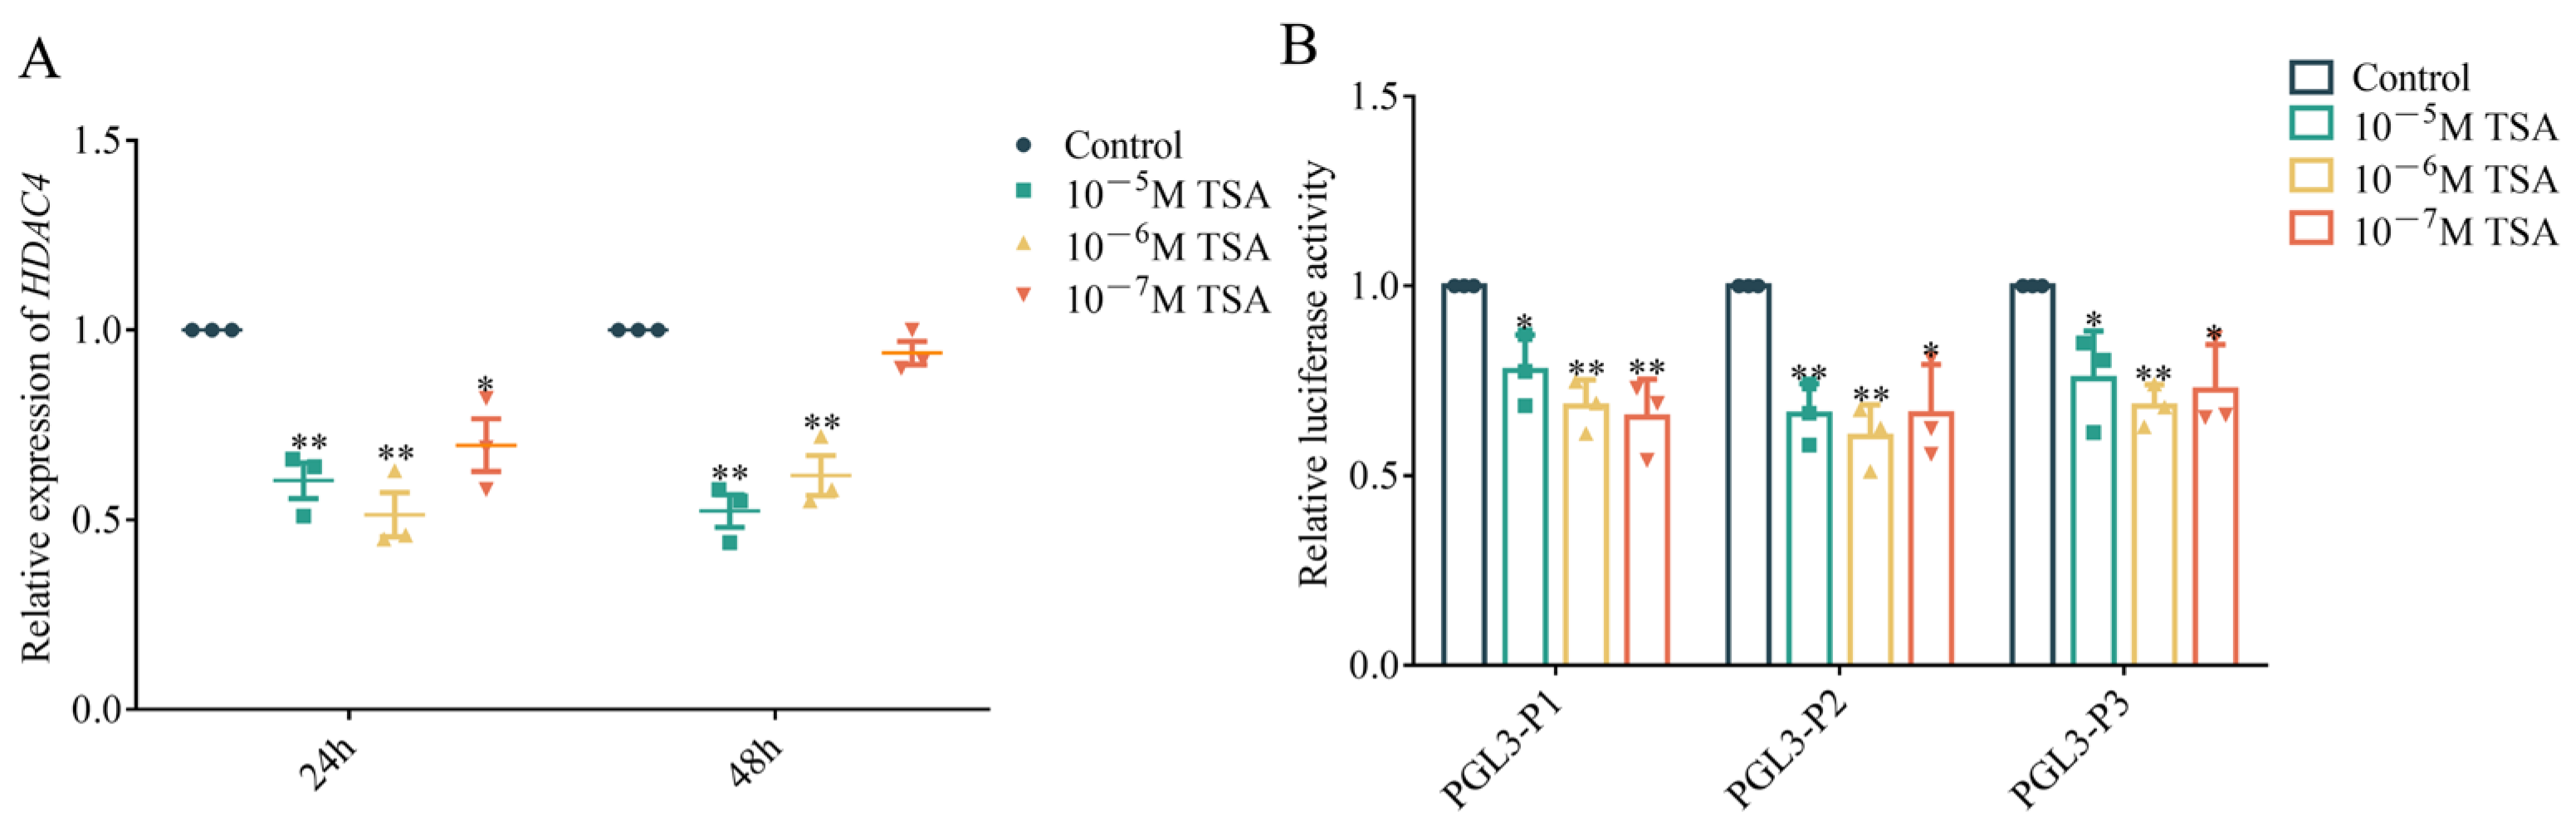
3.2. Effect of TSA on HDAC4 Transcription

To further investigate HDAC4’s transcriptional regulatory factors, we treated DF-1 cells with trichostatin A (TSA) and examined changes in DF-1 proliferation and HDAC4 expression. The results showed that TSA significantly inhibited DF-1 proliferation (Figure S2). Compared to the control group, HDAC4 was significantly inhibited after treatment with 10−5 M and 10−6 M TSA for 24 h and 48 h. While treatment with 10−7 M TSA for 24 h also led to significant downregulation of HDAC4, no significant downregulation was observed after 48 h of treatment (Figure 2A). Additionally, we treated cells transfected with luciferase reporter constructs bearing 5′ deletions of the HDAC4 promoter with different concentrations of TSA for 24 h. The results showed that TSA significantly inhibited the relative luciferase activity of all vectors (Figure 2B).

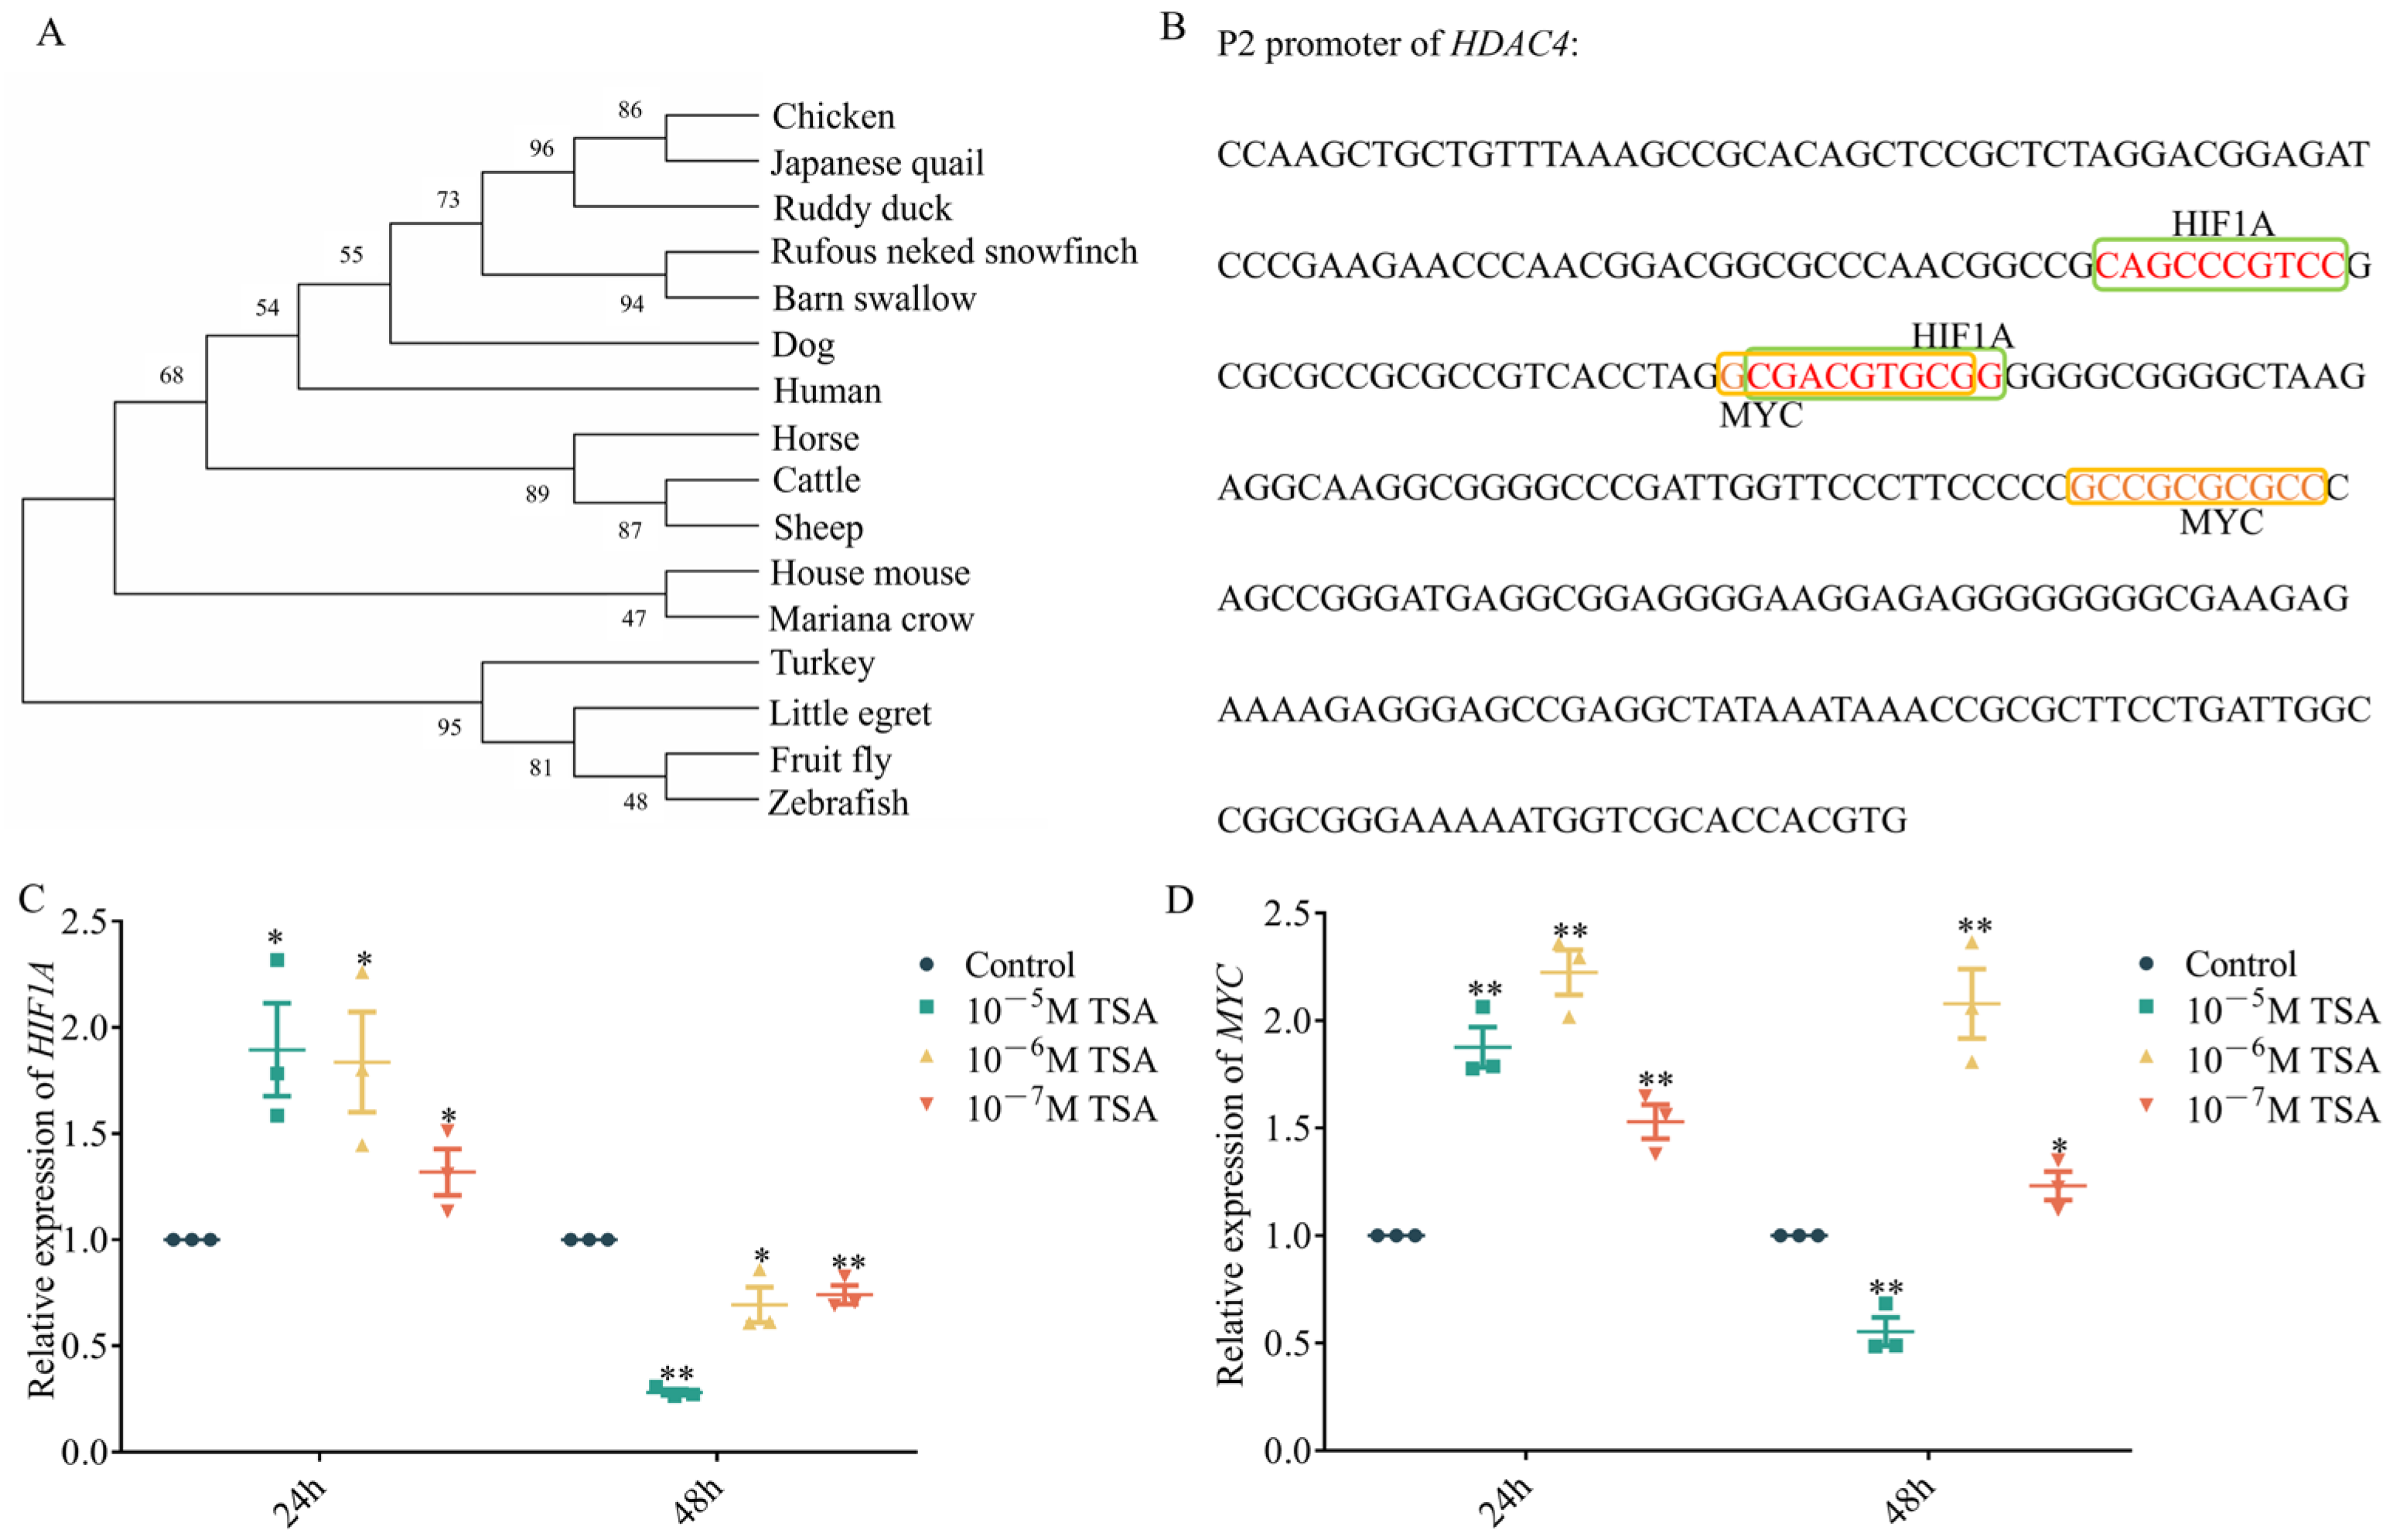
3.3. Bioinformatics of the HDAC4 Core Promoter Suggests Conserved Regulatory Sites

To further explore which transcription factors regulate HDAC4, we first conducted a homology analysis of the −295 bp to +1 bp region upstream of the HDAC4 transcription start site of different species. The results showed that the HDAC4 promoter sequence in chickens is most closely related to that of Japanese quails, followed by ruddy ducks, whereas it is more distantly related to those of mammals such as humans and dogs (Figure 3A).
Next, we identified potential binding sites for MYC and HIF1A in this region using PROMO HOME PAGE and JASPAR (Figure 3B). We also found that among the other 15 species, only the fruit fly sequence did not contain MYC and HIF1A putative binding sites (Table S2). Sequence alignment of this HDAC4 promoter region from the 16 species showed that the MYC and HIF1A putative binding sites are highly conserved in Japanese quails, ruddy ducks, and chickens (Figure S3). Additionally, MYC and HIF1A were differentially expressed in chicken ESC and SSC (Figure S4, Table S4). We also found that both MYC and HIF1A were significantly upregulated after 24 h of TSA treatment. However, after 48 h of treatment, HIF1A was downregulated, whereas MYC was upregulated upon treatment with 10−6 M and 10−7 M TSA (Figure 3C,D).

3.4. Effect of MYC and HIF1A Putative Binding Sites on HDAC4 Promoter Activity

To further validate the impact of MYC and HIF1A putative binding sites on the HDAC4 promoter, we generated recombinant vectors with deletion of MYC and HIF1A putative binding sites separately (Figure 4A,B). We then transfected them into DF-1 cells and collected samples 48 h later to measure luciferase activity. The results showed that the activity of each vector bearing a deletion in either the MYC or HIF1A putative binding site was significantly upregulated compared to PGL3-P2 (Figure 4C).

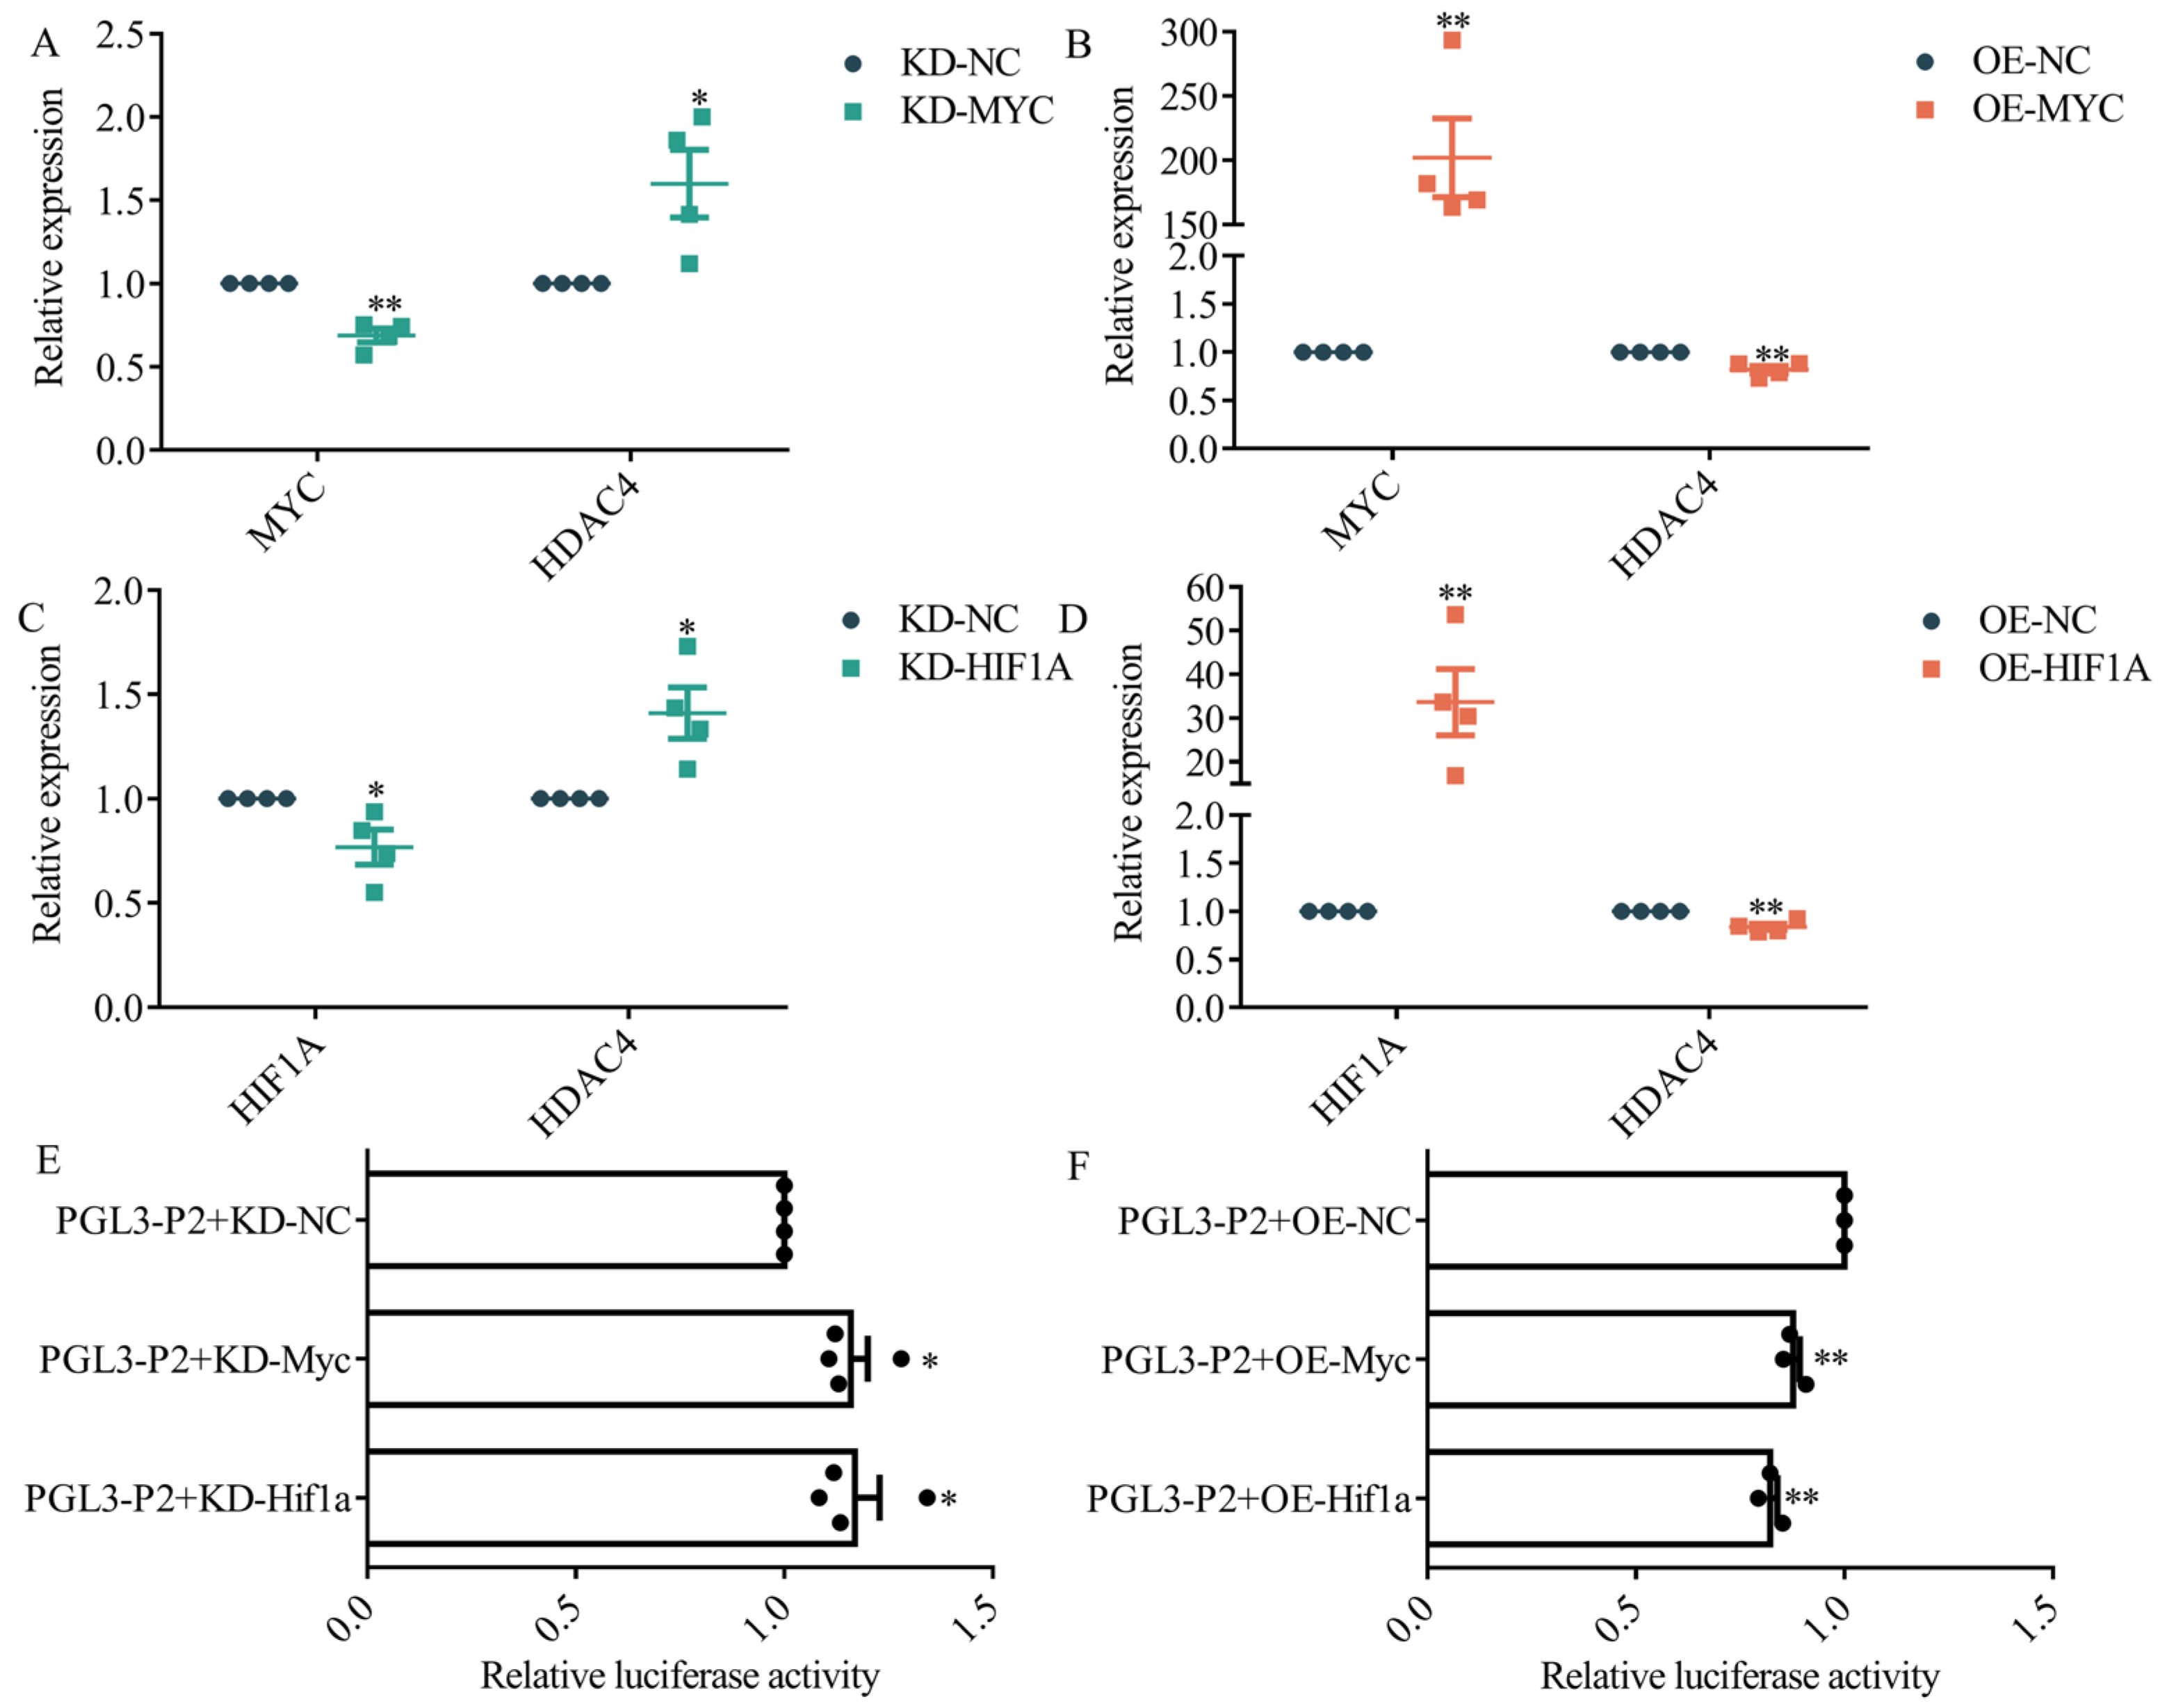
3.5. MYC and HIF1A Inhibit HDAC4 Transcription

To determine how HDAC4 is transcriptionally regulated by MYC and HIF1A, we separately transfected knockdown and overexpression vectors for MYC and HIF1A. After 48 h, cells were harvested, the total RNA was extracted, and qRT-PCR was performed after reverse transcription. The results showed that knockdown of either MYC or HIF1A significantly upregulated HDAC4 expression (Figure 5A,C). Conversely, overexpression of MYC and HIF1A significantly downregulated HDAC4 expression (Figure 5B,D).
Additionally, we co-transfected PGL3-P2 with knockdown or overexpression vectors of MYC and HIF1A into DF-1 cells. PGL3-P2 luciferase activity was significantly upregulated upon knockdown MYC and HIF1A (Figure 5E). Conversely, overexpression of MYC and HIF1A resulted in the inhibition of PGL3-P2 luciferase activity (Figure 5F).
HIF1A is a hypoxia-inducible factor, so we established a hypoxia model using CoCl2 [29] and found that CoCl2 inhibited DF-1 cell proliferation. At a concentration of CoCl2 of >0.4 mM, cell viability was <50% (Figure S5A). Subsequently, 0.4 mM CoCl2 was used to treat DF-1 cells. After 24 h, HIF1A and HDAC4 were significantly up- and downregulated, respectively (Figure S5B). In addition, treatment of PGL3-P2-transfected cells with 0.4 mM CoCl2 significantly inhibited their luciferase activity (Figure S5C).

4. Discussion

Here, we observed that HDAC4 was significantly higher in chicken spermatogonial stem cells (SSC) than in embryonic stem cells (ESC) and identified the core region of the chicken HDAC4 promoter. Treatment with trichostatin A (TSA) for 24 h inhibited HDAC4 expression while it increased MYC and HIF1A expression. Further investigation demonstrated that MYC and HIF1A inhibit transcription. These findings establish a foundation for future research on the role and regulatory mechanisms of HDAC4 expression underlying the formation of chicken SSC.
HDAC4 is involved in numerous biological processes, with its expression being modulated by a diverse array of factors. For instance, miR-145-3p has been shown to activate autophagy in multiple myeloma cells by direct targeting HDAC4 [9]. Similarly, miR-140-5p targeting HDAC4 decreased HDAC4 in chondrocytes [10], and miR-22 also inhibited HDAC4 expression [11]. Additionally, AMP-activated protein kinase (AMPK) phosphorylates HDAC4 [12,13], whereas the m6A reader YTH N6-methyladenosine RNA binding protein 2 (YTHDF2) recognizes m6A methylation, increasing HDAC4 stability [14]. In this study, we investigated the factors influencing HDAC4 transcription in chickens.
Given the critical regulatory function of promoter sequences for eukaryotic gene expression, research has focused on these sequences to elucidate gene function [30,31]. Typically, the promoter is situated upstream of the transcription start site at the 5’ end of the gene and can extend up to 2000 bp upstream from the start site. In this study, we analyzed the 2000 bp upstream sequence of the chicken HDAC4 transcription start site and found another lncRNA (ENSGALG00010015389) located between −2000 bp and −444 bp. Predictive software analysis confirmed that the majority of the key promoter elements were situated between −444 bp and 0 bp. Subsequent fluorescence results of pEGFP-HDAC4 further confirmed that this region has promoter activity. Based on the transcription direction of HDAC4 and ENSGALG00010015389, the promoter region was inferred to be a unidirectional promoter. Furthermore, truncation experiments identified that the HDAC4 core promoter region is located between −295 bp and 0 bp.
TSA, a naturally occurring dienohydroxamic acid compound, facilitates histone acetylation, modulating cellular functions through epigenetic modifications [32]. Other studies have demonstrated that certain hydroxamic acid derivatives, such as PROTACs 9 [33] and PROTACs 11 [34], can inhibit specific HDACs, albeit not HDAC4. TSA is a broad-spectrum histone deacetylase inhibitor (HDACi) that inhibits class I and II HDACs owing to its more complex molecular structure and additional functional groups. Previous studies have demonstrated that TSA can suppress HDAC4 expression [22,35]. Similarly, we observed that treatment with 10−6 M TSA resulted in the inhibition of HDAC4 transcription.
Transcription factors are essential trans-regulatory elements that regulate gene transcription. In this study, we predicted that transcription factors such as MYC, HIF1A, USF1, and SP1 can bind to the core promoter region of HDAC4 (−295 bp to 0 bp). Based on the differential transcriptome analysis of chicken ESC and SSC (Table S5) [8], we initially identified transcription factors MYC and HIF1A. MYC is integral to the self-renewal and proliferation of various stem cell types [36,37], including SSC [38,39,40]. Our research revealed that the expression of MYC and HDAC4 differed between ESC and SSC. Furthermore, compound 7c inhibits HDAC4 expression while modulating MYC expression [41]. In murine cardiac tissue, Dickkopf 3 upregulates MYC and downregulates HDAC4 expression [42]. These findings suggest a potential regulatory interaction between MYC and HDAC4. In this study, we observed that MYC bound to the core promoter region of HDAC4 and repressed its transcription. This observation implies that during the formation of chicken SSC, MYC exerts its function via HDAC4. HIF1A is a critical regulator involved in hypoxia sensing and the maintenance of cellular oxygen homeostasis. It is notably expressed in murine spermatogonial cells [43], and its deficiency impairs the proliferation of SSC [44]. Qian et al. detected an interaction between HDAC4 and HIF1A using co-immunoprecipitation assays [45]. We observed that HIF1A represses HDAC4 transcription. Furthermore, CoCl2-mediated hypoxia resulted in the inhibition of HDAC4 promoter activity and expression, thereby reinforcing the potential relationship between HIF1A and HDAC4. These findings could be valuable for future investigations into the role of the HIF1A/HDAC4 regulatory axis in chicken SSC.

5. Conclusions

This study successfully located the core promoter region of chicken HDAC4 between −295 bp to 0 bp upstream of the transcription start site. Treatment with TSA for 24 h resulted in the suppression of HDAC4 expression while concurrently enhancing the expression of MYC and HIF1A. The HDAC4 promoter region was found to contain putative binding sites for MYC and HIF1A, which inhibited HDAC4 transcription. Collectively, these findings aid understanding of transcriptional regulation of the chicken HDAC4 gene and provide a basis for further research into the role of HDAC4 in SSC.

Supplementary Materials

The following supporting information can be downloaded at: https://www.mdpi.com/article/10.3390/genes15121518/s1, Figure S1: Expression of HDAC4 in chicken ESC and SSC. **: p < 0.01. Figure S2: TSA reduces the viability of DF-1 cells. Cell viability of DF-1 measured by CCK8 assay after TSA treatment with different concentrations for 24 h and 48 h. *: p < 0.05, **: p < 0.01. Figure S3: Multiple alignment of the HDAC4 promoter from 16 species. Prediction of mostly conserved MYC and HIF1A putative binding sites in chicken. Figure S4: Expression of MYC and HIF1A in chicken ESC and SSC. **: p < 0.01. Figure S5: CoCl2 inhibits HDAC4 promoter activity. (A): Cell viability of DF-1 measured by CCK8 assay after CoCl2 treatment with different concentrations for 24 h. (B): qRT-PCR analysis of the expression of HDAC4 and HIF1A in DF-1 after 0.4 mM CoCl2 treatment for 24 h. (C): The activity of PGL3-P2 was measured by a dual-luciferase assay after 0.4 mM CoCl2 treatment for 24 h. *: p < 0.05, **: p < 0.01. Table S1: Websites of online prediction tools. Table S2: HDAC4 prediction promoter information and transcription factor binding motifs prediction in 16 species. Table S3: All primers used for the plasmid construction. Table S4: ΔCt and ΔΔCt of genes in chicken ESC and SSC. Table S5: RPKM of genes in chicken ESC and SSC.

Author Contributions

Conceptualization, Y.W. and Y.Z.; methodology, Y.W., R.K., K.X., X.W. and H.W.; software, Y.W.; validation, R.K. and K.X.; formal analysis, R.K. and K.X.; investigation, Y.W.; resources, Y.Z.; data curation, R.K.; writing—original draft preparation, Y.W.; writing—review and editing, Y.W. and Y.Z.; visualization, Y.W.; supervision, Y.Z.; project administration, Y.W.; funding acquisition, Y.W., R.K., K.X. and Y.Z.; All authors have read and agreed to the published version of the manuscript.

Funding

This research was funded by National Natural Science Foundation of China (32202660), Postgraduate Research & Practice Innocation Program of Jiangsu Province (SJCX24_2572), Jiangsu Province Undergraduate innovation and entrepreneurship training Program, the Priority Academic Program Development of Jiangsu Higher Education Institutions (202310289016Y), Yangzhou international science and technology cooperation projects (YZ2021175).

Institutional Review Board Statement

All animal experimental procedures were approved and directed by the Yangzhou University Aca-demic Committee in accordance with the Jiangsu Province Experimental Animal Management Measures (License No. 45, Jiangsu Provincial Government, China) and the U.S. National Institutes of Health guidelines (NIH Pub. No. 85-23, revised 1996).

Informed Consent Statement

Not applicable.

Data Availability Statement

The original contributions presented in the study are included in the article/Supplementary Materials; further inquiries can be directed to the corresponding author.

Acknowledgments

This research was supported by the Analysis and Testing Center of Jiangsu University of Science and Technology.

Conflicts of Interest

The authors declare no conflicts of interest.

References

  1. Kurdistani, S.K.; Tavazoie, S.; Grunstein, M. Mapping global histone acetylation patterns to gene expression. Cell 2004, 117, 721–733. [Google Scholar] [CrossRef] [PubMed]
  2. Getun, I.V.; Wu, Z.; Fallahi, M.; Ouizem, S.; Liu, Q.; Li, W.; Costi, R.; Roush, W.R.; Cleveland, J.L.; Bois, P. Functional Roles of Acetylated Histone Marks at Mouse Meiotic Recombination Hot Spots. Mol. Cell. Biol. 2017, 37, e00942-15. [Google Scholar] [CrossRef] [PubMed]
  3. Wang, Z.; Cui, J.; Li, D.; Ran, S.; Huang, J.; Chen, G. Morin exhibits a neuroprotective effect in MPTP-induced Parkinson’s disease model via TFEB/AMPK-mediated mitophagy. Phytomedicine 2023, 116, 154866. [Google Scholar] [CrossRef]
  4. Yuan, J.H.; Yang, F.; Chen, B.F.; Lu, Z.; Huo, X.S.; Zhou, W.P.; Wang, F.; Sun, S.H. The histone deacetylase 4/SP1/microrna-200a regulatory network contributes to aberrant histone acetylation in hepatocellular carcinoma. Hepatology 2011, 54, 2025–2035. [Google Scholar] [CrossRef]
  5. Sujit, K.M.; Sarkar, S.; Singh, V.; Pandey, R.; Agrawal, N.K.; Trivedi, S.; Singh, K.; Gupta, G.; Rajender, S. Genome-wide differential methylation analyses identifies methylation signatures of male infertility. Hum. Reprod. 2018, 33, 2256–2267. [Google Scholar] [CrossRef]
  6. Song, W.; Zhang, D.; Mi, J.; Du, W.; Yang, Y.; Chen, R.; Tian, C.; Zhao, X.; Zou, K. E-cadherin maintains the undifferentiated state of mouse spermatogonial progenitor cells via beta-catenin. Cell Biosci. 2022, 12, 141. [Google Scholar] [CrossRef]
  7. Cong, T. Analysis of the Expression Characteristics of HDAC4 in Mouse and Chicken Spermatogonia Stem Cells. Ph.D. Thesis, Nanjing Agricultural University, Nanjing, China, 2021. [Google Scholar]
  8. Zhang, Z.; Elsayed, A.K.; Shi, Q.; Zhang, Y.; Zuo, Q.; Li, D.; Lian, C.; Tang, B.; Xiao, T.; Xu, Q.; et al. Crucial genes and pathways in chicken germ stem cell differentiation. J. Biol. Chem. 2015, 290, 13605–13621. [Google Scholar] [CrossRef]
  9. Wu, H.; Liu, C.; Yang, Q.; Xin, C.; Du, J.; Sun, F.; Zhou, L. MIR145-3p promotes autophagy and enhances bortezomib sensitivity in multiple myeloma by targeting HDAC4. Autophagy 2020, 16, 683–697. [Google Scholar] [CrossRef]
  10. Yao, W.; Kulyar, M.F.; Ding, Y.; Du, H.; Hong, J.; Loon, K.S.; Nawaz, S.; Li, J. The Effect of miR-140-5p with HDAC4 towards Growth and Differentiation Signaling of Chondrocytes in Thiram-Induced Tibial Dyschondroplasia. Int. J. Mol. Sci. 2023, 24, 10975. [Google Scholar] [CrossRef]
  11. Wang, B.; Li, D.; Filkowski, J.; Rodriguez-Juarez, R.; Storozynsky, Q.; Malach, M.; Carpenter, E.; Kovalchuk, O. A dual role of miR-22 modulated by RelA/p65 in resensitizing fulvestrant-resistant breast cancer cells to fulvestrant by targeting FOXP1 and HDAC4 and constitutive acetylation of p53 at Lys382. Oncogenesis 2018, 7, 54. [Google Scholar] [CrossRef]
  12. Jiang, H.; Jia, D.; Zhang, B.; Yang, W.; Dong, Z.; Sun, X.; Cui, X.; Ma, L.; Wu, J.; Hu, K.; et al. Exercise improves cardiac function and glucose metabolism in mice with experimental myocardial infarction through inhibiting HDAC4 and upregulating GLUT1 expression. Basic Res. Cardiol. 2020, 115, 28. [Google Scholar] [CrossRef] [PubMed]
  13. De Sousa, G.R.; Salomao, K.B.; Nagano, L.; Riemondy, K.A.; Chagas, P.S.; Veronez, L.C.; Saggioro, F.P.; Marie, S.; Yunes, J.A.; Cardinalli, I.A.; et al. Identification of HDAC4 as a potential therapeutic target and prognostic biomarker for ZFTA-fused ependymomas. Cancer Gene Ther. 2023, 30, 1105–1113. [Google Scholar] [CrossRef]
  14. Liu, X.; Feng, M.; Hao, X.; Gao, Z.; Wu, Z.; Wang, Y.; Du, L.; Wang, C. m6A methylation regulates hypoxia-induced pancreatic cancer glycolytic metabolism through ALKBH5-HDAC4-HIF1alpha positive feedback loop. Oncogene 2023, 42, 2047–2060. [Google Scholar] [CrossRef] [PubMed]
  15. Zang, W.J.; Hu, Y.L.; Qian, C.Y.; Feng, Y.; Liu, J.Z.; Yang, J.L.; Huang, H.; Zhu, Y.Z.; Xue, W.J. HDAC4 promotes the growth and metastasis of gastric cancer via autophagic degradation of MEKK3. Br. J. Cancer 2022, 127, 237–248. [Google Scholar] [CrossRef] [PubMed]
  16. Chen, F.; Li, J.; Zheng, T.; Chen, T.; Yuan, Z. KLF7 Alleviates Atherosclerotic Lesions and Inhibits Glucose Metabolic Reprogramming in Macrophages by Regulating HDAC4/miR-148b-3p/NCOR1. Gerontology 2022, 68, 1291–1310. [Google Scholar] [CrossRef]
  17. Liu, Z.M.; Wang, X.; Li, C.X.; Liu, X.Y.; Guo, X.J.; Li, Y.; Chen, Y.L.; Ye, H.X.; Chen, H.S. SP1 Promotes HDAC4 Expression and Inhibits HMGB1 Expression to Reduce Intestinal Barrier Dysfunction, Oxidative Stress, and Inflammatory Response after Sepsis. J. Innate Immun. 2022, 14, 366–379. [Google Scholar] [CrossRef]
  18. Taufique, S.; Prabhat, A.; Kumar, V. Illuminated night alters hippocampal gene expressions and induces depressive-like responses in diurnal corvids. Eur. J. Neurosci. 2018, 48, 3005–3018. [Google Scholar] [CrossRef]
  19. Wu, N.; Gu, T.; Lu, L.; Cao, Z.; Song, Q.; Wang, Z.; Zhang, Y.; Chang, G.; Xu, Q.; Chen, G. Roles of miRNA-1 and miRNA-133 in the proliferation and differentiation of myoblasts in duck skeletal muscle. J. Cell. Physiol. 2019, 234, 3490–3499. [Google Scholar] [CrossRef]
  20. Guan, Y.J.; Yang, X.; Wei, L.; Chen, Q. MiR-365: A mechanosensitive microRNA stimulates chondrocyte differentiation through targeting histone deacetylase 4. FASEB J. 2011, 25, 4457–4466. [Google Scholar] [CrossRef]
  21. Xue, Y.; Chen, C.; Tan, R.; Zhang, J.; Fang, Q.; Jin, R.; Mi, X.; Sun, D.; Xue, Y.; Wang, Y.; et al. Artificial Intelligence-Assisted Bioinformatics, Microneedle, and Diabetic Wound Healing: A “New Deal” of an Old Drug. ACS Appl. Mater. Interfaces 2022, 14, 37396–37409. [Google Scholar] [CrossRef]
  22. Zhu, K.; Wang, H.; Gul, Y.; Zhao, Y.; Wang, W.; Liu, S.; Wang, M. Expression characterization and the promoter activity analysis of zebrafish hdac4. Fish Physiol. Biochem. 2012, 38, 585–593. [Google Scholar] [CrossRef] [PubMed]
  23. Wang, H.; Zhang, L.; Hou, M.; Wang, C.; Wang, L.; Sun, T.; He, H.; Zhong, J. Cloning and Activity Analysis of Bovine Natural Resistance Associated Macrophage Protein 1 (Nramp1) Gene Promoter. Sci. Agric. Sin. 2011, 44, 1022–1028. [Google Scholar]
  24. Khan, R.; Ali, Z.; Niazi, A.K.; Carolan, J.C.; Wilkinson, T.L. In silico Characterization of a Candidate Protein from Aphid Gelling Saliva with Potential for Aphid Control in Plants. Protein Pept. Lett. 2020, 27, 158–167. [Google Scholar] [CrossRef]
  25. Chen, Y.; He, X.; Cheng, F.; Li, M.; Wu, X.; Zhang, C.; Li, J.; Huang, B.; Qi, M. Angiotensin II promotes EMT of hepatocellular carcinoma cells through high mobility group protein B1 mediated by E4F1. Biochem. Biophys. Res. Commun. 2021, 547, 198–203. [Google Scholar] [CrossRef]
  26. Solovyev, V.; Kosarev, P.; Seledsov, I.; Vorobyev, D. Automatic annotation of eukaryotic genes, pseudogenes and promoters. Genome Biol. 2006, 7 (Suppl. S1), S10–S11. [Google Scholar] [CrossRef]
  27. Liu, X.; Chen, J.G.; Munshi, M.; Hunter, Z.R.; Xu, L.; Kofides, A.; Tsakmaklis, N.; Demos, M.G.; Guerrera, M.L.; Chan, G.G.; et al. Expression of the prosurvival kinase HCK requires PAX5 and mutated MYD88 signaling in MYD88-driven B-cell lymphomas. Blood Adv. 2020, 4, 141–153. [Google Scholar] [CrossRef]
  28. Li, S.; Wei, X.; He, J.; Cao, Q.; Du, D.; Zhan, X.; Zeng, Y.; Yuan, S.; Sun, L. The comprehensive landscape of miR-34a in cancer research. Cancer Metastasis Rev. 2021, 40, 925–948. [Google Scholar] [CrossRef]
  29. Rana, N.K.; Singh, P.; Koch, B. CoCl2 simulated hypoxia induce cell proliferation and alter the expression pattern of hypoxia associated genes involved in angiogenesis and apoptosis. Biol. Res. 2019, 52, 12. [Google Scholar] [CrossRef]
  30. Oudelaar, A.M.; Higgs, D.R. The relationship between genome structure and function. Nat. Rev. Genet. 2021, 22, 154–168. [Google Scholar] [CrossRef]
  31. Li, M.; Xing, W.; Wang, B.; Qi, N.; Liu, J.; Yu, S. Analysis of core promoter and transcription factors screening of porcine ATG7 gene. Gene 2024, 899, 148138. [Google Scholar] [CrossRef]
  32. Gao, Q.; Wei, A.; Chen, F.; Chen, X.; Ding, W.; Ding, Z.; Wu, Z.; Du, R.; Cao, W. Enhancing PPARgamma by HDAC inhibition reduces foam cell formation and atherosclerosis in ApoE deficient mice. Pharmacol. Res. 2020, 160, 105059. [Google Scholar] [CrossRef] [PubMed]
  33. Yang, H.; Lv, W.; He, M.; Deng, H.; Li, H.; Wu, W.; Rao, Y. Plasticity in designing PROTACs for selective and potent degradation of HDAC6. Chem. Commun. 2019, 55, 14848–14851. [Google Scholar] [CrossRef] [PubMed]
  34. Wu, H.; Yang, K.; Zhang, Z.; Leisten, E.D.; Li, Z.; Xie, H.; Liu, J.; Smith, K.A.; Novakova, Z.; Barinka, C.; et al. Development of Multifunctional Histone Deacetylase 6 Degraders with Potent Antimyeloma Activity. J. Med. Chem. 2019, 62, 7042–7057. [Google Scholar] [CrossRef] [PubMed]
  35. Du, J.; Zhang, L.; Zhuang, S.; Qin, G.J.; Zhao, T.C. HDAC4 degradation mediates HDAC inhibition-induced protective effects against hypoxia/reoxygenation injury. J. Cell. Physiol. 2015, 230, 1321–1331. [Google Scholar] [CrossRef]
  36. Lim, H.J.; Kim, J.; Park, C.H.; Lee, S.A.; Lee, M.R.; Kim, K.S.; Kim, J.; Bae, Y.S. Regulation of c-Myc Expression by Ahnak Promotes Induced Pluripotent Stem Cell Generation. J. Biol. Chem. 2016, 291, 752–761. [Google Scholar] [CrossRef]
  37. Lu, Y.; Yang, L.; Shen, M.; Zhang, Z.; Wang, S.; Chen, F.; Chen, N.; Xu, Y.; Zeng, H.; Chen, M.; et al. Tespa1 facilitates hematopoietic and leukemic stem cell maintenance by restricting c-Myc degradation. Leukemia 2023, 37, 1039–1047. [Google Scholar] [CrossRef]
  38. Braydich-Stolle, L.; Kostereva, N.; Dym, M.; Hofmann, M.C. Role of Src family kinases and N-Myc in spermatogonial stem cell proliferation. Dev. Biol. 2007, 304, 34–45. [Google Scholar] [CrossRef]
  39. Kanatsu-Shinohara, M.; Tanaka, T.; Ogonuki, N.; Ogura, A.; Morimoto, H.; Cheng, P.F.; Eisenman, R.N.; Trumpp, A.; Shinohara, T. Myc/Mycn-mediated glycolysis enhances mouse spermatogonial stem cell self-renewal. Genes Dev. 2016, 30, 2637–2648. [Google Scholar] [CrossRef]
  40. Kanatsu-Shinohara, M.; Onoyama, I.; Nakayama, K.I.; Shinohara, T. Skp1-Cullin-F-box (SCF)-type ubiquitin ligase FBXW7 negatively regulates spermatogonial stem cell self-renewal. Proc. Natl. Acad. Sci. USA 2014, 111, 8826–8831. [Google Scholar] [CrossRef]
  41. Tilekar, K.; Hess, J.D.; Upadhyay, N.; Bianco, A.L.; Schweipert, M.; Laghezza, A.; Loiodice, F.; Meyer-Almes, F.J.; Aguilera, R.J.; Lavecchia, A.; et al. Thiazolidinedione “Magic Bullets” Simultaneously Targeting PPARgamma and HDACs: Design, Synthesis, and Investigations of their In Vitro and In Vivo Antitumor Effects. J. Med. Chem. 2021, 64, 6949–6971. [Google Scholar] [CrossRef]
  42. Lu, D.; Bao, D.; Dong, W.; Liu, N.; Zhang, X.; Gao, S.; Ge, W.; Gao, X.; Zhang, L. Dkk3 prevents familial dilated cardiomyopathy development through Wnt pathway. Lab. Investig. 2016, 96, 239–248. [Google Scholar] [CrossRef] [PubMed]
  43. Takahashi, N.; Davy, P.M.; Gardner, L.H.; Mathews, J.; Yamazaki, Y.; Allsopp, R.C. Hypoxia Inducible Factor 1 Alpha Is Expressed in Germ Cells throughout the Murine Life Cycle. PLoS ONE 2016, 11, e0154309. [Google Scholar] [CrossRef] [PubMed]
  44. Morimoto, H.; Yamamoto, T.; Miyazaki, T.; Ogonuki, N.; Ogura, A.; Tanaka, T.; Kanatsu-Shinohara, M.; Yabe-Nishimura, C.; Zhang, H.; Pommier, Y.; et al. An interplay of NOX1-derived ROS and oxygen determines the spermatogonial stem cell self-renewal efficiency under hypoxia. Genes Dev. 2021, 35, 250–260. [Google Scholar] [CrossRef]
  45. Qian, D.Z.; Kachhap, S.K.; Collis, S.J.; Verheul, H.M.; Carducci, M.A.; Atadja, P.; Pili, R. Class II histone deacetylases are associated with VHL-independent regulation of hypoxia-inducible factor 1 alpha. Cancer Res. 2006, 66, 8814–8821. [Google Scholar] [CrossRef]
Figure 2. TSA inhibited HDAC4 transcription. (A): qRT-PCR analysis of the expression of HDAC4 in DF-1 after TSA treatment with different concentrations for 24 h and 48 h. (B): The activity of each vector was measured by a dual-luciferase assay after TSA treatment with different concentrations for 24 h. *: p < 0.05, **: p < 0.01.
Genes 15 01518 g002
Figure 3. Bioinformatics analysis of the HDAC4 core promoter region. (A): Homology analysis of the upstream −295 bp to +1 bp region of HDAC4 transcription start site in different species. (B): Prediction of transcription factors putative binding to the upstream −295 bp to +1 bp region of chicken HDAC4 transcription start site. (C,D): qRT-PCR analysis of the expression of HIF1A and MYC in DF-1 after TSA treatment with different concentrations for 24 h and 48 h. *: p < 0.05, **: p < 0.01.
Genes 15 01518 g003
Figure 4. Effect of HIF1A and MYC putative binding sites on HDAC4 promoter activity. (A): Sequence of transcription factor putative binding sites of HIF1A and MYC. (B): Schematic diagram of deletion vectors for the putative binding sites of HIF1A and MYC. (C): The activity of each MYC/HIF1A putative binding site deletion vector was measured by a dual-luciferase assay. ns: no significant difference, **: p < 0.01.
Genes 15 01518 g004
Figure 5. HIF1A and MYC inhibit HDAC4 transcription. (A,B): qRT-PCR analysis of the expression of MYC and HDAC4 in DF-1 after transfection with KD-MYC (MYC knockdown vector) or OE-MYC (MYC overexpression vector). (C,D): qRT-PCR analysis of the expression of HIF1A and HDAC4 in DF-1 after transfection with KD-HIF1A (HIF1A knockdown vector) or OE-HIF1A (HIF1A overexpression vector). (E): The activity of PGL3-P2 was measured by dual-luciferase assay after transfection with KD-MYC or KD-HIF1A. (F): The luciferase activity of PGL3-P2 was measured by a dual-luciferase assay after transfection with OE-MYC or OE-HIF1A. *: p < 0.05, **: p < 0.01.
Genes 15 01518 g005
Table 1. Primers for qRT-PCR.
GeneGene IDPrimer (5′–3′)
ACTBNM_205518.2qF: ACCAACTGGGATGATATGGAGAA
qR:TTGGCTTTGGGGTTCAGG
HDAC4NM_204313.2qF: GTTGGAGCAGCAGCGCATTC
qR: TGGCTTAGTGGGTGGCTCCT
MYCNM_001030952.2qF: GGTCTTCCCCTACCCGCTCA
qR:CGGACTGTGGTGGGGCTTAC
HIF1ANM_001396327.1qF: CAAGAGCAACCAACCAGCCCT
qR: TGATCAAAGGAGCGTAGCTGGA
Disclaimer/Publisher’s Note: The statements, opinions and data contained in all publications are solely those of the individual author(s) and contributor(s) and not of MDPI and/or the editor(s). MDPI and/or the editor(s) disclaim responsibility for any injury to people or property resulting from any ideas, methods, instructions or products referred to in the content.

