Article

Identification and Validation of Reference Genes for qRT-PCR Analysis of Petal-Color-Related Genes in Rosa praelucens

Flower Research Institute, Yunnan Academy of Agricultural Sciences, Kunming 650205, China
*
Author to whom correspondence should be addressed.
Genes 2024, 15(3), 277; https://doi.org/10.3390/genes15030277
Submission received: 29 December 2023 / Revised: 18 February 2024 / Accepted: 21 February 2024 / Published: 23 February 2024
(This article belongs to the Section Plant Genetics and Genomics)

Abstract

:
The flower’s color is regarded as one of the most outstanding features of the rose. Rosa praelucens Byhouwer, an endemic and critically endangered decaploid wild rose species, is abundant in phenotypic diversity, especially in flower color variation, from white to different degrees of pink. The mechanism underlying this variation, e.g., the level of petal-color-related genes, is worth probing. Seven candidate reference genes for qRT-PCR analysis, including tubulin α chain (TUBA), glyceraldehyde-3-phosphate dehydrogenase (GAPDH), histone H2B (Histone2A), eukaryotic translation elongation factor 1-α (EEF1A), 60S ribosomal protein (RPL37), eukaryotic translation initiation factor 1-α (EIF1A), and aquaporins (AQP), were detected from the transcriptome datasets of full blooming flowers of white-petaled and pink-petaled individuals, and their expression stabilities were evaluated through qRT-PCR analysis. According to stability rankings analysis, EEF1A showed the highest stability and could be chosen as the most suitable reference gene. Moreover, the reliability of EEF1A was demonstrated via qRT-PCR analysis of six petal-color-related target genes, the expression patterns of which, through EEF1A normalization, were found to be consistent with the findings of transcriptome analysis. The result provides an optimal reference gene for exploring the expression level of petal-color-related genes in R. praelucens, which will accelerate the dissection of petal-color-variation mechanisms in R. praelucens.

1. Introduction

Rosa praelucens Byhouwer refers to critically endangered wild rose species endemic to Shangri-La county in northwestern Yunnan, China [1,2]. As a well-known alpine ornamental plant [3] and an important rose germplasm resource with cold tolerance [4] and aphid resistance [5], R. praelucens has drawn considerable attention [6,7,8,9,10,11,12] since it was found to be the only extant natural decaploid species (2n = 10x = 70) with the highest number of chromosomes in the genus [13]. R. praelucens is abundant in phenotypic variation, among which flower color variation is most conspicuous [6,14]. In addition to the common color fading with the opening process of a single flower, the colors of full-bloom flowers from different individuals within or among populations show significant differences. Most individuals have flowers that are in different degrees of pink, while some individuals have white flowers.
Flower color has a vital impact on the attractiveness of rose flowers for insects, and has an important aesthetic value for humans. Inherited from different genetic background species, most flower colors, except blue, are naturally present in roses [15], mostly identified by the constituent profile of the chemicals, e.g., flavonoids and anthocyanins. Limited flower colors can be obtained within a species because of genetic constraints [16]. In roses, yellow and orange colors are caused by carotenoid pigment accumulation, while red colors are due to anthocyanin accumulation, mostly glycosylated xantho-cyaniding [17,18]. Various homologues of anthocyanin biosynthesis pathway genes are accumulated in the process of pigment accumulation in the rose petals of R. chinensis ‘Old Blush’ when buds redden rapidly [17], and the unigene of the Cy-3,5-diglucoside-catalyzing enzyme (RhGT1) [19] decreases in the fully flowering stage when the petal color becomes lighter. This is completely different from in petunia. The formation of white- or red-colored petunia flowers is determined by the enzymatic competition between FLS and DFR, showing a close relationship to the disequilibrium of FLS and DFR expression [20].
Loss of duplicate gene expression and function, cis- and trans-acting effects, RNA-mediated pathways, and regulatory networks, etc., might have resulted in commonly seen phenotypic variation in polyploid wild plants and domesticated crops [21]. Polyploidy results in an immediate elevation in gene dosage throughout the genome. With more gene copies, polyploids may have elevated (or altered) gene expression, which would exert potential influence on a lot of phenotypic traits [22]. Also, epigenetic-regulated gene silencing might also immediately affect the gene expression for polyploid plants [23]. For some dose-dependent genes, e.g., ETH, their expression has some differences between the diploid roses and the tetraploid roses [17]. As for the decaploid R. praelucens, there is nothing known for explaining its phenotypic diversity, especially the flower color variation. As far as gene expression is concerned, it is necessary to screen the key related genes and their intraspecific expression first for elucidating the color variation within this decaploid species, which will then also be helpful for us to understand the effect of the most popular ploidy level, tetraploidy, on the phenotypic variation in modern roses.
Quantitative real-time PCR (qRT-PCR) is the most prominent and extensively used technique to quantify the expression of candidate genes owing to its high sensitivity, sufficient reproducibility, and wide quantification range, as well as ease of use [24]. However, a lack of experimental standardization, including data normalization, directly influences the reproducibility and integrity of biological replications of qRT-PCR experiments [25]. Data normalization is often established by containing stably expressed reference genes to correct an assay for sample-to-sample variation. In addition, the most popular reference genes are the “housekeeping genes”, including actin (ACT), tubulin (TUBA and TUBB), eukaryotic translation elongation factor 1-α (EEF1A), ubiquitin (UBQ), and glyceraldehyde-3-phosphate dehydrogenase (GAPDH). However, more and more studies have indicated that many of these genes are inappropriate for qRT-PCR analysis, as their expression could probably be altered by developmental and environmental factors [26,27,28]. It is widely accepted that reference genes are specific to experimental situations and even the ploidy levels [29], and suitable reference genes have to be experimentally detected for each species and for each certain experiment [28,30,31].
In roses, PP2A and UBC were shown to be more stable and suitable than those traditional housekeeping genes as references for the study of stress [29]. Different genes were chosen as the references under different postharvest conditions for more accurate and widespread application of qRT-PCR analysis in rose flowers, e.g., RhUBI1 for dehydration treatment and receptacles, RhTUB2 for exogenous ethylene, RhUBI6 for petals, etc. [32]. As for the expression of petal-color-related genes in roses, there is no special selection of reference genes and the traditional ones adopted for Chrysanthemum [33], such as ACT [17] and GAPDH [34], are often used.
In this work, based on the transcriptome data of R. praelucens samples, with the aim of studying petal-color-related genes and their expression, we selected seven candidate reference genes and investigated their expression stability. The results provide optimal reference genes for exploring the level of petal-color-related genes in R. praelucens, as well as in modern roses, and also make contributions to understand the molecular mechanisms of intraspecific flower color diversity in plants.

2. Materials and Methods

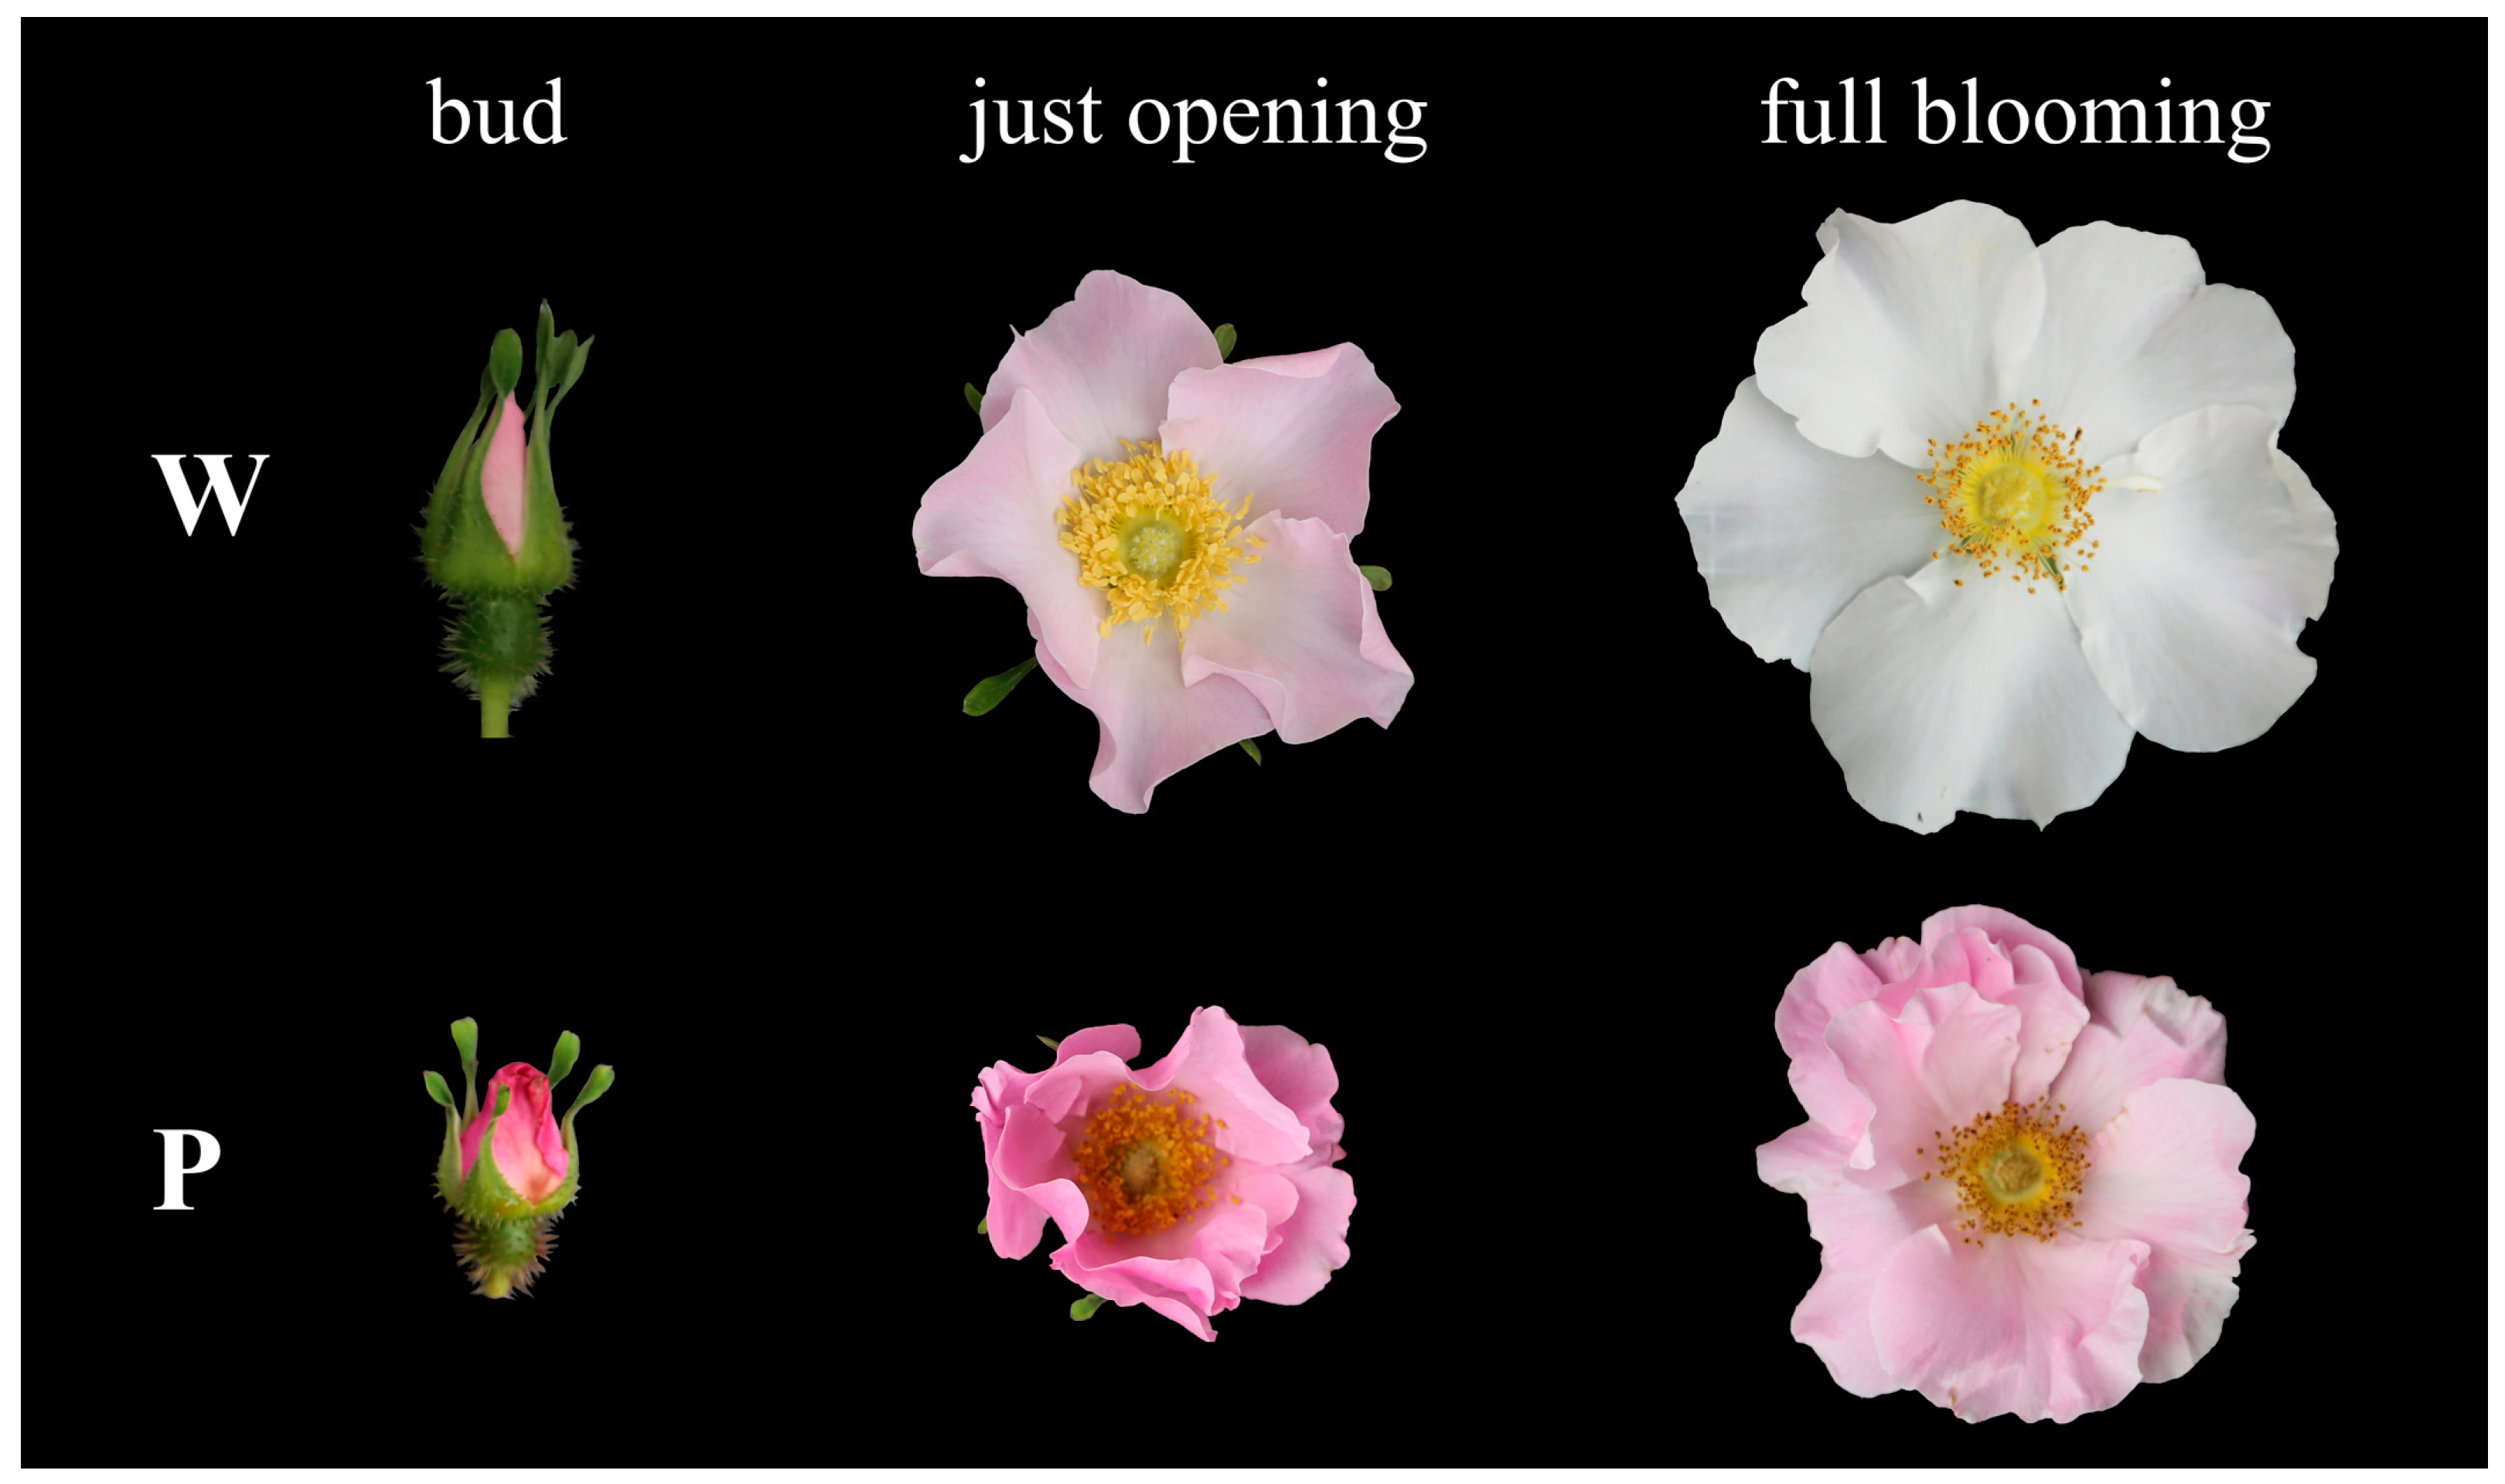
2.1. Plant Materials and Sampling

Flowers at three different floral development stages of R. praelucens with white and pink petals (Figure 1) were used for RNA-seq. All the sampled plants were naturally distributed in Xiaozhongdian town of Shangrila county in southwestern Yunnan Province, China. The environment and climate of their habitats were almost identical. The flowers at the same development stage removed of sepals and the bottom three-quarters of the hypanthium from one plant were mixed as one sample and immediately frozen in liquid nitrogen. Three plants with the same petal color at almost the same age and growth status were sampled for each replicate, and then a total of 18 samples were gathered and preserved at −80 °C within a refrigerator until further experiments were conducted.

2.2. Candidate Reference Genes, Petal-Color-Related Genes Selection, and Primer Design

Because color difference looks most significant and development is relatively stable at the full-blooming stage before senescence, the transcriptome dataset of the full-blooming stage was used for screening the candidate reference genes for color variation in line with the relative stability of the expression patterns of the genes (fragments per kb per million reads; FPKM) [35]. The seven commonly used candidate reference genes including tubulin α chain (TUBA), GAPDH, histoneH2B (Histone2A), EEF1A, 60S ribosomal protein (RPL37), eukaryotic translation initiation factor 1-α (EIF1A), and aquaporins (AQP) were selected to be potential reference genes for exploring the relative expression of petal-color-related genes in R. praelucens (Table 1). Additionally, according to the functional annotation of DEGs (differentially expressed genes) from the transcript analysis, six genes related to petal color variation at the full-blooming stage were assigned for validation of the most reliable reference genes. Expression of all of them was up-regulated in transcriptome libraries of pink-flowered R. praelucens compared with white ones (Table 2). Primers of the candidate reference genes and the petal-color-related genes were designed with the use of the Primer Premier 5.0 software [36], as presented in Table 3.

2.3. RNA Extraction

In line with the specifications of the manufacturer, the total RNA of each sample was extracted using the RNAQUEOUS KIT Ambion-1912 (Oebiotech, Shanghai, China). The extracted RNA concentration and quality (OD260/OD280 value) were evaluated using a NanoDrop 2000 spectrophotometer (Thermo Scientific, Waltham, MA, USA). Then, the integrity was confirmed with agarose gel electrophoresis (1%) stained with ethidium bromide.

2.4. Real-Time Quantitative RT-PCR

Quantification was carried out with a two-step reaction process including reverse transcription (RT) and PCR. Each RT reaction consisted of 0.5 μg RNA, 2 μL of 5× TransScript all-in-one SuperMix for qPCR, and 0.5 μL of gDNA Remover, in a total volume of 10 μL. The reactions were conducted within a GeneAmp® PCR System 9700 (Applied Biosystems, Foster City, CA, USA). The reaction conditions were 15 min at 42 °C and 5 s at 85 °C. The 10 μL RT reaction mix was ten-time diluted with nuclease-free water, and then stored at −20 °C.
Real-time PCR was carried out with a LightCycler® 480 II Real-time PCR Instrument (Roche, Basel, Switzerland) with 10 μL of PCR reaction mixture including 1 μL of cDNA, 5 μL of 2× PerfectStartTM Green qPCR SuperMix, 0.2 μL of forward primer, and 0.2 μL of reverse primer, as well as 3.6 μL of nuclease-free water. The primer sequences were synthesized by TsingKe Biotech, Beijing, China (Table 2). The reactions were subject to incubation within a 384-well optical plate (Roche, Basel, Switzerland) at 94 °C for 30 s, followed by 45 cycles of 94 °C for 5 s, 60 °C for 30 s. In addition, each sample was run in triplicate for performing the analysis. At the termination of the PCR cycles, a melting curve analysis was carried out, aiming to confirm the specific generation of the expected PCR product. Next, cycle threshold (Ct) values of each gene were automatically computed and then saved [37].

2.5. Analysis of Expression Stability

The expression stability of the candidate reference genes was assessed with three common software programs, geNorm version 3.4 [38], NormFinder version 20 [39], and BestKeeper version 1 [40], using the Ct values calculated from qRT-PCR data in accordance with the 2−ΔΔCT method [41]. Firstly, geNorm was employed to compute the average expression stability (M value) of each candidate reference gene according to pairwise expression ratios and to identify the optimal number of reference genes by pairwise variation value (Vn/n+1, where n represents the reference gene number) [24,38]. Usually, a gene can be chosen as a reference gene when its M value is below 0.15. The lower the M value, the more stable the gene [37]. Secondly, NormFinder was applied to compute the stability value (SV) of the reference genes through analyzing the intra- and inter-group variation [39]. Those exhibiting a lower level of expression than the average SVs were thought to be the most stable candidate reference genes [37]. Bestkeeper, on the basis of the standard deviation value (SD) is usually further adopted for evaluating the expression stability of candidate reference genes [40]. The programs were run in line with their respective manuals’ instructions. The geometric mean method [42] was adopted for comprehensively ranking the expression stability of the candidate reference genes from the above software. Data analysis, statistics, and graphing were carried out by Microsoft Excel 2016 and Data Processing System [43]. We obtained statistical differences through an independent t-test at p < 0.05.

2.6. Validation of Reference Gene

Additionally, the reliability of the top reference gene at the comprehensive ranking list was validated by comparing the expression pattern of six petal-color-related target genes (Table 2) via qRT-PCR analysis normalized by the selected reference gene with that in the transcriptome analysis. In addition, the qRT-PCR method remained the same as mentioned above, with three biological replicates.

3. Results

3.1. Isolation of Candidate Reference Genes from Transcriptome Analysis

Based on the RNA-seq transcriptome data of R. praelucens, the FPKM value of the seven candidate reference genes are presented in Table 1. Except for the FPKMs of TUBA and GAPDH, which were a little bit lower than 60, those of the other genes were higher than 100 (Table S1).

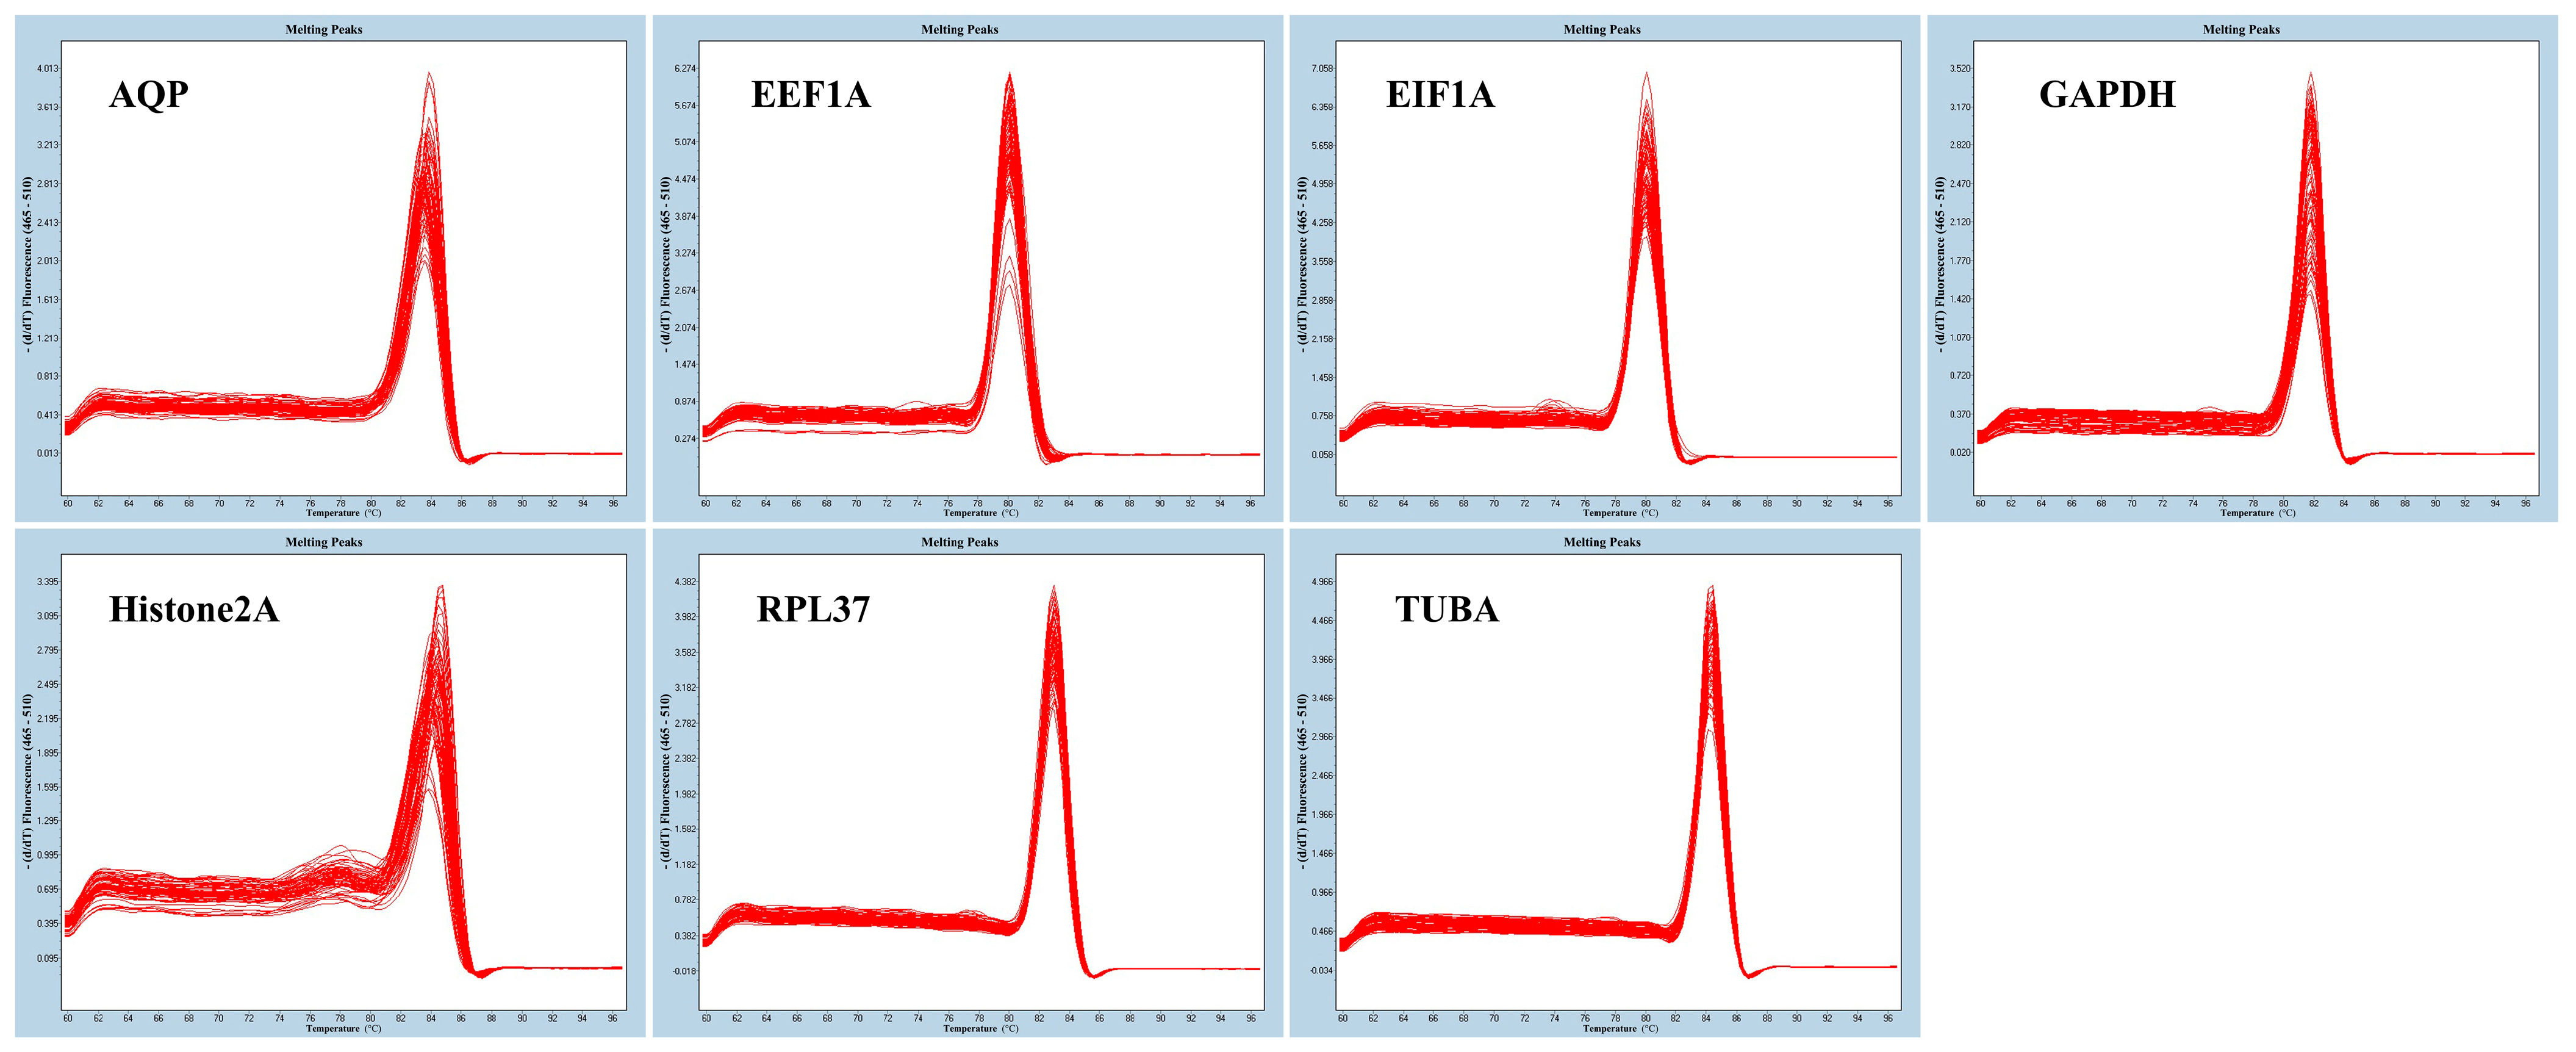
3.2. Primer Specificity and Expression Profile Analyses of Candidate Reference Genes

The seven candidate reference genes were amplified through qRT-PCR experiments, aiming to confirm the specificity of their primers. Their melting curves all showed a distinctive single peak without a primer dimer (Figure 2). All amplicons revealed good repeatability, indicating that the primers had strong specificity, reliability, and accuracy. As a result, all of the specific primers were shown to be appropriate for performing further qRT-PCR detection.

3.3. Expression Profile Analysis of Candidate Reference Genes

A Ct boxplot analysis (Figure 3) indicated that the Ct values of the seven candidate reference genes were within the range 25.69 ± 1.22 (EEF1A, n = 18) to 27.89 ± 0.79 (TUBA, n = 18), and that the average Ct values of EIF1A, GAPDH, Histone2A, RPL37, and AQP were 27.42 ± 1.24, 27.76 ± 1.27, 26.90 ± 1.46, 27.42 ± 1.24, and 26.28 ± 1.04, respectively. Among them, TUBA showed the least expression variation, from 26.92 to 29.14, with a coefficient value (CV) of 2.83%, followed by AQP from 24.80 to 27.62, with a CV of 3.96% (Table S2). The CVs of the others were 4.58% (GAPDH), 5.43% (Histone2A), 4.76% (EEF1A), 4.51% (RPL37), and 4.49% (EIF1A).

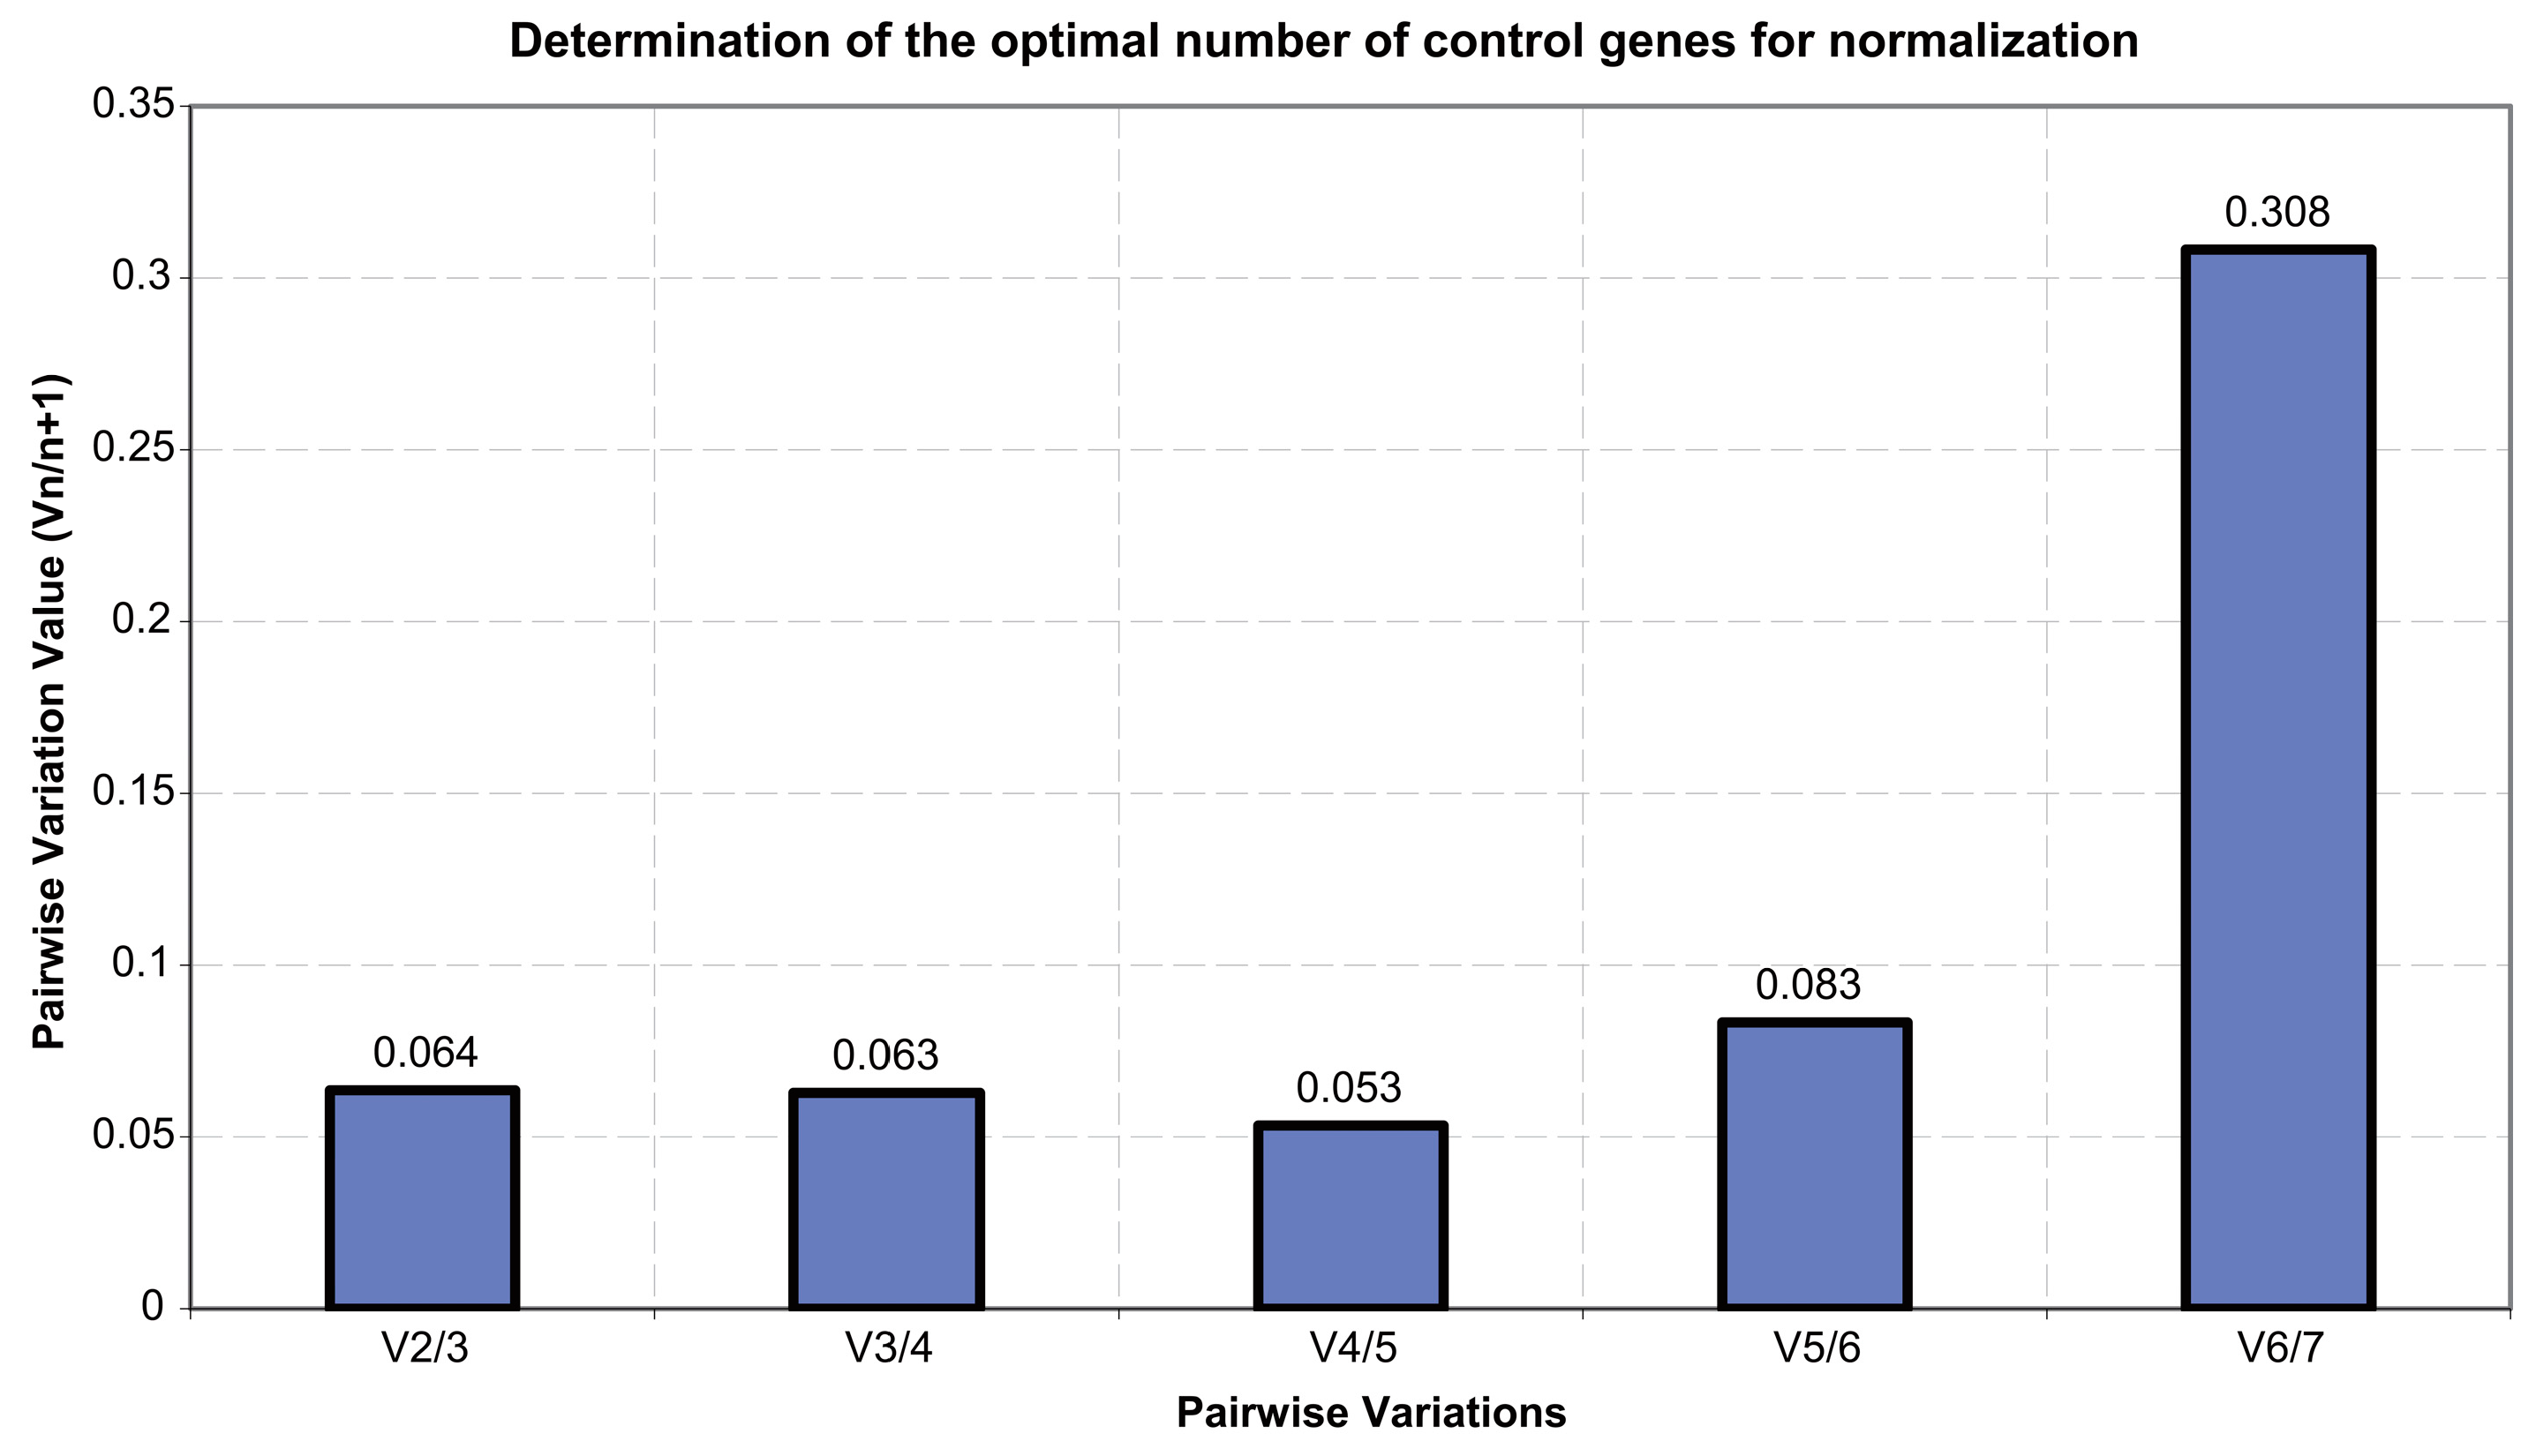
3.4. Stability Analysis of Candidate Reference Genes

In accordance with the result of the pairwise variation value (Vn/n+1) between sequential normalization factors (Figure 4), because most of the Vn/n+1 values, e.g., V2/3, V3/4, V4/5, V5/6, are far less than 0.15, two reference genes might be required for the expression study of the target petal-color-related genes for R. praelucens.
The average gene expression stability values (M value; Table 4) evaluated by geNorm showed that EEF1A exhibited the lowest M value (0.576) and EIF1A had the second lowest one (0.585), while those of RPL37, GAPDH, Histone2A, and TUBA were 0.608, 0.656, 0.714, and 0.728, respectively, all lower than 1.5. Only the M value of AQP was much higher than 1.5. Thus, EEF1A and EIF1A can be regarded as the most stably expressed candidate reference genes. In addition, the other four might also be suitable.
The expression stability values (SVs) computed by NormFinder (Table 4) indicated that the average SV of the seven candidate reference genes was 0.375. So, EEF1A, EIF1A, RPL37, GAPDH, and TUBA were more stably expressed, while Histone2A and AQP, with SVs of 0.399 and 1.296, respectively, were unstable.
Among the seven candidate reference genes, only the standard deviation (SD) of the gene expression of TUBA and AQP calculated by BestKeeper was lower than 1.0. The SDs of GAPDH and EEF1A were 1.086 and 1.114, respectively, while those of EIF1A, RPL37, and Histone2A were even higher.
Despite geNorm and NormFinder generating almost the same results for the stable reference genes in R. praelucens, the result computed by BestKeeper was somewhat different, since the computation was based on different criteria. The result of the GM method adopted for integrating the results from the three methods confirmed that EEF1A was the most stable candidate reference gene with the lowest GM value of 1.587, followed by EIF1A and TUBA, both with a GM value of 2.884. They can be used as suitable and reliable reference genes for studying petal-color-related genes in R. praelucens, while AQP and Histone2A were not so stable.

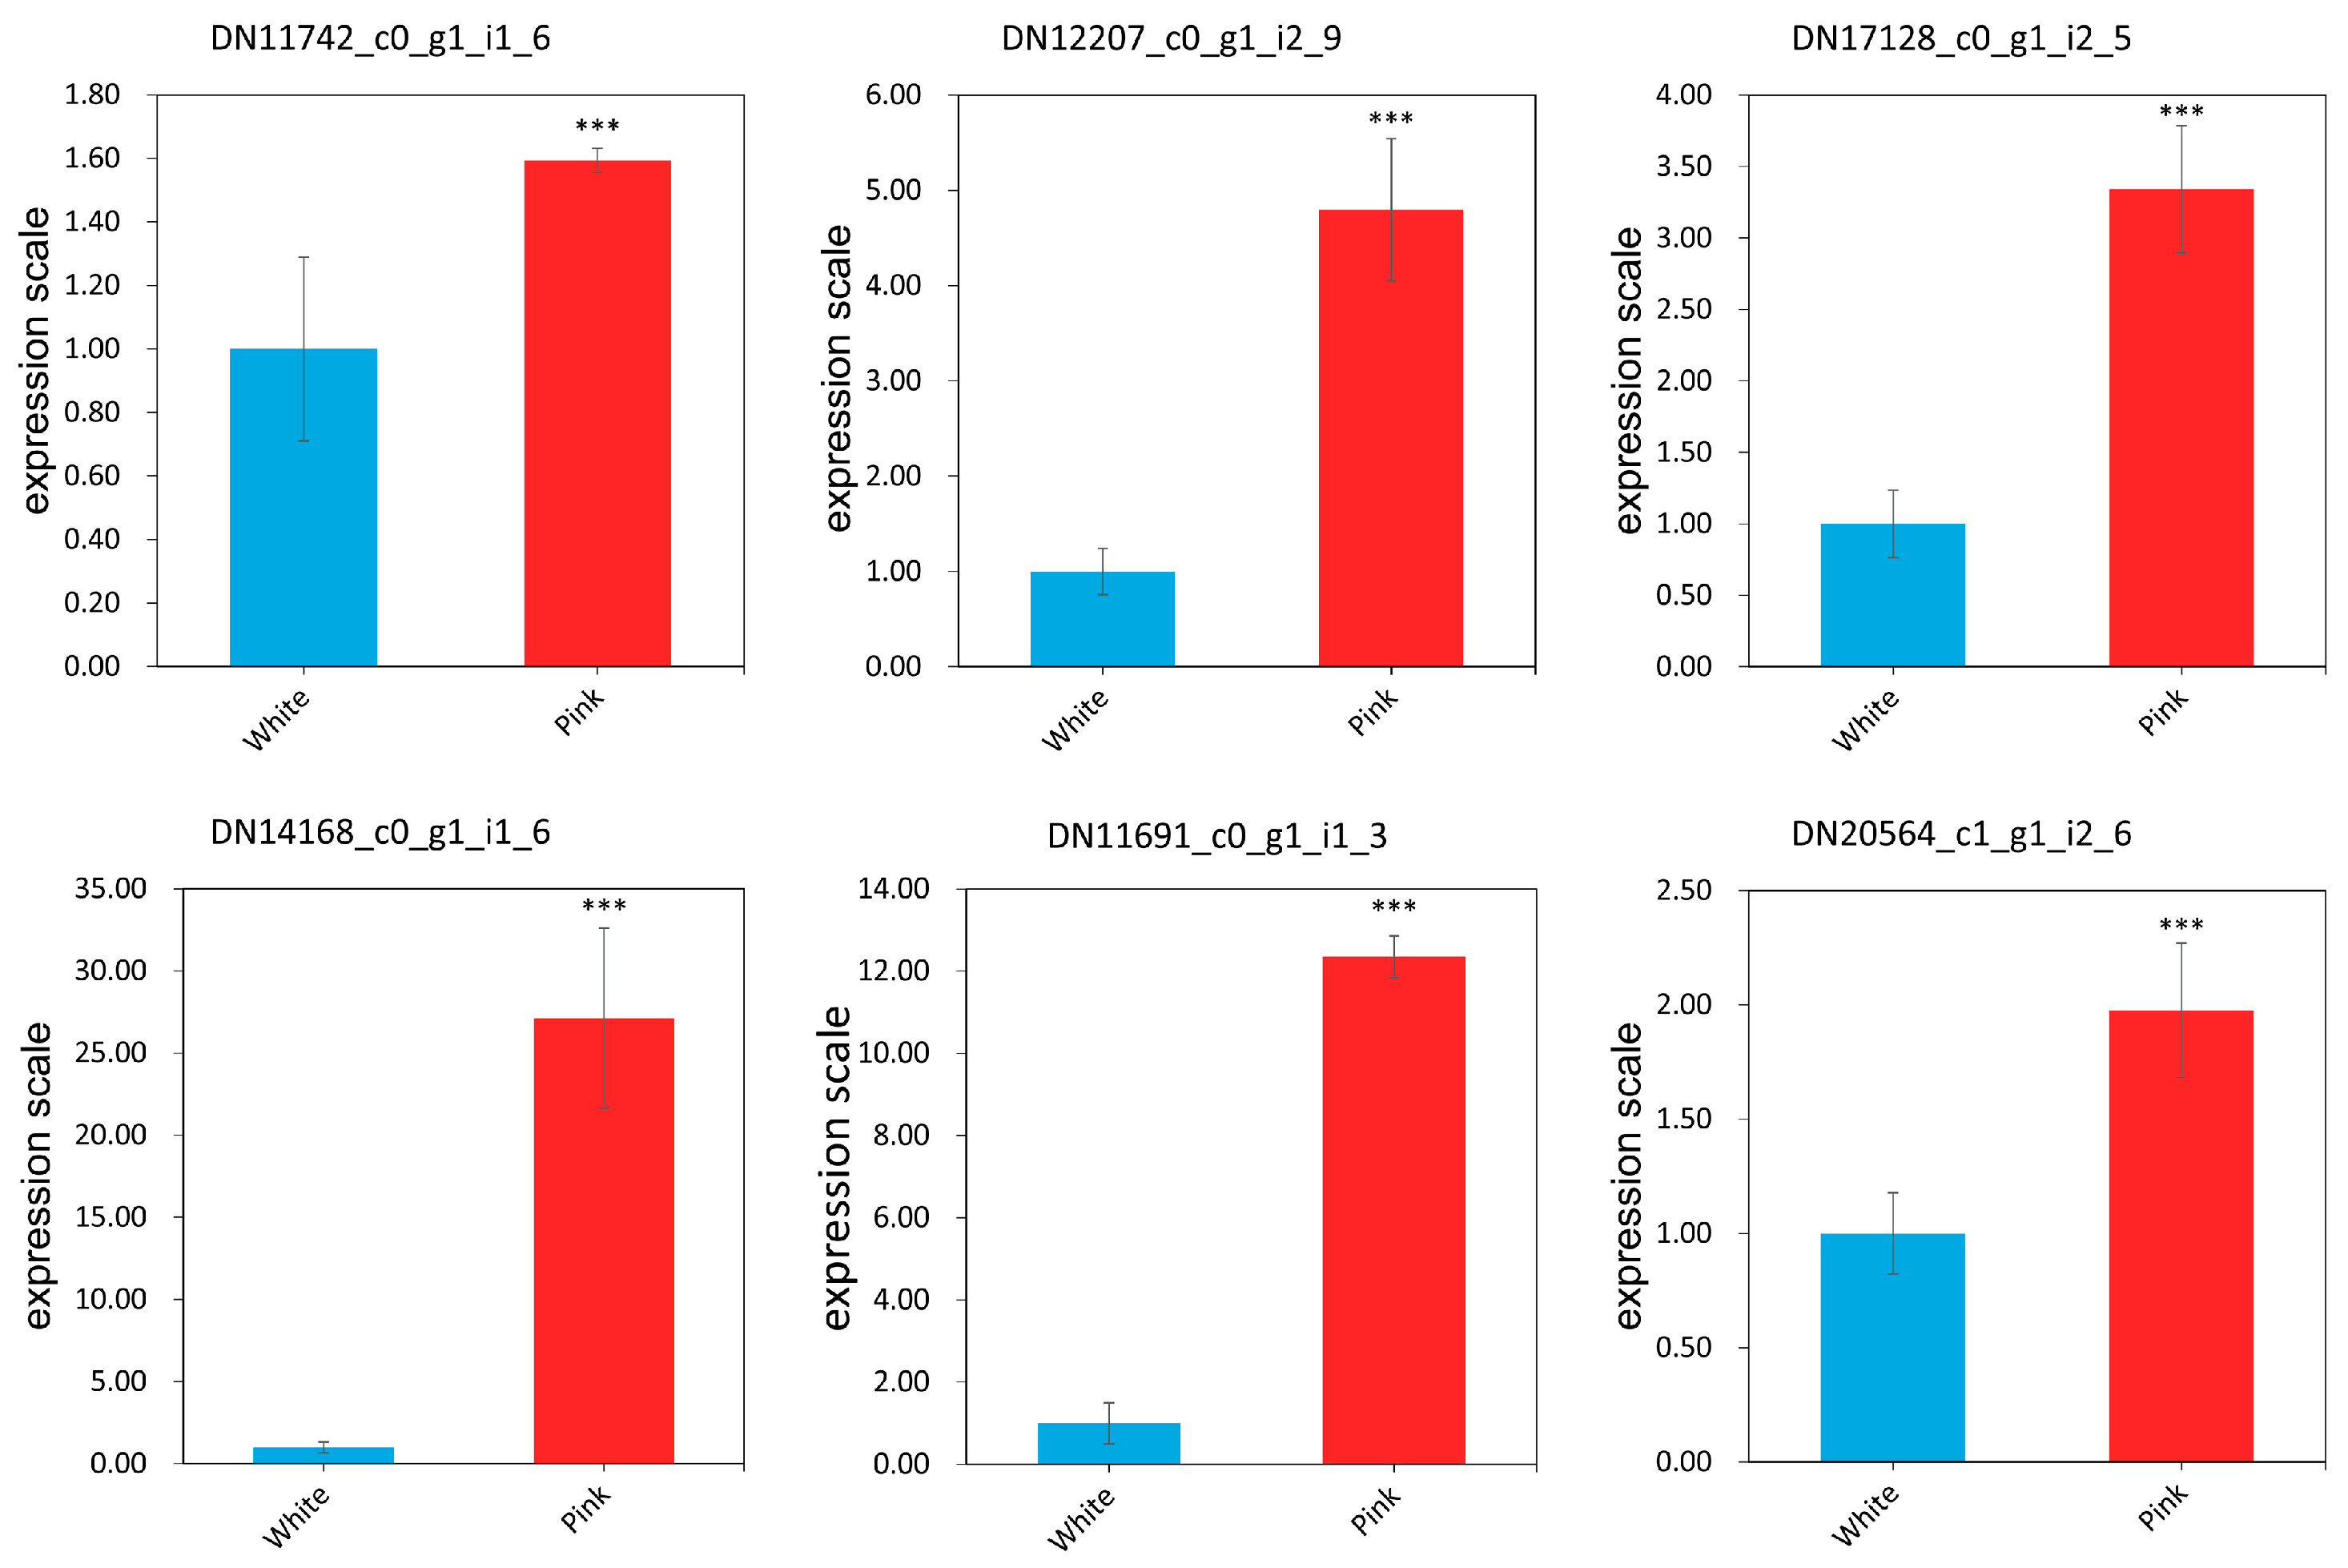
3.5. Validation of Selected Reference Gene EEF1A

To demonstrate the utility and stability of EEF1A as the reference gene in the study of petal-color-related genes in R. praelucens, the expression of the six selected target genes engaged in the petal color variation were evaluated. In addition, the expression pattern of these genes in the full-blooming flowers of white and pink individuals via qRT-PCR analysis, were normalized to that of the most suitable reference gene, EEF1A, according to the 2−ΔΔCt method (Table S3). Based on the results, expression of the six petal-color-related genes was significantly up-regulated in the full-blooming flowers of pink-petal-colored individuals compared with their expression in those of the white ones (p < 0.01) (Figure 5), conforming to the result of transcriptome analysis (Table 2 and Table S4). The expression pattern of these possible target genes was consistent with their transcriptomic analysis of RNA-seq. Thus, EEF1A is an appropriate reference gene for the gene expression of the petal-color-related genes in R. praelucens.

4. Discussion

Flower color is one of the most prominent characteristics of roses [44]. With more gene copies, polyploids may have changed gene expression, and thus, affected many phenotypic traits [22]. The decaploid R. praelucens has rich intra-species diversity in flower color, from white to different degrees of pink [6,14]. The mechanism underlying this, especially the expression of related genes, needs to be deeply investigated. The expression of the dose-dependent genes has some differences between the diploid roses and the tetraploid ones [17,29]. For the expression analysis of flavonoid/anthocyanin synthesis pathway-related genes, different reference genes have been used, e.g., AQP in Iris hollandica [45,46], ACT in Muscari botryoides [47] and in R. chinensis (‘Old Blush’) [17], 18S in hybrid Dendrobium [48], and GAPDH in hybrid roses [34], but none of them were specifically selected and validated.
Herein, we screened seven candidate reference genes in R. praelucens, including EEF1A, EIF1A, TUBA, GAPDH, AQP, Histone2A, and RPL37, and revealed that EEF1A was the most appropriate reference gene for the expression of petal-color-regulated genes. The expression pattern of six petal-color-regulated genes, determined via qRT-PCR analysis, using EEF1A as reference gene for normalization, were consistent with the transcriptome sequencing result, confirming the reliability and suitability of applying it as the reference gene in R. praelucens. The selected new reference gene in this study, EEF1A, was different from those that had previously been screened and validated for the petal-color-related gene expression of either Asiatic hybrid lilies, i.e., TUB, [49], or Anemone obtusiloba, i.e., UBQ [50], which reconfirmed that suitable reference genes had to be detected for each species and for each experiment [28,30,31].
Most flower colors in roses, especially the pink and red, are determined by chemicals such as flavonoids and anthocyanins [44,51,52,53,54]. The differences in petal color, brightness, and saturation of modern roses are mainly due to the change in expression quantity of genes such as CHS, DFR, and ANS, etc. [34]. The FLS gene in R. rugosa ‘Hunchun’ is closely related to that in R. multiflora [55]. Different homologues of anthocyanin biosynthesis pathway genes are related to the petal color variation in R. chinensis ‘Old Blush’ [17]. As far as the key transcription factors are concerned, MYB, bHLH, and WD40 are the three most possible transcription factors regulating the expression of key enzyme genes in plants [56,57,58]. Among them, MYB transcription factors, such as MYB1 [59,60] and R2R3-MYB [61,62] have been proved to be key transcriptors in rose anthocyanin biosynthesis. Among the six candidate petal-color-related genes, DN11691_c0_g1_i1_3, DN14168_c0_g1_i1_6, and DN12207_c0_g1_i2_9 were the most significantly up-regulated genes in the pink-petaled individuals. Therefore, these genes may indicate key candidate genes or transcriptors for deciphering the petal color variation in R. praelucens. As a result, functional characterization of these genes is needed in order to show their roles and clarify petal color molecular mechanisms in R. praelucens. The discovery of reference genes may speed up the molecular dissection of petal-color-variation mechanisms in R. praelucens.

5. Conclusions

To conclude, R. praelucens Byhouwer is an endemic and critically endangered decaploid wild rose species. It has rich intraspecific flower color variation from white to different degrees of pink. With the purpose of selecting reference gene for further study on the expression of petal-color-related genes, seven candidate reference genes, screened from a transcriptome dataset for qRT-PCR normalization of expression of petal-color-related target genes in R. praelucens, were investigated. EEF1A was shown to be the most stable reference gene. Its reliability was validated via qRT-PCR analysis of the expression pattern of six petal-color-related DEGs, which were identical to the RNA-seq results. DN11691_c0_g1_i1_3, DN14168_c0_g1_i1_6, and DN12207_c0_g1_i2_9 were the most obviously up-regulated genes in the pink flowers. They might be the vital target genes for the intraspecific petal color variation in R. praelucens.

Supplementary Materials

The following supporting information can be downloaded at: https://www.mdpi.com/article/10.3390/genes15030277/s1, Table S1: List of the seven candidate reference genes with their FPKM expression values; Table S2: Summary of the qRT-PCR Ct values of seven candidate reference genes; Table S3: qRT-PCR Ct values of the six target petal-color-related genes; Table S4: List of the six petal-color-related genes with their FPKM expression values.

Author Contributions

Conceptualization, H.J. and L.M.; methodology, H.W.; software, H.W.; validation, H.J., X.Q. and H.Y.; formal analysis, L.M. and H.W.; investigation, H.J. and L.M.; resources, H.J.; data curation, H.W.; writing—original draft preparation, H.J.; writing—review and editing, L.M.; supervision, X.Q., H.Y. and L.M.; funding acquisition, H.J. All authors have read and agreed to the published version of the manuscript.

Funding

This study was financially supported by the National Natural Science Foundation of China, grant number 31972443, and the Technology Talents and Innovation Team Project of Yunnan Province, grant number 202305AS350002.

Institutional Review Board Statement

Not applicable.

Informed Consent Statement

Not applicable.

Data Availability Statement

In this work, all the datasets explored or generated are contained in the current study as well as its Supplementary File.

Conflicts of Interest

We claim no conflicts of interest. In addition, the funders had no role in the design; collection and analyses of data, or writing of this study; or in the decision to publish the findings.

References

  1. Ku, T.C.; Robertson, K.R. Rosa (Rosaceae). In Flora of China; Wu, Z.Y., Raven, P.H., Eds.; Science Press: Beijing, China, 2003; Volume 9, pp. 339–381. ISBN 978-1-93-564104-9. [Google Scholar]
  2. Qin, H.N.; Yang, Y.; Dong, S.Y.; He, Q.; Jia, Y.; Zhang, L.N.; Yu, S.X.; Liu, H.Y.; Liu, B.; Yan, Y.H.; et al. Threatened species list of China’s higher plants. Biodivers. Sci. 2017, 25, 696–744. [Google Scholar] [CrossRef]
  3. Li, X.X.; Zhou, Z.K. Endemic wild ornamental plants from North Western Yunnan. HortScience 2015, 40, 1612–1619. [Google Scholar] [CrossRef]
  4. Deng, J.Q.; Jian, H.Y.; Li, S.B.; Wang, Q.G.; Guo, Y.L.; Zhang, H. Cold tolerance of several wild Rosa resources endemic to Yunnan. Southwest. Chin. J. Agric. Sci. 2013, 26, 723–727. [Google Scholar]
  5. Fan, Y.L.; Chen, Y.C.; Jian, H.Y.; Yan, H.J.; Zhang, T.; Li, S.F.; Qiu, X.Q. Screening of Rosa germplasm resources with resistance to aphids. J. Yunnan Univ. (Nat. Sci. Ed.) 2021, 43, 619–628. [Google Scholar] [CrossRef]
  6. Jian, H.Y.; Li, S.F.; Guo, J.L.; Li, S.B.; Wang, Q.G.; Yan, H.J.; Qiu, X.Q.; Zhang, Y.H.; Cai, Z.Q.; Volis, S.; et al. High genetic diversity and differentiation of an extremely narrowly distributed and critically endangered decaploid rose (Rosa praelucens): Implications for its conservation. Conserv. Genet. 2018, 19, 761–776. [Google Scholar] [CrossRef]
  7. Wu, X.Y.; Chen, M.; Wang, Q.G.; Zhou, N.N.; Zhang, T.; Yan, H.J.; Qiu, X.Q.; Li, S.B.; Zhang, H.; Jian, H.Y.; et al. Comparative study on the breeding systems of Rosa praelucens and Rosa soulieana. Acta Hortic. Sin. 2014, 41, 2075–2084. [Google Scholar]
  8. Pan, L.J.; Guan, W.L.; LI, Y.H. Seed dormancy mechanism and its ecological significance of endangered species Rosa praelucens. Subtrop. Plant Sci. 2019, 48, 21–25. [Google Scholar]
  9. Wang, K.J.; Zhang, T.; Wang, Q.G.; Yan, H.J.; Qiu, X.Q.; Li, S.B.; Zhang, H.; Tang, K.X.; Jian, H.Y. The phylogenetic position and hybrid origination of Rosa praelucens Byhouwer. J. Plant Genet. Resour. 2018, 19, 1006–1015. [Google Scholar] [CrossRef]
  10. Fang, Q.; Tian, M.; Zhang, T.; Wang, Q.G.; Yan, H.J.; Qiu, X.Q.; Zhou, N.N.; Zhang, H.; Jian, H.Y.; Tang, K.X. Karyotype analysis of Rosa praelucens and its closely related congeneric species based on FISH. Acta Hortic. Sin. 2020, 47, 503–516. [Google Scholar] [CrossRef]
  11. Jian, H.Y.; Zhang, H.; Tang, K.X.; Li, S.F.; Wang, Q.G.; Zhang, T.; Qiu, X.Q.; Yan, H.J. Decaploidy in Rosa praelucens Byhouwer (Rosaceae) endemic to Zhongdian Plateau, Yunnan, China. Caryologia 2010, 63, 162–167. [Google Scholar] [CrossRef]
  12. Pan, L.J.; Guan, W.L.; LI, Y.H. Population structure and spatial distribution pattern of endangered species Rosa praelucens. Subtrop. Plant Sci. 2018, 47, 229–234. [Google Scholar]
  13. Guan, W.L.; Li, S.F.; Song, J.; Pan, L.J.; Niu, H.B. Study on geographic distribution of Rosa praelucens endemic to Yunnan. J. W. Chin. For. Sci. 2012, 41, 88–93. [Google Scholar]
  14. Li, S.F.; Li, C.J.; Jian, H.Y.; Li, S.B.; Xiong, J.; Li, J.K.; Tang, K.X. Studies on phenotypic diversity of vulnerable Rosa praelucens endemic to Shangrila, Yunnan. Acta Hortic. Sin. 2013, 40, 924–932. [Google Scholar]
  15. Smulders, M.J.M.; Arens, P.; Bourke, P.M.; Debener, T.; Linde, M.; De RieK, J.; Leus, L.; Ruttink, T.; Baudino, S.; Saint-Oyant, H.L.; et al. In the name of the rose: A roadmap for rose research in the genome era. Hortic. Res. 2019, 6, 65. [Google Scholar] [CrossRef] [PubMed]
  16. Okitsu, N.; Noda, N.; Chandler, S.; Tanaka, Y. Flower color and its engineering by genetic modification. In Ornamental Crops, Handbook of Plant Breeding; Van Huylenbroeck, J., Ed.; Springer International Publishing: Cham, Switzerland, 2018; pp. 29–62. ISBN 978-3-319-90697-3. [Google Scholar]
  17. Han, Y.; Wan, H.H.; Cheng, T.R.; Wang, J.; Yang, W.R.; Pan, H.T.; Zhang, Q.X. Comparative RNA-seq analysis of transcriptome dynamics during petal development in Rosa chinensis. Sci. Rep. 2017, 7, 43382. [Google Scholar] [CrossRef]
  18. Jay, M.; Biolley, J.P.; Fiasson, J.L.; Fiasson, K.; Gonnet, J.F.; Grossi, C.; Raymond, O.; Viricel, M.R. Anthocyanins and other flavonoid pigments. In Encyclopedia of Rose Science; Roberts, A.V., Debener, T., Gudin, S., Eds.; Elsevier: Oxford/London, UK, 2003; pp. 248–255. ISBN 0-12-227620-5. [Google Scholar]
  19. Ogata, J.; Kanno, Y.; Itoh, Y.; Tsugawa, H.; Suzuki, M. Anthocyanin biosynthesis in roses. Nature 2005, 435, 757–758. [Google Scholar] [CrossRef]
  20. Luo, P.; Ning, G.G.; Wang, Z.; Shen, Y.X.; Jin, H.N.; Li, P.H.; Huang, S.S.; Zhao, J.; Bao, M.Z. Disequilibrium of flavonol synthase and dihydroflavonol-4-reductase expression associated tightly to white vs. red color flower formation in plants. Front. Plant Sci. 2015, 6, 1257. [Google Scholar] [CrossRef]
  21. Chen, Z.J. Genetic and epigenetic mechanisms for gene expression and phenotypic variation in plant polyploids. Annu. Rev. Plant Biol. 2007, 58, 377–406. [Google Scholar] [CrossRef]
  22. Ramsey, J.; Schemske, D.W. Neopolyploidy in flowering plants. Annu. Rev. Ecol. Syst. 2002, 33, 589–639. [Google Scholar] [CrossRef]
  23. Wendel, J.F. Genome evolution in polyploids. Plant Mol. Biol. 2000, 42, 2. [Google Scholar] [CrossRef]
  24. Derveaux, S.; Vandesompele, J.; Hellemans, J. How to do successful gene expression analysis using real-time PCR. Methods 2010, 50, 227–230. [Google Scholar] [CrossRef]
  25. Bustin, S.A.; Benes, V.; Garson, J.A.; Hellemans, J.; Huggett, J.; Kubista, M.; Mueller, R.; Nolan, T.; Pfaffl, M.W.; Shipley, G.L.; et al. The MIQE guidelines: Minimum information for publication of quantitative realtime PCR experiments. Clin. Chem. 2009, 55, 611–622. [Google Scholar] [CrossRef] [PubMed]
  26. Volkov, R.A.; Panchuk, I.I.; Schoffl, F. Heat-stress-dependency and developmental modulation of gene expression: The potential of housekeeping genes as internal standards in mRNA expression profiling using real-time RT-PCR. J. Exp. Bot. 2003, 54, 2343–2349. [Google Scholar] [CrossRef] [PubMed]
  27. Czechowski, T.; Stitt, M.; Altmann, T.; Udvardi, M.K.; Scheible, W.R. Genome-wide identification and testing of superior reference genes for transcript normalization in arabidopsis. Plant Physiol. 2005, 139, 5–17. [Google Scholar] [CrossRef]
  28. Wan, Y.L.; Hong, A.Y.; Zhang, Y.X.; Liu, Y. Selection and validation of reference genes of Paeonia lactiflora in growth development and light stress. Physiol. Mol. Biol. Plants 2019, 25, 1097–1105. [Google Scholar] [CrossRef]
  29. Klie, M.; Debener, T. Identification of superior reference genes for data normalisation of expression studies via quantitative PCR in hybrid roses (Rosa hybrid). BMC Res. Notes 2011, 4, 518. [Google Scholar] [CrossRef]
  30. Hruz, T.; Wyss, M.; Docquier, M.; Pfaffl, M.W.; Masanetz, S.; Borghi, L.; Verbrugghe, P.; Kalaydjieva, L.; Bleuler, S.; Laule, O.; et al. RefGenes: Identification of reliable and condition specific reference genes for RT-qPCR data normalization. BMC Genom. 2011, 12, 156. [Google Scholar] [CrossRef] [PubMed]
  31. Yi, S.J.; Qian, Y.Q.; Han, L.; Sun, Z.Y.; Fan, C.M.; Liu, J.X.; Ju, G.S. Selection of reliable reference genes for gene expression studies in Rhododendron micranthum Turcz. Sci. Hortic. 2012, 138, 128–133. [Google Scholar] [CrossRef]
  32. Meng, Y.L.; Li, N.; Tian, J.; Gao, J.P.; Zhang, C.Q. Identification and validation of reference genes for gene expression studies in postharvest rose flower (Rosa hybrida). Sci. Hortic. 2013, 158, 16–21. [Google Scholar] [CrossRef]
  33. Yan, J.F. Studies on Metabolism and Variation Mechanism of Chimeric pigment in Chrysanthemum Flower Color. Master’s Thesis, Soochow University, Suzhou, China, 2014. [Google Scholar]
  34. Li, Y.P.; Zhang, Y.J.; Zhu, Z.Q.; Zhi, J.W.; Liu, M.X.; Zhang, J.W.; Guo, W.J.; Sun, Y.; Kong, J.J.; Sun, J.X. Study on the Quantitative Analysis of 11 Key Genes Expression of Flower Color in Different Color System of Rosa. Mol. Plant Breed. 2022. Available online: https://kns.cnki.net/kcms/detail/46.1068.S.20220413.1634.016.html (accessed on 4 April 2022).
  35. Mortazavi, A.; Williams, B.A.; McCue, K.; Schaeffer, L.; Wold, B. Mapping and quantifying mammalian transcriptomes by RNA-Seq. Nat. Methods 2008, 5, 621–628. [Google Scholar] [CrossRef]
  36. Lalitha, S. Primer premier 5. Biotechnol. Softw. Internet Rep. 2000, 1, 270–272. [Google Scholar] [CrossRef]
  37. Chen, C.B.; Wu, J.Y.; Hua, Q.Z.; Tel-Zur, N.; Xie, F.F.; Zhang, Z.K.; Chen, J.Y.; Zhang, R.; Hu, G.B.; Zhao, J.T.; et al. Identification of reliable reference genes for quantitative real-time PCR normalization in pitaya. Plant Meth. 2019, 15, 70. [Google Scholar] [CrossRef]
  38. van Vandesompele, J.; Preter, K.; Pattyn, F.; Poppe, B.; Roy, N.; Paepe, A.; Speleman, F. Accurate normalization of real-time quantitative RT-PCR data by geometric averaging of multiple internal control genes. Genome Biol. 2002, 3, 34. [Google Scholar] [CrossRef] [PubMed]
  39. Andersen, C.L.; Jensen, J.L.; Ørntoft, T.F. Normalization of real-time quantitative reverse transcription-PCR data: A model-based variance estimation approach to identify genes suited for normalization, applied to bladder and colon cancer data sets. Cancer Res. 2004, 64, 5245–5250. [Google Scholar] [CrossRef] [PubMed]
  40. Pfaffl, M.W.; Tichopad, A.; Prgomet, C.; Neuvians, T.P. Determination of stable housekeeping genes, differentially regulated target genes and sample integrity: BestKeeper–excel-based tool using pair-wise correlations. Biotechnol. Lett. 2004, 26, 509–515. [Google Scholar] [CrossRef]
  41. Chen, D.; Pan, X.; Xiao, P.; Farwell, M.A.; Zhang, B. Evaluation and identification of reliable reference genes for pharmacogenomics, toxicogenomics, and small RNA expression analysis. J. Cell Physiol. 2011, 226, 2469–2477. [Google Scholar] [CrossRef] [PubMed]
  42. Livak, K.J.; Schmittgen, T.D. Analysis of relative gene expression data using Real-Time Quantitative PCR and the 2−∆∆CT Method. Methods 2001, 25, 402–408. [Google Scholar] [CrossRef]
  43. Tang, Q.Y.; Zhang, C.X. Data processing system (DPS) software with experimental design, statistical analysis and data mining developed for use in entomological research. Insect Sci. 2013, 20, 254–260. [Google Scholar] [CrossRef]
  44. Wan, H.H. Identification and QTL Analysis of Flavonoids and Carotenoids in Rose Petals. Ph.D. Thesis, Beijing Forestry University, Beijing, China, 2018. [Google Scholar]
  45. Yoshihara, N.; Imayama, T.; Fukuchi-Mizutani, M.; Okuhara, H.; Tanaka, Y.; Ino, I.; Yabuya, T. cDNA cloning and characterization of UDP-glucose: Anthocyanidin 3-O-glucosyltransferase in Iris hollandica. Plant Sci. 2005, 169, 496–501. [Google Scholar] [CrossRef]
  46. Yoshihara, N.; Imayama, T.; Matsuo, Y.; Fukuchi-Mizutani, M.; Tanaka, Y.; Ino, I.; Yabuya, T. Characterization of cDNA clones encoding anthocyanin 3-p-coumaroyltransferase from Iris hollandica. Plant Sci. 2006, 171, 632–639. [Google Scholar] [CrossRef]
  47. Lou, Q.; Liu, Y.L.; Qi, Y.Y.; Jiao, S.Z.; Tian, F.F.; Jiang, L.; Wang, Y.J. Transcriptome sequencing and metabolite analysis reveals the role of delphinidin metabolism in flower color in grape hyacinth. J. Exp. Bot. 2014, 65, 3157–3164. [Google Scholar] [CrossRef]
  48. Kriangphan, N.; Vuttipongchaikij, S.; Kittiwongwattana, C.; Suttangkakul, A.; Pinmanee, P.; Sakulsathaporn, A.; Suwimon, R.; Suputtitada, S.; Chanvivattana, Y.; Apisitwanich, S. Effects of sequence and expression of eight anthocyanin biosynthesis genes on floral coloration in four Dendrobium hybrids. Hortic. J. 2015, 84, 83–92. [Google Scholar] [CrossRef]
  49. Xu, L.F.; Xu, H.; Cao, Y.W.; Yang, P.P.; Feng, Y.Y.; Tang, Y.C.; Yuan, S.X.; Ming, J. Validation of reference genes for quantitative real-time PCR during bicolor tepal development in asiatic hybrid lilies (Lilium spp.). Front. Plant Sci. 2017, 8, 669. [Google Scholar] [CrossRef] [PubMed]
  50. Ma, L.L.; Duan, Q.; Cui, G.F.; Du, W.W.; Jia, W.J.; Wang, X.N.; Wang, J.H.; Chen, F.D. Selection and validation of reference genes for qRT-PCR analysis of the correlated genes in flower pigments biosynthesis pathway of Anemone obtusiloba. Acta Hortic. Sin. 2021, 48, 377–388. [Google Scholar] [CrossRef]
  51. Biolley, J.P.; Jay, M. Anthocyanins in modern roses: Chemical and colorimetric features in relation to the color range. J. Exp. Bot. 1993, 44, 1725–1734. [Google Scholar] [CrossRef]
  52. Yuki, M.; Yokoi, M.; Ueda, Y.; Saito, N. Anthocyanins in flowers of genus Rosa, sections Cinnamomeae (=Rosa), Chinenses, Gallicanae and some modern garden roses. Biochem. Syst. Ecol. 2000, 28, 887–902. [Google Scholar] [CrossRef]
  53. Sarangowa, O.; Kanazawa, T.; Nishizawa, M.; Yamagishi, T. Flavonol glycosides in the petal of Rosa species as chemotaxonomic markers. Phytochemistry 2014, 107, 61–68. [Google Scholar] [CrossRef] [PubMed]
  54. Cai, Y.Z.; Xing, J.; Sun, M.; Corke, H. Phenolic antioxidants (hydrolyzable tannins, flavonols, and anthocyanins) identified by LC-ESI-MS and MALDI-QIT-TOF MS from Rosa chinensis flowers. J. Agric. Food Chem. 2005, 53, 9940–9948. [Google Scholar] [CrossRef]
  55. Li, Z.J.; Zhang, P.Y.; Jin, J.F.; Zhang, L.Y.; Xu, Z.D. Cloning and bioinformatics analysis of flavonol synthase gene in Rosa rugosa. Shandong Forest. Sci. Technol. 2018, 3, 1–6. [Google Scholar]
  56. Meng, J.X.; Gao, Y.; Han, M.L.; Liu, P.Y.; Yang, C.; Shen, T.; Li, H.H. In Vitro anthocyanin induction and metabolite analysis in Malus spectabilis leaves under low nitrogen conditions. Hortic. Plant J. 2020, 6, 284–292. [Google Scholar] [CrossRef]
  57. Fu, Z.Z.; Shang, H.Q.; Jiang, H.; Gao, J.; Dong, X.Y.; Wang, H.J.; Li, Y.M.; Wang, L.M.; Zhang, J.; Shu, Q.Y.; et al. Systematic identification of the light-quality responding anthocyanin synthesis-related transcripts in petunia petals. Hortic. Plant J. 2020, 6, 428–438. [Google Scholar] [CrossRef]
  58. Ramsay, N.A.; Glover, B.J. MYB-bHLH-WD40 protein complex and the evolution of cellular diversity. Trends Plant Sci. 2005, 10, 63–70. [Google Scholar] [CrossRef] [PubMed]
  59. Xie, J.R.; Xiong, Y.H.; Cheng, Z.Q.; Huang, X.Q. Full length cloning and expression analysis of MYB gene cDNA of Rosa chinensis. Chin. Agric. Sci. 2008, 41, 4173–4179. [Google Scholar]
  60. He, G.R.; Zhang, R.; Jiang, S.H.; Wang, H.H.; Ming, F. The MYB transcription factor RcMYB1 plays a central role in rose anthocyanin biosynthesis. Hortic. Res. 2023, 10, uhad080. [Google Scholar] [CrossRef]
  61. Zhao, J.; Liu, R.; Yang, F.; Li, X.; Liu, H.S.; Yan, Q.; Xiao, Y.H. Cloning and expression analyses of R 2R3-MYB genes related to anthocyanin biosynthesis in Rose. Chin. Agric. Sci. 2015, 48, 1392–1404. [Google Scholar] [CrossRef]
  62. Li, M.F.; Yang, Y.; Wang, H.; Fan, Y.W.; Sun, P.; Jin, W.M. Analysis the function of R2R3 MYB transcription factor RhMYB113 on regulating anthocyanin synthesis in Rosa hybrida. Acta Hortic. Sin. 2022, 49, 1957–1966. [Google Scholar] [CrossRef]
Figure 1. Phenotypic variation in R. praelucens and the samples used for RNA-seq and qRT-PCR validation. W: white phenotype; P: pink phenotype.
Genes 15 00277 g001
Figure 2. Melting curves of the seven candidate reference genes in R. praelucens.
Genes 15 00277 g002
Figure 3. qRT-PCR Ct values for all candidate reference genes in six samples and 3 replicons each.
Genes 15 00277 g003
Figure 4. Pairwise variation analysis to identify the optimal number of reference genes in R. praelucens.
Genes 15 00277 g004
Figure 5. The qRT-PCR expression patterns of the petal-color-related candidate genes in the white- and pink-petaled individuals. Note: *** in the figures indicates statistical differences at p < 0.001. The p-values of DN11742_c0_g1_i1_6, DN12207_c0_g1_i2_9, DN17128_c0_g1_i2_5, DN14168_c0_g1_i1_6, DN11691_c0_g1_i1_3, and DN20564_c1_g1_i2_6 were 0.000018, 0.000000, 0.000000, 0.000000, 0.000000, and 0.000000, respectively.
Genes 15 00277 g005
Table 1. The details of candidate reference genes screened from transcriptome libraries of R. praelucens.
GenesFPKMNr Annotation
TUBA48.88 ± 6.10tubulin α chain
GAPDH44.27 ± 16.74glyeraldehyde 3-phosphate dehydrogenase
Histone2A104.97 ± 34.30histone H2B
RPL37164.71 ± 37.8360S ribosomal protein L37-3-like
EEF1A113.08 ± 60.23elongation factor 1-α
EIF1A157.89 ± 39.51eukaryotic translation initiation factor 1A
AQP276.73 ± 197.22aquaporin PIP2-1-like
Table 2. FPKM of the petal-color-related genes in the full opening flowers of different R. praelucens.
Gene IDWhite Pinkp-Value #Gene Expression
DN11742_c0_g1_i1_60.981 ± 0.41624.618 ± 5.1410.0014 **Up-regulated
DN12207_c0_g1_i2_91.591 ± 0.09646.562 ± 8.1230.00067 ***Up-regulated
DN17128_c0_g1_i2_53.281 ± 0.39837.732 ± 1.5132.825 × 10−6 ***Up-regulated
DN14168_c0_g1_i1_60.185 ± 0.0957.524 ± 0.3122.582 × 10−6 ***Up-regulated
DN11691_c0_g1_i1_30.282 ± 0.16418.862 ± 0.3951.875 × 10−7 ***Up-regulated
DN20564_c1_g1_i2_60.344 ± 0.3002.380 ± 0.4520.0029 **Up-regulated
#: ** and *** suggest statistical differences at p < 0.01 and 0.001, respectively.
Table 3. Primer sequences for the qRT-PCR expression analysis of candidate reference genes and petal-color-related genes of R. praelucens.
TypeGeneForward Primer (5->3)Reverse Primer (5->3)Length (bp)Tm (°C)
Candidate reference genesGAPDHGATGAGGATGTTGTGTCAACCGCTTGACAAACTTGTCGTTC9760
TUBACAGCCTGATGGCCAAATGCAACAAAGATTGCGCGAG11560
Histone 2ATTACTTCCCGGGAGATCCAGCTTAGTCCCCTCAGAAACGG8360
EEF1AATCCTCACCAAGATTGACAGTTGGTGGGAAGCATCTTAAC10160
RPL37TGAGGTACCTTCGCCATGTGTTCCCTTGCTCCTTGGCTTA8160
EIF1ACTTCCAGAGAATACACGTCTTACTCGATGTAGTCATCAGCAC8460
AQPTCTCAGCCAAGGACTACCAGCACAGTGATGTAGAGAAAC13360
Petal-color-related genesDN11742_c0_g1_i1_6CTAAAGAGGTTGAGAGCGCTATACAAAGGATAAGACCTGCAC9160
DN12207_c0_g1_i2_9CCAAGGAGAAGATCATCCTCAGGATATGCTCGGAGAAAGTC9360
DN17128_c0_g1_i2_5TTGACCAAGGCATGTGTGGATAATTGTACCCGGATCTGTGT11560
DN14168_c0_g1_i1_6GTGATGACTTGGTGTACCTTGTTTGGGACGAGAATGGTGA11960
DN11691_c0_g1_i1_3TGCATGGACTAAAGAGGAAGAAAAGGAACCTGATGCCATT8160
DN20564_c1_g1_i2_6CAAGCTACCGATAGCCACACCTTATTACATCCGGGAACCA10060
Table 4. Stability ranking of candidate reference genes in R. praelucens using geNorm, NormFinder, BestKeeper software and the geometric mean (GM) method.
GenegeNormNormFinderBestKeeperGeometric Mean
M ValueRankingSVRankingSDRankingGeomeanComprehensive Ranking
EEF1A0.57610.10911.11441.5871
EIF1A0.58520.12221.12762.8842
RPL370.60830.14431.12053.5573
GAPDH0.65640.20551.08633.9154
Histone2A0.71450.39961.35375.9446
TUBA0.72860.15140.73012.8847
AQP2.16281.49470.96824.6108
Disclaimer/Publisher’s Note: The statements, opinions and data contained in all publications are solely those of the individual author(s) and contributor(s) and not of MDPI and/or the editor(s). MDPI and/or the editor(s) disclaim responsibility for any injury to people or property resulting from any ideas, methods, instructions or products referred to in the content.

