Simple Summary
Ketosis (KET), a metabolic disorder frequently observed in dairy cows, is characterized by increased levels of ketone bodies. The “gold standard” for diagnosing ketosis is the concentration of blood β-hydroxybutyrate (BHB). The increasing number of studies focusing on BHB highlights the increasing significance of metabolic disorders in both the dairy industry and the scientific community. Additionally, the surge in research on the genetic and economic facets of the KET is likely correlated with the recent accessibility of extensive datasets containing blood BHB concentrations as routinely recorded traits in certain production systems. Such data are essential to accurately estimating the genetic parameters associated with these traits. Consequently, the objective of this study was to estimate genetic parameters and identify candidate genes related to blood BHB through genome-wide association analysis to provide research directions for dairy ketosis.
Abstract
Ketosis is a common metabolic disorder in the early lactation of dairy cows. It is typically diagnosed by measuring the concentration of β-hydroxybutyrate (BHB) in the blood. This study aimed to estimate the genetic parameters of blood BHB and conducted a genome-wide association study (GWAS) based on the estimated breeding value. Phenotypic data were collected from December 2019 to August 2023, comprising blood BHB concentrations in 45,617 Holstein cows during the three weeks post-calving across seven dairy farms. Genotypic data were obtained using the Neogen Geneseek Genomic Profiler (GGP) Bovine 100 K SNP Chip and GGP Bovine SNP50 v3 (Illumina Inc., San Diego, CA, USA) for genotyping. The estimated heritability and repeatability values for blood BHB levels were 0.167 and 0.175, respectively. The GWAS result detected a total of ten genome-wide significant associations with blood BHB. Significant SNPs were distributed in Bos taurus autosomes (BTA) 2, 6, 9, 11, 13, and 23, with 48 annotated candidate genes. These potential genes included those associated with insulin regulation, such as INSIG2, and those linked to fatty acid metabolism, such as HADHB, HADHA, and PANK2. Enrichment analysis of the candidate genes for blood BHB revealed the molecular functions and biological processes involved in fatty acid and lipid metabolism in dairy cattle. The identification of novel genomic regions in this study contributes to the characterization of key genes and pathways that elucidate susceptibility to ketosis in dairy cattle.
1. Introduction
Ketosis is a common metabolic disorder that affects dairy cows in the early postpartum period, typically detected by analyzing blood β-hydroxybutyrate levels. The incidence of subclinical ketosis among Holstein cows across ten countries varies from 11.2% to 36.6%, with an average of 21.8% [1]. The onset of ketosis results in increased costs for dairy farms, including expenses related to ketosis treatment, an increased risk of other diseases, compromised reproductive performance, and the likelihood of early lactation culling [2,3,4]. Therefore, mitigating the incidence of ketosis improves the health of dairy cows as well as reduces production costs on dairy farms.
Dairy cows exhibit individual differences in metabolic adaptability during the early lactation period, which can be leveraged to select high-yielding cows with a reduced risk of metabolic disorders [5]. Previous genetic studies of ketosis, predominantly relying on clinical records, have revealed heritability estimates ranging from 0.01 to 0.16, indicating a low heritability level [6]. The low heritability of ketosis suggests that achieving significant genetic progress through direct genetic selection methods is difficult. Blood BHB is the predominant and most stable ketone body in bodily fluids. Its concentration is commonly employed as a “gold standard” for ketosis and provides a more accurate indication of sensitivity to ketosis than other ketone bodies [7,8,9]. In addition, blood BHB exhibits moderate heritability (0.17 to 0.40) [10,11,12,13,14]. Genetic enhancement and genomic selection strategies with BHB as a phenotype may effectively reduce the occurrence of ketosis. It is crucial to meticulously record specific traits like ketone body concentrations (acetone or BHB) in blood or milk to detect ketosis (KET). Therefore, employing BHB as an indicator trait for indirect selection in ketosis should yield greater genetic gains than direct selection.
Rapid advancements in sequencing technology have revealed causal variants of complex traits through genome-wide association analysis [10,11,12]. Several studies have investigated the physiological, quantitative genetic, and genomic associations related to milk BHB, acetone, and KET. Huang et al. [13] identified six genomic regions associated with ketosis based on the binary ketosis trait in production records. Freebern et al. [14] conducted a GWAS and fine-mapping analysis to identify potential candidate genes associated with disease traits in Holstein cattle. They identified one significant segment that encompassed DGAT1 on BTA14 for KET. Pralle et al. [15] performed a GWAS based on a KET phenotype determined by repeated blood BHB concentrations and identified several novel marker associations and metabolic pathways contributing to the genetic risk of dairy ketosis. However, previous studies have not directly reported significant genome-wide regions or genes containing putative causative mutations associated with blood BHB concentrations. Therefore, this study aimed to investigate the genetic parameters and genomic associations associated with blood BHB concentrations in early lactating Holstein cows in China. The purposes of this study were to (1) estimate (co)variance components based on pedigree and genomic data, (2) conduct a GWAS to identify significantly associated SNPs, and (3) annotate and provide biological interpretations of potential candidate genes.
2. Materials and Methods
2.1. Ethics Statement
All animals were treated in accordance with the protocols approved by the Institutional Animal Care and Use Committee of Henan Agriculture University (Permit Number: 12-1328).
2.2. Phenotype
Blood BHB concentrations were measured in 45,617 Holstein cows during the first three weeks after calving, from December 2019 to August 2023. Data were gathered from seven dairy-intensive pasture farms located in northern China (Table 1). The free-stall barn system and TMR were implemented in every herd, with an average of 6517 ± 2751 cows and 11,982 ± 5219 records per herd. Blood BHB concentration data were obtained from production records at the dairy farm. Within the first three weeks postpartum in Holstein cows, veterinarians collected blood samples from the tail vein. The blood samples were tested for BHB concentration using a handheld FreeStyle Optium Neo H ketone Meter (Abbott Diabetes Care Ltd., Witney, UK). The device had a sensitivity of 98% and a specificity of 95% [16].

Table 1.
Summary statistics.
A dataset containing records of cows with days in milk (DIM) from days 1 to 21 and blood BHB values ranging from 0.1 to 8.0 mmol/L was kept for analyses. The dataset included a total of 83,878 blood BHB records from 45,617 Holstein cows. BHB concentrations in cows were categorized based on parity, with cows in their first, second, and third or greater parities labeled as BHB1, BHB2, and BHB3, respectively. The number of animals in each category was 27,261, 30,933, and 25,684, respectively. Furthermore, pedigrees can be traced back three generations.
2.3. Genotype and Quality Control
Blood samples were collected from the coccygeal vein and transferred into 10 mL vacuum tubes containing EDTAK2 as an anticoagulant. The samples were promptly cooled on ice to preserve their integrity. Genomic DNA was subsequently extracted from the blood samples of 5146 Holstein dairy cows using the phenol chloroform method. Most of these animals (n = 3919) were genotyped with the Geneseek Genomic Profiler (GGP) Bovine 100 K SNP Chip by Neogen Biotechnology (Shanghai, China), and a minority of these animals (n = 1227) were genotyped using the GGP Bovine SNP50 v3 (Illumina Inc., San Diego, CA, USA). Using the 100 K chip reference data of 3919 Holstein dairy cows, the 50 K chip data of 1227 Holstein dairy cows were imputed to the 100 K chip data with an average imputation accuracy (R2) of 0.981 and ARS-UCD1.2(bosTau9) was used as a reference genome. Genotype imputation was performed using Beagle software (version 5.4) [17]. Meanwhile, quality control (QC) was conducted using PLINK 1.90 [18] to remove the SNPs that did not meet the specific criteria: (1) the individual genotype call rate < 95%, (2) the SNP genotype call rate < 90%, and (3) the minor allele frequency (MAF) < 0.01 and deviated from the Hardy–Weinberg equilibrium value (p < 1.0 × 10⁻⁶). After quality control, 5139 cows and 80,217 SNP variants were used for further association analyses.
2.4. Estimation of Genetic Parameters
Generalized linear models were performed using the GLM function [19] implemented in the Basic package of R 4.3.2 [20], with blood BHB as the response variable to identify the systematic effects that should be included in the genetic models. A single-trait repeatability animal model (model 1) was used to estimate the heritability and repeatability of blood BHB. The model 1 can be written as follows:
where are the phenotypic records for blood BHB; is the fixed effect of the herd-year-season (104 levels); is the fixed effect of parity (1, 2, or 3+); is the covariate effect; is the random additive genetic effect; is the random permanent environmental effect; and is the random residual effect. Two different methods were employed to estimate variance components and predict breeding values: (a) the pedigree-based approach, which employed the BLUP method. In this method, the covariance structure of the random animal effect was modeled as u ∼ N(0,A), where A represents the pedigree relationship matrix and denotes the direct additive genetic variance, and genetic parameters were analyzed using the AIREMLF90 program [21,22]; (b) The genomic evaluation implemented a single-step genomic BLUP (ssGBLUP) method, which modeled the random animal effect as u ∼ N(0,H), with H being a matrix that integrates pedigree and genomic relationships [23].
2.5. Genome-Wide Association Study
We employed the FarmCPU method, implemented using rMVP [24] in R version 4.3.2 for GWAS in this study. The FarmCPU method utilizes the fixed-effect model (FEM) and the random-effect model (REM) iteratively [25]. The FEM is applied to test each of the m genetic markers individually. Pseudo-quantitative trait nucleotides (QTNs) are included as covariates to control false positives. Specifically, the FEM can be described as follows:
where is the observation on the ith sample; ⋯ represents the genotypes of the pseudo-QTNs; , is equal to the corresponding effect for the pseudo QTNs; represents the genotype of the SNPs and sample; represents the corresponding effect of the SNPs; and represents the residual.
The REM is employed to optimize the selection of pseudo QTNs from markers based on their testing statistics and positions using the SUPER algorithm [26] in an REM, as below:
where is the observation of the sample, the BHB concentration and estimated breeding values (EBVs) of BHB were used as the phenotype, respectively; is the residual, and represents the total genetic effect of the th sample. We determined the threshold value for selecting significant SNPs using the Bonferroni correction method [27]. The genome-wide significant level was set at 6.23 × 10⁻⁷ (0.05/80,217).
2.6. Functional Analyses
Gene set enrichment analysis helps identify phenotype-relevant SNPs and mechanisms of action by identifying corresponding biological pathways. Genes within 500 kb of the identified SNPs were used for further functional analyses. BioMart from Ensembl (release 101) was used to extract gene names and descriptions using the bovine genome assembly ARS-UCD1.2. Subsequently, we verified the biological functions of the relevant genes using the NCBI GenBank database (https://www.ncbi.nlm.nih.gov/, accessed on 10 December 2023) and carefully selected genes associated with the study. The online Gene Ontology (GO) database and Kyoto Encyclopedia of Genes and Genomes (KEGG) database were searched using the KOBAS [28] (http://bioinfo.org/kobas, accessed on 22 December 2023) according to the protein-coding gene ID. Statistical significance was set at p < 0.05. Finally, gene networks were constructed based on the predicted protein interactions among the annotated genes, using the STRING database (www.string-db.org/, accessed on 30 December 2023) [29].
3. Results
3.1. Descriptive Statistics
The descriptive statistical results of seven cattle herds are shown in Table 2. The blood ketone levels ranged from 0.1 to 8.0 mmol/L, with a mean of 0.927 mmol/L and a standard deviation of 0.527 mmol/L. Specifically, the highest average value was observed for H2 at 1.01 mmol/L, whereas the lowest average value was observed for H1 at 0.868 mmol/L. The number of animals with genotype and blood BHB phenotype data for different parities is presented in Supplementary Table S1.
Table 2.
Descriptive statistics of blood BHB trait in Chinese Holstein cattle.
3.2. Estimation of Genetic Parameters
The genetic parameters estimated from the pedigree-based and genomics-based analyses are listed in Table 3. BHB heritability in the present study ranged from 0.167 to 0.169, depending on the different information analyses used. In general, estimates with genomic information were slightly higher than those with pedigree information, mainly because of the larger additive genetic variance (Table 3). Considering that the residual variance was almost the same in the two approaches, the inclusion of genomic information resulted in the same variance, from the permanent environmental variance to the additive genetic effect.
Table 3.
Estimates of genetic parameters and variance components for blood BHB in Chinese Holstein cattle.
3.3. Genome-Wide Association Study
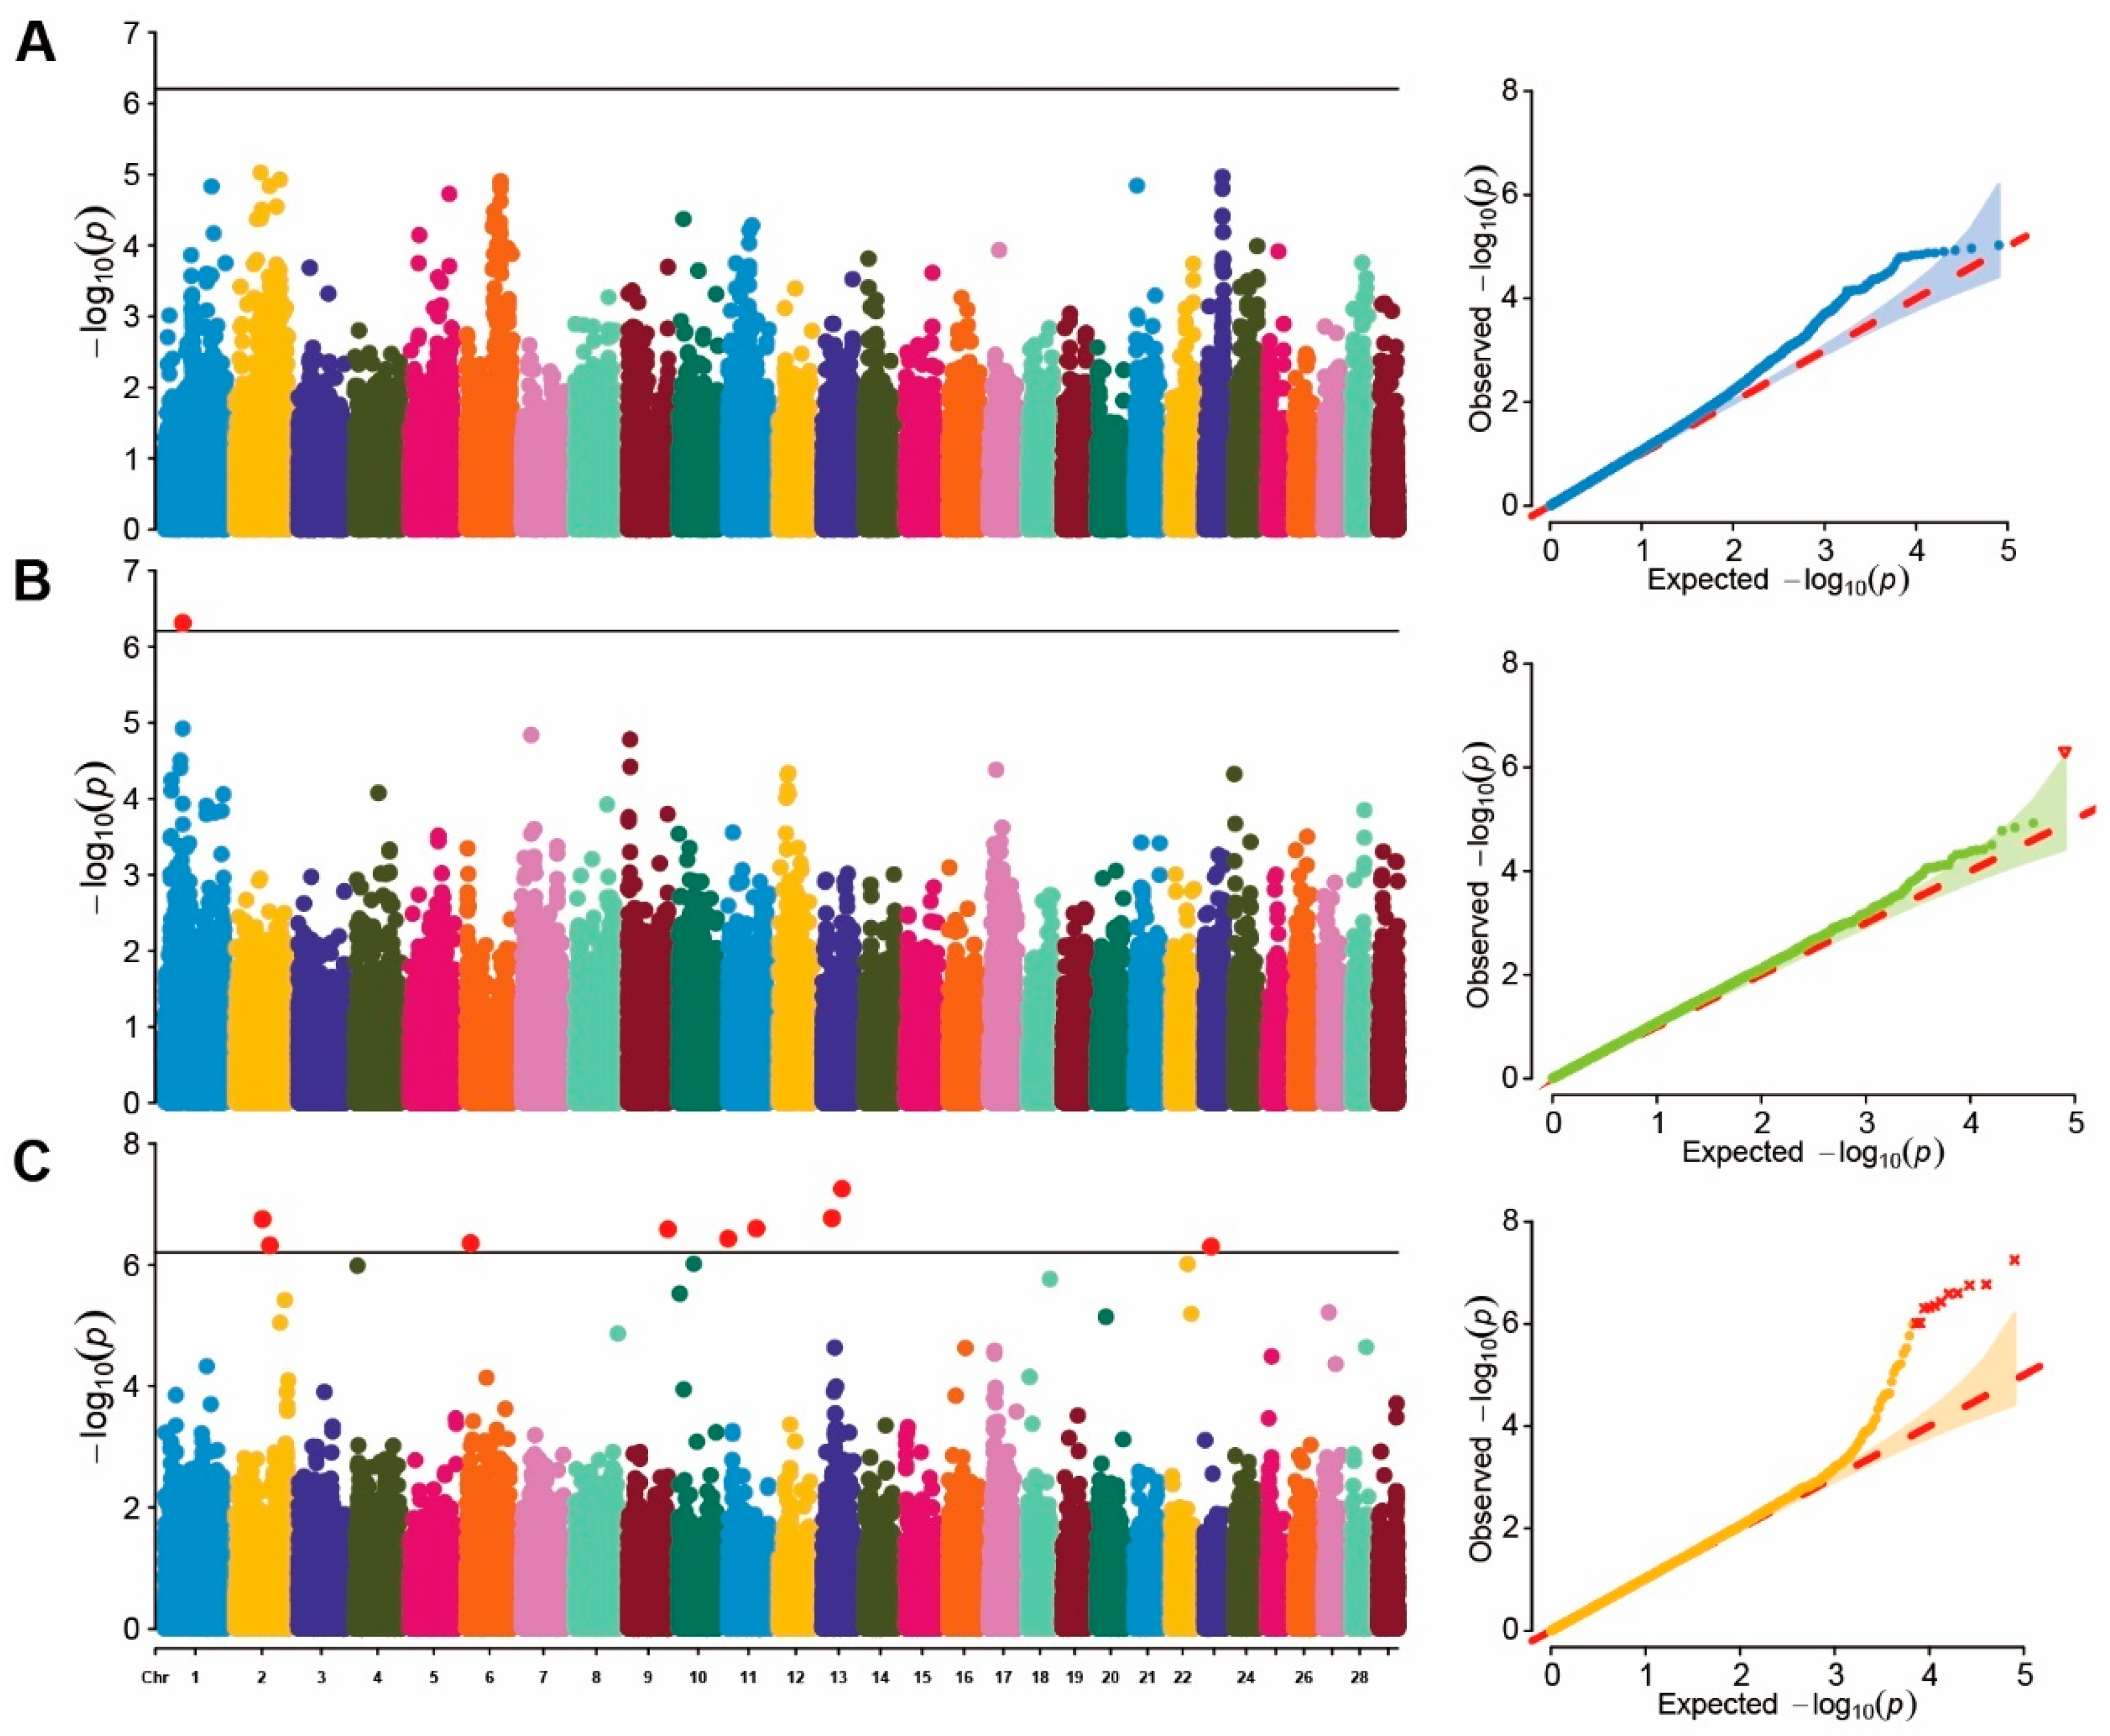
A single-marker GWAS analysis was conducted on blood BHB values in cows of different parities. Due to limited chip data for first-parity cows, genome-wide association analysis was performed on data from second- and third-parity cows. The p-value profiles of all SNP markers associated with each parity group are represented in Figure 1. No significant SNP loci were found in the second-parity GWAS, whereas only one significant SNP locus was identified in the third-parity GWAS. This SNP locus, located at ARS-BFGL-NGS-41577 in BTA 1 (position: 46.75 Mb), was annotated as ZPLD1. In addition, the effect of each SNP was calculated using the FarmCPU method based on the EBVs of all parity groups. (Figure 1C). The results revealed that nine significant SNP were distributed across BTA 2, 6, 9, 11, 13, and 23 (Table 4), among which the region on BTA 13 (50,955,987 bp) was the most significant loci (). A total of 48 genes located within 500 Kb of the significant SNPs were identified as potential candidate genes for the investigated traits.

Figure 1.
Manhattan and QQ plot of GWAS. (A) represents the Manhattan and QQ plots for the second-parity GWAS; (B) represents the Manhattan and QQ plots for the third-parity GWAS; (C) represents the Manhattan and QQ plots for the breeding values GWAS.
Table 4.
Significant SNPs identified for blood BHB in Chinese Holstein cattle.
3.4. Functional Analyses
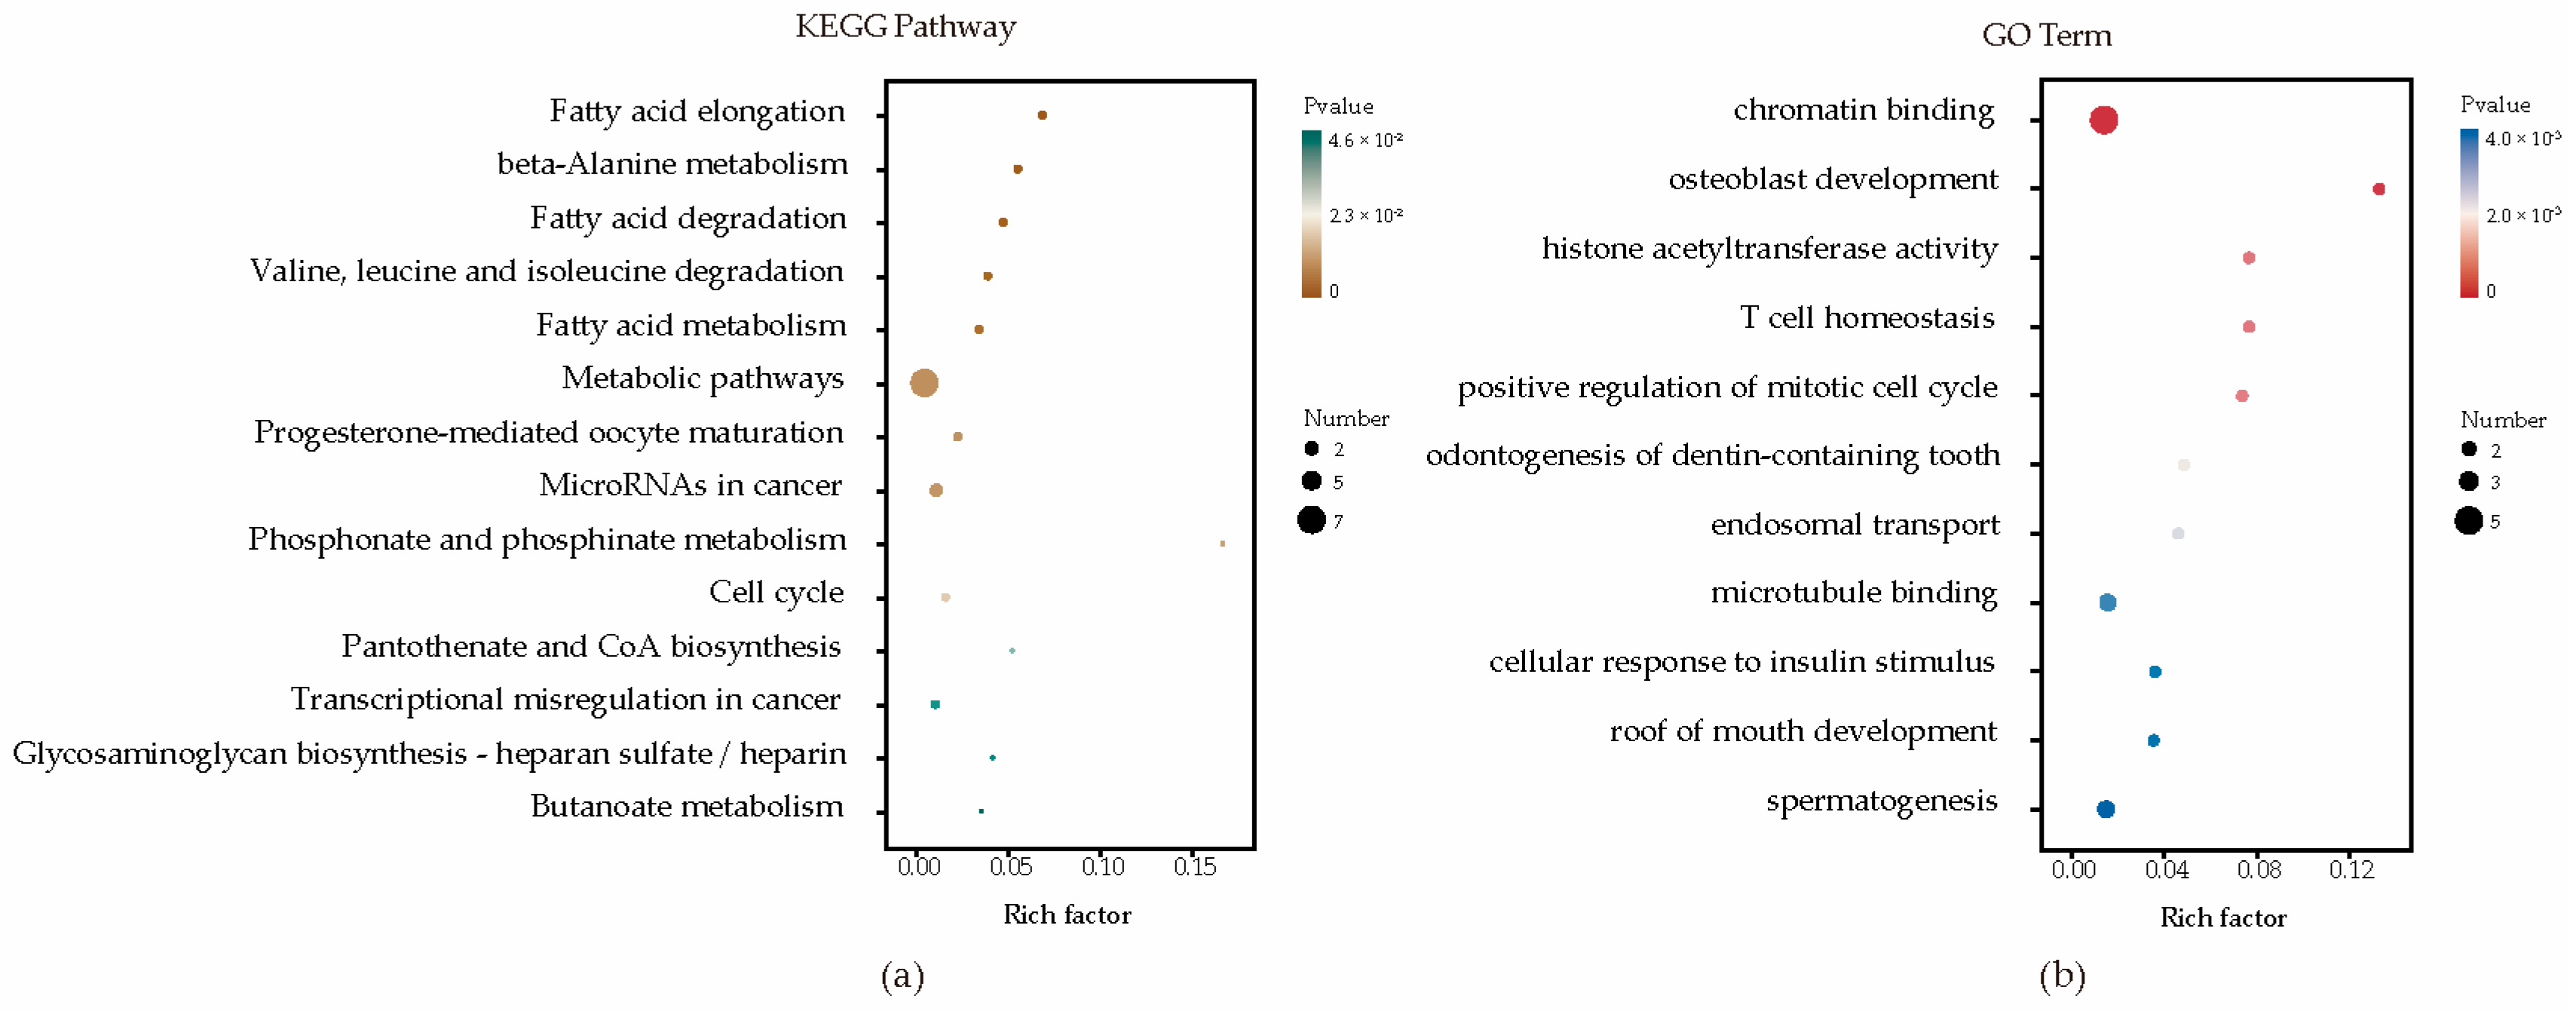
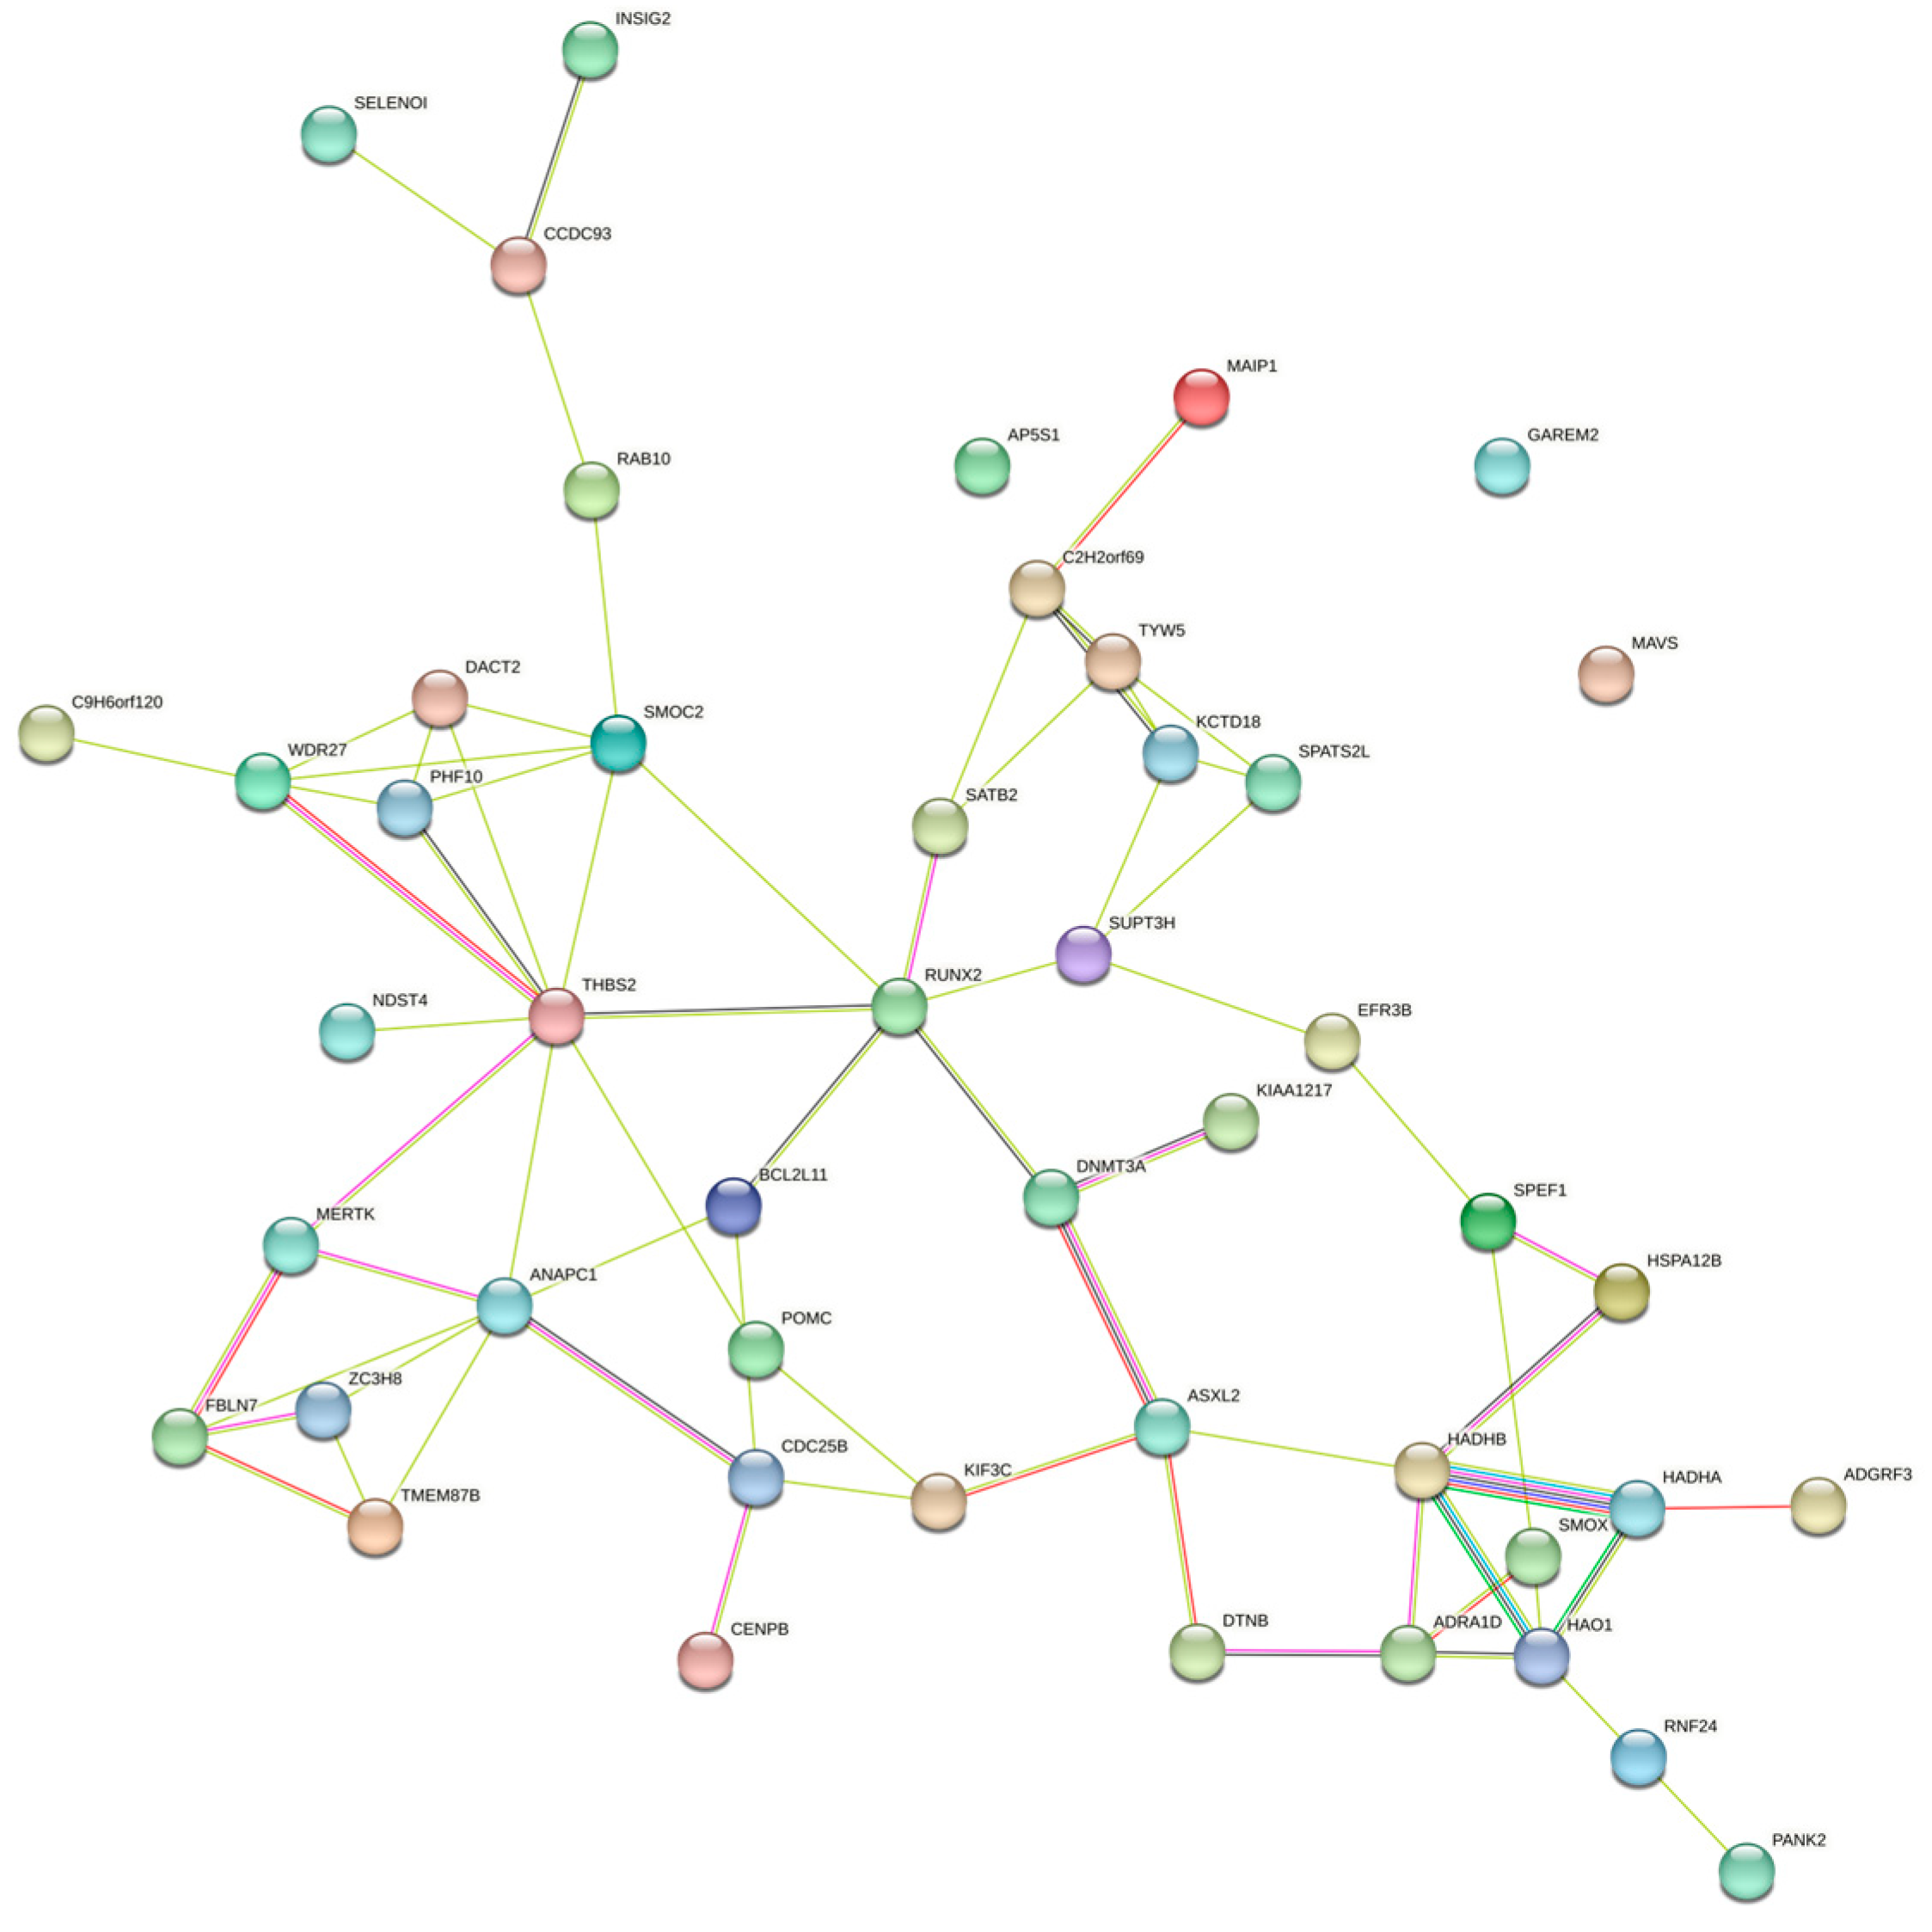
Enrichment analyses for GO terms and KEGG pathways were conducted on all candidate genes to pinpoint their roles in established metabolic pathways. Based on functional annotation results, significant pathways were identified for blood BHB (Figure 2; Supplementary Table S2). These comprised various KEGG pathways, including fatty acid elongation, β-alanine metabolism, fatty acid degradation, Valine, leucine, and isoleucine degradation, and fatty acid metabolism. Furthermore, they comprised GO terms such as chromatin binding, osteoblast development, histone acetyltransferase activity, T cell homeostasis, and positive regulation of the mitotic cell cycle. The relationships among the genes in the network were established using various methods, such as co-expression, gene fusion, protein homology, gene neighborhood, and gene co-occurrence. A network comprising 44 nodes connected by 65 edges was constructed (Figure 3).
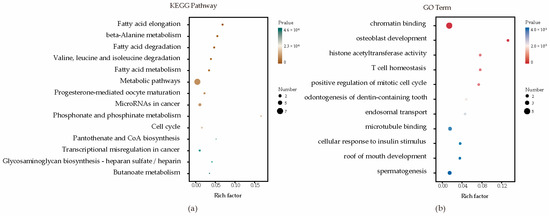
Figure 2.
Enrichment analysis factor diagram. (a) Enrichment analysis of KEGG metabolic pathways; (b) Enrichment analysis of GO metabolic pathways.
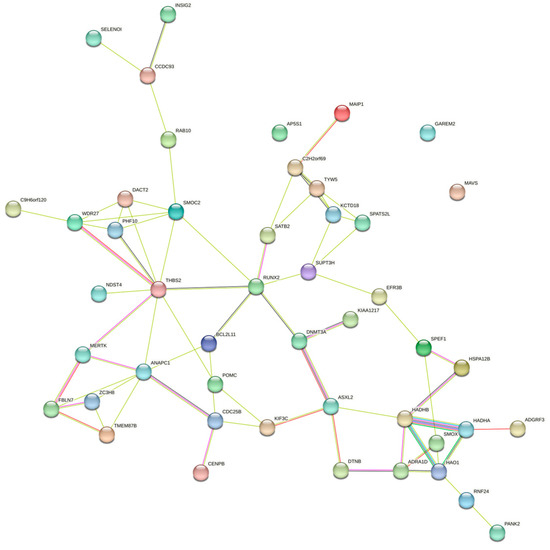
Figure 3.
Gene interaction network for the central genes associated with blood BHB.
4. Discussion
The present study aimed to estimate the genetic parameters of blood BHB and discover genomic variants associated with blood BHB using GWAS. In a large dataset of early lactating Holstein cows, most heritability estimates for BHB were based on predicted results from milk infrared spectra. For example, Koeck et al. [30] reported values ranging from 0.14 to 0.29 for Canadian Holsteins. Similarly, comparable heritability values were observed for Korean Holsteins, ranging from 0.14 to 0.09 in the first and fourth parities, respectively [5]. In Italian Holsteins, blood BHB had a moderate heritability in the first 35 days of milk, ranging from 0.13 to 0.3 [31]. The heritability in the present study was higher than previous estimates based on blood BHB predicted from the milk infrared spectra of Chinese Holstein cattle, in which the BHB heritability estimates ranged from 0.100 to 0.131 [32]. Continuous phenotypes, such as blood BHB concentrations, appear to serve as superior indicators of ketosis susceptibility for implementation in breeding programs. In a previous study, the estimated heritability of blood BHB concentration in primiparous Holstein cows, using a random regression model, ranged from 0.08 to 0.40 [33], which were significantly different from our results, mainly because they focused on primiparous cows and their sample size was smaller. The disparities noted in the aforementioned studies are likely attributable to variations in population, dataset structure, and statistical models employed. The results of another study were similar to those of the present study. Drift et al. [9] conducted a genetic analysis using early lactation blood and milk BHB in Dutch Holstein cows, revealing a heritability of 0.17 for blood BHB. Overall, the heritability estimates of blood BHB levels were consistent with those reported in previous studies.
Furthermore, using the BLUP and ssGBLUP analyses, the variance components and heritability estimates for blood BHB were 0.167 and 0.169, respectively (Table 3). The ssGBLUP method, which integrates genomic and pedigree relationship matrices, enhances the accuracy of breeding values for production traits in young animals compared to conventional BLUP methods [23,34,35]. The incorporation of genomic data enhances the precision of kinship assessments, thereby facilitating more precise estimations of genetic relationships among individuals. Our findings indicated a marginal increase in heritability estimates when using genomic data compared to pedigree-based methodologies. The limited increase in heritability may be attributed to the inclusion of individuals in the pedigree data. The inclusion of genomic data substantially improves the reliability of these traits [36,37]. In the future, we plan to collect more samples during periods with the highest phenotypic and genetic variation.
In our genome-wide association study, we performed a single-marker GWAS analysis using blood ketone values across different parity groups. However, no significantly associated SNP was found during the second lactation period, and all SNP effects were too small to be significant when the Bonferroni correction was applied. Only one SNP was significantly correlated with blood BHB levels during the third lactation period. It is important to recognize that the efficacy of GWAS is influenced by variables such as sample size and the density of SNP loci. Detecting SNPs with small effects can be difficult in circumstances of limited sample sizes or sparse SNP marker coverage [38,39]. Notably, we identified nine significant SNP loci located on BTA 2, 6, 9, 11, 13, and 23 based on BHB breeding values. The SNP BTA-32905-no-rs (50,955,987 bp) on BTA 13, which exhibited the highest p-value of 5.57 × 10⁻⁷, was situated within the genes RNF24, PANK2, and MAVS. However, further research is needed to explore the relationship between these three candidate genes and ketosis. On BTA 11, the two significant SNP loci (BovineHD1100000220, 730,613 bp, and BovineHD1100021063, 73,677,409 bp) included the potential candidate genes HADHA, HADHB, BCL2L11, and EFR3B. In particular, the gene hydroxyacyl-CoA dehydrogenase trifunctional multienzyme complex subunit α (HADHA) and β (HADHB) within the defined interval surrounding SNP BovineHD1100021063 (at 73,677,409 bp) on BTA 11 are associated with subclinical ketosis in later lactation [40]. In addition, studies have suggested the involvement of the BCL2L11 gene in lipid and glucose metabolic pathways [41]. The EFR3B gene is considered a candidate gene for human type 1 diabetes [42]. On BTA 2, both the SNP BovineHD0200020100 (69,386,940 bp) and BovineHD0200025237 (88,536,618 bp) exceeded the significance threshold. One of the candidate genes encompassing these two SNPs was INSIG2. The insulin-regulating gene INSIG2 is involved in insulin signal transduction and plays a crucial role in the regulation of lipid synthesis in mammary epithelial cells [43,44]. Insulin is a vital metabolic hormone that plays a key role in the regulation of energy metabolism during the transition period in dairy cows [45]. In the pathogenesis of ketosis, insulin resistance has been proposed as a predisposing factor because it may facilitate excessive postpartum adipose triglyceride lipolysis [46,47]. A previous GWAS of KET also detected several candidate genes associated with insulin metabolism and insulin-dependent diabetes [48]. Therefore, the INSIG2 gene may be considered a new candidate gene for KET. In addition to these findings, we detected significant SNP loci on BTA 6, 9, and 23 and annotated them to certain candidate genes.
To further annotate the functions, enrichment analysis was conducted on a list of candidate genes. These results indicated that molecular functions and biological processes are associated with fatty acid, amino acid, and lipid metabolism in dairy cattle. These comprise various KEGG pathways, including bta00062 (fatty acid elongation), bta00410 (β-alanine metabolism), bta00071 (fatty acid degradation), bta00280 (Valine, leucine, and isoleucine degradation), and bta01212 (fatty acid metabolism). The regulation of fatty acid metabolism directly influences the energy balance in dairy cows. High-yielding cows often experience ketosis more easily because of their higher demand for glucose and energy, which can lead to an insufficient glucose supply, prompting the breakdown of fatty acids and ketones [49,50]. Moreover, the gene–gene network analysis proved highly effective in exploring shared biological processes among candidate genes. HADHA and HADHB together form a mitochondrial membrane-bound hetero-oligomeric complex that catalyzes the final three steps of mitochondrial long-chain fatty acid β-oxidation. In a study on the glucagon response in mouse liver, under conditions of glucose scarcity, the mitochondrial β-oxidation enzyme HADHA promoted the production of β-hydroxybutyrate through β-oxidation [51]. In another study on liver tissue across three stages of lactation in Holstein cows, HADHB was identified as a candidate gene for milk fat, casein, and lactose synthesis in dairy cows [52]. Overall, these insights into the potential involvement of candidate genes contributing to susceptibility to ketosis may offer a foundational framework for understanding the pathogenesis of ketosis.
The results from our study confirmed the polygenic background of blood BHB and KET, indicating their influence on numerous genomic regions, likely with small effects. One limitation of the current study is the small sample size of cows included in the GWAS analysis, which, when combined with the statistical adjustment for multiple testing, may lead to a reduced number of significant SNPs being detected [53]. All SNP effects were too small to reach significance when considering the strict Bonferroni-corrected P-value. McCarthy et al. [54] suggested increasing the sample size to enhance the statistical power in GWAS for complex traits with low incidences. Additionally, genotyping cows with a denser SNP chip, as demonstrated by Freebern et al. [14], could potentially influence significance tests in GWAS. In future research, we intend to expand the sample size and utilize high-density SNP chip genotyping to improve the statistical power of GWAS for complex, low-heritability traits. Meanwhile, we will also plan to identify key candidate genes associated with ketosis by integrating genome-wide association and transcriptome data.
5. Conclusions
This study identified the genomic regions associated with blood BHB, and the estimated heritability and repeatability values for blood BHB were 0.167 and 0.175, respectively. The loci on BTA 2, 6, 9, 11, 13, and 23 exhibited significant associations with blood BHB values and were considered to harbor crucial genes related to ketosis. These findings uncovered important biological pathways related to fatty acid metabolism and lipid metabolism in dairy cattle. To address the limitations of this study, we intend to increase the sample size in future research and utilize high-density SNP chip genotyping to enhance the statistical power of GWAS for complex, low-heritability traits. In summary, our result provides a promising resource of candidate genes associated with blood BHB and ketosis in cattle, which can be utilized in breeding programs and future investigations into disease genes for clinical applications.
Supplementary Materials
The following supporting information can be downloaded at https://www.mdpi.com/article/10.3390/genes15040412/s1, Table S1: Descriptive statistics of blood BHB trait for individuals with genotypes in different parity; Table S2: The Kyoto Encyclopedia of Genes and Genomes (KEGG) pathways and Gene Ontology (GO)involved in candidate genes (p < 0.05).
Author Contributions
Conceptualization, H.H. and Z.Z.; methodology, Y.W., Z.W., H.H. and D.L.; software, Z.W., Y.W. and X.R.; formal analysis, X.R., L.Y., W.L. and S.X.; investigation, T.G., Z.Z. and T.F.; resources, Y.W. and Z.Z.; data curation, Y.W., Z.W. and S.X.; writing—original draft preparation, Y.W., Z.W. and H.H.; writing—review and editing, Y.W., Z.W., H.H. and Z.Z.; visualization, Z.W., D.L. and X.R.; supervision, T.G. and T.F.; funding acquisition, H.H., Z.Z. and T.G. All authors have read and agreed to the published version of the manuscript.
Funding
This study was supported and financed by Supported by the Key R&D Program of Henan Provinical, grant number 221111111100; the Key scientific and Technological Project of Henan Provinical Education Department of China, grant number 232102111003 and 30602863; the ear-marked fund for CARS36.
Institutional Review Board Statement
This research was conducted in accordance with all relevant national regulations and institutional policies for the care and use of experimental animals established by the Ministry of Science and Technology of the People’s Republic of China.
Informed Consent Statement
Not applicable.
Data Availability Statement
All data generated or used during this study are available upon request from the corresponding author.
Acknowledgments
The authors are grateful to Ganghui Dong for his help with the collection of phenotype data in this paper.
Conflicts of Interest
The authors declare no conflict of interest.
References
- Suthar, V.S.; Canelas-Raposo, J.; Deniz, A.; Heuwieser, W. Prevalence of subclinical ketosis and relationships with postpartum diseases in European dairy cows. J. Dairy Sci. 2013, 96, 2925–2938. [Google Scholar] [CrossRef] [PubMed]
- Benedet, A.; Manuelian, C.L.; Zidi, A.; Penasa, M.; De Marchi, M. Invited review: β-hydroxybutyrate concentration in blood and milk and its associations with cow performance. Animal 2019, 13, 1676–1689. [Google Scholar] [CrossRef] [PubMed]
- Steeneveld, W.; Amuta, P.; van Soest, F.J.S.; Jorritsma, R.; Hogeveen, H. Estimating the combined costs of clinical and subclinical ketosis in dairy cows. PLoS ONE 2020, 15, e0230448. [Google Scholar] [CrossRef] [PubMed]
- Gordon, J.L.; LeBlanc, S.J.; Duffield, T.F. Ketosis Treatment in Lactating Dairy Cattle. Vet. Clin. N. Am. Food A 2013, 29, 433–445. [Google Scholar] [CrossRef] [PubMed]
- Ranaraja, U.; Cho, K.; Park, M.; Kim, S.; Lee, S.; Do, C. Genetic parameter estimation for milk β-hydroxybutyrate and acetone in early lactation and its association with fat to protein ratio and energy balance in Korean Holstein cattle. Asian Australas. J. Anim. 2018, 31, 798–803. [Google Scholar] [CrossRef] [PubMed]
- Pryce, J.E.; Gaddis, K.L.P.; Koeck, A.; Bastin, C.; Abdelsayed, M.; Gengler, N.; Miglior, F.; Heringstad, B.; Egger-Danner, C.; Stock, K.F.; et al. Opportunities for genetic improvement of metabolic diseases. J. Dairy Sci. 2016, 99, 6855–6873. [Google Scholar] [CrossRef] [PubMed]
- Ametaj, B.N. Periparturient Diseases of Dairy Cows; Springer: Berlin/Heidelberg, Germany, 2017. [Google Scholar]
- Duffield, T.F.; Lissemore, K.D.; McBride, B.W.; Leslie, K.E. Impact of hyperketonemia in early lactation dairy cows on health and production. J. Dairy Sci. 2009, 92, 571–580. [Google Scholar] [CrossRef]
- van der Drift, S.G.; van Hulzen, K.J.; Teweldemedhn, T.G.; Jorritsma, R.; Nielen, M.; Heuven, H.C. Genetic and nongenetic variation in plasma and milk β-hydroxybutyrate and milk acetone concentrations of early-lactation dairy cows. J. Dairy Sci. 2012, 95, 6781–6787. [Google Scholar] [CrossRef]
- Wang, K.; Hua, G.; Li, J.; Yang, Y.; Zhang, C.; Yang, L.; Hu, X.; Scheben, A.; Wu, Y.; Gong, P.; et al. Duck pan-genome reveals two transposon insertions caused bodyweight enlarging and white plumage phenotype formation during evolution. iMeta 2023, 3, e154. [Google Scholar] [CrossRef]
- Wang, K.J.; Hu, H.F.; Tian, Y.D.; Li, J.Y.; Scheben, A.; Zhang, C.X.; Li, Y.Y.; Wu, J.F.; Yang, L.; Fan, X.W.; et al. The Chicken Pan-Genome Reveals Gene Content Variation and a Promoter Region Deletion in Affecting Body Size. Mol. Biol. Evol. 2021, 38, 5066–5081. [Google Scholar] [CrossRef]
- Hu, Z.L.; Park, C.A.; Reecy, J.M. Building a livestock genetic and genomic information knowledgebase through integrative developments of Animal QTLdb and CorrDB. Nucleic Acids Res. 2019, 47, D701–D710. [Google Scholar] [CrossRef] [PubMed]
- Huang, H.; Cao, J.; Hanif, Q.; Wang, Y.; Yu, Y.; Zhang, S.; Zhang, Y. Genome-wide association study identifies energy metabolism genes for resistance to ketosis in Chinese Holstein cattle. Anim. Genet. 2019, 50, 376–380. [Google Scholar] [CrossRef]
- Freebern, E.; Santos, D.J.A.; Fang, L.Z.; Jiang, J.C.; Gaddis, K.L.P.; Liu, G.E.; VanRaden, P.M.; Maltecca, C.; Cole, J.B.; Ma, L. GWAS and fine-mapping of livability and six disease traits in Holstein cattle. BMC Genom. 2020, 21, 41. [Google Scholar] [CrossRef] [PubMed]
- Pralle, R.S.; Schultz, N.E.; White, H.M.; Weigel, K.A. Hyperketonemia GWAS and parity-dependent SNP associations in Holstein dairy cows intensively sampled for blood β-hydroxybutyrate concentration. Physiol. Genom. 2020, 52, 347–357. [Google Scholar] [CrossRef] [PubMed]
- Macmillan, K.; Helguera, I.L.; Behrouzi, A.; Gobikrushanth, M.; Hoff, B.; Colazo, M.G. Accuracy of a cow-side test for the diagnosis of hyperketonemia and hypoglycemia in lactating dairy cows. Res. Vet. Sci. 2017, 115, 327–331. [Google Scholar] [CrossRef] [PubMed]
- Browning, S.R.; Browning, B.L. Rapid and accurate haplotype phasing and missing-data inference for whole-genome association studies by use of localized haplotype clustering. Am. J. Hum. Genet. 2007, 81, 1084–1097. [Google Scholar] [CrossRef] [PubMed]
- Purcell, S.; Neale, B.; Todd-Brown, K.; Thomas, L.; Ferreira, M.A.R.; Bender, D.; Maller, J.; Sklar, P.; de Bakker, P.I.W.; Daly, M.J.; et al. PLINK: A tool set for whole-genome association and population-based linkage analyses. Am. J. Hum. Genet. 2007, 81, 559–575. [Google Scholar] [CrossRef]
- Dunn, P.K.; Smyth, G.K. Generalized Linear Models with Examples in R; Springer: Berlin/Heidelberg, Germany, 2018; Volume 53. [Google Scholar]
- R Core Team. R: A Language and Environment for Statistical Computing. Available online: https://www.R-project.org/ (accessed on 10 October 2023).
- Misztal, I.; Tsuruta, S.; Strabel, T.; Auvray, B.; Druet, T.; Lee, D. BLUPF90 and related programs (BGF90). In Proceedings of the 7th World Congress on Genetics Applied to Livestock Production; Montpellier, France, 19–23 August 2002, p. 743.
- Aguilar, I.; Tsuruta, S.; Masuda, Y.; Lourenco, D.; Legarra, A.; Misztal, I. BLUPF90 suite of programs for animal breeding with focus on genomics. In Proceedings of the World Congress on Genetics Applied to Livestock Production, Auckland, New Zealand, 11–16 February 2018; pp. 11–16. [Google Scholar]
- Legarra, A.; Aguilar, I.; Misztal, I. A relationship matrix including full pedigree and genomic information. J. Dairy Sci. 2009, 92, 4656–4663. [Google Scholar] [CrossRef]
- Liu, X.; Yin, L.; Zhang, H.; Li, X.; Zhao, S. Performing Genome-Wide Association Studies Using rMVP. Methods Mol. Biol. 2022, 2481, 219–245. [Google Scholar] [CrossRef]
- Liu, X.; Huang, M.; Fan, B.; Buckler, E.S.; Zhang, Z. Iterative Usage of Fixed and Random Effect Models for Powerful and Efficient Genome-Wide Association Studies. PLoS ONE 2016, 12, e1005767. [Google Scholar] [CrossRef]
- Wang, Q.S.; Tian, F.; Pan, Y.C.; Buckler, E.S.; Zhang, Z.W. A SUPER Powerful Method for Genome Wide Association Study. PLoS ONE 2014, 9, e107684. [Google Scholar] [CrossRef] [PubMed]
- Bland, J.M.; Altman, D.G. Multiple significance tests: The Bonferroni method. BMJ 1995, 310, 170. [Google Scholar] [CrossRef] [PubMed]
- Bu, D.C.; Luo, H.T.; Huo, P.P.; Wang, Z.H.; Zhang, S.; He, Z.H.; Wu, Y.; Zhao, L.H.; Liu, J.J.; Guo, J.C.; et al. KOBAS-i: Intelligent prioritization and exploratory visualization of biological functions for gene enrichment analysis. Nucleic Acids Res. 2021, 49, W317–W325. [Google Scholar] [CrossRef] [PubMed]
- Szklarczyk, D.; Kirsch, R.; Koutrouli, M.; Nastou, K.; Mehryary, F.; Hachilif, R.; Gable, A.L.; Fang, T.; Doncheva, N.T.; Pyysalo, S.; et al. The STRING database in 2023: Protein-protein association networks and functional enrichment analyses for any sequenced genome of interest. Nucleic Acids Res. 2023, 51, D638–D646. [Google Scholar] [CrossRef] [PubMed]
- Koeck, A.; Jamrozik, J.; Schenkel, F.S.; Moore, R.K.; Lefebvre, D.M.; Kelton, D.F.; Miglior, F. Genetic analysis of milk β-hydroxybutyrate and its association with fat-to-protein ratio, body condition score, clinical ketosis, and displaced abomasum in early first lactation of Canadian Holsteins. J. Dairy Sci. 2014, 97, 7286–7292. [Google Scholar] [CrossRef]
- Benedet, A.; Costa, A.; De Marchi, M.; Penasa, M. Heritability estimates of predicted blood β-hydroxybutyrate and nonesterified fatty acids and relationships with milk traits in early-lactation Holstein cows. J. Dairy Sci. 2020, 103, 6354–6363. [Google Scholar] [CrossRef] [PubMed]
- Lou, W.; Zhang, H.; Luo, H.; Chen, Z.; Shi, R.; Guo, X.; Zou, Y.; Liu, L.; Brito, L.F.; Guo, G.; et al. Genetic analyses of blood β-hydroxybutyrate predicted from milk infrared spectra and its association with longevity and female reproductive traits in Holstein cattle. J. Dairy Sci. 2023, 106, 3051. [Google Scholar] [CrossRef]
- Oikonomou, G.; Valergakis, G.E.; Arsenos, G.; Roubies, N.; Banos, G. Genetic profile of body energy and blood metabolic traits across lactation in primiparous Holstein cows. J. Dairy Sci. 2008, 91, 2814–2822. [Google Scholar] [CrossRef]
- Aguilar, I.; Misztal, I.; Johnson, D.L.; Legarra, A.; Tsuruta, S.; Lawlor, T.J. A unified approach to utilize phenotypic, full pedigree, and genomic information for genetic evaluation of Holstein final score. J. Dairy Sci. 2010, 93, 743–752. [Google Scholar] [CrossRef]
- Oliveira, H.R.; Lourenco, D.A.L.; Masuda, Y.; Misztal, I.; Tsuruta, S.; Jamrozik, J.; Brito, L.F.; Silva, F.F.; Schenkel, F.S. Application of single-step genomic evaluation using multiple-trait random regression test-day models in dairy cattle. J. Dairy Sci. 2019, 102, 2365–2377. [Google Scholar] [CrossRef]
- Vukasinovic, N.; Bacciu, N.; Przybyla, C.A.; Boddhireddy, P.; DeNise, S.K. Development of genetic and genomic evaluation for wellness traits in US Holstein cows. J. Dairy Sci. 2017, 100, 428–438. [Google Scholar] [CrossRef] [PubMed]
- Gaddis, K.L.P.; Cole, J.B.; Clay, J.S.; Maltecca, C. Genomic selection for producer-recorded health event data in US dairy cattle. J. Dairy Sci. 2014, 97, 3190–3199. [Google Scholar] [CrossRef] [PubMed]
- Ziyatdinov, A.; Kim, J.; Prokopenko, D.; Privé, F.; Laporte, F.; Loh, P.R.; Kraft, P.; Aschard, H. Estimating the effective sample size in association studies of quantitative traits. G3 Genes Genom. Genet. 2021, 11, jkab057. [Google Scholar] [CrossRef] [PubMed]
- Spencer, C.C.A.; Su, Z.; Donnelly, P.; Marchini, J. Designing Genome-Wide Association Studies: Sample Size, Power, Imputation, and the Choice of Genotyping Chip. PLoS Genet. 2009, 5, e1000477. [Google Scholar] [CrossRef] [PubMed]
- Soares, R.A.N.; Vargas, G.; Duffield, T.; Schenkel, F.; Squires, E.J. Genome-wide association study and functional analyses for clinical and subclinical ketosis in Holstein cattle. J. Dairy Sci. 2021, 104, 10076–10089. [Google Scholar] [CrossRef]
- Klein, S.L.; Scheper, C.; May, K.; König, S. Genetic and nongenetic profiling of milk β-hydroxybutyrate and acetone and their associations with ketosis in Holstein cows. J. Dairy Sci. 2020, 103, 10332–10346. [Google Scholar] [CrossRef] [PubMed]
- Gomez-Lopera, N.; Alfaro, J.M.; Leal, S.M.; Pineda-Trujillo, N. Type 1 diabetes loci display a variety of native American and African ancestries in diseased individuals from Northwest Colombia. World J. Diabetes 2019, 10, 534–545. [Google Scholar] [CrossRef]
- Li, C.; Wang, M.; Zhang, T.Y.; He, Q.Y.; Shi, H.P.; Luo, J.; Loor, J.J. Insulin-induced gene 1 and 2 isoforms synergistically regulate triacylglycerol accumulation, lipid droplet formation, and lipogenic gene expression in goat mammary epithelial cells. J. Dairy Sci. 2019, 102, 1736–1746. [Google Scholar] [CrossRef]
- Lisowski, P.; Kosciuczuk, E.M.; Goscik, J.; Pierzchala, M.; Rowinska, B.; Zwierzchowski, L. Hepatic transcriptome profiling identifies differences in expression of genes associated with changes in metabolism and postnatal growth between Hereford and Holstein-Friesian bulls. Anim. Genet. 2014, 45, 288–292. [Google Scholar] [CrossRef]
- Weber, C.; Schäff, C.T.; Kautzsch, U.; Börner, S.; Erdmann, S.; Görs, S.; Röntgen, M.; Sauerwein, H.; Bruckmaier, R.M.; Metges, C.C.; et al. Insulin-dependent glucose metabolism in dairy cows with variable fat mobilization around calving. J. Dairy Sci. 2016, 99, 6665–6679. [Google Scholar] [CrossRef]
- Gross, J.; van Dorland, H.A.; Schwarz, F.J.; Bruckmaier, R.M. Endocrine changes and liver mRNA abundance of somatotropic axis and insulin system constituents during negative energy balance at different stages of lactation in dairy cows. J. Dairy Sci. 2011, 94, 3484–3494. [Google Scholar] [CrossRef] [PubMed]
- Kerestes, M.; Faigl, V.; Kulcsár, A.; Balogh, O.; Földi, J.; Fébel, H.; Chilliard, Y.; Huszenicza, G. Periparturient insulin secretion and whole-body insulin responsiveness in dairy cows showing various forms of ketone pattern with or without puerperal metritis. Domest. Anim. Endocrinol. 2009, 37, 250–261. [Google Scholar] [CrossRef] [PubMed]
- Gaddis, K.L.P.; Megonigal, J.H.; Clay, J.S.; Wolfe, C.W. Genome-wide association study for ketosis in US Jerseys using producer-recorded data. J. Dairy Sci. 2018, 101, 413–424. [Google Scholar] [CrossRef] [PubMed]
- Tufarelli, V.; Puvača, N.; Glamočić, D.; Pugliese, G.; Colonna, M.A. The Most Important Metabolic Diseases in Dairy Cattle during the Transition Period. Animals 2024, 14, 816. [Google Scholar] [CrossRef] [PubMed]
- Ha, S.; Kang, S.; Jeong, M.; Han, M.; Lee, J.; Chung, H.; Park, J. Characteristics of Holstein cows predisposed to ketosis during the post-partum transition period. Vet. Med. Sci. 2023, 9, 307–314. [Google Scholar] [CrossRef] [PubMed]
- Pan, A.; Sun, X.M.; Huang, F.Q.; Liu, J.F.; Cai, Y.Y.; Wu, X.; Alolga, R.N.; Li, P.; Liu, B.L.; Liu, Q.; et al. The mitochondrial β-oxidation enzyme HADHA restrains hepatic glucagon response by promoting β-hydroxybutyrate production. Nat. Commun. 2022, 13, 386. [Google Scholar] [CrossRef] [PubMed]
- Xu, L.N.; Shi, L.J.; Liu, L.; Liang, R.B.; Li, Q.; Li, J.G.; Han, B.; Sun, D.X. Analysis of Liver Proteome and Identification of Critical Proteins Affecting Milk Fat, Protein, and Lactose Metabolism in Dariy Cattle with iTRAQ. Proteomics 2019, 19, 1800387. [Google Scholar] [CrossRef]
- Tam, V.; Patel, N.; Turcotte, M.; Bossé, Y.; Paré, G.; Meyre, D. Benefits and limitations of genome-wide association studies. Nat. Rev. Genet. 2019, 20, 467–484. [Google Scholar] [CrossRef]
- McCarthy, M.I.; Abecasis, G.R.; Cardon, L.R.; Goldstein, D.B.; Little, J.; Ioannidis, J.P.A.; Hirschhorn, J.N. Genome-wide association studies for complex traits: Consensus, uncertainty and challenges. Nat. Rev. Genet. 2008, 9, 356–369. [Google Scholar] [CrossRef]
Disclaimer/Publisher’s Note: The statements, opinions and data contained in all publications are solely those of the individual author(s) and contributor(s) and not of MDPI and/or the editor(s). MDPI and/or the editor(s) disclaim responsibility for any injury to people or property resulting from any ideas, methods, instructions or products referred to in the content. |
© 2024 by the authors. Licensee MDPI, Basel, Switzerland. This article is an open access article distributed under the terms and conditions of the Creative Commons Attribution (CC BY) license (https://creativecommons.org/licenses/by/4.0/).