Article

Detection and Analysis of Genes Affecting the Number of Thoracic Vertebrae in Licha Black Pigs

1
College of Animal Science and Technology, Qingdao Agricultural University, Qingdao 266109, China
2
Bureau of Agriculture and Rural Affairs of Jiaozhou, Jiaozhou 266300, China
*
Author to whom correspondence should be addressed.
These authors contributed equally to this work.
Genes 2024, 15(4), 477; https://doi.org/10.3390/genes15040477
Submission received: 21 March 2024 / Revised: 6 April 2024 / Accepted: 7 April 2024 / Published: 10 April 2024
(This article belongs to the Special Issue Advances in Pig Genetic and Genomic Breeding of 2024)

Abstract

:
The number of thoracic vertebrae (NTV) in pigs is an important economic trait that significantly influences pork production. While the Licha black pig is a well-known Chinese pig breed with multiple thoracic vertebrae, the genetic mechanism is still unknown. Here, we performed a selective signal analysis on the genome of Licha black pigs, comparing individuals with 15 NTV versus those with 16 NTV to better understand functional genes associated with NTV. A total of 2265 selection signal regions were detected across the genome, including 527 genes and 1073 QTL that overlapped with the selection signal regions. Functional enrichment analysis revealed that LRP5 and SP5 genes were involved in biological processes such as bone morphogenesis and Wnt protein binding. Furthermore, three genes, LRP8, DEF6, and SCUBE3, associated with osteoblast differentiation and bone formation, were located within or close to the QTL related to bone development and vertebrae number. These five genes were hypothesized to be potential candidates for regulating the NTV trait in Licha black pigs. Our findings revealed several candidate genes that play crucial roles in NTV regulation and provide a theoretical foundation to understand the genetic mechanism of the NTV trait in pig breeding.

1. Introduction

The number of vertebrae in pigs is an economically important trait, composed of cervical vertebrae, thoracic vertebrae, lumbar vertebrae, sacral bone, and caudal vertebrae. The number of thoracic vertebrae (NTV) varies from 13 to 17 and is equivalent to the number of ribs, potentially influencing carcass length and body weight [1,2]. Therefore, in the pig industry, selecting multi-vertebral pigs by molecular breeding means can increase pork production and economic benefits.
China has a wealth of pig genetic resources, accounting for roughly one-third of the world’s total pig breeds [3]. Numerous indigenous pig breeds in China display distinctive traits, including disease resistance, efficient feed conversion, and high fertility [4]. The preservation and utilization of these indigenous pig breeds are essential for maintaining biodiversity and for the development of new pig breeds with improved traits. The Licha black pig is a popular local pig breed, primarily found in the Jiaodong Peninsula of Shandong Province, China. It is worth mentioning that Licha black pig is distinguished from other local breeds by a multi-vertebral trait manifested by one additional thoracic vertebrae [5].
NTV has a moderate heritability of approximately 0.6 [1,6]. Previous research has demonstrated that NTV is a polygenic trait influenced by multiple quantitative trait loci (QTL). Yang et al. [7] discovered that the VRTN gene located on Sus scrofa chromosome (SSC) 7 was significantly associated with NTV in the Duroc, Landrace, and White Duroc × Erhualian F2 population, and the VRTN mutation site potentially also influenced carcass length and teat number. Niu et al. [8] revealed that the GREB1L and MIB1 genes on SSC6 and the ABCD4 gene on SSC7 were related to NTV in the Beijing black pig population. Furthermore, the FOS and BMPR1A genes, located on SSC7 and SSC14, respectively, were identified as the candidate genes regulating NTV in a Large White × Minzhu intercross pig population [9]. As previously stated, somite, formed from the presomitic mesoderm during early embryogenesis, regulates the number of vertebrae [10,11]. Moreover, research evidence on model organisms revealed that the Notch, Wnt, and Retinoic acid signal pathways can regulate somite development to ensure normal formation and differentiation via segmentation clock regulation [12]. Among them, the Wnt signaling pathway is critically linked to various developmental processes, including gastrulation, organ development, and tissue homeostasis. In particular, during vertebrae development, the Wnt signaling pathway influences the development of somites, some of which develop into vertebrae [10].
While candidate genes for NTV have previously been identified, the studies primarily focused on Western pig breeds and hybrid bred from Western and Chinese pig breeds. On the contrary, the Licha black pig is an indigenous breed formed by long-term breeding of local residents, which is less impacted by modern hybrid breeding and has less introgression of Western pig lineage. The purpose of the current study was to identify candidate genes that play crucial roles in NTV regulation and to provide a theoretical foundation for the increase of NTV in Licha black pigs.

2. Materials and Methods

2.1. Animal and Sample Collection

One-month-old Licha black pigs for this study were selected from the National Nucleus Licha Black Pig Conservation Farm in Jiaozhou, Shandong Province, China. DUAL VET X-Plus (Sedecal, Madrid, Spain), a portable X-ray machine, was utilized to take an X-ray picture of each individual, and the number of thoracic vertebrae was accurately counted by the staff. A total of 19 Licha black pigs, including 9 with 16 NTV and 10 with 15 NTV, were selected for the subsequent analysis. We strictly followed the Animal Care and Use of Qingdao Agricultural University (Qingdao, China) for the relevant experimental procedures. Ear tissue samples were collected using scissors and placed in an anhydrous ethanol-containing centrifuge tube. All the tools and equipment used for sample collection were sterilized by heat or ultraviolet rays.

2.2. Whole Genome Resequencing

Genomic DNA from ear tissues was extracted using TIANamp Genomic DNA kits (Tiangen Biotech, Beijing, China). The concentration and purity of genomic DNA were detected using a NanoDrop™ 2000 (Thermo Fisher, Waltham, MA, USA). DNA samples with a light absorption ratio (A260/280) between 1.8 and 2.0 and a concentration > 50 ng/μL were used in the subsequent steps. DNA libraries were constructed for each individual using an MGIEasy FS DNA Prep kit (BGI, Shenzhen, China) following the manufacturer’s instructions. Paired-end sequencing using the MGISEQ-2000 platform (BGI, Shenzhen, China) yielded 150 bp-sized sequencing reads.

2.3. Quality Control and Reads Mapping

To ensure the reliability of bioinformatics analysis, the NGS QC Toolkit [13] was used to remove low-quality paired reads of the sequencing data. Reads containing greater than 5% unidentified nucleotides (N) longer than 50% bases with phred quality less than 5 were eliminated. BWA 0.7.17 software [14] was used to map clean data to the reference genome Sus scrofa 11.1 (https://www.ensembl.org/Sus_scrofa/Info/Index, accessed on 1 January 2023). SAMtools 1.12 software [15] was employed to perform local realignment and eliminate PCR duplicates. Subsequently, SNP for each individual was detected using the GATK 4.2.0 software [16], and the genotype data were quality controlled using Plink 1.90 software [17]. Individuals with genotyping call rates less than 90%, SNP with a call rate less than 90%, minor allele frequencies less than 0.01, Hardy–Weinberg equilibrium p-value less than 1 × 10⁻⁶, and SNP on sex chromosomes were excluded.

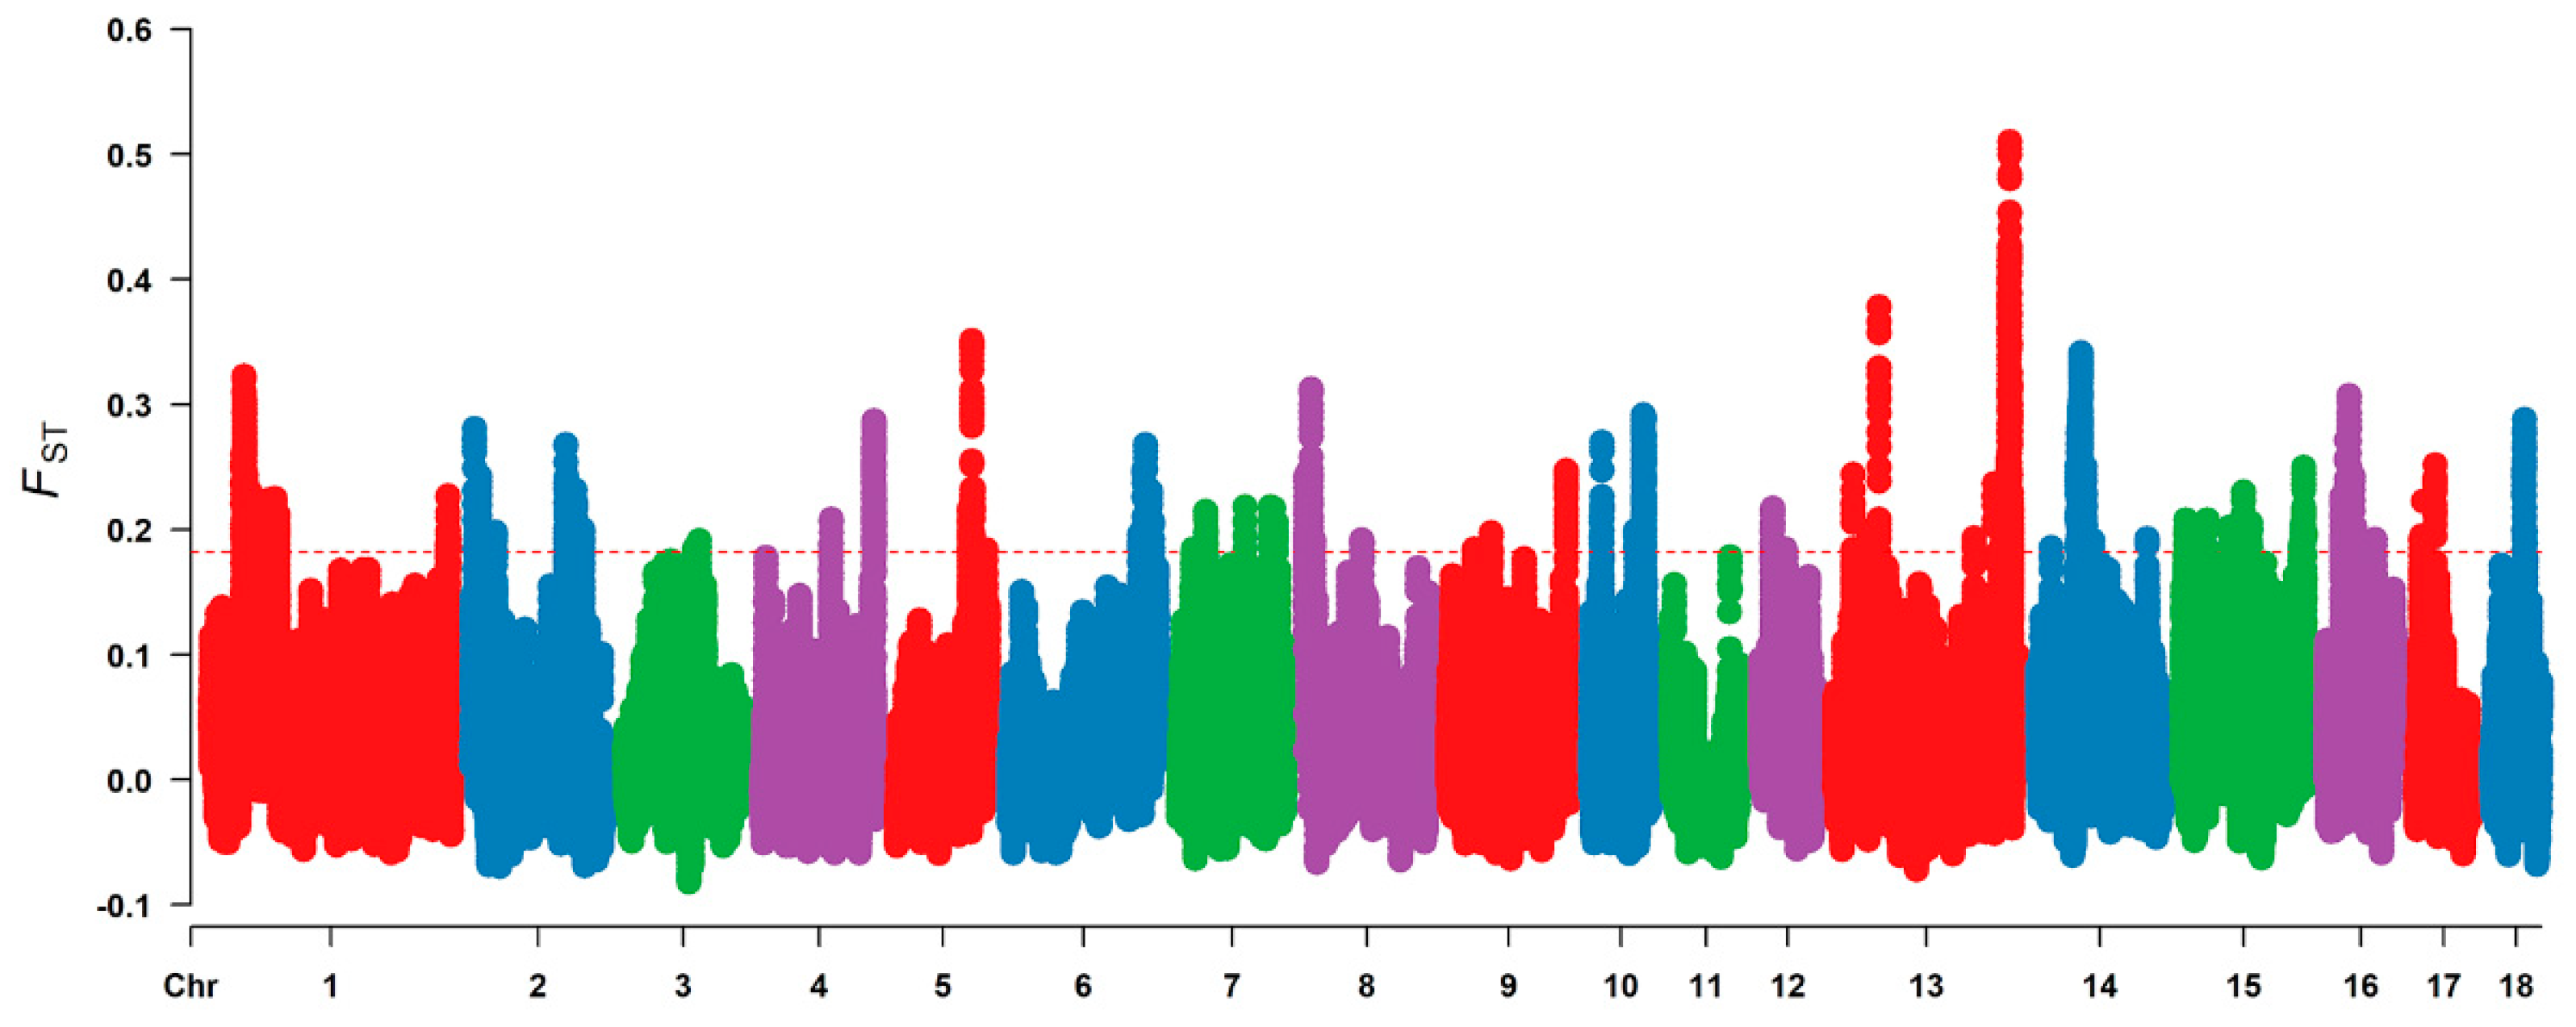
2.4. Genome Scanning for Selective Signal Analysis

The whole genome selection signals were determined by comparing individuals with 15 NTV to those with 16 NTV. A selective scanning analysis was performed using VCFtools 0.1.16 software [18] and setting a 100 KB sliding window with a step size of 10 KB. The genetic differentiation value (FST) between the two groups was calculated, with the empirical top 1% as the threshold (FSTtop0.01 = 0.18). Genes partially or completely overlapping with selection signal regions were selected based on the Sus scrofa 11.1 genome assembly using the BioMart data management (http://www.biomart.org/, accessed on 1 January 2023). Furthermore, these selection signal regions were also compared with pig QTL from the animal QTL database (https://www.animalgenome.org/cgi-bin/QTLdb/, accessed on 1 January 2023).

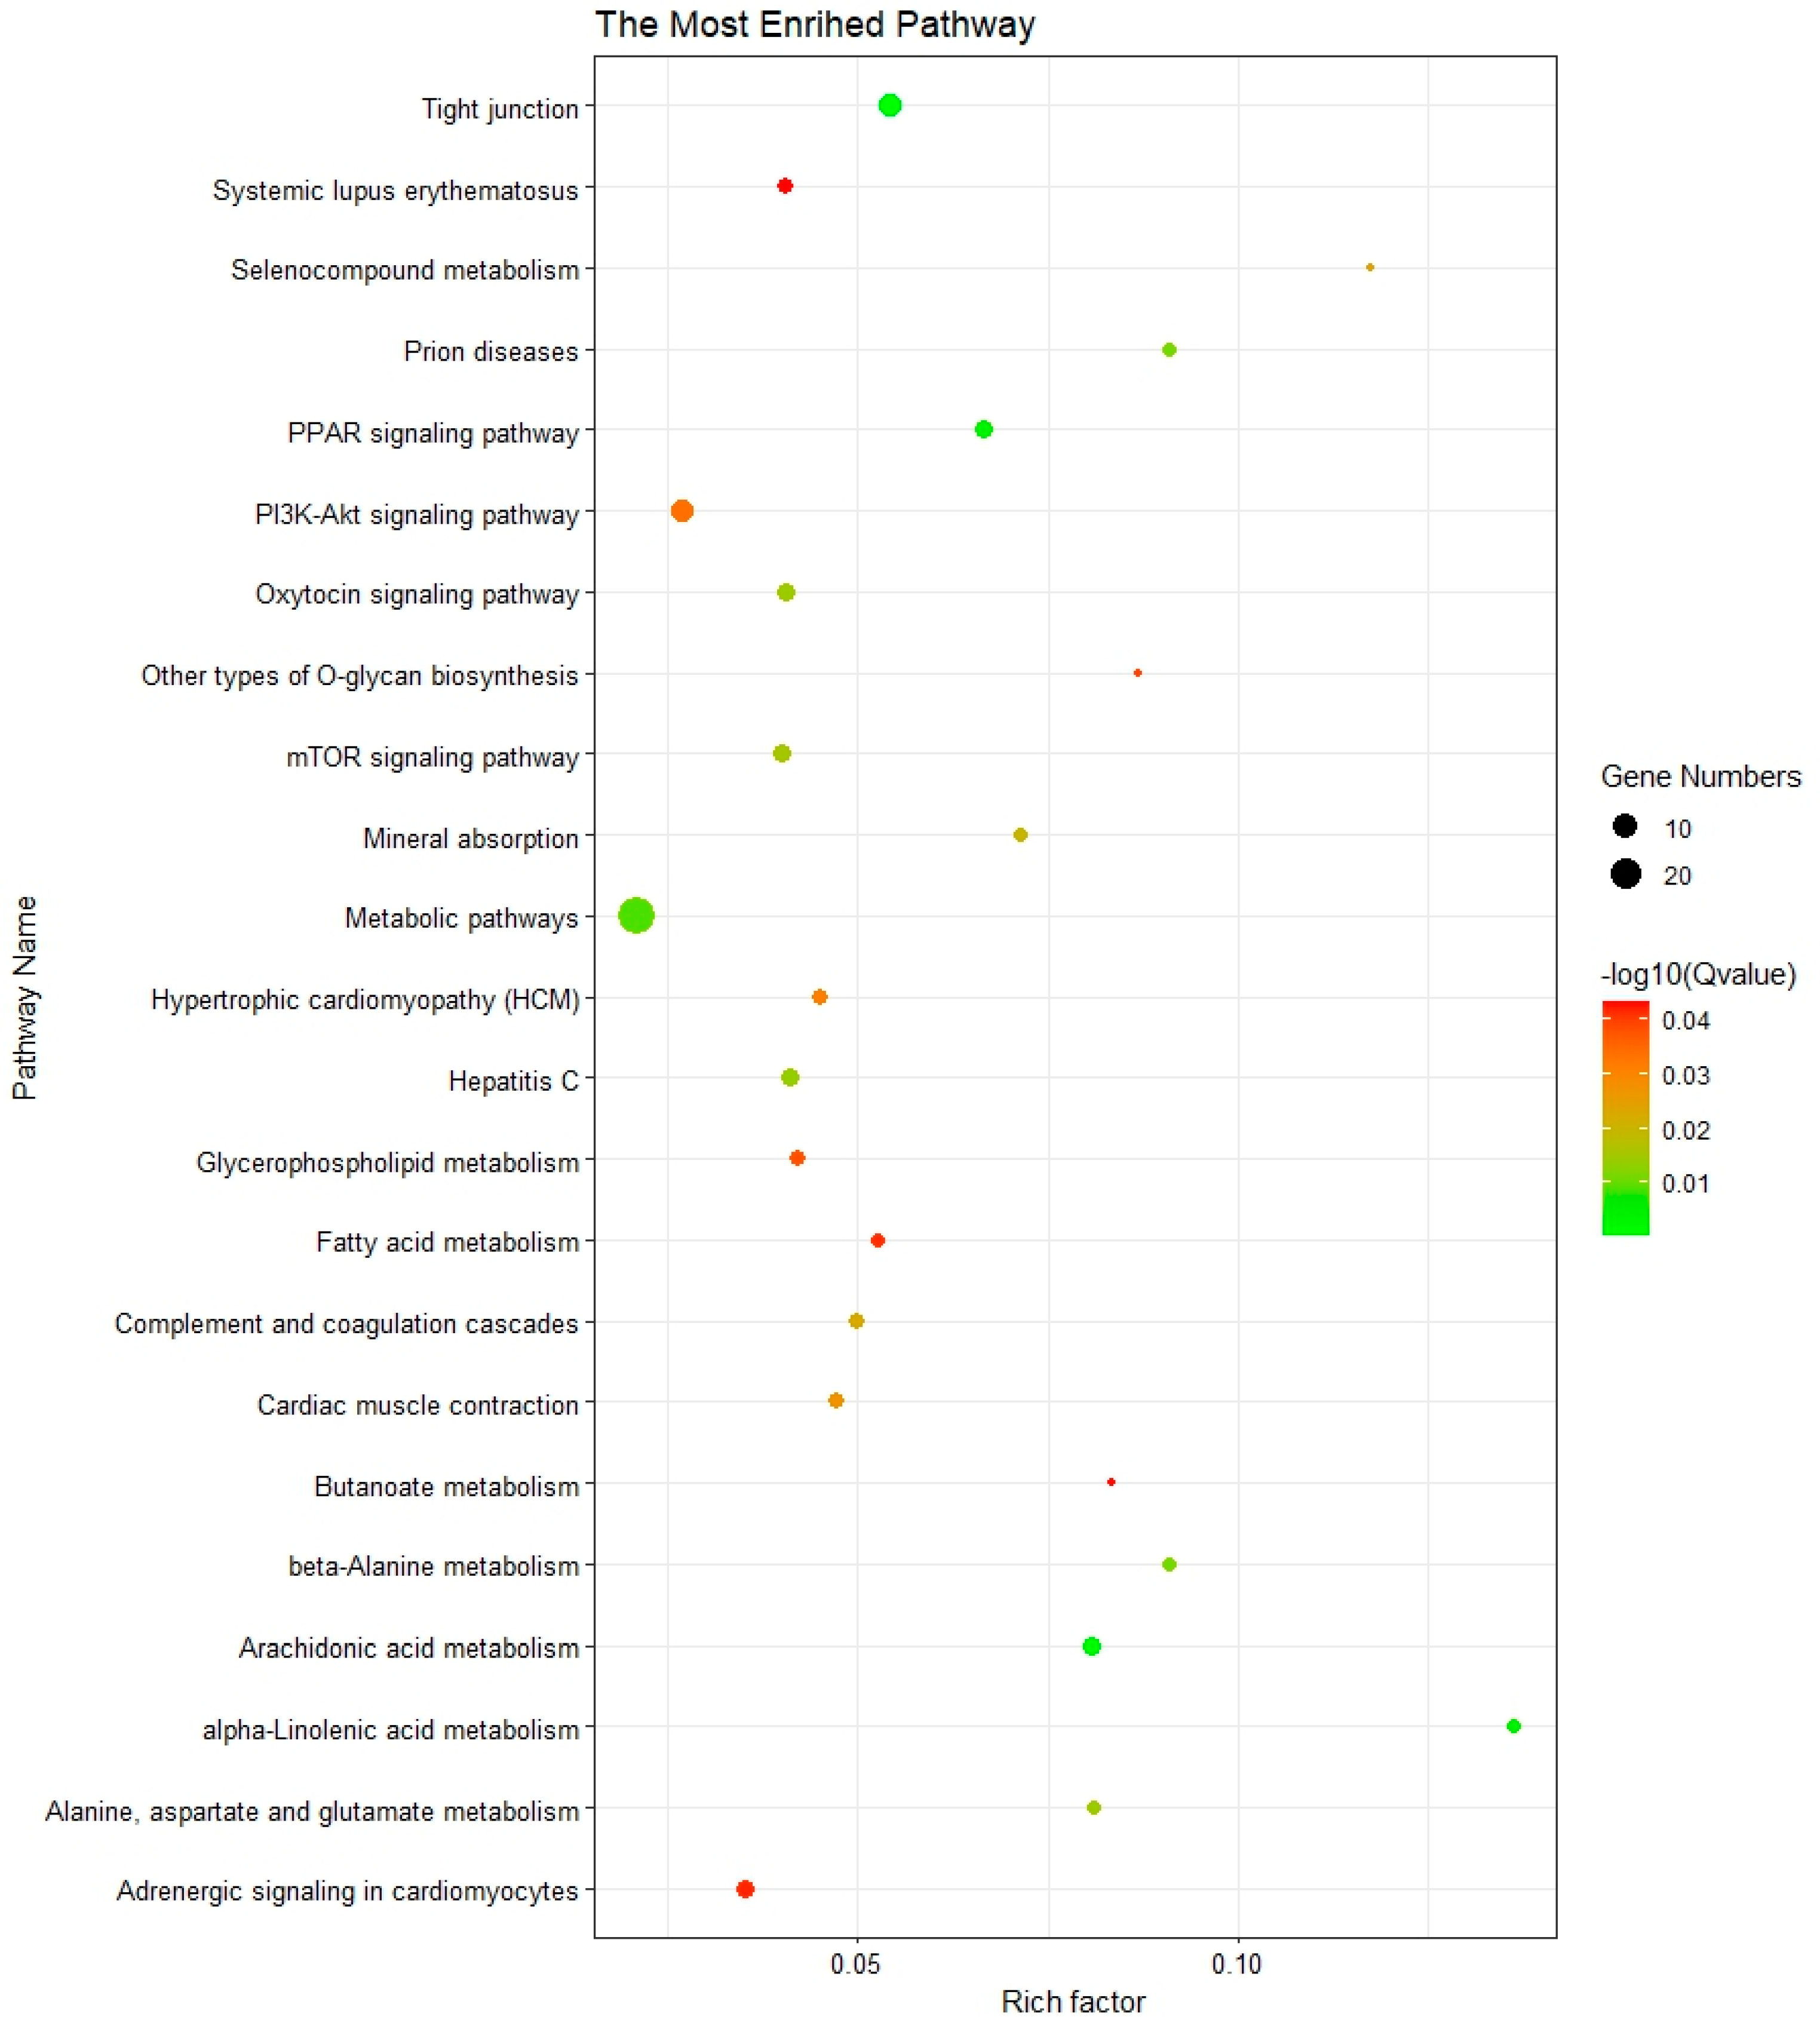
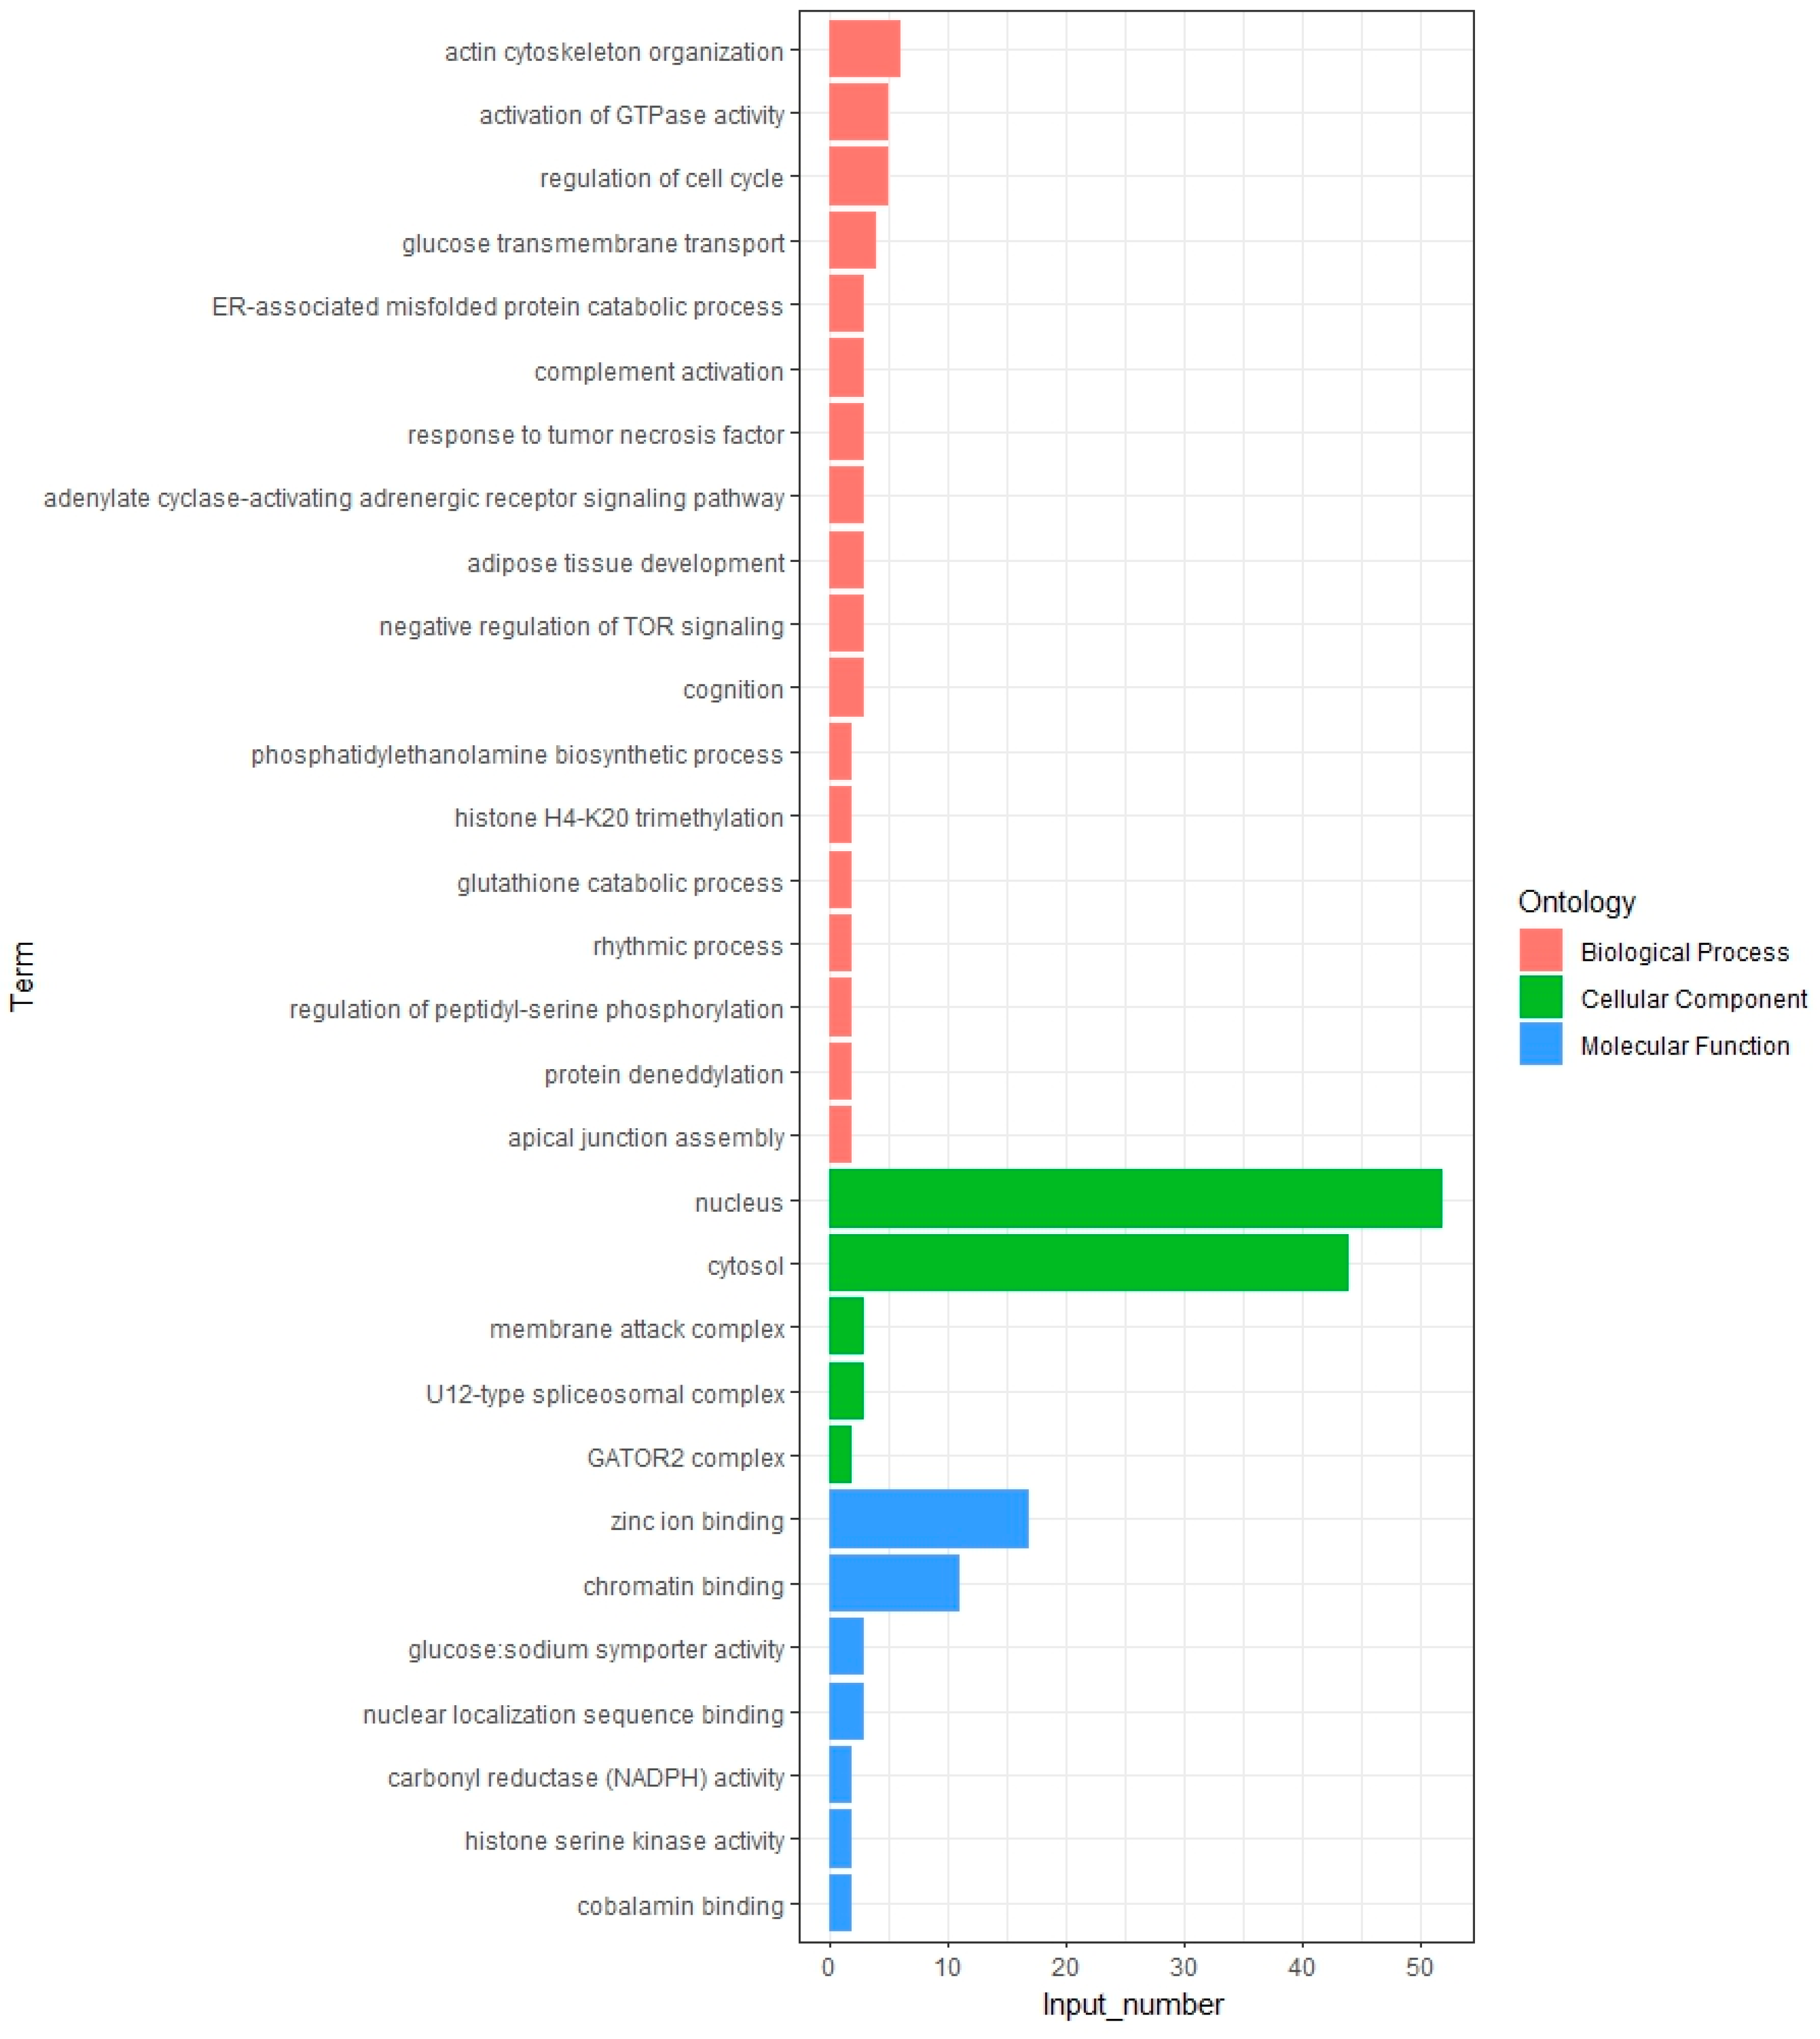
2.5. Enrichment Analysis

To provide insight into the functional enrichment of genes, Gene Ontology (GO) and Kyoto Encyclopedia of Genes and Genomes (KEGG) pathway enrichment analysis of selected genes were performed using the KOBAS 3.0 software [19]. Fisher’s exact test was employed to determine the significance of the enriched terms and pathways [20], with p-value less than 0.05 deemed significant for enrichment analysis [21].

3. Results

3.1. Quality and Statistics of the Sequencing Data

The MGISEQ-2000 platform yielded 625.39 GB of raw sequencing data from 19 Licha black pigs, with each sample generating 30.55~36.39 GB of raw data. Quality screening yielded 616.94 GB of clean data. The average effective sequencing rate was 98.65%, with an average Q30 of 90.34%. Clean reads were mapped to the pig reference genome using the BWA 0.7.17 software, and the average mapping rate of the clean data was 99.09%. The average effective depth of the reference genome coverage was 12.58-fold, ranging from 11.33-fold in the MH-B4 sample to 13.95-fold in the MH-R12 sample. These findings showed that all sequence data generated in this study were suitable for subsequent analysis (Table S1).

3.2. Selective Signal Analysis

We applied several criteria to filter the sequence data; 19 individuals and 19,436,395 SNPs were retained for selective signal analysis. Through the analysis of the FST value (top 1%), a total of 2265 selection signal regions were distributed on the 17 autosomes of the pig genome (Figure 1), and these regions were listed in Table S2. In addition, the statistics of selection signal regions on the pig autosomes are shown in Table 1. Of these, SSC1 contained the greatest number of selection signal regions (380), while SSC3 had the least number of selection signal regions (4). The most significant region was located in the 199.28–199.38 MB of SSC13. Furthermore, 527 genes overlapping with selection signal regions were selected to perform enrichment analysis (Table S3), and Table 2 listed the top 20 selection signal regions that contained the overlapping genes.

3.3. Functional Enrichment Analysis

GO analysis showed that these genes were significantly enriched in 130 GO terms, including 78 GO terms in biological processes, 28 GO terms in cellular components, and 24 GO terms in molecular function (Table S4). The top 30 GO terms are outlined in Figure 2. These GO terms were primarily related to biological processes, including regulation of cell cycle, glucose transmembrane transport, adipose tissue development, regulation of microtubule cytoskeleton organization, positive regulation of MAPK cascade, and negative regulation of inflammatory response. We particularly focused on the terms highly likely related to bone development, including bone morphogenesis and Wnt protein binding, with LRP5, SP5, and TRABD2B genes implicated in these processes.
KEGG enrichment analysis revealed 25 significantly enriched pathways; further investigation of these pathways could reveal their biological relevance and potential significance (Figure 3, Table S5). These pathways were implicated in various regulatory pathways, including the PPAR signaling pathway, α-linolenic acid metabolism, glycerophospholipid metabolism, arachidonic acid metabolism, oxytocin signaling pathway, mTOR signaling pathway, and metabolic pathways. The involvement of these pathways suggests a complex interplay between lipid metabolism, cellular growth, and energy regulation.

3.4. Comparison of Selective Signal Regions and QTL Database

Compared with the QTL database in pigs, these selective signal regions harbored in or partially overlapping with 1073 QTL (Table S6), related to traits such as average backfat thickness, intramuscular fat content, corpus luteum number, teat number, body weight, bone mineral content, glucose level, white blood cell number, and front feet conformation. The presence of these regions highlights their potential as genetic markers in selective breeding programs. In this study, we focused on QTL associated with bone development and vertebra number, and 13 QTL, including bone mineral content, thoracic vertebra number, lumbar vertebra number, cervical vertebra length, cannon bone circumference, and spinal curvature, were identified (Table 3). Moreover, 68 genes overlapping with selection signal regions were also located within or close to these QTL (Table 3), with LRP8, DEF6, and SCUBE3 genes playing critical roles in regulating osteoblast differentiation and bone formation.

4. Discussion

The Licha black pig is an important local pig breed in China, with qualities such as feed efficiency, disease resistance, and high fertility rate. In addition, the Licha black pig has one more NTV than other local pig breeds [22]. However, the genetic basis of the NTV in Licha black pig is yet unknown, which may limit the full exploitation of their genetic potential. In the present study, we employed FST tests to detect selection signal regions in the genome of Licha black pigs between individuals with 15 NTV and those with 16 NTV, which will help us to identify genes related to vertebrae development and improve our understanding of the genetic mechanisms of NTV trait in pig breeding.
A total of 527 genes overlapping with selection signal regions were subjected to functional enrichment analysis in the present investigation; we focused more on functional genes associated with somite formation and bone development. According to the results of functional enrichment analysis, LRP5, SP5, and TRABD2B genes were discovered to be involved in biological processes such as bone morphogenesis and Wnt protein binding; understanding their roles can provide insights into the molecular mechanisms of bone formation. The LRP5 gene on SSC2 potentially plays a pivotal role in the processes of somite formation and bone development via the Wnt signaling pathway. This pathway is instrumental in the regulation of cell fate and differentiation during embryonic development, particularly in the formation of the axial skeleton. LRP5 functional loss mutations can lead to a low bone mass phenotype, whereas LRP5 functional gain mutations result in a dominant high bone mass phenotype [23]. Meanwhile, osteocyte-secreted sclerostin can serve as an endogenous Wnt signaling inhibitor by blocking the interaction of the Wnt ligand and LRP5, regulating bone mass and strength [24]. The SP5 gene, located on SSC15, encodes a member of the SP family of Zinc-finger DNA binding proteins, which has been described as a Wnt/β-catenin target gene capable of acting upstream or within bone morphogenesis [25]. The role of the SP5 gene in bone morphogenesis is multifaceted. It can control the balance between bone formation and resorption, which is essential for maintaining skeletal integrity. Huggin et al. [26] discovered that the SP5 gene could induce the termination of a transcriptional program initiated by Wnt signaling, and this type of dampening gene expression is crucial for ensuring the completion of developmental processes. As a result, we hypothesize that both LRP5 and SP5 genes potentially may play a role in the regulation of NTV trait in Licha black pigs.
Moreover, we compared the selection signal regions with the pig QTL database, focusing on QTL related to bone development and vertebrae number. Of note, 68 genes overlapping with selection signal regions were found within or close to these QTLs, which aided in precise positioning and narrowing of the target area. Finally, three genes, LRP8, DEF6, and SCUBE3, were revealed as functional genes related to the NTV trait. The LRP8 gene is located on SSC6, close to the QTL associated with thoracic vertebra number, and exerts a similar function to the LPR5 gene, primarily playing a role in the formation and development of bones. Zhang et al. [27] discovered that LRP8 could function as a positive regulator of the Wnt signaling pathway, promoting Wnt-induced osteoblast differentiation; this finding underscores the importance of LRP8 in maintaining normal skeletal development. Moreover, LRP8 knockout mice induce a defect in bone formation. Both DEF6 and SCUBE3 genes, located on SSC7, overlap with the QTL of cervical vertebra length. The DEF6 gene, also known as IBP or SLAT, is first identified as an activator of Rho GTPases with distinct molecular structures [28]. Pei et al. [29] were the first to discover the association of DEF6 with bone mineral density at different bone sites. Deng et al. [30] later investigated the role of DEF6 in osteoblast differentiation and bone formation, and their results indicated that DEF6 inhibited osteoblast differentiation and mineralization both in vitro and in vivo, and DEF6 knockout mice displayed an osteoporotic phenotype with increased osteoclast formation. The SCUBE3 gene encodes a member of the signal peptide family, which can function as co-receptors for various growth factors [31]. Bone morphogenetic protein (BMP), a growth factor, plays a critical role in bone formation and cartilage development. SCUBE3 can modulate the BMP signaling pathway, enhancing the response and ensuring proper cellular differentiation and tissue formation. SCUBE3 can also function as a BMP co-receptor, and its aberrant function of SCUBE3 in mice impairs BMP-mediated chondrogenesis and ossification [32]. The regulation of SCUBE3 is essential to prevent skeletal abnormalities and maintain the balance of bone and cartilage formation.
In addition, previous studies showed that the 7.5–9.5 days period of mouse gestation is a critical stage for the development of somite [8,33]. Therefore, based on the transcriptomic data of three mouse embryonic development at 9.5 days in a public database (https://figshare.com/s/496d0d17ad585717080c, accessed on 1 January 2023), we obtained the expression levels of the genes, expressed as the number of fragments per kilobase of exon per million mapped fragments (FPKM), and found that LRP5, SP5, LRP8, DEF6 and SCUBE genes can be expressed during the critical stage of mouse somite development (Figure 4). Among them, the expression of the SCUBE gene was the highest, while the expression of the DEF6 gene was the lowest. We further inferred that LRP5, SP5, LRP8, DEF6, and SCUBE genes are potential candidate genes associated with NTV traits in Licha black pigs.

5. Conclusions

This work discovered 2265 selective signal regions in the genome of the Licha black pig across distinct NTV. 5 functional genes associated with osteoblast differentiation and bone formation, namely, LRP5, SP5, LRP8, DF, and SCUBE3, were identified as key NTV candidates. Our findings provide new insights into the genetic basis of the NTV trait in Licha black pigs.

Supplementary Materials

The following supporting information can be downloaded at https://www.mdpi.com/article/10.3390/genes15040477/s1, Table S1. Summary of sequencing and mapping statistics; Table S2. Information of identified selection signal regions; Table S3. Genes overlapping with selection signal regions; Table S4. Gene ontology (GO) analysis of genes overlapping with selection signal regions (p-value < 0.05); Table S5. Pathway analysis of genes overlapping with selection signal regions (p-value < 0.05); Table S6. QTL included in or partially overlapped with selection signal regions.

Author Contributions

The individual contributions are shown as follows: Conceptualization, Y.W. and G.Y.; methodology, M.W. and Y.W.; formal analysis, M.W. and X.H.; investigation, Y.W., M.W. and R.D.; resources, H.L. and G.Y.; data curation, Y.W. and M.W.; writing—original draft preparation, M.W. and Y.W.; writing—review and editing, Y.W., H.L. and G.Y.; visualization, Y.W. and X.H.; supervision, R.D. and G.Y.; project administration, G.Y.; funding acquisition, Y.W. and G.Y. All authors have read and agreed to the published version of the manuscript.

Funding

This work was financially supported by the Shandong Provincial Natural Science Foundation (Grant No. ZR2023QC059), Agriculture Well Breeds Engineering Major Projects of Shandong Province (Grant No. 2019LZGC019), Agriculture Well Breeds Engineering Major Projects of Shandong Province (Grant No. 2020LZGC012), Key R&D Program of Shandong Province (Grant No. 2022LZGC003), Qingdao science and technology benefit the people demonstration project (Grant No. 23-1-3-3-zyyd-nsh).

Institutional Review Board Statement

Our animal experiments were approved by the Animal Care and Use of Qingdao Agricultural University (approval No. DEC2017-018). All the animals were fed and handled according to the regulations and guidelines established by this committee, and all efforts were made to minimize suffering.

Informed Consent Statement

Informed consent was obtained from all subjects involved in the study.

Data Availability Statement

Our resequencing data generated in this study have already been uploaded to the NCBI BioProject (https://www.ncbi.nlm.nih.gov/, accessed on 1 January 2023). The accession number is PRJNA 1009598, and a total of 19 raw sequencing data of Licha black pigs were contained in this dataset.

Acknowledgments

We thank colleagues from the Qingdao Agricultural University and the Bureau of Agriculture and Rural Affairs of Jiaozhou for their technical support and helpful comments on this article. We are also particularly grateful to the staff who took the X-ray pictures and collected ear tissue samples.

Conflicts of Interest

The authors declare no conflicts of interest.

References

  1. Borchers, N.; Reinsch, N.; Kalm, E. The number of ribs and vertebrae in a Piétrain cross: Variation, heritability and effects on performance traits. J. Anim. Breed. Genet. 2004, 121, 392–403. [Google Scholar] [CrossRef]
  2. King, J.W.B.; Roberts, R.C. Carcass length in the bacon pig; its association with vertebrae numbers and prediction from radiographs of the young pig. Anim. Prod. 1960, 2, 59–65. [Google Scholar] [CrossRef]
  3. Wang, Y.; Dong, R.; Li, X.; Cui, C.; Yu, G. Analysis of the genetic diversity and family structure of the Licha black pig population on Jiaodong Peninsula, Shandong province, China. Animals 2022, 12, 1045. [Google Scholar] [CrossRef] [PubMed]
  4. Yang, H. Livestock development in China: Animal production, consumption and genetic resources. J. Anim. Breed. Genet. 2013, 130, 249–251. [Google Scholar] [CrossRef] [PubMed]
  5. Yang, G.; Ren, J.; Zhang, Z.; Huang, L. Genetic evidence for the introgression of Western NR6A1 haplotype into Chinese Licha breed associated with increased vertebral number. Anim. Genet. 2009, 40, 247–250. [Google Scholar] [CrossRef]
  6. van Son, M.; Lopes, M.S.; Martell, H.J.; Derks, M.F.L.; Gangsei, L.E.; Kongsro, J.; Wass, M.N.; Grindflek, E.H.; Harlizius, B. A QTL for number of teats shows breed specific effects on number of vertebrae in pigs: Bridging the gap between molecular and quantitative genetics. Front. Genet. 2019, 10, 272. [Google Scholar] [CrossRef] [PubMed]
  7. Yang, J.; Huang, L.; Yang, M.; Fan, Y.; Li, L.; Fang, S.; Deng, W.; Cui, L.; Zhang, Z.; Ai, H.; et al. Possible introgression of the VRTN mutation increasing vertebral number, carcass length and teat number from Chinese pigs into European pigs. Sci. Rep. 2016, 6, 19240. [Google Scholar] [CrossRef] [PubMed]
  8. Niu, N.; Liu, Q.; Hou, X.; Liu, X.; Wang, L.; Zhao, F.; Gao, H.; Shi, L.; Wang, L.; Zhang, L. Genome-wide association study revealed ABCD4 on SSC7 and GREB1L and MIB1 on SSC6 as crucial candidate genes for rib number in Beijing Black pigs. Anim. Genet. 2022, 53, 690–695. [Google Scholar] [CrossRef] [PubMed]
  9. Liu, Q.; Yue, J.; Niu, N.; Liu, X.; Yan, H.; Zhao, F.; Hou, X.; Gao, H.; Shi, L.; Wang, L.; et al. Genome-wide association analysis identified BMPR1A as a novel candidate gene affecting the number of thoracic vertebrae in a Large White x Minzhu intercross pig population. Animals 2020, 10, 2186. [Google Scholar] [CrossRef]
  10. Yoshioka-Kobayashi, K.; Matsumiya, M.; Niino, Y.; Isomura, A.; Kori, H.; Miyawaki, A.; Kageyama, R. Coupling delay controls synchronized oscillation in the segmentation clock. Nature 2020, 580, 119–123. [Google Scholar] [CrossRef]
  11. Wang, K.; Hu, H.; Tian, Y.; Li, J.; Scheben, A.; Zhang, C.; Li, Y.; Wu, J.; Yang, L.; Fan, X.; et al. The Chicken Pan-Genome Reveals Gene Content Variation and a Promoter Region Deletion in IGF2BP1 Affecting Body Size. Mol. Biol. Evol. 2021, 38, 5066–5081. [Google Scholar] [CrossRef] [PubMed]
  12. Dequeant, M.L.; Pourquie, O. Segmental patterning of the vertebrate embryonic axis. Nat. Rev. Genet. 2008, 9, 370–382. [Google Scholar] [CrossRef] [PubMed]
  13. Patel, R.K.; Jain, M. NGS QC Toolkit: A toolkit for quality control of next generation sequencing data. PLoS ONE 2012, 7, e30619. [Google Scholar] [CrossRef] [PubMed]
  14. Li, H.; Durbin, R. Fast and accurate short read alignment with Burrows-Wheeler transform. Bioinformatics 2009, 25, 1754–1760. [Google Scholar] [CrossRef] [PubMed]
  15. Li, H.; Handsaker, B.; Wysoker, A.; Fennell, T.; Ruan, J.; Homer, N.; Marth, G.; Abecasis, G.; Durbin, R.; 1000 Genome Project Data Processing Subgroup. The Sequence Alignment/Map format and SAMtools. Bioinformatics 2009, 25, 2078–2079. [Google Scholar] [CrossRef] [PubMed]
  16. McKenna, A.; Hanna, M.; Banks, E.; Sivachenko, A.; Cibulskis, K.; Kernytsky, A.; Garimella, K.; Altshuler, D.; Gabriel, S.; Daly, M.; et al. The Genome Analysis Toolkit: A MapReduce framework for analyzing next-generation DNA sequencing data. Genome Res. 2010, 20, 1297–1303. [Google Scholar] [CrossRef] [PubMed]
  17. Purcell, S.; Neale, B.; Todd-Brown, K.; Thomas, L.; Ferreira, M.A.; Bender, D.; Maller, J.; Sklar, P.; de Bakker, P.I.; Daly, M.J.; et al. PLINK: A tool set for whole-genome association and population-based linkage analyses. Am. J. Hum. Genet. 2007, 81, 559–575. [Google Scholar] [CrossRef]
  18. Danecek, P.; Auton, A.; Abecasis, G.; Albers, C.A.; Banks, E.; DePristo, M.A.; Handsaker, R.E.; Lunter, G.; Marth, G.T.; Sherry, S.T.; et al. The variant call format and VCFtools. Bioinformatics 2011, 27, 2156–2158. [Google Scholar] [CrossRef] [PubMed]
  19. Xie, C.; Mao, X.; Huang, J.; Ding, Y.; Wu, J.; Dong, S.; Kong, L.; Gao, G.; Li, C.Y.; Wei, L. KOBAS 2.0: A web server for annotation and identification of enriched pathways and diseases. Nucleic Acids Res. 2011, 39, W316–W322. [Google Scholar] [CrossRef]
  20. Rivals, I.; Personnaz, L.; Taing, L.; Potier, M.C. Enrichment or depletion of a GO category within a class of genes: Which test? Bioinformatics 2007, 23, 401–407. [Google Scholar] [CrossRef]
  21. Li, C.; Liu, K.; Dai, J.; Li, X.; Liu, X.; Ni, W.; Li, H.; Wang, D.; Qiao, J.; Wang, Y.; et al. Whole-genome resequencing to investigate the determinants of the multi-lumbar vertebrae trait in sheep. Gene 2022, 809, 146020. [Google Scholar] [CrossRef] [PubMed]
  22. Xie, Q.; Zhang, Z.; Chen, Z.; Sun, J.; Li, M.; Wang, Q.; Pan, Y. Integration of Selection Signatures and Protein Interactions Reveals NR6A1, PAPPA2, and PIK3C2B as the Promising Candidate Genes Underlying the Characteristics of Licha Black Pig. Biology 2023, 12, 500. [Google Scholar] [CrossRef] [PubMed]
  23. Balemans, W.; Piters, E.; Cleiren, E.; Ai, M.; Van Wesenbeeck, L.; Warman, M.L.; Van Hul, W. The binding between sclerostin and LRP5 is altered by DKK1 and by high-bone mass LRP5 mutations. Calcified Tissue Int. 2008, 82, 445–453. [Google Scholar] [CrossRef] [PubMed]
  24. Salbach-Hirsch, J.; Samsonov, S.A.; Hintze, V.; Hofbauer, C.; Picke, A.K.; Rauner, M.; Gehrcke, J.P.; Moeller, S.; Schnabelrauch, M.; Scharnweber, D.; et al. Structural and functional insights into sclerostin-glycosaminoglycan interactions in bone. Biomaterials 2015, 67, 335–345. [Google Scholar] [CrossRef] [PubMed]
  25. Ye, S.; Zhang, D.; Cheng, F.; Wilson, D.; Mackay, J.; He, K.; Ban, Q.; Lv, F.; Huang, S.; Liu, D.; et al. Wnt/beta-catenin and LIF-Stat3 signaling pathways converge on Sp5 to promote mouse embryonic stem cell self-renewal. J. Cell Sci. 2016, 129, 269–276. [Google Scholar] [PubMed]
  26. Huggins, I.J.; Bos, T.; Gaylord, O.; Jessen, C.; Lonquich, B.; Puranen, A.; Richter, J.; Rossdam, C.; Brafman, D.; Gaasterland, T.; et al. The WNT target SP5 negatively regulates WNT transcriptional programs in human pluripotent stem cells. Nat. Commun. 2017, 8, 1034. [Google Scholar] [CrossRef]
  27. Zhang, J.; Zhang, X.; Zhang, L.; Zhou, F.; van Dinther, M.; Ten Dijke, P. LRP8 mediates Wnt/beta-catenin signaling and controls osteoblast differentiation. J. Bone Miner. Res. 2012, 27, 2065–2074. [Google Scholar] [CrossRef] [PubMed]
  28. Gupta, S.; Fanzo, J.C.; Hu, C.; Cox, D.; Jang, S.Y.; Lee, A.E.; Greenberg, S.; Pernis, A.B. T cell receptor engagement leads to the recruitment of IBP, a novel guanine nucleotide exchange factor, to the immunological synapse. J. Biol. Chem. 2003, 278, 43541–43549. [Google Scholar] [CrossRef]
  29. Pei, Y.F.; Liu, L.; Liu, T.L.; Yang, X.L.; Zhang, H.; Wei, X.T.; Feng, G.J.; Hai, R.; Ran, S.; Zhang, L. Joint Association Analysis Identified 18 New Loci for Bone Mineral Density. J. Bone Miner. Res. 2019, 34, 1086–1094. [Google Scholar] [CrossRef] [PubMed]
  30. Deng, Z.; Ng, C.; Inoue, K.; Chen, Z.; Xia, Y.; Hu, X.; Greenblatt, M.; Pernis, A.; Zhao, B. Def6 regulates endogenous type-I interferon responses in osteoblasts and suppresses osteogenesis. eLife 2020, 9, e59659. [Google Scholar] [CrossRef]
  31. Tu, C.F.; Tsao, K.C.; Lee, S.J.; Yang, R.B. SCUBE3 (signal peptide-CUB-EGF domain-containing protein 3) modulates fibroblast growth factor signaling during fast muscle development. J. Biol. Chem. 2014, 289, 18928–18942. [Google Scholar] [CrossRef] [PubMed]
  32. Lin, Y.C.; Niceta, M.; Muto, V.; Vona, B.; Pagnamenta, A.T.; Maroofian, R.; Beetz, C.; van Duyvenvoorde, H.; Dentici, M.L.; Lauffer, P.; et al. SCUBE3 loss-of-function causes a recognizable recessive developmental disorder due to defective bone morphogenetic protein signaling. Am. J. Hum. Genet. 2021, 108, 115–133. [Google Scholar] [CrossRef] [PubMed]
  33. Duan, Y.; Zhang, H.; Zhang, Z.; Gao, J.; Yang, J.; Wu, Z.; Fan, Y.; Xing, Y.; Li, L.; Xiao, S.; et al. VRTN is required for the development of thoracic vertebrae in mammals. Int. J. Biol. Sci. 2018, 14, 667–681. [Google Scholar] [CrossRef] [PubMed]
Figure 1. The Manhattan plot of selective signal analysis for the NTV. The FST distribution map was drawn along pig chromosomes from 1 to 18 (different chromosomes were separated by color). The red dashed line indicated the significance threshold, and the FST value was 0.18.
Genes 15 00477 g001
Figure 2. The top 30 enriched GO terms of the genes overlap with selection signal regions. The Y axis represents different GO terms. The X-axis represents the number of genes enriched in the GO term.
Genes 15 00477 g002
Figure 3. The significantly enriched KEGG pathways of the genes overlap with selection signal regions. The Y axis represents the function of enriched pathways. The X-axis represents the enrichment factor. The size of the dot indicates the number of genes enriched in the pathway, and the color corresponds to the different p-value ranges.
Genes 15 00477 g003
Figure 4. The FPKM of LRP5, SP5, LRP8, DEF6, and SCUBE genes in mice. The Y axis represents the value of FPKM. The X-axis represents the different gene names.
Genes 15 00477 g004
Table 1. The statistic of selection signal regions on the pig autosomes.
SSCSelection Signal Region NumberLength (Mb) 1Autosome Coverage (%) 2Gene Number 3
13803813.85 86
2110117.24 32
340.40.3 3
4130139.93 19
5747.47.08 20
6989.85.74 24
74043.28 14
819219.213.82 78
9252.51.79 12
1017117.124.65 15
12151.52.44 7
133403416.32 52
1434234.224.13 111
15949.46.69 24
1617117.121.39 21
17313.14.88 4
18484.88.57 5
Total 42265226.510527
1 Represents the total length of the selection signal region on this autosome, and autosome length is expressed in Mb units; 2 represents the proportion of the total length of the selection signal region on this autosome to the total length of this autosome; 3 represents the number of genes overlapping with the selection signal region on this autosome; 4 represents the total number and length of selection signal regions, and total number of overlapping genes on the 17 autosomes.
Table 2. Top 20 selection signal regions overlapping with genes.
SSCBin Start (bp) 1Bin Eed (bp)FST 2Gene Name 3
13199,280,001199,380,0000.509862LOC106505853, LOC110256478, LOC106505851
13198,830,001198,930,0000.425367LOC106505851
13198,650,001198,750,0000.410486LOC106508030
13198,630,001198,730,0000.401655RUNX1
1350,480,00150,580,0000.377898ARL6IP5, LMOD3, LOC110256266, UBA3
1350,470,00150,570,0000.357269TMF1
585,790,00185,890,0000.351059LOC102160458
13199,770,001199,870,0000.348404CBR3, DOPEY2
1449,210,00149,310,0000.34131BCR
1449,530,00149,630,0000.338639GGT1, GUCD1, LRRC75B, SNRPD3, SNRPD3, UPB1
1449,550,00149,650,0000.335205GGT5
1449,200,00149,300,0000.334916RAB36
1449,580,00149,680,0000.333836LOC100520275, SUSD2
1449,270,00149,370,0000.33244SPECC1L
1449,590,00149,690,0000.324805CABIN1
1350,510,00150,610,0000.323567FRMD4B
138,460,00138,560,0000.322458NKAIN2
13199,680,001199,780,0000.32011LOC110256483
86,040,0016,140,0000.311989LOC110262054, LYAR, OTOP1, TMEM128, ZBTB49, DRD5
86,090,0016,190,0000.311252DRD5
1 Represents the start and end of the selection signal regions, and autosome positions are expressed in bp units; 2 represents the FST value between the groups with different NTV; 3 represents the genes overlapping with the selection signal regions.
Table 3. The partial QTL and genes overlapping with selection signal regions.
SSCQTL NameQTL Start (bp) 1QTL End (bp)Gene Name
2Bone mineral content013,341,832LOC110259708, BEST1, FTH1, RAB3IL1, FADS3, INCENP, C2H11orf24, CHKA, KMT5B, LOC102162815, LOC100738812, LRP5, LOC110259247, FADS2, LOC106509334
2Lumbar vertebra number21,047,891146,185,081LOC106509513, LOC102164448, PAM, YTHDC2, SLCO4C1, LOC110255325, LOC102158973, LOC110259457, PPIC, SNX24, C2H11orf91, CD59, FBXO3, KIAA1549L, LOC106509385
6Thoracic vertebra number158,835,021158,835,025LRP8 2
7Cervical vertebra length28,939,91138,532,223DEF6, TCP11, ZNF76, SCUBE3, PPARD
7Cannon bone circumference31,235,54731,235,551PPARD
7Number of ribs68,061,95277,142,053LOC100736765, MYH7, NGDN, ZFHX2
7Thoracic vertebra number104,557,779104,557,783FOXN3 2
8Spinal curvature6,099,7246,099,728LYAR
10Vertebra number13,546,75069,196,799CELF2, LOC110255590, LOC106505197, USP6NL, LOC110255605, LOC110255591, ARMC3, LOC106505172
12Thoracic vertebra number050,491,372BPTF, C12H17orf58, LOC110256159, KPNA2, TRNAR-CCG, HELZ, CA10
13Vertebra number75,687,809169,726,013CMSS1, FILIP1L, LOC100524713
14Cervical vertebra length62,245,24781,061,212LOC110256649, LOC110256651, PHYHIPL, FAM13C
16Number of ribs28,477,99734,396,617LOC110257315, ARL15, NDUFS4
1 Represents the start and end of the QTL, and autosome positions are expressed in bp units; 2 represents genes located near these QTL.
Disclaimer/Publisher’s Note: The statements, opinions and data contained in all publications are solely those of the individual author(s) and contributor(s) and not of MDPI and/or the editor(s). MDPI and/or the editor(s) disclaim responsibility for any injury to people or property resulting from any ideas, methods, instructions or products referred to in the content.

