
Genome Size Variation in Sesamum indicum L. Germplasm from Niger

 ,
, 
Abstract
1. Introduction
2. Materials and Methods
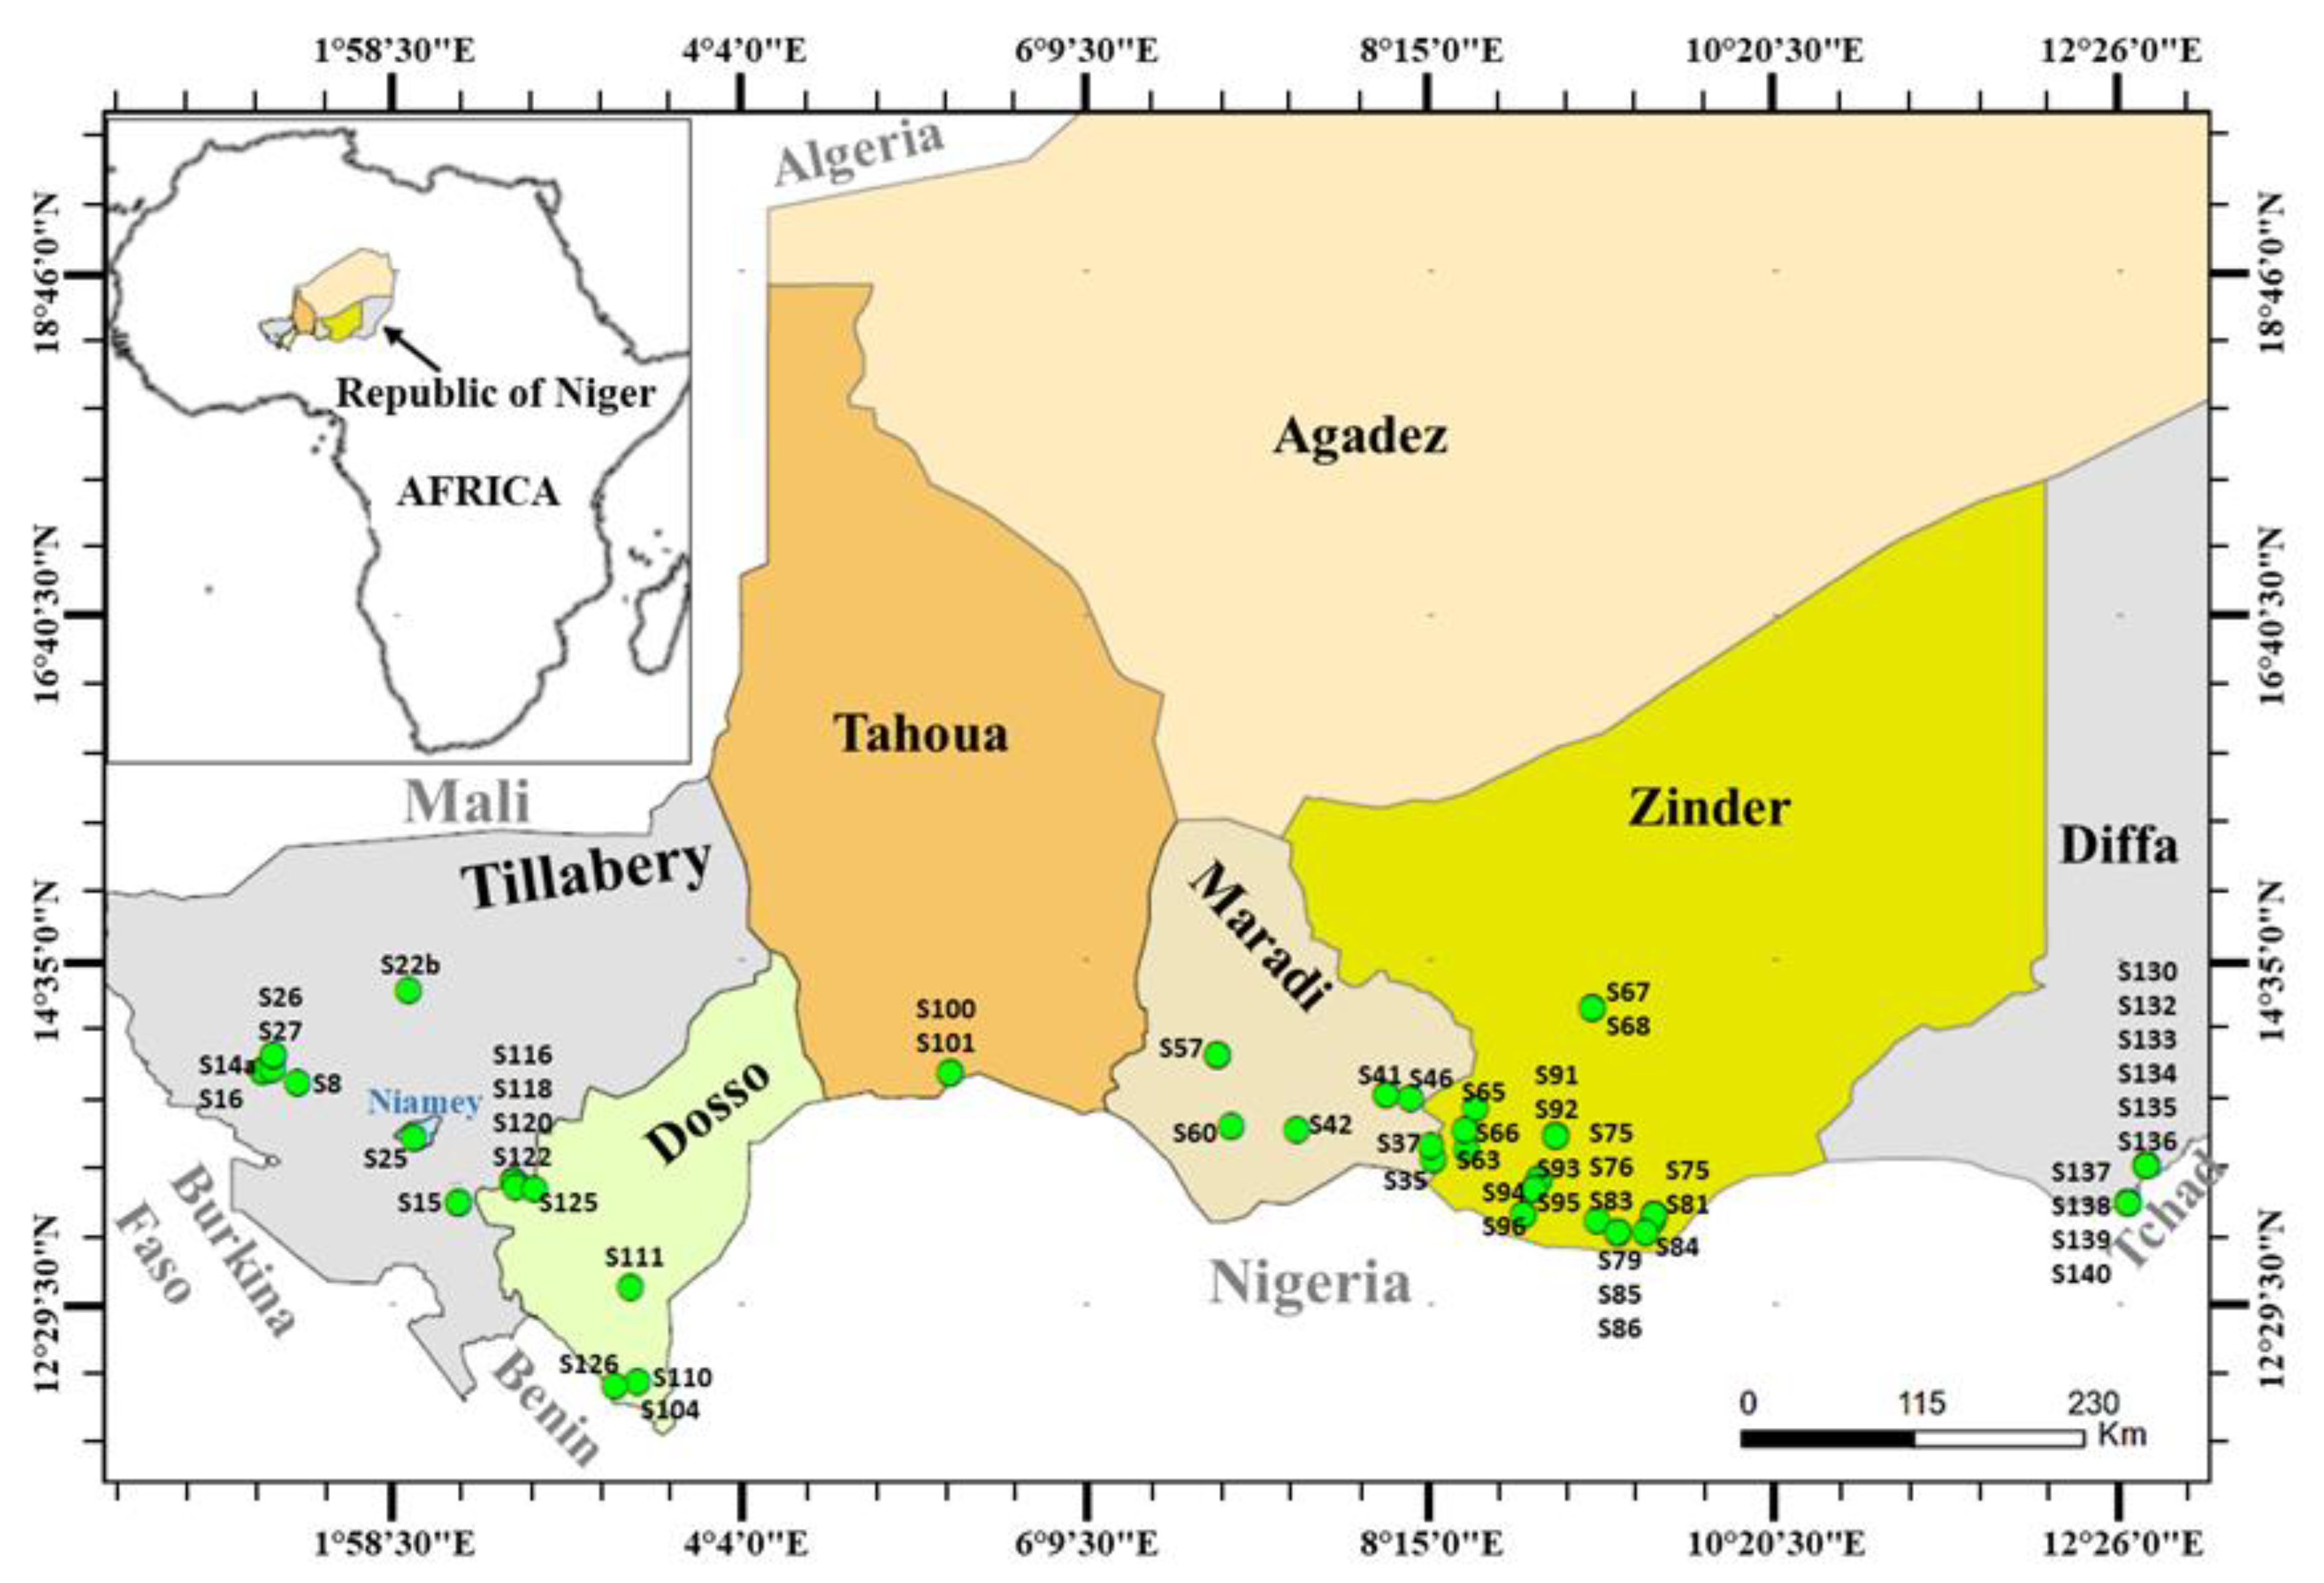
2.1. Plant Materials
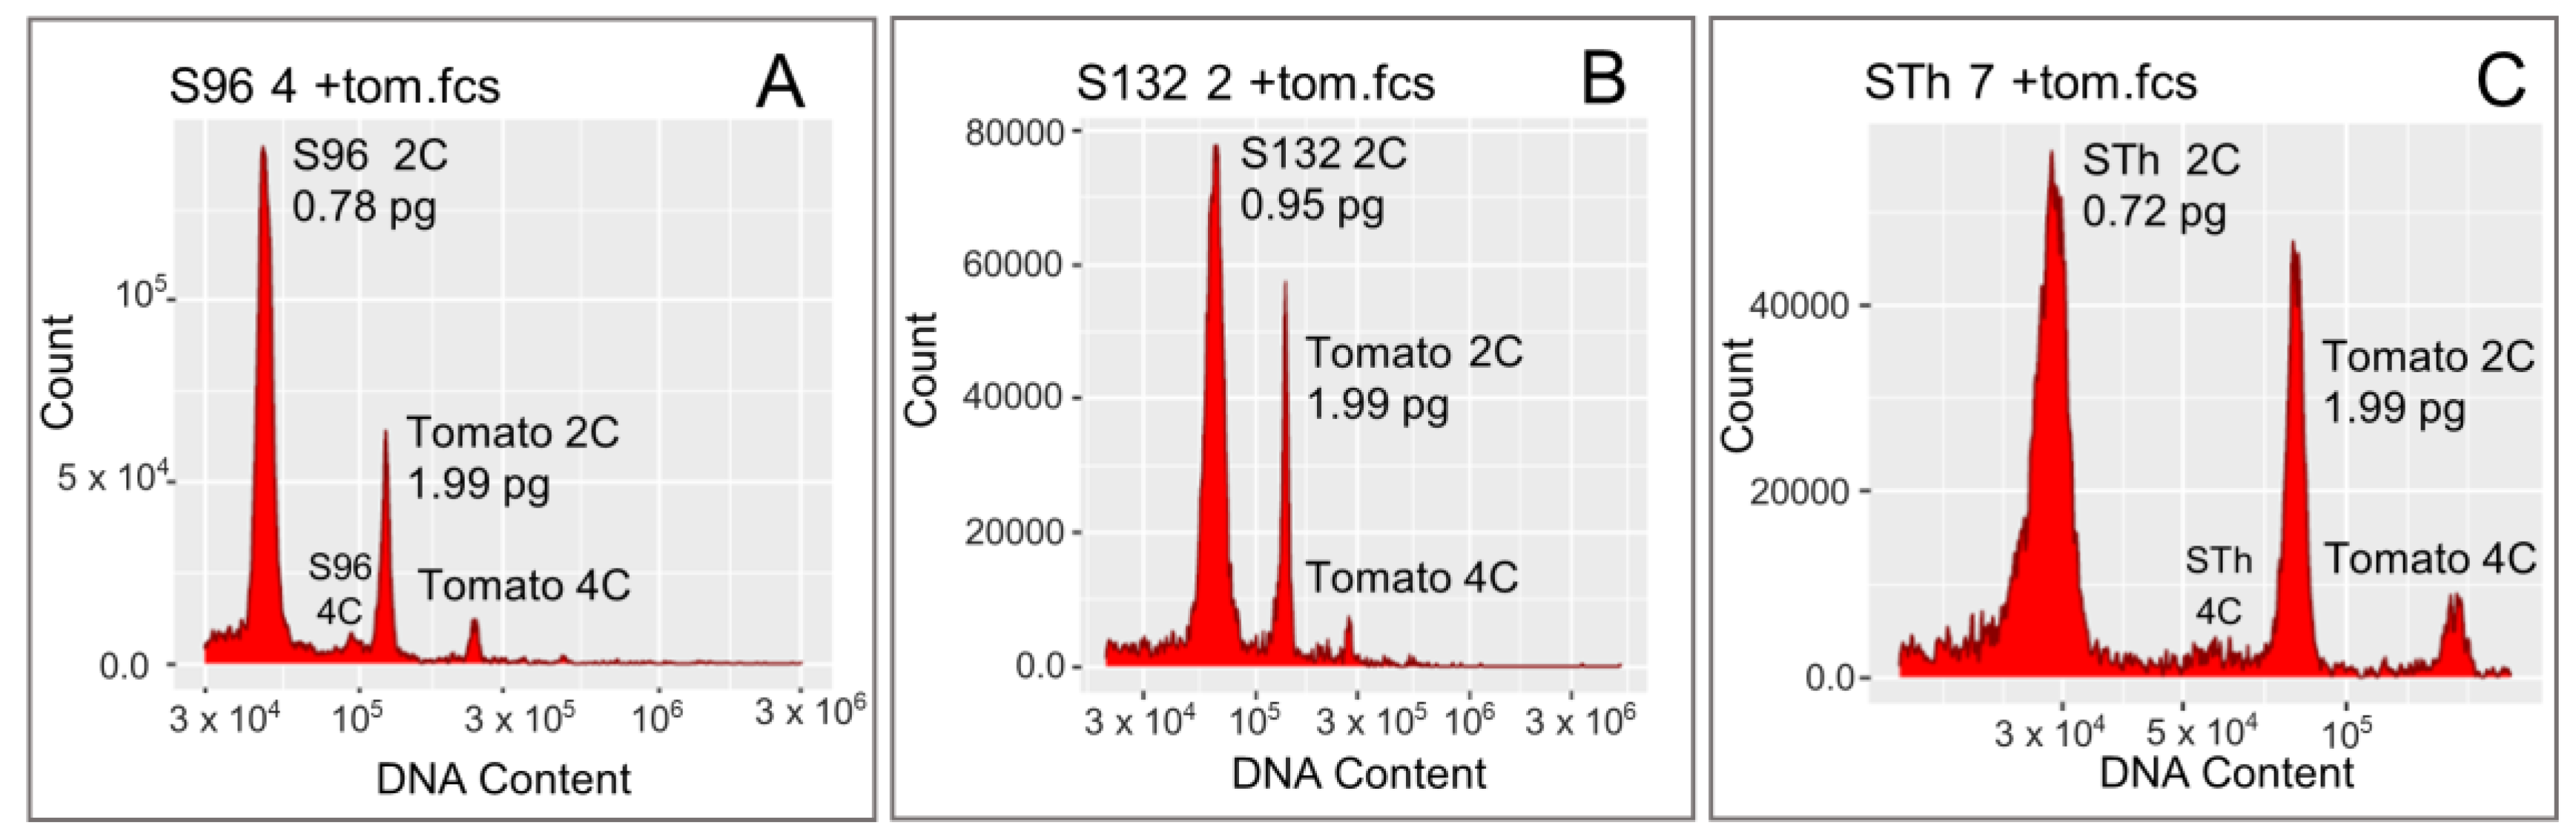
2.2. Genome Size Assessment Using Flow Cytometry
2.3. Statistical Analyses
3. Results
3.1. Genome Size of Nigerien and Tai’s Accessions
3.2. Analysis of the Genome Size Variation among the Nigerien Sesame Accessions
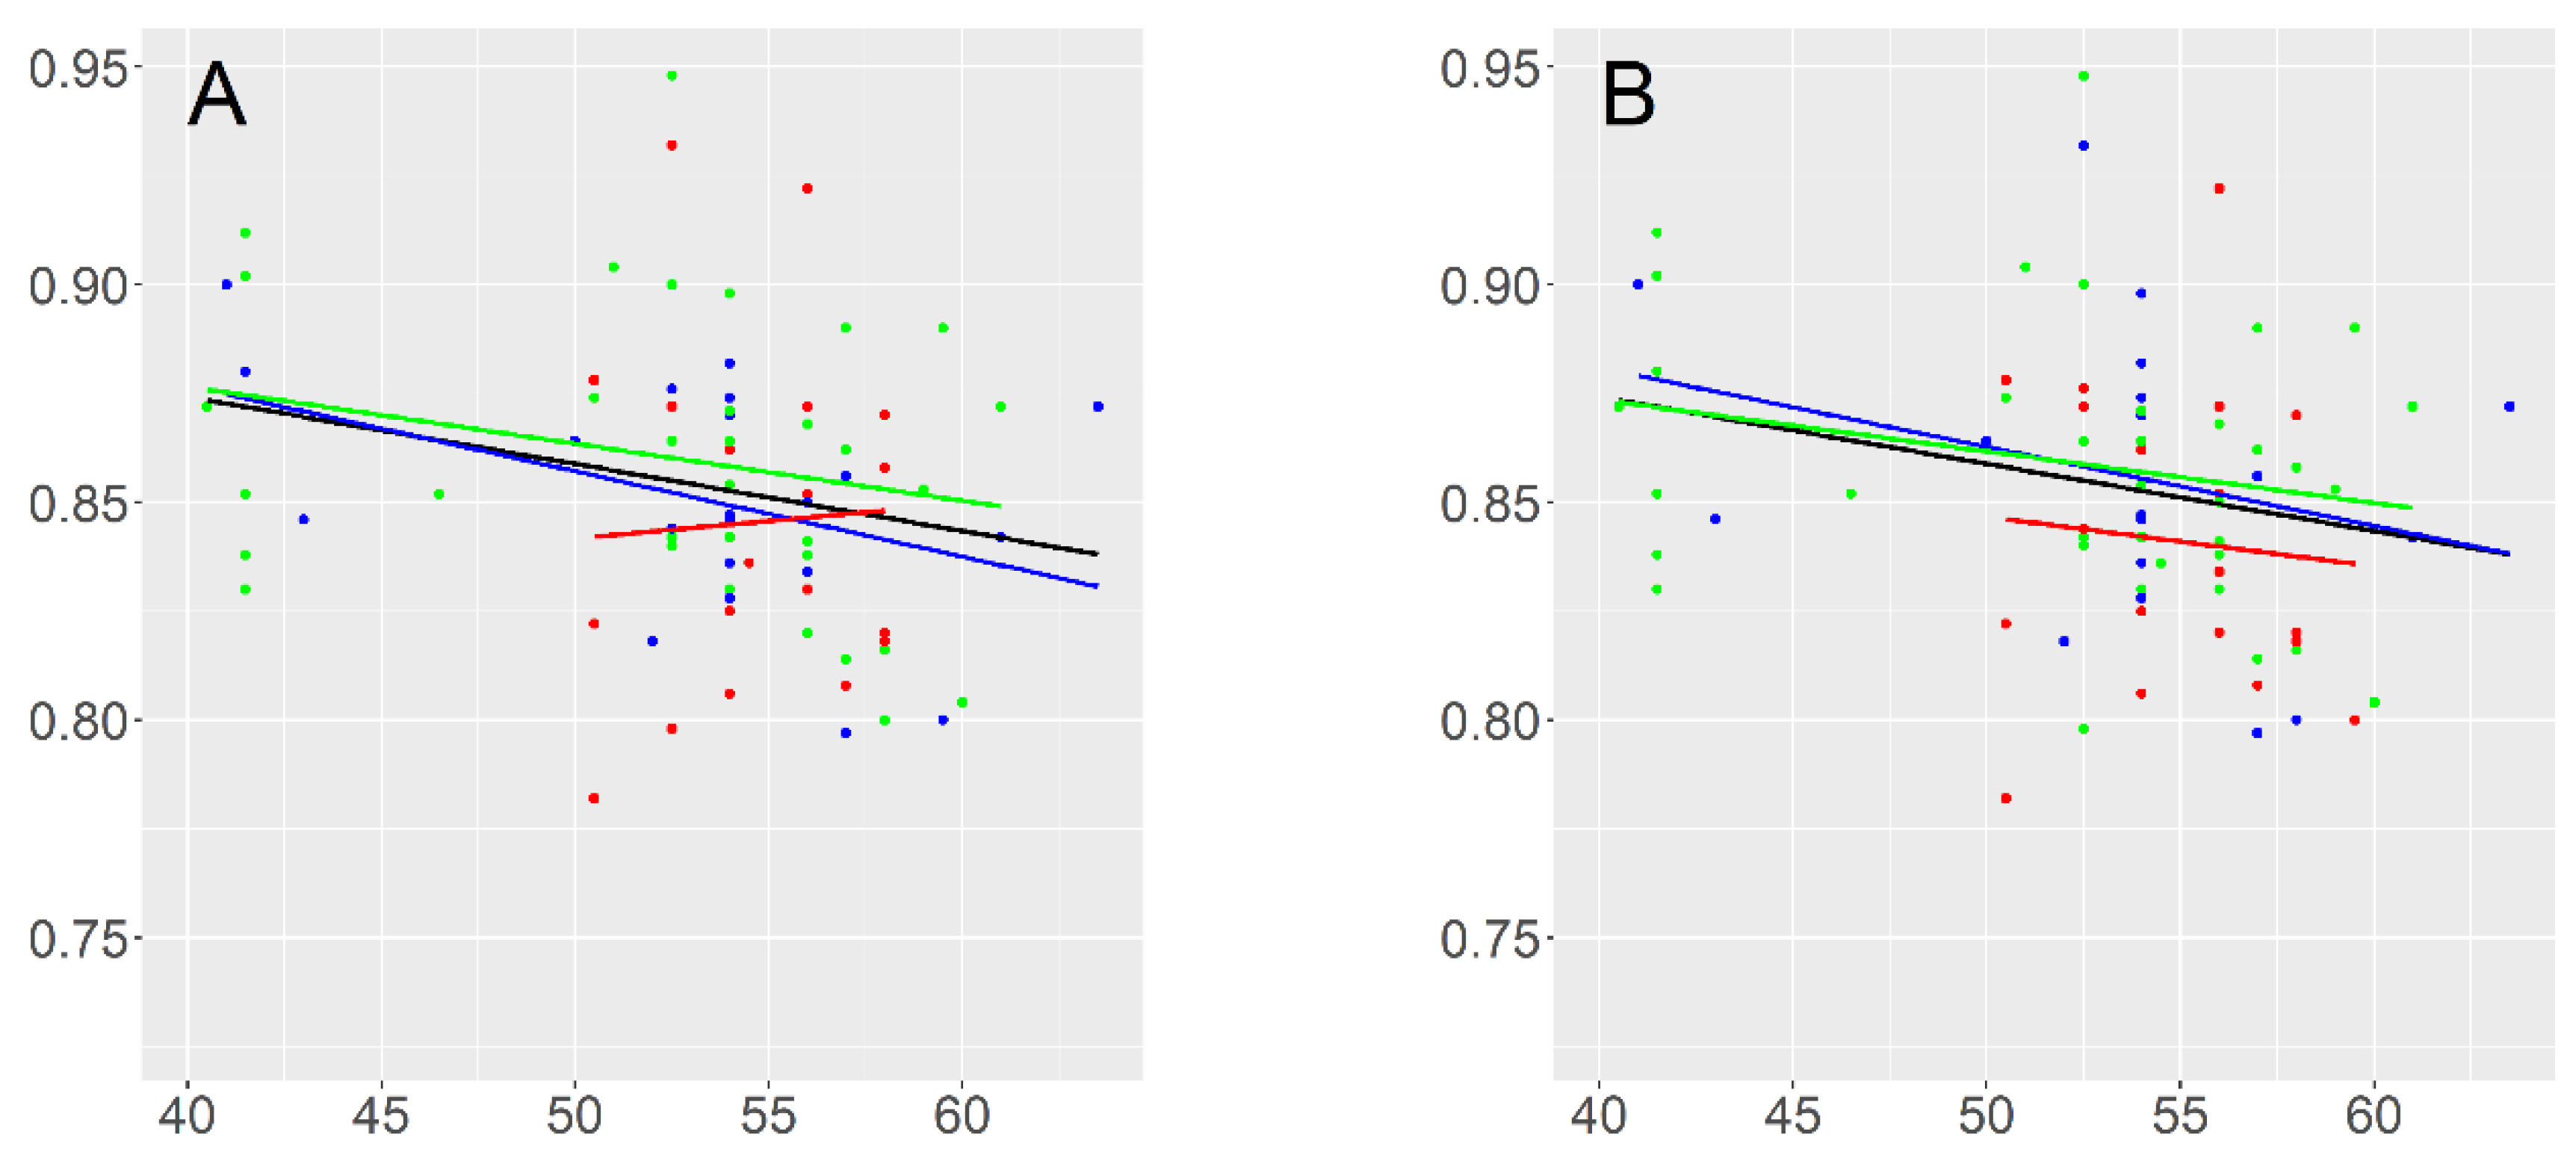
3.3. Correlation between the Genome Size and Flowering Time
4. Discussion
5. Conclusions
Supplementary Materials
Author Contributions
Funding
Institutional Review Board Statement
Informed Consent Statement
Data Availability Statement
Acknowledgments
Conflicts of Interest
References
- Bedigian, D. Systematics and Evolution in Sesamum L. (Pedaliaceae), Part 1: Evidence Regarding the Origin of Sesame and Its Closest Relatives. Webbia 2015, 70, 1–42. [Google Scholar] [CrossRef]
- Yadav, R.; Kalia, S.; Rangan, P.; Pradheep, K.; Rao, G.P.; Kaur, V.; Pandey, R.; Rai, V.; Vasimalla, C.C.; Langyan, S.; et al. Current Research Trends and Prospects for Yield and Quality Improvement in Sesame, an Important Oilseed Crop. Front. Plant Sci. 2022, 13, 863521. [Google Scholar] [CrossRef] [PubMed]
- Bedigian, D.; Harlan, J.R. Evidence for Cultivation of Sesame in the Ancient World. Econ. Bot. 1986, 40, 137–154. [Google Scholar] [CrossRef]
- Dossa, K.; Diouf, D.; Wang, L.; Wei, X.; Zhang, Y.; Niang, M.; Fonceka, D.; Yu, J.; Mmadi, M.A.; Yehouessi, L.W.; et al. The Emerging Oilseed Crop Sesamum Indicum Enters the “Omics” Era. Front. Plant Sci. 2017, 8, 1154. [Google Scholar] [CrossRef] [PubMed]
- Pathak, N.; Rai, A.K.; Kumari, R.; Bhat, K.V. Value Addition in Sesame: A Perspective on Bioactive Components for Enhancing Utility and Profitability. Pharmacogn. Rev. 2014, 8, 147–155. [Google Scholar] [CrossRef] [PubMed]
- Amoo, S.O.; Okorogbona, A.O.M.; Du Plooy, C.P.; Venter, S.L. Sesamum indicum. In Medicinal Spices and Vegetables from Africa; Elsevier: London, UK; Oxford, UK; San Diego, CA, USA; Cambridge, MA, USA, 2017; pp. 549–579. ISBN 978-0-12-809286-6. [Google Scholar]
- Bhunia, R.K.; Kaur, R.; Maiti, M.K. Metabolic Engineering of Fatty Acid Biosynthetic Pathway in Sesame (Sesamum indicum L.): Assembling Tools to Develop Nutritionally Desirable Sesame Seed Oil. Phytochem. Rev. 2016, 15, 799–811. [Google Scholar] [CrossRef]
- Shakeri, E.; Modarres-Sanavy, S.A.M.; Amini Dehaghi, M.; Tabatabaei, S.A.; Moradi-Ghahderijani, M. Improvement of Yield, Yield Components and Oil Quality in Sesame (Sesamum indicum L.) by N-Fixing Bacteria Fertilizers and Urea. Arch. Agron. Soil Sci. 2016, 62, 547–560. [Google Scholar] [CrossRef]
- Wang, M.; Huang, J.; Liu, S.; Liu, X.; Li, R.; Luo, J.; Fu, Z. Improved Assembly and Annotation of the Sesame Genome. DNA Res. 2022, 29, dsac041. [Google Scholar] [CrossRef] [PubMed]
- FAOSTAT Food and Agriculture Organization of the United Nations. 2024. Available online: https://www.fao.org/faostat/fr/#data/qcl (accessed on 19 February 2024).
- Uncu, A.O.; Frary, A.; Karlovsky, P.; Doganlar, S. High-Throughput Single Nucleotide Polymorphism (SNP) Identification and Mapping in the Sesame (Sesamum indicum L.) Genome with Genotyping by Sequencing (GBS) Analysis. Mol. Breed. 2016, 36, 173. [Google Scholar] [CrossRef]
- Uncu, A.Ö.; Gultekin, V.; Allmer, J.; Frary, A.; Doganlar, S. Genomic Simple Sequence Repeat Markers Reveal Patterns of Genetic Relatedness and Diversity in Sesame. Plant Genome 2015, 8, 1–12. [Google Scholar] [CrossRef]
- Wang, L.; Xia, Q.; Zhang, Y.; Zhu, X.; Zhu, X.; Li, D.; Ni, X.; Gao, Y.; Xiang, H.; Wei, X.; et al. Updated Sesame Genome Assembly and Fine Mapping of Plant Height and Seed Coat Color QTLs Using a New High-Density Genetic Map. BMC Genom. 2016, 17, 31. [Google Scholar] [CrossRef]
- Wang, L.; Yu, J.; Li, D.; Zhang, X. Sinbase: An Integrated Database to Study Genomics, Genetics and Comparative Genomics in Sesamum indicum. Plant Cell Physiol. 2015, 56, e2. [Google Scholar] [CrossRef] [PubMed]
- Wang, L.; Yu, S.; Tong, C.; Zhao, Y.; Liu, Y.; Song, C.; Zhang, Y.; Zhang, X.; Wang, Y.; Hua, W.; et al. Genome Sequencing of the High Oil Crop Sesame Provides Insight into Oil Biosynthesis. Genome Biol. 2014, 15, R39. [Google Scholar] [CrossRef] [PubMed]
- Wei, X.; Liu, K.; Zhang, Y.; Feng, Q.; Wang, L.; Zhao, Y.; Li, D.; Zhao, Q.; Zhu, X.; Zhu, X.; et al. Genetic Discovery for Oil Production and Quality in Sesame. Nat. Commun. 2015, 6, 8609. [Google Scholar] [CrossRef]
- Wei, X.; Zhu, X.; Yu, J.; Wang, L.; Zhang, Y.; Li, D.; Zhou, R.; Zhang, X. Identification of Sesame Genomic Variations from Genome Comparison of Landrace and Variety. Front. Plant Sci. 2016, 7, 1169. [Google Scholar] [CrossRef]
- Zhang, H.; Miao, H.; Li, C.; Wei, L.; Duan, Y.; Ma, Q.; Kong, J.; Xu, F.; Chang, S. Ultra-Dense SNP Genetic Map Construction and Identification of SiDt Gene Controlling the Determinate Growth Habit in Sesamum indicum L. Sci. Rep. 2016, 6, 31556. [Google Scholar] [CrossRef]
- Zhang, H.; Miao, H.; Wang, L.; Qu, L.; Liu, H.; Wang, Q.; Yue, M. Genome Sequencing of the Important Oilseed Crop Sesamum indicum L. Genome Biol. 2013, 14, 401. [Google Scholar] [CrossRef] [PubMed]
- Dossa, K.; Wei, X.; Zhang, Y.; Fonceka, D.; Yang, W.; Diouf, D.; Liao, B.; Cissé, N.; Zhang, X. Analysis of Genetic Diversity and Population Structure of Sesame Accessions from Africa and Asia as Major Centers of Its Cultivation. Genes 2016, 7, 14. [Google Scholar] [CrossRef]
- Zangui, H.; Amoukou, A.I.; Boureima, S.; Robert, T.; Takvorian, N. Determination of Genetic Diversity of Nigerien Sesame (Sesamum indicum L.) Using Amplified Fragment Length Polymorphisms Markers. Int. J. Curr. Res. 2020, 12, 13637–13645. [Google Scholar] [CrossRef]
- Zangui, H.; Amoukou, A.I.; Boureima, S.; Amadou, M.H. Agromorphological Characterization of Sesame Accessions (Sesamum indicum L.) Collected in Niger. Int. J. Innov. Appl. Stud. 2020, 29, 902–914. [Google Scholar]
- Zangui, H.; Amoukou, A.I.; Miquel, M.; Sadou, H.; Robert, T.; Takvorian, N. Study of the Fatty Acid Diversity of Sesame (Sesamum indicum L.) Germplasm from Niger by Gas Chromatography (GC). IOSR J. Biotechnol. Biochem. 2019, 5, 31–38. [Google Scholar] [CrossRef]
- Zangui, H. Diversité Agromorphologique, Biochimique et Moléculaire Des Variétés Locales de Sésame (Sesamum indicum L.) Du Niger. Ph.D. Thesis, Université Abdou Moumouni De Niamey, Niamey, Niger, 2020. [Google Scholar]
- Plant DNA C-Values Database|Royal Botanic Gardens, Kew. Available online: https://cvalues.science.kew.org/search/angiosperm (accessed on 28 April 2024).
- Bennett, M.D.; Leitch, I.J. Nuclear DNA Amounts in Angiosperms: Progress, Problems and Prospects. Ann. Bot. 2005, 95, 45–90. [Google Scholar] [CrossRef] [PubMed]
- Swift, H. The Constancy of Desoxyribose Nucleic Acid in Plant Nuclei. Proc. Natl. Acad. Sci. USA 1950, 36, 643–654. [Google Scholar] [CrossRef] [PubMed]
- Siljak-Yakovlev, S.; Lamy, F.; Takvorian, N.; Valentin, N.; Gouesbet, V.; Hennion, F.; Robert, T. Genome Size and Chromosome Number of Ten Plant Species from Kerguelen Islands. Polar Biol. 2020, 43, 1985–1999. [Google Scholar] [CrossRef]
- Siljak-Yakovlev, S.; Pustahija, F.; Šolić, E.M.; Bogunić, F.; Muratović, E.; Bašić, N.; Catrice, O.; Brown, S.C. Towards a Genome Size and Chromosome Number Database of Balkan Flora: C-Values in 343 Taxa with Novel Values for 242. Adv. Sci. Lett. 2010, 3, 190–213. [Google Scholar] [CrossRef]
- Pellicer, J.; Hidalgo, O.; Dodsworth, S.; Leitch, I.J. Genome Size Diversity and Its Impact on the Evolution of Land Plants. Genes 2018, 9, 88. [Google Scholar] [CrossRef] [PubMed]
- Vekemans, X.; Lefèbvre, C.; Coulaud, J.; Blaise, S.; Gruber, W.; Siljak-Yakovlev, S.; Brown, S.C. Variation in Nuclear DNA Content at the Species Level in Armeria Maritima. Hereditas 1996, 124, 237–242. [Google Scholar] [CrossRef]
- Pustahija, F.; Bašic, N.; Siljak-Yakovlev, S. Karyotype Variability in Wild Narcissus poeticus L. Populations from Different Environmental Conditions in the Dinaric Alps. Plants 2024, 13, 208. [Google Scholar] [CrossRef] [PubMed]
- Pustahija, F.; Brown, C.S.; Bogunic, F.; Basic, N.; Muratovic, E.; Ollier, S.; Hidalgo, O.; Bourge, M.; Stevanović, V.; Siljak-Yakovlev, S. Small Genomes Dominate in Plants Growing on Serpentine Soils in West Balkans, an Exhaustive Study of 8 Habitats Covering 308 Taxa. Plant Soil 2013, 373, 427–453. [Google Scholar] [CrossRef]
- Bogunić, F.; Siljak-Yakovlev, S.; Mahmutović-Dizdarević, I.; Hajrudinović-Bogunić, A.; Bourge, M.; Brown, S.C.; Muratović, E. Genome Size, Cytotype Diversity and Reproductive Mode Variation of Cotoneaster integerrimus (Rosaceae) from the Balkans. Plants 2021, 10, 2798. [Google Scholar] [CrossRef]
- Hajrudinović, A.; Siljak-Yakovlev, S.; Brown, S.C.; Pustahija, F.; Bourge, M.; Ballian, D.; Bogunić, F. When Sexual Meets Apomict: Genome Size, Ploidy Level and Reproductive Mode Variation of Sorbus aria s.l. and S. austriaca (Rosaceae) in Bosnia and Herzegovina. Ann. Bot. 2015, 116, 301–312. [Google Scholar] [CrossRef] [PubMed]
- Leitch, I.J.; Leitch, A.R. Genome Size Diversity and Evolution in Land Plants. In Plant Genome Diversity; Greilhuber, J., Dolezel, J., Wendel, J.F., Eds.; Springer: Vienna, Austria, 2013; pp. 307–322. Volume 2, ISBN 978-3-7091-1159-8. [Google Scholar]
- Niketić, M.; Siljak-Yakovlev, S.; Frajman, B.; Lazarević, M.; Stevanović, B.; Tomović, G.; Stevanović, V. Towards Resolving the Systematics of Cerastium Subsection Cerastium (Caryophyllaceae): A Cytogenetic Approach: Cytogenetics of Cerastium Subsection Cerastium. Bot. J. Linn. Soc. 2013, 172, 205–224. [Google Scholar] [CrossRef]
- Bennett, M. Nuclear DNA Amounts in Angiosperms and Their Modern Uses—807 New Estimates. Ann. Bot. 2000, 86, 859–909. [Google Scholar] [CrossRef]
- Bou Dagher-Kharrat, M.; Abdel-Samad, N.; Douaihy, B.; Bourge, M.; Fridlender, A.; Siljak-Yakovlev, S.; Brown, S.C. Nuclear DNA C-Values for Biodiversity Screening: Case of the Lebanese Flora. Plant Biosyst.-Int. J. Deal. Asp. Plant Biol. 2013, 147, 1228–1237. [Google Scholar] [CrossRef]
- Siljak-Yakovlev, S.; Farhat, P.; Valentin, N.; Bareka, P.; Kamari, G. New Estimates of Nuclear DNA Amount for 25 Taxa from Cephalonia Island. Bot. Chron. 2019, 22, 87–108. [Google Scholar]
- Fyad-Lameche, F.-Z.; Iantcheva, A.; Siljak-Yakovlev, S.; Brown, S.C. Chromosome Number, Genome Size, Seed Storage Protein Profile and Competence for Direct Somatic Embryo Formation in Algerian Annual Medicago Species. Plant Cell Tissue Organ Cult. (PCTOC) 2016, 124, 531–540. [Google Scholar] [CrossRef]
- Ngo Ngwe, F.; Siljak-Yakovlev, S. Sex Determination in Dioscorea dumetorum: Evidence of Heteromorphic Sex Chromosomes and Sex-Linked NORs. Plants 2023, 12, 228. [Google Scholar] [CrossRef] [PubMed]
- Srisuwan, S.; Sihachakr, D.; Martín, J.; Vallès, J.; Ressayre, A.; Brown, S.C.; Siljak-Yakovlev, S. Change in Nuclear DNA Content and Pollen Size with Polyploidisation in the Sweet Potato (Ipomoea batatas, Convolvulaceae) Complex. Plant Biol. 2019, 21, 237–247. [Google Scholar] [CrossRef] [PubMed]
- Bourge, M.; Brown, S.C.; Siljak-Yakovlev, S. Flow Cytometry as Tool in Plant Sciences, with Emphasis on Genome Size and Ploidy Level Assessment. Genet. Appl. 2018, 2, 1. [Google Scholar] [CrossRef]
- Pellicer, J.; Leitch, I.J. The Plant DNA C-values Database (Release 7.1): An Updated Online Repository of Plant Genome Size Data for Comparative Studies. New Phytol. 2020, 226, 301–305. [Google Scholar] [CrossRef]
- Lepers-Andrzejewski, S.; Siljak-Yakovlev, S.; Brown, S.C.; Wong, M.; Dron, M. Diversity and Dynamics of Plant Genome Size: An Example of Polysomaty from a Cytogenetic Study of Tahitian Vanilla (Vanilla × tahitensis, Orchidaceae). Am. J. Bot. 2011, 98, 986–997. [Google Scholar] [CrossRef] [PubMed]
- Doležel, J.; Greilhuber, J.; Suda, J. Estimation of Nuclear DNA Content in Plants Using Flow Cytometry. Nat. Protoc. 2007, 2, 2233–2244. [Google Scholar] [CrossRef]
- R Core Team. R: A Language and Environment for Statistical Computing; R Foundation for Statistical Computing: Vienna, Austria, 2023. [Google Scholar]
- Nemenyi, P. Distribution-Free Multiple Comparisons. Ph.D. Thesis, Princeton University, Princeton, NJ, USA, 1963. [Google Scholar]
- Holm, S. A Simple Sequentially Rejective Multiple Test Procedure. Scand. J. Stat. 1979, 6, 65–70. [Google Scholar]
- Peona, V.; Weissensteiner, M.H.; Suh, A. How Complete Are “Complete” Genome Assemblies?—An Avian Perspective. Mol. Ecol. Resour. 2018, 18, 1188–1195. [Google Scholar] [CrossRef] [PubMed]
- Farhat, P.; Siljak-Yakovlev, S.; Adams, R.P.; Bou Dagher Kharrat, M.; Robert, T. Genome Size Variation and Polyploidy in the Geographical Range of Juniperus sabina L. (Cupressaceae). Bot. Lett. 2019, 166, 134–143. [Google Scholar] [CrossRef]
- Bhadra, S.; Leitch, I.J.; Onstein, R.E. From Genome Size to Trait Evolution during Angiosperm Radiation. Trends Genet. 2023, 39, 728–735. [Google Scholar] [CrossRef]
- Siljak-Yakovlev, S.; Stevanovic, V.; Tomasevic, M.; Brown, S.C.; Stevanovic, B. Genome Size Variation and Polyploidy in the Resurrection Plant Genus Ramonda: Cytogeography of Living Fossils. Environ. Exp. Bot. 2008, 62, 101–112. [Google Scholar] [CrossRef]
- Lazarević, M.; Siljak-Yakovlev, S.; Sanino, A.; Niketić, M.; Lamy, F.; Hinsinger, D.D.; Tomović, G.; Stevanović, B.; Stevanović, V.; Robert, T. Genetic Variability in Balkan Paleoendemic Resurrection Plants Ramonda serbica and R. nathaliae Across Their Range and in the Zone of Sympatry. Front. Plant Sci. 2022, 13, 873471. [Google Scholar] [CrossRef] [PubMed]
- Charalambous, I.; Ioannou, N.; Kyratzis, A.C.; Kourtellarides, D.; Hagidimitriou, M.; Nikoloudakis, N. Genome Size Variation across a Cypriot Fabeae Tribe Germplasm Collection. Plants 2023, 12, 1469. [Google Scholar] [CrossRef]
- Beaulieu, J.M.; Leitch, I.J.; Patel, S.; Pendharkar, A.; Knight, C.A. Genome Size Is a Strong Predictor of Cell Size and Stomatal Density in Angiosperms. New Phytol. 2008, 179, 975–986. [Google Scholar] [CrossRef]
- Ćavar Zeljković, S.; Siljak-Yakovlev, S.; Tan, K.; Maksimović, M. Chemical Composition and Antioxidant Activity of Geranium Macrorrhizum in Relation to Ploidy Level and Environmental Conditions. Plant Syst. Evol. 2020, 306, 18. [Google Scholar] [CrossRef]
- Cang, F.A.; Welles, S.R.; Wong, J.; Ziaee, M.; Dlugosch, K.M. Genome Size Variation and Evolution during Invasive Range Expansion in an Introduced Plant. Evol. Appl. 2024, 17, e13624. [Google Scholar] [CrossRef] [PubMed]
- Beaulieu, J.M.; Moles, A.T.; Leitch, I.J.; Bennett, M.D.; Dickie, J.B.; Knight, C.A. Correlated Evolution of Genome Size and Seed Mass. New Phytol. 2007, 173, 422–437. [Google Scholar] [CrossRef] [PubMed]
- Meagher, T.R.; Vassiliadis, C. Phenotypic Impacts of Repetitive DNA in Flowering Plants. New Phytol. 2005, 168, 71–80. [Google Scholar] [CrossRef] [PubMed]
- Beaulieu, J.M.; Leitch, I.J.; Knight, C.A. Genome Size Evolution in Relation to Leaf Strategy and Metabolic Rates Revisited. Ann. Bot. 2007, 99, 495–505. [Google Scholar] [CrossRef] [PubMed]
- Tenaillon, M.I.; Manicacci, D.; Nicolas, S.D.; Tardieu, F.; Welcker, C. Testing the Link between Genome Size and Growth Rate in Maize. PeerJ 2016, 4, e2408. [Google Scholar] [CrossRef] [PubMed]
- Rayburn, A.L.; Dudley, J.W.; Biradar, D.P. Selection for Early Flowering Results in Simultaneous Selection for Reduced Nuclear DNA Content in Maize. Plant Breed. 1994, 112, 318–322. [Google Scholar] [CrossRef]
- Bilinski, P.; Albert, P.S.; Berg, J.J.; Birchler, J.A.; Grote, M.N.; Lorant, A.; Quezada, J.; Swarts, K.; Yang, J.; Ross-Ibarra, J. Parallel Altitudinal Clines Reveal Trends in Adaptive Evolution of Genome Size in Zea mays. PLOS Genet. 2018, 14, e1007162. [Google Scholar] [CrossRef] [PubMed]
- Jian, Y.; Xu, C.; Guo, Z.; Wang, S.; Xu, Y.; Zou, C. Maize (Zea mays L.) Genome Size Indicated by 180-Bp Knob Abundance Is Associated with Flowering Time. Sci. Rep. 2017, 7, 5954. [Google Scholar] [CrossRef] [PubMed]
- Bennett, M.D. Variation in Genomic Form in Plants and Its Ecological Implications. New Phytol. 1987, 106, 177–200. [Google Scholar] [CrossRef]
- Bennett, M.D. Nuclear DNA Content and Minimum Generation Time in Herbaceous Plants. Proc. R. Soc. Lond. B Biol. Sci. 1972, 181, 109–135. [Google Scholar] [CrossRef] [PubMed]
- Hessen, D.O.; Jeyasingh, P.D.; Neiman, M.; Weider, L.J. Genome Streamlining and the Elemental Costs of Growth. Trends Ecol. Evol. 2010, 25, 75–80. [Google Scholar] [CrossRef] [PubMed]
- Kang, M.; Wang, J.; Huang, H. Nitrogen Limitation as a Driver of Genome Size Evolution in a Group of Karst Plants. Sci. Rep. 2015, 5, 11636. [Google Scholar] [CrossRef] [PubMed]


| Accessions | Locality | GPS Coordinates | ||
|---|---|---|---|---|
| Name | Tegument Color | Latitude | Longitude | |
| S1 | brown | Koulbaga | 13°55′00.7″ | 1°14′39.2″ |
| S2 | brown | Koulbaga | 14°24′59.9″ | 3°19′26.8″ |
| S3 | beige | Koulbaga | 14°24′59.9″ | 3°19′26.8″ |
| S4 | beige | Koulbaga | 14°24′59.9″ | 3°19′26.8″ |
| S7 | gray | Guéro kiraï | 13°54′48.9″ | 1°14′19.2″ |
| S8 | beige | Tchoumbo | 13°54′54.0″ | 1°14′20.3″ |
| S11 | white | Garbey kourou | 13°74′22.7″ | 1°61′26.4″ |
| S12 | beige | Garbey kourou | 13°74′22.7″ | 1°61′26.4″ |
| S13 | gray | Garbey kourou | 13°74′22.7″ | 1°61′26.4″ |
| S14a | beige | Djabou | 14°00′04.6″ | 1°14′31.9″ |
| S15 | brown | Say | 13°09′27.5″ | 2°22′25.6″ |
| S16 | brown | Djabou | 14°00′04.6″ | 1°14′31.9″ |
| S17 | brown | Say | 13°09′27.5″ | 2°22′25.6″ |
| S22b | beige | Kossa | 14°23′24.2″ | 2°03′38.4″ |
| S25 | beige | Sona | 13°49′97.4″ | 2°09′36.6″ |
| S26 | beige | Lossa | 13°92′11.2″ | 1°57′55.4″ |
| S27 | brown | Lossa | 13°92′11.2″ | 1°57′55.4″ |
| S28 | brown | Ingonga | 13°34′08.3″ | 2°31’67.4″ |
| S35 | white | Hawan Dawaki | 13°55’70.2″ | 2°90’45.8″ |
| S37 | beige | Korgom | 13°45’25.2″ | 8°25’60.5″ |
| S41 | white | Aguié | 13°75’58.7″ | 7°98’86.4″ |
| S42 | white | Tchadoua | 13°54’78.4″ | 7°44’77.7″ |
| S44 | white | Dan Jikaou | 13°31’22.2″ | 7°54’41.0″ |
| S46 | white | Tessaoua | 13°73’87.5″ | 8°13’79.0″ |
| S50 | white | Kibya Ga Kougou | 13°73’71.7″ | 6°98’11.7″ |
| S52 | beige | Kibya Ga Kougou | 13°73’71.7″ | 6°98’11.7″ |
| S53 | white | Guidan Tanko | 13°48’37.6″ | 2°59’52.3″ |
| S54 | white | Sabon Machi | 13°87’58.1″ | 6°98’04.1″ |
| S57 | beige | Jaja | 14°00′11.6″ | 6°96′45.9″ |
| S60 | brunette | Tibiri | 13°57′07.3″ | 7°05′06.4″ |
| S63 | white | Matameye | 13°42′57.3″ | 8°48′01.0″ |
| S65 | beige | Takiéta | 13°67′99.4″ | 8°52′95.9″ |
| S66 | brunette | Kantché | 13°42′57.3″ | 8°48′01.1″ |
| S67 | beige | Dan Bouta | 13°76′60.2″ | 8°74′30.8″ |
| S68 | gray | Dan Bouta | 13°76′60.2″ | 8°74′30.8″ |
| S71 | beige | Ga Allah | 12°99′63.1″ | 9°26′86.8″ |
| S72 | beige | Dan Koublé | 13°01′53.2″ | 8°49′13.4″ |
| S75 | beige | Malawa | 13°03′12.5″ | 9°61′34.1″ |
| S76 | brunette | Malawa | 13°03′12.5″ | 9°61′34.1″ |
| S79 | brunette | Hayaniya | 12°92′55.3″ | 9°39′30.1″ |
| S81 | beige | Malawa | 13°03′12.5″ | 9°61′34.1″ |
| S82 | white | Katta Kara | 12°99′13.3″ | 9°60′49.1″ |
| S83 | beige | Malawa | 13°03′12.5″ | 9°61′34.1″ |
| S84 | beige | Dan Marké | 12°92′12.2″ | 9°56′08.7″ |
| S85 | beige | Hayaniya | 12°92′55.3″ | 9°39′30.1″ |
| S86 | white | Hayaniya | 12°92′55.3″ | 9°39′30.1″ |
| S91 | brown | Dogo | 13°50′21.2″ | 9°01′59.6″ |
| S92 | beige | Dogo | 13°50′21.2″ | 9°01′59.6″ |
| S93 | white | Kaba | 13°24′45.1″ | 8°91′70.9″ |
| S94 | beige | Bandé | 13°18′21.2″ | 8°88′64.4″ |
| S95 | brunette | Kaba | 13°24′45.1″ | 8°91′70.9″ |
| S96 | brunette | Bandé | 13°18′21.2″ | 8°88′64.4″ |
| S99 | beige | Dogo | 13°50′21.2″ | 9°01′59.6″ |
| S100 | beige | Tsarnaoua | 13°89′23.0″ | 5°34′43.4″ |
| S101 | brown | Tsarnaoua | 13°89′23.0″ | 5°34′43.4″ |
| S104 | brunette | Tara | 11°89′96.6″ | 3°33′50.9′ |
| S110 | brown | Gaya | 12°00′57.6″ | 3°27′12.3″ |
| S111 | beige | Guéza | 12°35′29.9″ | 3°24′25.5″ |
| S116 | beige | Kodo | 13°14′04.4″ | 2°41′59.4″ |
| S118 | brunette | Kodo | 13°14′04.4″ | 2°41′59.4″ |
| S120 | beige | Kodo | 13°14′04.4″ | 2°41′59.4″ |
| S122 | black | Kodo | 13°14′04.4″ | 2°41′59.4″ |
| S123 | black | Dara Salam | 13°19′33.0″ | 12°36′0.30″ |
| S125 | white | Madina | 13°10′45.8″ | 2°49′40.1″ |
| S126 | white | Tanda | 11°59′33.5″ | 3°18′40.2″ |
| S130 | beige | Diffa | 13°19′33.0″ | 12°36′00.3″ |
| S132 | white | Diffa | 13°19′33.0″ | 12°36′00.3″ |
| S133 | beige | Diffa | 13°19′33.0″ | 12°36′00.3″ |
| S134 | beige | Diffa | 13°19′33.0″ | 12°36′00.3″ |
| S135 | beige | Gandaré | 13°19′33.0″ | 12°36′00.3″ |
| S136 | beige | Gandaré | 13°19′33.0″ | 12°36′00.3″ |
| S137 | beige | Geida Sila | 12°08′25.3″ | 15°03′25.6″ |
| S138 | white | Geida Sila | 12°08′25.3″ | 15°03′25.6″ |
| S139 | white | Geida Sila | 12°08′25.3″ | 15°03′25.6″ |
| S140 | beige | Geida Sila | 12°08′25.3″ | 15°03′25.6″ |
| STh a | black | Market | - | - |
| Accession | Genome Size (pg) | Mean 1Cx Value in Mbp b | Sample Data | ||||
|---|---|---|---|---|---|---|---|
| n | Mean 2C Value | S.D. | Min–Max | AgroM c | Genetic d | ||
| S1 | 5 | 0.87 | 0.008 | 0.86–0.88 | 426 | AgroM2 | Gr2 |
| S2 | 5 | 0.87 | 0.012 | 0.86–0.89 | 425 | AgroM1 | Gr1 |
| S3 | 5 | 0.85 | 0.011 | 0.83–0.86 | 414 | AgroM1 | Gr1 |
| S4 | 5 | 0.84 | 0.008 | 0.83–0.85 | 410 | AgroM3 | Gr3 |
| S7 | 5 | 0.87 | 0.013 | 0.86–0.89 | 426 | AgroM3 | Gr3 |
| S8 | 5 | 0.88 | 0.020 | 0.86–0.91 | 430 | AgroM3 | Gr1 |
| S11 | 5 | 0.84 | 0.025 | 0.82–0.88 | 411 | AgroM3 | Gr3 |
| S12 | 5 | 0.90 | 0.031 | 0.87–0.94 | 440 | AgroM1 | Gr1 |
| S13 | 5 | 0.91 | 0.008 | 0.9–0.92 | 446 | AgroM3 | Gr3 |
| S14a | 5 | 0.88 | 0.011 | 0.86–0.89 | 428 | AgroM2 | Gr1 |
| S15 | 5 | 0.80 | 0.007 | 0.79–0.81 | 391 | AgroM2 | Gr1 |
| S16 | 5 | 0.87 | 0.018 | 0.86–0.90 | 426 | AgroM2 | Gr2 |
| S17 | 5 | 0.81 | 0.005 | 0.80–0.81 | 394 | AgroM2 | Gr2 |
| S22b | 5 | 0.84 | 0.018 | 0.82–0.86 | 412 | AgroM3 | Gr3 |
| S25 | 5 | 0.85 | 0.026 | 0.82–0.88 | 417 | AgroM3 | Gr3 |
| S26 | 5 | 0.83 | 0.019 | 0.80–0.85 | 406 | AgroM3 | Gr3 |
| S27 | 5 | 0.86 | 0.034 | 0.82–0.91 | 422 | AgroM1 | Gr1 |
| S28 | 5 | 0.88 | 0.018 | 0.87–0.91 | 431 | AgroM1 | Gr1 |
| S35 | 5 | 0.86 | 0.029 | 0.82–0.90 | 422 | AgroM3 | Gr3 |
| S37 | 5 | 0.82 | 0.011 | 0.80–0.83 | 399 | AgroM3 | Gr3 |
| S41 | 5 | 0.85 | 0.014 | 0.84–0.87 | 416 | AgroM3 | Gr1 |
| S42 | 5 | 0.82 | 0.011 | 0.80–0.83 | 400 | AgroM2 | Gr2 |
| S44 | 5 | 0.84 | 0.013 | 0.83–0.86 | 412 | AgroM3 | Gr3 |
| S46 | 5 | 0.85 | 0.011 | 0.84–0.87 | 418 | AgroM3 | Gr3 |
| S50 | 5 | 0.82 | 0.032 | 0.78–0.86 | 400 | AgroM1 | Gr1 |
| S52 | 5 | 0.86 | 0.017 | 0.83–0.87 | 419 | AgroM1 | Gr1 |
| S53 | 5 | 0.93 | 0.019 | 0.90–0.95 | 456 | AgroM1 | Gr2 |
| S54 | 10 | 0.87 | 0.019 | 0.85–0.90 | 426 | AgroM3 | Gr3 |
| S57 | 5 | 0.80 | 0.005 | 0.80–0.81 | 393 | AgroM3 | Gr3 |
| S60 | 5 | 0.86 | 0.016 | 0.84–0.88 | 420 | AgroM3 | Gr2 |
| S63 | 5 | 0.84 | 0.011 | 0.83–0.86 | 413 | AgroM2 | Gr1 |
| S65 | 5 | 0.90 | 0.011 | 0.88–0.91 | 439 | AgroM1 | Gr3 |
| S66 | 5 | 0.80 | 0.008 | 0.79–0.81 | 390 | AgroM3 | Gr2 |
| S67 | 5 | 0.83 | 0.015 | 0.81–0.85 | 408 | AgroM2 | Gr1 |
| S68 | 5 | 0.80 | 0.010 | 0.79–0.81 | 391 | AgroM1 | Gr3 |
| S71 | 5 | 0.86 | 0.043 | 0.82–0.93 | 422 | AgroM3 | Gr3 |
| S72 | 10 | 0.83 | 0.016 | 0.81–0.86 | 406 | AgroM3 | Gr2 |
| S75 | 6 | 0.83 | 0.019 | 0.80–0.85 | 406 | AgroM3 | Gr3 |
| S76 | 5 | 0.82 | 0.007 | 0.81–0.83 | 401 | AgroM2 | Gr2 |
| S79 | 7 | 0.85 | 0.016 | 0.83–0.87 | 414 | AgroM1 | Gr1 |
| S81 | 7 | 0.84 | 0.017 | 0.81–0.86 | 411 | AgroM3 | Gr3 |
| S82 | 5 | 0.82 | 0.018 | 0.80–0.84 | 402 | AgroM2 | Gr2 |
| S83 | 5 | 0.84 | 0.015 | 0.82–0.86 | 410 | AgroM3 | Gr3 |
| S84 | 5 | 0.83 | 0.018 | 0.81–0.85 | 405 | AgroM1 | Gr1 |
| S85 | 5 | 0.87 | 0.019 | 0.85–0.90 | 427 | AgroM1 | Gr1 |
| S86 | 5 | 0.81 | 0.033 | 0.77–0.86 | 395 | AgroM2 | Gr2 |
| S91 | 6 | 0.80 | 0.022 | 0.77–0.83 | 390 | AgroM1 | Gr1 |
| S92 | 5 | 0.87 | 0.016 | 0.84–0.88 | 424 | AgroM3 | Gr3 |
| S93 | 5 | 0.81 | 0.009 | 0.81–0.83 | 398 | AgroM3 | Gr3 |
| S94 | 7 | 0.85 | 0.026 | 0.82–0.89 | 417 | AgroM3 | Gr3 |
| S95 | 5 | 0.87 | 0.029 | 0.85–0.92 | 426 | AgroM3 | Gr3 |
| S96 | 5 | 0.78 | 0.008 | 0.77–0.79 | 382 | AgroM2 | Gr2 |
| S99 | 5 | 0.84 | 0.013 | 0.83–0.86 | 412 | AgroM1 | Gr1 |
| S100 | 5 | 0.84 | 0.013 | 0.82–0.85 | 409 | AgroM1 | Gr1 |
| S101 | 5 | 0.88 | 0.022 | 0.85–0.91 | 429 | AgroM2 | Gr2 |
| S104 | 12 | 0.83 | 0.027 | 0.77–0.86 | 403 | AgroM2 | Gr2 |
| S110 | 5 | 0.87 | 0.022 | 0.85–0.90 | 426 | AgroM1 | Gr1 |
| S111 | 5 | 0.87 | 0.018 | 0.85–0.89 | 427 | AgroM3 | Gr3 |
| S116 | 5 | 0.90 | 0.019 | 0.89–0.93 | 442 | AgroM3 | Gr3 |
| S118 | 5 | 0.84 | 0.019 | 0.81–0.85 | 409 | AgroM3 | Gr2 |
| S120 | 5 | 0.85 | 0.036 | 0.79–0.88 | 417 | AgroM3 | Gr3 |
| S122 | 5 | 0.85 | 0.019 | 0.82–0.87 | 417 | AgroM2 | Gr2 |
| S123 | 5 | 0.82 | 0.007 | 0.81–0.83 | 401 | AgroM2 | Gr3 |
| S125 | 5 | 0.92 | 0.026 | 0.89–0.95 | 451 | AgroM2 | Gr2 |
| S126 | 5 | 0.88 | 0.013 | 0.86–0.89 | 431 | AgroM3 | Gr3 |
| S130 | 5 | 0.89 | 0.021 | 0.86–0.91 | 435 | AgroM3 | Gr3 |
| S132 | 5 | 0.95 | 0.031 | 0.92–1.00 | 464 | AgroM3 | Gr3 |
| S133 | 5 | 0.85 | 0.018 | 0.83–0.87 | 414 | AgroM1 | Gr1 |
| S134 | 5 | 0.86 | 0.022 | 0.83–0.88 | 422 | AgroM2 | Gr2 |
| S135 | 5 | 0.86 | 0.032 | 0.84–0.92 | 422 | AgroM3 | Gr3 |
| S136 | 6 | 0.86 | 0.017 | 0.84–0.89 | 422 | AgroM3 | Gr3 |
| S137 | 5 | 0.89 | 0.021 | 0.87–0.92 | 435 | AgroM3 | Gr3 |
| S138 | 10 | 0.87 | 0.013 | 0.85–0.89 | 425 | AgroM2 | Gr2 |
| S139 | 5 | 0.90 | 0.033 | 0.86–0.93 | 440 | AgroM3 | Gr3 |
| S140 | 5 | 0.90 | 0.033 | 0.85–0.94 | 441 | AgroM3 | Gr3 |
| STh a | 8 | 0.73 | 0.01 | 0.72–0.74 | 356 | - | - |
| d.f. | H | P 1 | ||
|---|---|---|---|---|
| All accessions | +STh | 75 | 318.45 | <2.2 × 10⁻¹⁶ *** |
| −STh | 74 | 306.65 | ||
| Genetic Groups | Among Groups (+STh) | 3 | 35.1 | 1.161 × 10⁻⁷ *** |
| Among Groups (−STh) | 2 | 11.92 | 0.003 ** | |
| Gr1 | 20 | 74.89 | 2.8 × 10⁻⁸ *** | |
| Gr2 | 18 | 89.68 | 1.7 × 10⁻¹¹ *** | |
| Gr3 | 34 | 133.6 | 9.6 × 10⁻¹⁴ *** | |
| Agro-morphological Groups | Among Groups (+STh) | 3 | 35.78 | 8.3 × 10⁻⁸ *** |
| Among Groups (−STh) | 2 | 12.62 | 0.002 ** | |
| AgroM1 | 17 | 70.77 | 1.6 × 10⁻⁸ *** | |
| AgroM2 | 18 | 87.08 | 7.31 × 10⁻¹¹ *** | |
| AgroM3 | 37 | 141.99 | 3.2 × 10⁻¹⁴ *** |
| Variable | r | p 1 |
|---|---|---|
| Branching | −0.05 | 0.64 ns |
| Flowering Time | −0.27 | 0.02 * |
| Height | −0.045 | 0.70 ns |
| Latitude | 0.0002 | 0.99 ns |
| Longitude | −0.06 | 0.59 ns |
| Fatty acid content | −0.06 | 0.67 ns |
| Linoleic acid content | −0.15 | 0.27 ns |
| Oleic acid content | 0.22 | 0.12 ns |
| Seed maturity | −0.06 | 0.59 ns |
| Yield | 0.05 | 0.66 ns |
| d.f. | R Squared 1 | F | P 2 | ||
|---|---|---|---|---|---|
| All accessions 3 | 1;73 | 0.045 | 4.517 | 0.04 * | |
| Genetic Groups | Gr1 | 1;19 | 0.135 | 4.124 | 0.06 ns |
| Gr2 | 1;17 | −0.056 | 0.048 | 0.83 ns | |
| Gr3 | 1;33 | 0.027 | 1.945 | 0.17 ns | |
| Agro-morphological Groups | AgroM1 | 1;16 | 0.019 | 1.336 | 0.26 ns |
| AgroM2 | 1;17 | −0.050 | 0.140 | 0.71 ns | |
| AgroM3 | 1;36 | 0.026 | 1.969 | 0.17 ns |
Disclaimer/Publisher’s Note: The statements, opinions and data contained in all publications are solely those of the individual author(s) and contributor(s) and not of MDPI and/or the editor(s). MDPI and/or the editor(s) disclaim responsibility for any injury to people or property resulting from any ideas, methods, instructions or products referred to in the content. |
© 2024 by the authors. Licensee MDPI, Basel, Switzerland. This article is an open access article distributed under the terms and conditions of the Creative Commons Attribution (CC BY) license (https://creativecommons.org/licenses/by/4.0/).
Share and Cite
Takvorian, N.; Zangui, H.; Naino Jika, A.K.; Alouane, A.; Siljak-Yakovlev, S. Genome Size Variation in Sesamum indicum L. Germplasm from Niger. Genes 2024, 15, 711. https://doi.org/10.3390/genes15060711
Takvorian N, Zangui H, Naino Jika AK, Alouane A, Siljak-Yakovlev S. Genome Size Variation in Sesamum indicum L. Germplasm from Niger. Genes. 2024; 15(6):711. https://doi.org/10.3390/genes15060711
Chicago/Turabian StyleTakvorian, Najat, Hamissou Zangui, Abdel Kader Naino Jika, Aïda Alouane, and Sonja Siljak-Yakovlev. 2024. "Genome Size Variation in Sesamum indicum L. Germplasm from Niger" Genes 15, no. 6: 711. https://doi.org/10.3390/genes15060711
APA StyleTakvorian, N., Zangui, H., Naino Jika, A. K., Alouane, A., & Siljak-Yakovlev, S. (2024). Genome Size Variation in Sesamum indicum L. Germplasm from Niger. Genes, 15(6), 711. https://doi.org/10.3390/genes15060711