Abstract
The Old-World quails, Coturnix coturnix (common quail) and Coturnix japonica (Japanese quail), are morphologically similar yet occupy distinct geographic ranges. This study aimed to elucidate their evolutionary trajectory and ancestral distribution patterns through a thorough analysis of their mitochondrial genomes. Mitogenomic analysis revealed high structural conservation, identical translational mechanisms, and similar evolutionary pressures in both species. Selection analysis revealed significant evidence of positive selection across the Coturnix lineage for the nad4 gene tree owing to environmental changes and acclimatization requirements during its evolutionary history. Divergence time estimations imply that diversification among Coturnix species occurred in the mid-Miocene (13.89 Ma), and their current distributions were primarily shaped by dispersal rather than global vicariance events. Phylogenetic analysis indicates a close relationship between C. coturnix and C. japonica, with divergence estimated at 2.25 Ma during the Pleistocene epoch. Ancestral range reconstructions indicate that the ancestors of the Coturnix clade were distributed over the Oriental region. C. coturnix subsequently dispersed to Eurasia and Africa, and C. japonica to eastern Asia. We hypothesize that the current geographic distributions of C. coturnix and C. japonica result from their unique dispersal strategies, developed to evade interspecific territoriality and influenced by the Tibetan Plateau’s geographic constraints. This study advances our understanding of the biogeographic and evolutionary processes leading to the diversification of C. coturnix and C. japonica, laying important groundwork for further research on this genus.
1. Introduction
The genus Coturnix, representing nomadic Old World quails, is widespread across the grasslands of Africa, Europe, Asia, and Australia [1]. As the sole long-distance migratory members of the Galliformes family Phasianidae, these quails offer unique insights into avian dispersal and adaptation [1,2]. Amongst the six described species, of particular interest are C. coturnix (common quail) and C. japonica (Japanese quail), two species that are morphologically indistinguishable in field conditions, with vocalizations often serving as the primary means of identification [1,3,4]. Despite their similar appearance and overlapping life history traits, these species exhibit distinct geographic distributions, with limited sympatry in regions such as Mongolia and northeastern India [1,3,4].
The behavioral and morphological similarities between C. coturnix and C. japonica are expected to extend to the molecular and genetic levels, yet this assumption has not been empirically tested. Furthermore, it would be scientifically intriguing to explore if the seemingly demarcated distribution of C. coturnix and C. japonica can be understood by an assessment of their phylogenetic topology and evolutionary history. To address this, our study utilizes mitogenomes to analyze the evolutionary trajectory and biogeographic patterns of C. coturnix and C. japonica. Mitogenomes are characterized by high mutation rates and low recombination, making them an ideal marker to study recently diversified species and their phylogeographic patterns [5,6].
Although previous studies have shed light on various aspects of Coturnix phylogeny and evolution, there remain unanswered questions regarding the divergence and biogeography of C. coturnix and C. japonica. For example, while Kimball et al. analyzed the whole mitogenomes of both species, they did not provide divergence time estimates or biogeographic reconstructions [7,8]. Chen et al. estimated divergence times for Galliformes using genomic ultraconserved elements but did not include C. coturnix in their sampling [9]. Stein et al. examined divergence estimates using mitochondrial genes and nuclear loci for Galliformes, encompassing C. coturnix and C. japonica, yet omitted biogeographic reconstructions [10]. Moreover, Wang et al. conducted an extensive study on divergence estimates and ancestral ranges within Galliformes, but their analysis only included C. coturnix [11]. Therefore, no study has exclusively analyzed the complete mitogenomes of C. coturnix and C. japonica to estimate their divergence dates, reconstruct their ancestral ranges, or assess their evolutionary trajectories in a comparative framework. Additionally, mitogenome sequences of C. coturnix and C. japonica from the Indian subcontinent have not been documented, and a comprehensive characterization of these mitogenomes, including structural features, codon usage patterns, and evolutionary attributes, is lacking.
We hypothesize that the morphological similarities between these species will be mirrored in their mitochondrial genome structures, molecular mechanisms, selection pressures, and phylogenetic relationships. Furthermore, we anticipate that differences in their ancestral ranges have led to distinct dispersal routes, culminating in their present distribution. Therefore, this study aims to (i) comprehensively characterize mitochondrial genome data for C. coturnix and C. japonica, (ii) investigate mitochondrial genome-based divergence estimates and range reconstructions for these species, extending this to other Coturnix quails, and (iii) explain the evolutionary trajectory and current geographic distributions of C. coturnix and C. japonica.
2. Materials and Methods
2.1. Sample Collection
A single specimen of C. coturnix was collected through a road-killed survey in Nagpur, Maharashtra State, India, with due permission from the Maharashtra Forest Department (Desk-22(8)/Research/CR-8(18-19)/875/2018-19). Identification of the specimen was performed in the field using a field guide [12]. Muscle, liver, heart, and testes (identifying the sample as male) tissues from the carcass were sampled and stored in DESS buffer (20% DMSO, 0.25 M tetra-sodium EDTA, sodium chloride till saturation, pH 7.5). The approximate time of tissue collection was estimated to be within 2 h of the road-hit occurrence. Under suitable conditions (0 °C, sterile ice box), the tissues were transported to the National Avian Forensic Laboratory at the Sálim Ali Centre for Ornithology and Natural History (SACON), Coimbatore, Tamil Nadu State, India, and stored at −80 °C until DNA extraction. Using a tissue lysis buffer (10 mM Tris-pH 8.0, 10 mM EDTA-pH 8.0, and 100 mM NaCl; 0.35 mM SDS and 34 units Proteinase K), ~20 mg of muscle tissue was digested at 52 °C for 12–15 h in a heating block. DNA extraction was performed using a modified phenol, chloroform, and isoamyl alcohol method and was stored under voucher code NAFL/0322/DNA/080720 [13]. The quality of the extractions was assessed using 1% agarose gel electrophoresis and quantified using spectrophotometry (DeNovix, Wilmington, DE, USA) and a Qubit 4 Fluorometer using the dsDNA High Sensitivity Assay Kit (ThermoFisher Scientific, Waltham, MA, USA).
For C. japonica, a commercially farmed specimen from India was sampled from the market, and the biomaterials (muscle tissue and blood) were stored in DESS buffer and transported to the lab under suitable conditions as stated above. The specifics of the C. japonica sample and the whole genome sequences produced are detailed in a prior publication by our research group [14]. To construct the C. japonica mitochondrial genome, we utilized the raw sequencing reads as reported in [14].
2.2. Library Preparation, NGS Sequencing, and Mitogenome Assemblage for C. coturnix
The wet-lab and next-generation sequencing methods used in this study were carried out and developed in-house as described below [15,16,17,18]. Extracted DNA was utilized for library preparation following the TruSeq DNA PCR-Free library preparation kit protocol (Illumina Inc., San Diego, CA, USA). About 1100 nanograms of the isolated genomic DNA were used as starting material to generate a paired-end genomic library of insert size 350 (2 × 150) bp. A focused ultrasonicator (Covaris M220, Woburn, MA, USA) was used to fragment the genomic DNA to the desired fragment size. Subsequently, TruSeq kit reagents were used to clean up the fragmented DNA, create blunt ends, and ligate adapters to the library fragments. The mean peak size of the library fragments was assessed using a Fragment Analyzer AATI 5200 (Agilent, Santa Clara, CA, USA) and quantified using the QIAseq Library Quant Assay Kit (Qiagen N.V., Hilden, Germany). The library was sequenced using the NextSeq550 instrument (Illumina Inc., USA).
bcl2fastq v2.20.0 software (Illumina Inc., USA) was used for sample de-multiplexing and adapter trimming. Overall quality was assessed using FastQC (https://www.bioinformatics.babraham.ac.uk/projects/fastqc/, accessed on 1 December 2020). Raw reads of C. coturnix and C. japonica were mapped to a reference mitogenome of C. japonica (NCBI acc. no. NC003408.1; [19]) using the Geneious mapper embedded in Geneious Prime version 2023.2.1 (https://www.geneious.com). Medium sensitivity, 25 iterations, and the highest quality threshold options were used in Geneious Prime to successfully assemble the C. coturnix and C. japonica mitogenomes from raw reads. The prediction of structural features in the newly obtained mitogenomes was carried out using the MiTOS2 web server. Final boundaries of structural features were decided by manually aligning the sequenced mitogenomes with previously available mitogenomes of C. japonica (NC003408.1, MW574361.1, KX712089.1; [8,19]) and C. coturnix (MW574359.1; [8]). tRNA secondary structure prediction was conducted using tRNAscan-SE2.0 and verified with the MiTOS2 results [20]. Each identified protein-coding gene (PCG) was translated using the ExPASy-Translate tool to verify the absence of internal stop codons and checked for their respective matches through NCBI-BLAST analysis [21]. The AT and GC skews were calculated using the formulas and , respectively [22]. Circular genome maps of the sequenced mitogenomes were generated using Proksee (https://proksee.ca/, accessed on 17 January 2024) [23]. Codon, amino acid, and relative synonymous codon (RSCU) usage parameters of the sequenced mitogenomes were calculated using the CAIcal server (https://ppuigbo.me/programs/CAIcal/, accessed on 25 November 2023) [24].
2.3. Detecting Selection Pressure
We estimated selection pressure on individual genes within the C. japonica and C. coturnix mitogenomes using the ratio of non-synonymous vs. synonymous mutations (dN/dS). We also searched for signatures of episodic diversification (positive selection) across the branches of a phylogenetic tree using several approaches. The dN/dS ratio was used to infer the type of selection on PCGs. A dN/dS ratio less than 1 indicates purifying (negative) selection, while a ratio greater than 1 suggests diversifying (positive) selection [25]. Using the phylogenetic trees generated in this study, we examined the following mitogenomes: C. japonica (PP209356), C. coturnix (PP212854), Alectoris chukar (FJ752426; [26]), Gallus gallus (CM028585.1), Margaroperdix madagarensis (MW574377.1; [8]), Coturnix pectoralis (MW574362; [8]), Coturnix delegorguei (MW574360; [8]), Coturnix chinensis (AB073301; [27]), Coturnix ypsilophora (MW574363; [8]), Pternistis swainsonii (MW574387; [8]), Tetraogallus himalayensis (KR349185; [28]), and Tetraogallus tibetanus (KF027439; [29]). Using the selected mitogenomes, a gene tree for each of the 13 PCGs was created in IQTREE v1.6.12 (model = GTR + I + G, bootstrap = 10,000) and used for executing selection analysis across various programs [30]. First, to calculate the dN/dS ratio for individual PCGs, we employed site models implemented in EasyCodeML version 1.41 [25,31]. Second, to detect positive selection along different branches of the phylogenetic tree, we analyzed each gene tree using several methods: (i) the adaptive branch-site random effects likelihood (aBSREL) and (ii) the Branch-site Unrestricted Statistical Test for Episodic Diversification (BUSTED) (both hosted on the Datamonkey 2.0 web server), as well as (iii) the branch-site models in EasyCodeML [32,33,34]. Third, to visually examine the conservation of amino acid sequences among the Coturnix species, we translated all PCGs and aligned them using ClustalOmega [35].
2.4. Genetic Distance and Phylogenetic Analyses
In order to avoid ambiguity in sequence quality and annotation, we downloaded mitogenomes of species within Phasianidae carrying the tag ‘Reference Sequence (RefSeq)’ from the NCBI GenBank. However, all the available mitogenomes of the Coturnix genus (irrespective of the RefSeq tag) were also included in all distance and phylogenetic analyses (Table S1). Genetic distance was estimated amongst the selected mitogenomes using two approaches. We calculated the genetic distance amongst each individual mitogenome to reveal the species-based sequence divergences (species n = 71). Additionally, mitogenomes were grouped into their respective genera to evaluate the genus-based sequence divergences (genus n = 31). For both analyses, we employed the Maximum Composite Likelihood Model in MEGA X and estimated genetic distances [36].
For the phylogenetic analyses, the 13 PCGs from the seventy-one mitogenomes were concatenated and used in this study. Alignment was achieved using ClustalOmega [35]. A maximum likelihood (ML) tree was constructed using the tools in IQTREE v1.6.12. To identify the optimal substitution model for our dataset, we employed ModelFinder within IQ-TREE, which selected the GTR + F + R5 model as the best fit based on the lowest Akaike Information Criterion (AIC) and Bayesian Information Criterion (BIC) scores [37]. The ML tree was then constructed and run for 10,000 iterations of ultrafast bootstrapping. Construction of the Bayesian inference (BI) tree was carried out in MrBayes 3.2.7a using the best-fit model of GTR + I + G [38]. BI tree construction was achieved using four independent chains running for 10,000,000 generations and trees being sampled every 5000 generations. During the run, the average standard deviation of the split frequencies was monitored to be under 0.01 at the end of the run, indicating convergence among the independent chains. The mixing of chains, effective sample sizes (ESS > 200), and stationarity were assessed using Tracer 1.7 [39]. The first 25% of the sampled trees were discarded as burn-in, and the remaining trees were used to build a consensus BI tree. FigTree v1.4.4 was utilized for editing the derived ML and BI phylogenetic trees, with Columba livia (GU908131; [40]) designated as the out-group [41].
2.5. Divergence Time Estimation
In order to utilize fossil-based age constraints to calibrate the tree, we selected eight additional mitogenomes to be included for divergence dating (n = 79) (Table S1). The fossils were selected following previously published phylogenetic reports on Galliformes [9,11,42]. Lognormal priors and fixed hard minimum ages were applied to the four fossil calibrations used in this analysis (Table S2). A dataset consisting of the concatenated PCGs from the 79 mitogenomes was created and aligned using ClustalOmega. In order to visualize the placement of fossil priors in a phylogenetic tree, an ML tree was constructed using IQTREE (model = GTR + F + R5, bootstrap = 10,000). The placement of fossils was indicated by A, B, C, and D on the tree (Figure S1). BEAST v2.6.7 was used to carry out the divergence time estimation, and BEAUTi v2.6.7 was used to create the XML file [43]. Using BEAUTi, we selected a relaxed uncorrelated lognormal clock model, the Yule process speciation model, and the GTR + γ site model. Using BEAST, we ran Markov Chain Monte Carlo (MCMC) chains for 350 million generations that sampled trees every 10,000 generations. Initially, runs for 100 or 200 million generations were set up; however, ESS values > 200 were observed beyond 300 million generations. Tracer 1.7 was used to check convergence between runs and estimate ESS values (>200). The first 25% of the trees were discarded as burn-in, and the remaining trees were summarized using TreeAnnotator v2.6.7 [43]. FigTree v1.4.4 was used to visualize the tree, posterior probability support values, and node ages. The Bayesian analyses (BEAST and Mr. Bayes) were conducted on the Smithsonian High Performance Computing Cluster (SI/HPC), Smithsonian Institution (https://doi.org/10.25572/SIHPC, accessed on 7 December 2023).
2.6. Ancestral Range Estimation
We estimated the probability of possible ancestral ranges of Coturnix quails using BioGeoBEARS in R [44,45]. The time-calibrated ultra-metric tree inferred from BEAST was pruned to contain seven Coturnix and one Alectoris species (as the out-group) using the R packages ape and phytools [46,47]. BioGeoBEARS allows fitting probabilistic biogeographic models with user-defined geographic areas. Initially, the terrestrial zoogeographic zones of Afro-Tropical, Madagascan, Saharo-Arabian, Palearctic, Sino-Japanese, Oriental, Oceanian, and Australian were coded as geographic areas [48]. However, the ancestral range estimations for each geographic area recovered very low probability scores. Hence, we condensed the distributions to four areas: (i) A (Oceanian and Australian), (ii) B (Oriental), (iii) C (Palearctic and Sino-Japanese), and (iv) D (Saharo-Arabian, Afro-Tropical, and Madagascan). Following species distribution ranges, we coded each species as present or absent from the assigned geographical areas [49]. Six biogeographic models were tested to identify the best-fitting model for our pruned dataset: (i) dispersal–extinction–cladogenesis (DEC) model, (ii) DEC + J, (iii) dispersal vicariance analysis (DIVA)-like model, (iv) DIVALIKE + J, (v) BayArea-like model, and (vi) BayArea-like + J built in BioGeoBEARS. The DEC model allows all variations in cladogenetic and/or anagenetic speciation events during its implementation [44,50]. The DIVA-like model allows all variations in anagenetic processes but permits only narrow sympatric cladogenetic events (i.e., does not allow daughter lineages to each inherit the ancestor’s entire range) [42,51]. Similarly, the BayArea-like model allows all variations in anagenetic processes but permits only widespread sympatric cladogenetic events (i.e., does not allow daughter lineages to inherit portions of their ancestor’s range) [42,52]. Incorporation of the ‘+J’ parameter, indicative of founder-event speciation, was also evaluated across all three models. This parameter represents a rare dispersal event that instantaneously leads to the formation of a geographically isolated new lineage, derived from one or a few individuals [44]. In this study, the BayArea-like + J model was selected as the best-fitting model using the weighted AIC, and ancestral ranges of Coturnix species were estimated accordingly.
We also conducted an analysis where we reclassified the western Palaearctic and eastern Palearctic/Sino-Japanese regions as two separate ancestral areas. Consequently, we conducted a modified BioGeoBEARS run with reclassified geographic areas as follows: (i) A (Oceanian and Australian), (ii) B (Oriental), (iii) C (western Palaearctic), (iv) D (Saharo-Arabian, Afro-Tropical, and Madagascan), and (v) E (eastern Palearctic and Sino-Japanese). All six biogeographic models were tested, and DEC + J was identified as the best-fitting model for our modified run. The inferences drawn from this modified run were compared with the range reconstruction patterns obtained with the BayArea-like + J model from the previous analysis.
3. Results
3.1. Gene Arrangement, Nucleotide Composition, and Codon Usage Analysis
Sequencing yielded ~100 million paired-end reads for both C. coturnix and C. japonica. FastQC analysis revealed that the base call quality of all raw reads was within the range denoted as ‘very good quality calls’. The average Phred quality score across all reads exceeded Q30 for both species and was deemed suitable for mitogenome assembly. Complete mitogenomes of C. japonica and C. coturnix were assembled, annotated, and submitted to NCBI GenBank under the accession codes PP209356 and PP212854, respectively. The depth of the mapped mitogenome reads was estimated to be 48× for C. japonica and 107× for C. coturnix. Despite sequencing a nearly identical number of reads for both species, observed variations in the depth of mitochondrial genomes retrieved suggest disparities in the distribution of library fragments across the genome. These disparities may stem from minute differences in reagents/template handling, or the quality of the input DNA. The length of the sequenced mitogenomes was calculated at 16,698 bp (C. japonica) and 16,696 bp (C. coturnix). The lengths of previously published C. japonica mitogenomes (NC003408.1, MW574361.1, and KX712089.1) are 16,697 bp, 16,701 bp, and 16,698 bp, respectively, and C. coturnix (MW574359.1) is 16,700 bp. Both mitogenomes sequenced in this study are composed of 13 PCGs, 22 transfer RNAs (tRNA), 2 ribosomal RNAs (rRNA), and a mitochondrial control region (CR) (Figure 1). Amongst the structural features, eight tRNAs (trnaQ, trnA, trnN, trnC, trnY, trnS2, trnP, and trnE) and one PCG (nad6) were located on the light chain, while the remaining features were situated on the heavy chain (Tables S3 and S4). The nucleotide composition for various structural features of C. japonica and C. coturnix mitogenomes was calculated and described (Tables S5 and S6). Overall, both mitogenomes displayed similar base compositions across features. PCGs, tRNAs, and rRNAs displayed higher A-T (55.6% and 55.7%) content relative to G-C (44.4% and 44.3%) content. The control region of both mitogenomes was calculated to contain negative A-T and G-C skews, but overall, the A-T content of the control region was estimated to be highest amongst the structural features (59.8% and 60.7%).
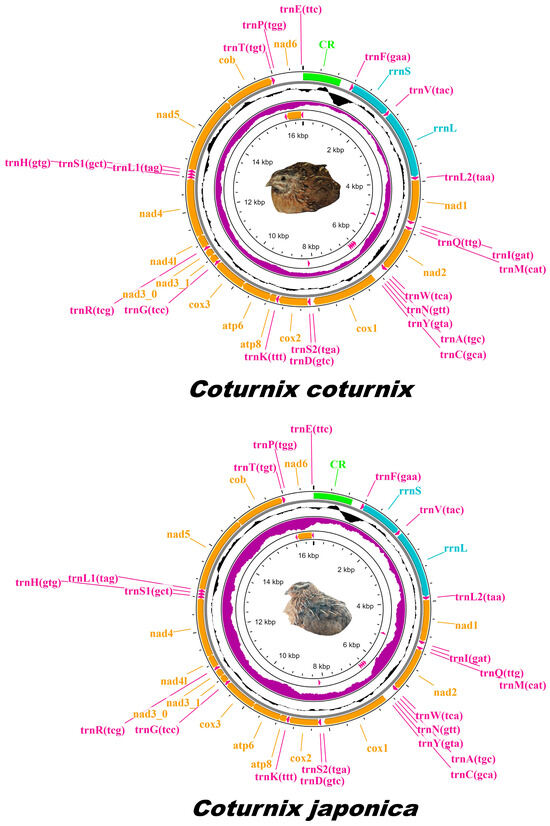
Figure 1.
Circular schematic map of the mitogenomes of C. coturnix and C. japonica. Genes are represented with different color blocks, with PCGs in orange, rRNAs in blue, tRNAs in magenta, and the control region in green. Black sliding windows correspond to the GC content, and purple sliding windows correspond to the value of the GC skew. Letters in parentheses for tRNA tags indicate anticodons. The arrow direction at the end of protein-coding genes indicates transcription on the plus (right) or minus (left) strand.
The tRNA secondary structures of C. japonica and C. coturnix mitogenomes displayed a clover leaf structure for all tRNAs except tRNA(Serine), which contained a mismatch base pair in its dihydrouridine arm (Figures S2 and S3). For both sequenced mitogenomes, ‘ATG’ was the start codon for all PCGs except for the cox1 gene (GTG was the start codon). Both mitogenomes were found to have incomplete stop codons in cox3 and nad4.
The new C. coturnix mitogenome (PP212854) generated from a specimen collected in India was compared for sequence variation against a previously available but geographically undefined mitogenome of C. coturnix (MW574359) [8]. We identified one gap and five differences in nucleotides across the two mitogenomes, estimating a sequence similarity score of 99.8%. Similarly, we compared the new C. japonica mitogenome (PP209356) for sequence variation against previously available C. japonica mitogenomes (KXY712089, MW57436, and NC003408). There was ~100% sequence similarity amongst the C. japonica mitogenomes, without any gaps. Furthermore, C. japonica_PP209356 was closest to C. japonica_KXY712089 in sequence similarity (~100%). Overall, sequence dissimilarity amongst C. coturnix mitogenomes was found to be slightly more pronounced than the C. japonica sequences investigated in this study.
Codon usage analysis for C. japonica and C. coturnix mitogenomes sequenced in this study revealed identical preferences in amino acid usage and RSCU patterns. Both C. japonica and C. coturnix mitogenomes were biased towards codons such as TTA, TTG, CTT, CTC, CTA, and CTG and amino acids such as leucine, serine, threonine, and isoleucine (Figure S4). RSCU analysis for both mitogenomes revealed the highest preferences in codons such as TCC, TCA, TCG, AGT, and AGC and amino acids such as leucine, serine, proline, threonine, and alanine (Figure S4).
3.2. Selection Pressure
The dN/dS ratio of all PCGs was found to be less than 1, indicating neutral/purifying selection on all PCGs (Figure 2). Amongst the PCGs, cytb and cox1 were the most conserved genes, whereas atp8 was estimated to be the least conserved. Furthermore, the dN/dS ratio of all PCGs was almost identical for both C. japonica and C. coturnix, suggesting they were subjected to very similar evolutionary pressures.

Figure 2.
(A) dN/dS estimates for 13 protein-coding genes of C. coturnix and C. japonica mitogenomes sequenced in this study. The X-axis shows the gene name, and the Y-axis shows the units of the dN/dS ratio. (B) Maximum likelihood tree constructed using the nad4 gene of selected mitogenomes used in this study. EasyCodeML, aBSREL, and BUSTED algorithms detected positive selection across the highlighted tree branch that leads to the Coturnix lineage (boldly marked in yellow ochre and asterisked).
Each of the 13 PCG gene trees was tested, and except for the nad4 gene, investigations across all other gene trees (across all branches) found no evidence of episodic diversifying selection in our phylogenies. EasyCodeML, aBSREL, and BUSTED detected highly significant evidence of episodic diversifying selection across the Coturnix lineage for the nad4 gene tree (Figure 2). Our findings suggest that for the nad4 gene tree, the Coturnix lineage experienced adaptive evolution, wherein non-synonymous substitutions were favored in response to changing environmental pressure or ecological niches. Visual inspection of the nad4 amino acid sequence alignment for the Coturnix species shows a large number of variable amino acid sites across species (Figure S5). Our investigation identified 44 putative sites of non-synonymous substitutions within the Coturnix lineage. Amongst these, the most frequent substitutions were alanine to threonine (n = 5), followed by threonine to isoleucine (n = 4), and methionine to leucine (n = 4). The analysis of non-synonymous substitution sites showed that amino acids such as threonine (n = 15), isoleucine (n = 11), leucine (n = 11), methionine (n = 10), valine (n = 9), serine (n = 9), and alanine (n = 7) were most prevalent.
3.3. Phylogenetic Analyses
Pairwise genetic distances calculated for the sequences used in this study revealed C. japonica and C. coturnix to be the closest to each other, with a pairwise genetic distance of 2.1%. Furthermore, distances revealed that C. delegorguei and C. pectoralis are closest to C. japonica and C. coturnix, followed by M. madagarensis, C. ypsilophora, and C. chinensis, respectively (Figure S6). Similarly, genus-based comparisons revealed the Tetraogallus and Pternistis genera are closest to Coturnix (Figure S7).
Phylogenetic analyses revealed similar topologies for the ML and BI trees (Figure 3). The bootstrap values (ML tree) and posterior probabilities (BI tree) for the phylogenetic tree were 100 and 1, respectively, for 68 out of 71 branches, signifying high support for these branches. Additionally, proper mixing of chains and ESS values > 1500 provided evidence for a high-quality BI analysis (Figure S8). The phylogenetic analysis reveals that the ‘Coturnix’ clade bifurcates into distinct lineages: one comprising C. chinensis and C. ypsilophora, and the other encompassing the remaining species. Within the latter group, M. madagarensis diverges as a separate lineage, while C. coturnix, C. japonica, C. delegorguei, and C. pectoralis form a closely related cluster. Subsequent branching within this cluster further delineates the relationships, with C. coturnix and C. japonica demonstrating a particularly close phylogenetic affinity.
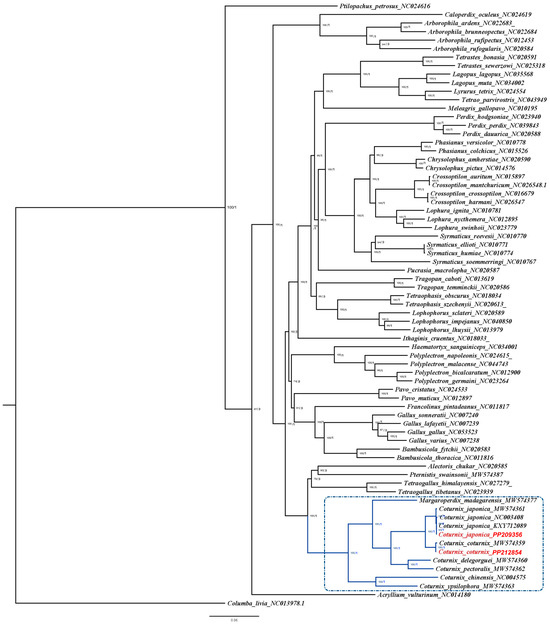
Figure 3.
Topology of maximum likelihood (ML) and Bayesian inference (BI) trees generated for the 71 Phasianidae mitogenomes used in this study. C. livia is used as the out-group to root the trees. The numbers at each node represent bootstrap values for ML analyses (0–100%) and posterior probabilities for BI analyses (0–1). Branches of Coturnix clade members are in blue and highlighted in the dotted dark blue box. The C. coturnix and C. japonica mitogenomes sequenced in this study are highlighted in red text.
3.4. Divergence Time Estimation
Using a relaxed molecular clock, the maximum clade credibility tree supported a mid-Miocene divergence of Coturnix clade members, around 13.89 Ma (HPD; highest posterior density: 10.65–17.23) (Figure 4 and Figure S9). The divergence between C. chinensis and C. ypsilophora was estimated at 8.59 Ma (HPD: 5.13–12.17). The divergence between M. madagarensis and C. coturnix, C. japonica, C. delegorguei, and C. pectoralis was estimated at 10.09 Ma (HPD: 7.10–13.10). The branches of C. coturnix and C. japonica and C. delegorguei and C. pectoralis diverged at 7.2 Ma (HPD: 4.77–9.80). While C. delegorguei and C. pectoralis diverged around 4.13 Ma (HPD: 2.15–6.34), the divergence between C. coturnix and C. japonica is the youngest within the Coturnix clade at 2.25 Ma (HPD: 1.18–3.57).

Figure 4.
BEAST maximum clade credibility tree showing divergence time estimates among Phasianidae species based on four fossil calibrations and rooted with the out-group, C. livia. Posterior probabilities are indicated only at nodes for values < 1.0 in light blue. Mean divergence time estimates are shown in black next to the nodes, and purple bars show the lower and upper bounds of the 95% highest posterior density (95% HPD) interval for the time estimates. The branches of the Coturnix clade members are in red and highlighted in a dotted red box. The crimson asterisk indicates the nodes supported by fossil calibrations.
3.5. Ancestral Range Reconstruction of Coturnix
Our biogeographic analysis determined that the BayArea-like + J model was the optimal fit for our time-calibrated ultrametric tree. In our study, the Coturnix clade, as one of the only Phasianidae genera capable of long-distance dispersal, is well represented by this model choice (Figure 5).
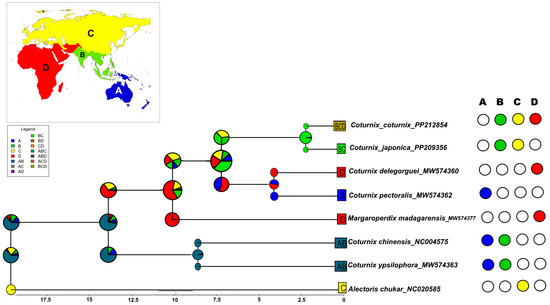
Figure 5.
The ancestral biogeographic area reconstruction estimated using the BayArea-like + J model generated in BioGeoBEARS. The BEAST maximum clade credibility tree was pruned to contain seven Coturnix and one Alectoris species (as the out-group). The estimated ancestral areas are colored according to the four zoogeographic zones: (i) A (Oceanian and Australian), (ii) B (Oriental), (iii) C (Palearctic and Sino-Japanese), and (iv) D (Saharo-Arabian, Afro-Tropical, and Madagascan). The color palette on the nodes of the chronogram shows the combination of most likely ancestral areas estimated by BioGeoBEARS. The coding scheme for each geographic area for each species, present or absent, is shown on the right of the tree. Insert: biogeographic areas used in the ancestral area reconstruction.
The most recent common ancestor (MRCA) of the Coturnix clade is inferred to have spanned the Oriental and Australian (including Oceanian) zones. Ancestors of C. chinensis and C. ypsilophora dispersed from the Oriental zone towards the Australian landmass. The remaining members of Coturnix appear to have dispersed from the Oriental zone into the Palearctic, Sino-Japanese, Saharo-Arabian, Afro-Tropical, and Madagascan zones. Our results also indicate the MRCAs of M. madagarensis and C. coturnix, C. japonica, C. delegorguei, and C. pectoralis were extant across the Oriental, Palearctic, Sino-Japanese, Saharo-Arabian, Afro-Tropical, and Madagascan zones. Subsequently, C. delegorguei and C. pectoralis might have dispersed from the Oriental zone to colonize the African and Australian landmasses, respectively. Similarly, our biogeographic reconstructions for M. madagarensis likely suggest dispersal from the Oriental to the Afro-Tropical and Madagascan zones and its subsequent endemism on Madagascar. Our findings suggest the ancestral populations of C. coturnix and C. japonica were distributed across the Oriental, Palearctic, and Sino-Japanese zones. Furthermore, we hypothesize that C. coturnix dispersed to Eurasia and Africa (central and western Palearctic, Saharo-Arabian, Afro-Tropical, and Madagascan zones), while C. japonica’s dispersion was primarily directed towards eastern Asia (eastern areas of Palearctic and Sino-Japanese zones) (Figure S10). Ancestral range estimation carried out in which the western Palaearctic and eastern Palearctic/Sino-Japanese regions were considered two separate ancestral areas, with the DEC + J model determined to be the best-fitting, also elucidated the origin of C. coturnix and C. japonica ancestors in the Oriental zone, with subsequent dispersal towards Eurasia/Africa and eastern Asia, respectively (Figure S11).
4. Discussion
4.1. Nucleotide Composition, Codon Usage, and Selection Analysis
High A-T content in the control region of the sequenced mitogenomes is predicted to aid in transcriptional and translational regulation of PCGs [53]. The arrangement of genes in and around the control region of C. japonica and C. coturnix resembles the ancestral avian gene order [54,55]. The structural features, gene arrangements, control region gene order, and A-T indices of the sequenced mitogenomes were conserved across the members of Phasianidae, including in the previously reported Coturnix mitogenomes [26,27,56]. These structural features are also highly conserved across vertebrate taxa (including Aves) [15,18,57,58]. Homogeneity in the patterns of codon, amino acid, and RSCU usage in the mitogenomes of C. japonica and C. coturnix suggests identical translational efficiency of PCGs and highly similar evolutionary pressures acting on them [59].
We used site models in CodeML (through EasyCodeML) to identify the dN/dS ratio of each PCG in the C. japonica and C. coturnix mitogenomes [60,61]. Vertebrate mitogenomes tend to remain highly conserved across speciation events [62]. Consequently, prior research on avian mitogenomes has inferred little selection pressure on individual PCGs, and our findings are consistent with these observed patterns [15,18,63,64]. Over the past two decades, multiple approaches have been developed to assess selection pressure across a phylogeny. However, the choice of algorithms is known to affect the test of selection in these approaches [65]. Hence, we used three algorithms (EasyCodeML, aBSREL, and BUSTED) to assess selection pressure across our limited Coturnix phylogeny. The branch-site model in EasyCodeML requires assignment of a foreground lineage (in this study, the Coturnix clade), whereas aBSREL and BUSTED require no prior branch assignment. All three algorithms detected highly significant evidence of episodic diversifying selection across the Coturnix lineage for the nad4 gene tree.
Previous reports on bird mitogenomes revealed that nad4 showed evidence of positive selection in Eopsaltria australis, Pygoscelis papua, and high-altitude Galliformes (Tetraophasis szechenyii, Tetraophasis obscurus, Lophurus ilhuysii, Crossoptilon crossoptilon, Perdix hodgsoniae, and Tetraogallus tibetanus) [29,66,67]. In E. australis and P. papua, positive selection was attributed to environmental adaptation or variability, whereas in high-altitude Galliformes, this selection is proposed to aid in high-altitude acclimatization. We similarly hypothesize that the nad4 gene of the Coturnix clade experienced positive selection pressure due to environmental changes and acclimatization requirements during its evolutionary history. Furthermore, our results of positive selection, supported by multiple algorithms (CodeML, aBSREL, and BUSTED), might reduce the risk of identifying false-positive signals [66]. Despite these precautions, we recognize that interpreting evolutionary signals from single mitogenomes may lead to overestimation [68]. For example, a study on primate mitogenomes presented various hypotheses for positive selection within mitochondrial genes without attributing them to a single definitive cause [65]. Nevertheless, the signs of positive selection detected within the Coturnix clade appear to be robust, and the implications of these findings may be explored in future studies.
4.2. Phylogenetics and Divergence Dating
To minimize ambiguity in nomenclature, we have adhered to the species names listed in the NCBI GenBank Taxonomy database. Specifically, the species Coturnix chinensis and Coturnix ypsilophora are the same as Synoicus chinensis and Synoicus ypsilophorus. These species are included under the term ‘members of the Coturnix clade’ throughout this study. Additionally, the generated phylogenetic trees highlight that C. coturnix, C. japonica, C. delegorguei, and C. pectoralis form a monophyletic clade for the genus Coturnix and support the replacement of C. chinensis and C. ypsilophora into the genera Excalfactoria or Synoicus [69,70]. Our phylogenetic tree mirrors the one generated in Kimball et al. [8] and is similar to the topologies of Coturnix species reported in Kimball et al. [7] and Stein et al. [10]. Moreover, our findings are also consistent with prior phylogenies derived from complete mitochondrial genomes, although these studies contained a smaller number of taxa, ranging from 22 to 39 species [26,40,71].
Our divergence dating results align closely with those reported in earlier studies by Stein et al. [10], Wang et al. [11], and Chen et al. [9], underscoring the significance of mitochondrial genome-based phylogenies, particularly when extensive resources for generating large autosomal genomic datasets are not available. The limited discrepancies observed in the divergence dates may arise from the exclusive use of mitogenomes and the limited sampling of Galliformes, including the omission of certain ‘key’ species, the inclusion of which was beyond the scope of our study [11]. Therefore, our divergence time estimation and ancestral range reconstruction discussions primarily focus on the Coturnix clade, with special attention to the relationship between C. coturnix and C. japonica.
The Miocene epoch was characterized by a warmer global climate and the emergence of kelp forests and grasslands [72]. These conditions may have provided favorable conditions for Coturnix quails to expand their range and diversify [1]. Previous researchers reconstructing the biome occupation history of Galliformes estimated the divergence of the Phasianidae occurred during the middle to late Miocene, lending credence to our results [73]. Additionally, the expansion of temperate broadleaf deciduous forests during the mid-Miocene epoch is hypothesized to have played a crucial role in facilitating the diversification and subsequent range expansion of Phasianidae, including species within the Coturnix genus [73]. Within the Phasianidae family, the divergence of C. coturnix and C. japonica represents one of the most recent diversification events within the family, with only the genus Chrysolophus showing a more recent divergence at 1.68 Ma (HPD: 0.73–2.83) (Figure 4). The diversification of C. coturnix and C. japonica is estimated to have taken place during the Pleistocene epoch of the Quaternary period, a time marked by repeated expansions and contractions [74]. Additionally, the Pleistocene was characterized by glacial periods during which ice sheets could have served as barriers or land bridges, potentially influencing the biogeographic distribution of C. coturnix and C. japonica [75,76].
4.3. Biogeography
The best-fitting BayArea-like + J model incorporates anagenetic changes and most cladogenetic processes, with the exception of subset-sympatric speciation and vicariance, while also accounting for founder-event (+J) speciation through long-distance dispersal [44,77]. This model has been effectively applied to explain the biogeographic patterns of numerous continental clades across different taxa [44,77].
Inferring from reconstructed ancestral ranges, we postulate that C. chinensis and C. ypsilophora dispersed from the Oriental zone to the Australian landmass, aided by lower sea levels and the exposure of land bridges [11,78]. The estimated divergence of C. chinensis and C. ypsilophora at approximately 8.59 Ma suggests that the possible timeframe for their long-distance dispersal events from the Oriental zone to the Australian landmass likely occurred during the late Miocene period. The initiation of bidirectional avifaunal dispersal between the Oriental zone and the Australian landmass is estimated to have commenced around the end of the Oligocene, approximately 23 Ma [78,79]. Significant dispersal of Galliformes from the Oriental zones to the Australian landmass is posited to have occurred during the later stages of the Miocene and into the Pliocene [79,80].
Overall, the findings in this study are consistent with the previous reports by Wang et al. [11] and Chen et al. [81], which documented the ancestral distribution of Phasianidae in the Oriental zone and subsequent dispersal to Africa, Eurasia, Australia, and North America. Furthermore, the divergence dates estimated within the Coturnix clade in this study, along with those reported in prior studies, suggest that global vicariance events, such as the breakup of Gondwana, far preceded the diversification of Coturnix on the geological time scale [11,82]. Instead, the biogeographic history of these species is more likely explained by range expansions and dispersal events across major landmasses. The dispersal events between the Oriental and Afro-Tropical (including Madagascan) zones have previously been reported to have taken place in both directions [11,83]. We infer that M. madagarensis dispersed from the Oriental to the Afro-Tropical and Madagascan zones by transient land bridges rather than stochastic marine events, and such a hypothesis is supported by Hosner et al. [82]. Furthermore, the recent work by Masters et al. [84] reported three transient land bridges connecting Africa and Madagascar at approximately 66–60 Ma, 36–30 Ma, and 12–05 Ma, which may have facilitated the dispersal events that contributed to Madagascar’s rich biodiversity. Considering the divergence time estimates for M. madagarensis in our study (10.09 Ma; HPD: 7.10–13.10) and its dispersal pattern, it is plausible that M. madagarensis reached Madagascar via one of these land bridges, particularly the one that was present between 12–05 Ma.
Our findings also suggest C. delegorguei and C. pectoralis might have undertaken dispersal events from the Oriental zone to colonize the African and Australian landmasses, respectively. The range reconstruction for C. delegorguei and C. pectoralis in this study reveals a pattern of disjunct distribution, reminiscent of the distribution of ratites in Australia and Africa [85].
In light of our findings and inferences from previous research, we postulate that the origins of both C. coturnix and C. japonica ancestors can be traced back to the Oriental zone [11]. Previous studies have described a pattern of bidirectional dispersal among phasianids, including movements from the Oriental to African regions, between Africa and the Palearctic, and between the Indo-Malaya/Sino-Japanese and Australian/Oceanian regions [82,83]. The ancestral range reconstructions of C. coturnix and C. japonica in our study support previously established dispersal trajectories yet reveal distinct dispersal routes for each species. In summarizing our analyses on C. coturnix and C. japonica mitogenomes, we identified: (i) similarity in gene arrangement and nucleotide composition; (ii) identical translational mechanisms (codon and amino acid usage) and selection pressure; (iii) a high degree of phylogenetic relatedness within phasianids with a relatively recent divergence; and (iv) a shared biogeographic origin with subsequent divergent dispersal patterns leading to distinct geographic distributions (Figure S10). Additionally, the previous literature indicates near identical plumage coloration, natural history, habitat types, and breeding patterns for C. coturnix and C. japonica [1,3,4,49]. In light of such evidence, we propose that interspecific interference and competitive exclusion may have played critical roles in shaping the evolutionary paths and current geographic distributions of C. coturnix and C. japonica. Recent discussions on avian evolution have highlighted the role of competition, particularly interspecific territoriality, where birds of different species vie for territory [86,87]. Previous reports suggest that interspecific territoriality is more likely to occur among closely related and recently diverged species (<5 Ma), where there is a significant overlap in ecological niches and potential for hybridization [86,87]. Particularly, Drury et al. [86] discuss patristic distance (genetic closeness) and plumage dissimilarity as key predictors of territorial disputes among closely related bird species. Interspecific territoriality is perceived as a maladaptive by-product of confusion in territorial signals (e.g., plumage, mates, and ecological niches), and the genetic basis for these signals diminishes over time due to natural selection, leading species to evolve distinct traits to minimize competition [86,87]. In the case of C. coturnix and C. japonica, their indistinguishable plumage, genetic closeness, and relatively recent common ancestry might facilitate and exacerbate interspecific territoriality. Hence, despite their common origin, the species may have adopted divergent dispersal patterns to avoid overlap and confusion in territorial signals (i.e., avoid interspecific territoriality), leading to distinct geographic distributions. Adoption of such a strategy by C. coturnix and C. japonica could have possibly evolved to circumvent possible competition for resources, mates, or habitats.
Furthermore, we propose that the dispersal routes adopted by C. coturnix and C. japonica were significantly influenced by the Tibetan Plateau. The Tibetan Plateau forms a unique geological barrier, which has affected the distribution and evolution of biodiversity in and around the region [88,89]. It has played a crucial role in enabling the intercontinental movement of various species, including substantive biotic transfer between the Indian subcontinent and Eurasia, since ~70 Ma [90]. In the context of birds, the Tibetan Plateau orchestrates the convergence of migratory paths due to its extensive geography, compelling birds to navigate around its western and eastern flanks [89,91]. Adopting divergent dispersal routes around the plateau has been identified as a reproductive barrier, leading to reduced hybridization rates and enhanced genetic differentiation among bird populations [89,91]. Consequently, the current geographic distributions of C. coturnix and C. japonica are the outcomes of their distinct dispersal strategies, primarily devised to evade interspecific territoriality and shaped by the Tibetan Plateau’s geographic constraints. Although in this study we adhered to the widely accepted convention that C. coturnix and C. japonica represent two different species despite their documented ability to hybridize in field and laboratory settings, it would be compelling to explore broader patterns of territoriality and competition between them in areas of habitat overlap and hybridized populations such as Mongolia and northeastern India [3,92,93].
5. Conclusions
Our study provides valuable insights into C. coturnix and C. japonica gene arrangement, nucleotide composition, codon usage, and selection pressures, revealing a high degree of structural conservation and similarity in translational mechanisms. Our findings align with previous studies, indicating that despite similar life history traits and genetic relatedness, C. coturnix and C. japonica have evolved distinct dispersal routes and occupy unique geographical ranges. Furthermore, the divergence time estimates suggest that Coturnix diversified during the mid-Miocene, and their current distribution appears to be a result of dispersal rather than global vicariance events. Our results also suggest that to minimize overlap and reduce interspecific competition, C. coturnix and C. japonica adopted divergent dispersal routes influenced by the geographic barrier of the Tibetan Plateau. Future research may focus on the ecological and evolutionary mechanisms underlying these dispersal patterns. Although our study is limited by the absence of extensive genomic sampling of the nuclear genome, it significantly advances our understanding of Coturnix biogeography and evolution.
Supplementary Materials
The following supporting information can be downloaded at: https://www.mdpi.com/article/10.3390/genes15060742/s1, Figure S1: Maximum likelihood tree of 79 mitogenomes used for divergence time estimates in this study. The tree is constructed using IQTREE v1.6.12, and the placement of fossils (as in Table S2) is indicated by A, B, C, and D on the tree; Figure S2: Secondary structures of the 22 tRNA genes for the Coturnix japonica mitogenome; Figure S3: Secondary structures of the 22 tRNA genes for the C. coturnix mitogenome; Figure S4: Graphical representation of (A) codon usage analysis and (B) relative synonymous codon usage (RSCU) analysis for the Coturnix japonica (blue) and C. coturnix (orange) mitogenomes sequenced in this study. The most prevalent codons for each amino acid are also indicated in the figure. Codon usage and RSCU analysis revealed identical preferences in amino acid and codon usage; Figure S5: The 13 protein-coding genes of select species of the Coturnix lineage used in this study, translated into respective amino acid sequences and aligned to study visual cues. The instances of non-synonymous substitutions in the nad4 amino acid sequence alignment are highlighted in the blue dotted box. Various parameters of amino acid alignment are mentioned below each alignment. Visual inspection of the nad4 amino acid sequence alignment shows 44 non-synonymous substitutions within the Coturnix lineage, the most frequent being alanine to threonine (n = 5); Figure S6: Heatmap of sequence divergence estimates among selected mitogenomes used in this study. The heatmap displays the estimated sequence divergence among 71 mitogenomes. Each cell in the heatmap represents the divergence score between pairs of sequences, with the color intensity indicating the degree of divergence according to the scale shown on the right. Sequences are clustered based on their phylogenetic relationships, as indicated by the dendrogram on the top and/or side of the heatmap; Figure S7: Heatmap of sequence divergence estimates among selected genera used in this study. This heatmap displays the estimated sequence divergence among 31 genera. Each cell in the heatmap represents the divergence score between pairs of genera, with the color intensity indicating the degree of divergence according to the scale shown on the right. Sequences are clustered based on their phylogenetic relationships, as indicated by the dendrogram on the top and/or side of the heatmap; Figure S8: Posterior parameters estimated from the Bayesian inference (BI) tree constructed in this study. The ESS values of each chain, marginal density, and trace of runs were captured as a screenshot; Figure S9: Posterior parameters estimated from the BEAST v2.6.7 run undertaken in this study. The ESS values of the run, marginal density, and trace of runs were captured as a screenshot; Figure S10: Geographic range of C. coturnix and C. japonica, showing extant and introduced areas of the respective species. The range of C. coturnix is highlighted in yellow and Coturnix japonica in orange. The map was adapted with permission from Birdlife International and the Handbook of the Birds of the World (2017); Figure S11: Modified ancestral biogeographic area reconstruction estimated using the DEC + J model generated in BioGeoBEARS. The BEAST maximum clade credibility tree was pruned to contain seven Coturnix and one Alectoris species (as the out-group). The estimated ancestral areas are colored according to the four zoogeographic zones as: (i) A (Oceanian and Australian), (ii) B (Oriental), (iii) C (western Palaearctic), (iv) D (Saharo-Arabian, Afro-Tropical, and Madagascan), and (iv) E (eastern Palearctic and Sino-Japanese). The color palette on the nodes of the chronogram shows the combination of most likely ancestral areas estimated by BioGeoBEARS. The coding scheme for each geographic area for each species, present or absent, is shown on the right of the tree. Insert: biogeographic areas used in the ancestral area reconstruction. Table S1: List of all mitogenomes downloaded from NCBI and used for investigations in this study; Table S2: Fossils used for time-calibrating the Phasianidae phylogeny. Records are adapted from published Galliformes reports that best suited our dataset [9,11,42]; Table S3: Structural features and annotation of the C. coturnix mitogenome sequenced in this study; Table S4: Structural features and annotation of the Coturnix japonica mitogenome sequenced in this study; Table S5: Nucleotide composition of the C. coturnix mitogenome; Table S6: Nucleotide composition of the C. japonica mitogenome.
Author Contributions
Conceptualization, R.P.S., B.S.P. and K.-P.K.; Methodology, R.P.S., P.D. and K.-P.K.; Software, P.D. and K.-P.K.; Formal Analysis, P.D., S.D.R. and K.-P.K.; Investigation, P.D., S.D.R., V.H.S.K., B.S.P., K.-P.K. and R.P.S.; Resources, R.P.S., B.S.P. and K.-P.K.; Data Curation, P.D. and K.-P.K.; Writing—Original Draft Preparation, P.D., B.S.P., K.-P.K. and R.P.S.; Writing—Review and Editing, P.D., B.S.P., K.-P.K., S.D.R., V.H.S.K. and R.P.S.; Visualization, P.D. and K.-P.K.; Supervision, R.P.S., B.S.P. and K.-P.K.; Project Administration, R.P.S. and B.S.P.; Funding Acquisition, R.P.S., P.D., B.S.P. and K.-P.K. All authors have read and agreed to the published version of the manuscript.
Funding
The research was funded by the Ministry of Environment, Forests, and Climate Change, Government of India. Prateek Dey was supported by the Fulbright-Nehru Doctoral Research Grant (2901/FNDR/2023-2024).
Institutional Review Board Statement
No live animals were used for sampling or data generation. Necessary permission from respective forest departments (Maharashtra Forest Department permission no.: Desk-22(8)/Research/CR-8(18-19)/875/2018-19) was obtained for tissue collection efforts from road-killed animals.
Informed Consent Statement
Not applicable.
Data Availability Statement
The associated BioProject, BioSample, and SRA numbers for C. coturnix whole genome reads are PRJNA1069095, SAMN39610750, and SRR27727407, respectively. The associated BioProject, BioSample, and SRA numbers for C. japonica whole genome reads are PRJNA840867, SAMN28561720, and SRR19344531, respectively. Mitogenomes assembled from C. coturnix and C. japonica whole genome reads are stored under accession codes PP212854 and PP209356, respectively.
Acknowledgments
We are thankful to Syed Bilal Ali, veterinarian at Transit Treatment Centre, Nagpur, Maharashtra, for his help collecting biological samples.
Conflicts of Interest
The authors declare no conflicts of interest.
References
- Johnsgard, P.A. The Quails, Partridges, and Francolins of the World; Oxford University Press: Oxford, UK, 1988; ISBN 978-0-19-857193-3. [Google Scholar]
- Sanchez-Donoso, I.; Ravagni, S.; Rodríguez-Teijeiro, J.D.; Christmas, M.J.; Huang, Y.; Maldonado-Linares, A.; Puigcerver, M.; Jiménez-Blasco, I.; Andrade, P.; Gonçalves, D.; et al. Massive Genome Inversion Drives Coexistence of Divergent Morphs in Common Quails. Curr. Biol. 2022, 32, 462–469.e6. [Google Scholar] [CrossRef] [PubMed]
- McGowan, P.J.K.; Kirwan, G.M. Japanese Quail (Coturnix japonica), Version 1.0. Birds World 2020. [Google Scholar] [CrossRef]
- McGowan, P.J.K.; Kirwan, G.M.; de Juana, E.; Boesman, P.F.D. Common Quail (Coturnix coturnix), Version 1.1. Birds World 2023. [Google Scholar] [CrossRef]
- Duchêne, S.; Archer, F.I.; Vilstrup, J.; Caballero, S.; Morin, P.A. Mitogenome Phylogenetics: The Impact of Using Single Regions and Partitioning Schemes on Topology, Substitution Rate and Divergence Time Estimation. PLoS ONE 2011, 6, e27138. [Google Scholar] [CrossRef]
- Zang, W.; Jiang, Z.; Ericson, P.G.P.; Song, G.; Drovetski, S.V.; Saitoh, T.; Lei, F.; Qu, Y. Evolutionary Relationships of Mitogenomes in a Recently Radiated Old World Avian Family. Avian Res. 2023, 14, 100097. [Google Scholar] [CrossRef]
- Kimball, R.T.; Hosner, P.A.; Braun, E.L. A Phylogenomic Supermatrix of Galliformes (Landfowl) Reveals Biased Branch Lengths. Mol. Phylogenet. Evol. 2021, 158, 107091. [Google Scholar] [CrossRef]
- Kimball, R.T.; Guido, M.; Hosner, P.A.; Braun, E.L. When Good Mitochondria Go Bad: Cyto-Nuclear Discordance in Landfowl (Aves: Galliformes). Gene 2021, 801, 145841. [Google Scholar] [CrossRef] [PubMed]
- Chen, D.; Hosner, P.A.; Dittmann, D.L.; O’Neill, J.P.; Birks, S.M.; Braun, E.L.; Kimball, R.T. Divergence Time Estimation of Galliformes Based on the Best Gene Shopping Scheme of Ultraconserved Elements. BMC Ecol. Evol. 2021, 21, 209. [Google Scholar] [CrossRef]
- Stein, R.W.; Brown, J.W.; Mooers, A.Ø. A Molecular Genetic Time Scale Demonstrates Cretaceous Origins and Multiple Diversification Rate Shifts within the Order Galliformes (Aves). Mol. Phylogenet. Evol. 2015, 92, 155–164. [Google Scholar] [CrossRef]
- Wang, N.; Kimball, R.T.; Braun, E.L.; Liang, B.; Zhang, Z. Ancestral Range Reconstruction of Galliformes: The Effects of Topology and Taxon Sampling. J. Biogeogr. 2017, 44, 122–135. [Google Scholar] [CrossRef]
- Grimmett, R.; Inskipp, C.; Inskipp, T. Birds of the Indian Subcontinent: India, Pakistan, Sri Lanka, Nepal, Bhutan, Bangladesh and the Maldives; Bloomsbury Publishing: London, UK, 2016; ISBN 978-1-4081-6265-1. [Google Scholar]
- Sambrook, J. Molecular Cloning: A Laboratory Manual. Vol. 3; Cold Spring Harbor: Long Island, NY, USA, 1989; ISBN 978-0-87969-577-4. [Google Scholar]
- Dey, P.; Ray, S.D.; Manchi, S.; Pramod, P.; Kochiganti, V.H.S.; Singh, R.P. Whole Genome Sequencing and Microsatellite Motif Discovery of Farmed Japanese Quail (Coturnix japonica): A First Record from India. Proc. Indian Natl. Sci. Acad. 2022, 88, 688–695. [Google Scholar] [CrossRef]
- Dey, P.; Sharma, S.K.; Sarkar, I.; Ray, S.D.; Pramod, P.; Kochiganti, V.H.S.; Quadros, G.; Rathore, S.S.; Singh, V.; Singh, R.P. Complete Mitogenome of Endemic Plum-Headed Parakeet Psittacula Cyanocephala-Characterization and Phylogenetic Analysis. PLoS ONE 2021, 16, e0241098. [Google Scholar] [CrossRef] [PubMed]
- Dey, P.; Ray, S.D.; Pramod, P.; Singh, R.P. Dataset from Genome Sequencing, Assembly and Mining of Microsatellite Markers in Barred-Button Quail (Turnix Suscitator). Data Brief. 2023, 48, 109288. [Google Scholar] [CrossRef] [PubMed]
- Mondal, T.; Dey, P.; Kumari, D.; Ray, S.D.; Quadros, G.; Sastry Kochiganti, V.H.; Singh, R.P. Genome Survey Sequencing and Mining of Genome-Wide Microsatellite Markers in Yellow-Billed Babbler (Turdoides affinis). Heliyon 2023, 9, e12735. [Google Scholar] [CrossRef] [PubMed]
- Ray, S.D.; Dey, P.; Sarkar, I.; Sharma, S.K.; Quadros, G.; Pramod, P.; Kochiganti, V.H.S.; Singh, R.P. Complete Mitogenome of Common Myna (Acridotheres tristis)–Characterization and Phylogenetic Implications. Biologia 2023, 78, 1079–1091. [Google Scholar] [CrossRef]
- Nishibori, M.; Hayashi, T.; Tsudzuki, M.; Yamamoto, Y.; Yasue, H. Complete Sequence of the Japanese Quail (Coturnix japonica) Mitochondrial Genome and Its Genetic Relationship with Related Species. Anim. Genet. 2001, 32, 380–385. [Google Scholar] [CrossRef] [PubMed]
- Chan, P.P.; Lin, B.Y.; Mak, A.J.; Lowe, T.M. tRNAscan-SE 2.0: Improved Detection and Functional Classification of Transfer RNA Genes. Nucleic Acids Res. 2021, 49, 9077–9096. [Google Scholar] [CrossRef] [PubMed]
- Artimo, P.; Jonnalagedda, M.; Arnold, K.; Baratin, D.; Csardi, G.; de Castro, E.; Duvaud, S.; Flegel, V.; Fortier, A.; Gasteiger, E.; et al. ExPASy: SIB Bioinformatics Resource Portal. Nucleic Acids Res. 2012, 40, W597–W603. [Google Scholar] [CrossRef] [PubMed]
- Perna, N.T.; Kocher, T.D. Patterns of Nucleotide Composition at Fourfold Degenerate Sites of Animal Mitochondrial Genomes. J. Mol. Evol. 1995, 41, 353–358. [Google Scholar] [CrossRef]
- Grant, J.R.; Enns, E.; Marinier, E.; Mandal, A.; Herman, E.K.; Chen, C.-Y.; Graham, M.; Van Domselaar, G.; Stothard, P. Proksee: In-Depth Characterization and Visualization of Bacterial Genomes. Nucleic Acids Res. 2023, 51, W484–W492. [Google Scholar] [CrossRef]
- Puigbò, P.; Bravo, I.G.; Garcia-Vallve, S. CAIcal: A Combined Set of Tools to Assess Codon Usage Adaptation. Biol. Direct 2008, 3, 38. [Google Scholar] [CrossRef]
- Yang, Z. PAML: A Program Package for Phylogenetic Analysis by Maximum Likelihood. Bioinformatics 1997, 13, 555–556. [Google Scholar] [CrossRef] [PubMed]
- Shen, Y.-Y.; Liang, L.; Sun, Y.-B.; Yue, B.-S.; Yang, X.-J.; Murphy, R.W.; Zhang, Y.-P. A Mitogenomic Perspective on the Ancient, Rapid Radiation in the Galliformes with an Emphasis on the Phasianidae. BMC Evol. Biol. 2010, 10, 132. [Google Scholar] [CrossRef]
- Nishibori, M.; Tsudzuki, M.; Hayashi, T.; Yamamoto, Y.; Yasue, H. Complete Nucleotide Sequence of the Coturnix Chinensis (Blue-Breasted Quail) Mitochondorial Genome and a Phylogenetic Analysis With Related Species. J. Hered. 2002, 93, 439–444. [Google Scholar] [CrossRef]
- An, B.; Zhang, L.; Ruan, L.; Liu, N.; Zhang, Z.; Abutalip, A.; Suo, Y. The Complete Mitochondrial Genome of Himalayan Snowcock (Tetraogallus himalayensis). Mitochondrial DNA Part. A 2016, 27, 3751–3752. [Google Scholar] [CrossRef]
- Zhou, T.; Shen, X.; Irwin, D.M.; Shen, Y.; Zhang, Y. Mitogenomic Analyses Propose Positive Selection in Mitochondrial Genes for High-Altitude Adaptation in Galliform Birds. Mitochondrion 2014, 18, 70–75. [Google Scholar] [CrossRef]
- Nguyen, L.-T.; Schmidt, H.A.; von Haeseler, A.; Minh, B.Q. IQ-TREE: A Fast and Effective Stochastic Algorithm for Estimating Maximum-Likelihood Phylogenies. Mol. Biol. Evol. 2015, 32, 268–274. [Google Scholar] [CrossRef] [PubMed]
- Gao, F.; Chen, C.; Arab, D.A.; Du, Z.; He, Y.; Ho, S.Y.W. EasyCodeML: A Visual Tool for Analysis of Selection Using CodeML. Ecol. Evol. 2019, 9, 3891–3898. [Google Scholar] [CrossRef] [PubMed]
- Weaver, S.; Shank, S.D.; Spielman, S.J.; Li, M.; Muse, S.V.; Kosakovsky Pond, S.L. Datamonkey 2.0: A Modern Web Application for Characterizing Selective and Other Evolutionary Processes. Mol. Biol. Evol. 2018, 35, 773–777. [Google Scholar] [CrossRef]
- Smith, M.D.; Wertheim, J.O.; Weaver, S.; Murrell, B.; Scheffler, K.; Kosakovsky Pond, S.L. Less Is More: An Adaptive Branch-Site Random Effects Model for Efficient Detection of Episodic Diversifying Selection. Mol. Biol. Evol. 2015, 32, 1342–1353. [Google Scholar] [CrossRef]
- Murrell, B.; Weaver, S.; Smith, M.D.; Wertheim, J.O.; Murrell, S.; Aylward, A.; Eren, K.; Pollner, T.; Martin, D.P.; Smith, D.M.; et al. Gene-Wide Identification of Episodic Selection. Mol. Biol. Evol. 2015, 32, 1365–1371. [Google Scholar] [CrossRef] [PubMed]
- Madeira, F.; Pearce, M.; Tivey, A.R.N.; Basutkar, P.; Lee, J.; Edbali, O.; Madhusoodanan, N.; Kolesnikov, A.; Lopez, R. Search and Sequence Analysis Tools Services from EMBL-EBI in 2022. Nucleic Acids Res. 2022, 50, W276–W279. [Google Scholar] [CrossRef]
- Kumar, S.; Stecher, G.; Li, M.; Knyaz, C.; Tamura, K. MEGA X: Molecular Evolutionary Genetics Analysis across Computing Platforms. Mol. Biol. Evol. 2018, 35, 1547–1549. [Google Scholar] [CrossRef] [PubMed]
- Kalyaanamoorthy, S.; Minh, B.Q.; Wong, T.K.F.; von Haeseler, A.; Jermiin, L.S. ModelFinder: Fast Model Selection for Accurate Phylogenetic Estimates. Nat. Methods 2017, 14, 587–589. [Google Scholar] [CrossRef]
- Ronquist, F.; Teslenko, M.; van der Mark, P.; Ayres, D.L.; Darling, A.; Höhna, S.; Larget, B.; Liu, L.; Suchard, M.A.; Huelsenbeck, J.P. MrBayes 3.2: Efficient Bayesian Phylogenetic Inference and Model Choice Across a Large Model Space. Syst. Biol. 2012, 61, 539–542. [Google Scholar] [CrossRef]
- Rambaut, A.; Drummond, A.J.; Xie, D.; Baele, G.; Suchard, M.A. Posterior Summarization in Bayesian Phylogenetics Using Tracer 1.7. Syst. Biol. 2018, 67, 901–904. [Google Scholar] [CrossRef]
- Kan, X.-Z.; Yang, J.-K.; Li, X.-F.; Chen, L.; Lei, Z.-P.; Wang, M.; Qian, C.-J.; Gao, H.; Yang, Z.-Y. Phylogeny of Major Lineages of Galliform Birds (Aves: Galliformes) Based on Complete Mitochondrial Genomes. Genet. Mol. Res. 2010, 9, 1625–1633. [Google Scholar] [CrossRef]
- Rambaut, A. FigTree 2010. Available online: http://tree.bio.ed.ac.uk/software/figtree/ (accessed on 29 May 2024).
- Hosner, P.A.; Braun, E.L.; Kimball, R.T. Rapid and Recent Diversification of Curassows, Guans, and Chachalacas (Galliformes: Cracidae) out of Mesoamerica: Phylogeny Inferred from Mitochondrial, Intron, and Ultraconserved Element Sequences. Mol. Phylogenet Evol. 2016, 102, 320–330. [Google Scholar] [CrossRef] [PubMed]
- Bouckaert, R.; Vaughan, T.G.; Barido-Sottani, J.; Duchêne, S.; Fourment, M.; Gavryushkina, A.; Heled, J.; Jones, G.; Kühnert, D.; Maio, N.D.; et al. BEAST 2.5: An Advanced Software Platform for Bayesian Evolutionary Analysis. PLoS Comput. Biol. 2019, 15, e1006650. [Google Scholar] [CrossRef]
- Matzke, N.J. Model Selection in Historical Biogeography Reveals That Founder-Event Speciation Is a Crucial Process in Island Clades. Syst. Biol. 2014, 63, 951–970. [Google Scholar] [CrossRef]
- R Core Team. R: The R Project for Statistical Computing; R Core Team: Vienna, Austria, 2020; Available online: https://www.r-project.org/ (accessed on 24 April 2024).
- Paradis, E.; Claude, J.; Strimmer, K. APE: Analyses of Phylogenetics and Evolution in R Language. Bioinformatics 2004, 20, 289–290. [Google Scholar] [CrossRef] [PubMed]
- Revell, L.J. Phytools: An R Package for Phylogenetic Comparative Biology (and Other Things). Methods Ecol. Evol. 2012, 3, 217–223. [Google Scholar] [CrossRef]
- Holt, B.G.; Lessard, J.-P.; Borregaard, M.K.; Fritz, S.A.; Araújo, M.B.; Dimitrov, D.; Fabre, P.-H.; Graham, C.H.; Graves, G.R.; Jønsson, K.A.; et al. An Update of Wallace’s Zoogeographic Regions of the World. Science 2013, 339, 74–78. [Google Scholar] [CrossRef] [PubMed]
- Billerman, S.; Keeney, B.; Rodewald, P.; Schulkenberg, T. Birds of the World (2022)-Comprehensive Life Histories for All Bird Species and Families. Available online: https://birdsoftheworld.org/bow/home (accessed on 24 April 2024).
- Clark, J.R.; Ree, R.H.; Alfaro, M.E.; King, M.G.; Wagner, W.L.; Roalson, E.H. A Comparative Study in Ancestral Range Reconstruction Methods: Retracing the Uncertain Histories of Insular Lineages. Syst. Biol. 2008, 57, 693–707. [Google Scholar] [CrossRef] [PubMed]
- Ronquist, F. Dispersal-Vicariance Analysis: A New Approach to the Quantification of Historical Biogeography. Syst. Biol. 1997, 46, 195–203. [Google Scholar] [CrossRef]
- Landis, M.J.; Matzke, N.J.; Moore, B.R.; Huelsenbeck, J.P. Bayesian Analysis of Biogeography When the Number of Areas Is Large. Syst. Biol. 2013, 62, 789–804. [Google Scholar] [CrossRef] [PubMed]
- Bronstein, O.; Kroh, A.; Haring, E. Mind the Gap! The Mitochondrial Control Region and Its Power as a Phylogenetic Marker in Echinoids. BMC Evol. Biol. 2018, 18, 80. [Google Scholar] [CrossRef] [PubMed]
- Desjardins, P.; Morais, R. Sequence and Gene Organization of the Chicken Mitochondrial Genome. A Novel Gene Order in Higher Vertebrates. J. Mol. Biol. 1990, 212, 599–634. [Google Scholar] [CrossRef] [PubMed]
- Gibb, G.C.; Kardailsky, O.; Kimball, R.T.; Braun, E.L.; Penny, D. Mitochondrial Genomes and Avian Phylogeny: Complex Characters and Resolvability without Explosive Radiations. Mol. Biol. Evol. 2007, 24, 269–280. [Google Scholar] [CrossRef]
- Liu, G.; Zhang, Y. Next-Generation Resequencing the Complete Mitochondrial Genome of Japanese Quail (Coturnix japonica). Mitochondrial DNA Part B 2016, 1, 937–938. [Google Scholar] [CrossRef]
- Adawaren, E.O.; Du Plessis, M.; Suleman, E.; Kindler, D.; Oosthuizen, A.O.; Mukandiwa, L.; Naidoo, V. The Complete Mitochondrial Genome of Gyps coprotheres (Aves, Accipitridae, Accipitriformes): Phylogenetic Analysis of Mitogenome among Raptors. PeerJ 2020, 8, e10034. [Google Scholar] [CrossRef] [PubMed]
- Lan, G.; Yu, J.; Liu, J.; Zhang, Y.; Ma, R.; Zhou, Y.; Zhu, B.; Wei, W.; Liu, J.; Qi, G. Complete Mitochondrial Genome and Phylogenetic Analysis of Tarsiger indicus (Aves: Passeriformes: Muscicapidae). Genes 2024, 15, 90. [Google Scholar] [CrossRef] [PubMed]
- Parvathy, S.T.; Udayasuriyan, V.; Bhadana, V. Codon Usage Bias. Mol. Biol. Rep. 2022, 49, 539–565. [Google Scholar] [CrossRef] [PubMed]
- Yang, Z.; Nielsen, R. Codon-Substitution Models for Detecting Molecular Adaptation at Individual Sites Along Specific Lineages. Mol. Biol. Evol. 2002, 19, 908–917. [Google Scholar] [CrossRef] [PubMed]
- Yang, Z. PAML 4: Phylogenetic Analysis by Maximum Likelihood. Mol. Biol. Evol. 2007, 24, 1586–1591. [Google Scholar] [CrossRef] [PubMed]
- Rheindt, F.E.; Edwards, S.V. Genetic Introgression: An Integral but Neglected Component of Speciation in Birds. Ornithology 2011, 128, 620–632. [Google Scholar] [CrossRef]
- Hu, C.; Zhang, C.; Sun, L.; Zhang, Y.; Xie, W.; Zhang, B.; Chang, Q. The Mitochondrial Genome of Pin-Tailed Snipe Gallinago Stenura, and Its Implications for the Phylogeny of Charadriiformes. PLoS ONE 2017, 12, e0175244. [Google Scholar] [CrossRef] [PubMed]
- Chen, W.; Zhang, C.; Pan, T.; Liu, W.; Li, K.; Hu, C.; Chang, Q. The Mitochondrial Genome of the Kentish Plover Charadrius alexandrinus (Charadriiformes: Charadriidae) and Phylogenetic Analysis of Charadrii. Genes Genom. 2018, 40, 955–963. [Google Scholar] [CrossRef] [PubMed]
- Menezes, A.N.; Viana, M.C.; Furtado, C.; Schrago, C.G.; Seuánez, H.N. Positive Selection along the Evolution of Primate Mitogenomes. Mitochondrion 2013, 13, 846–851. [Google Scholar] [CrossRef]
- Morales, H.E.; Pavlova, A.; Joseph, L.; Sunnucks, P. Positive and Purifying Selection in Mitochondrial Genomes of a Bird with Mitonuclear Discordance. Mol. Ecol. 2015, 24, 2820–2837. [Google Scholar] [CrossRef]
- Noll, D.; Leon, F.; Brandt, D.; Pistorius, P.; Le Bohec, C.; Bonadonna, F.; Trathan, P.N.; Barbosa, A.; Rey, A.R.; Dantas, G.P.M.; et al. Positive Selection over the Mitochondrial Genome and Its Role in the Diversification of Gentoo Penguins in Response to Adaptation in Isolation. Sci. Rep. 2022, 12, 3767. [Google Scholar] [CrossRef] [PubMed]
- Zwonitzer, K.D.; Iverson, E.N.K.; Sterling, J.E.; Weaver, R.J.; Maclaine, B.A.; Havird, J.C. Disentangling Positive Selection from Relaxed Selection in Animal Mitochondrial Genomes. Am. Nat. 2023, 202, E121–E129. [Google Scholar] [CrossRef] [PubMed]
- McGowan, P.J.K.; Kirwan, G.M. Blue-Breasted Quail (Synoicus chinensis), Version 1.0. Birds World 2020. [Google Scholar] [CrossRef]
- McGowan, P.J.K.; Kirwan, G.M. Brown Quail (Synoicus ypsilophorus), Version 1.0. Birds World 2020. [Google Scholar] [CrossRef]
- Shen, Y.-Y.; Dai, K.; Cao, X.; Murphy, R.W.; Shen, X.-J.; Zhang, Y.-P. The Updated Phylogenies of the Phasianidae Based on Combined Data of Nuclear and Mitochondrial DNA. PLoS ONE 2014, 9, e95786. [Google Scholar] [CrossRef] [PubMed]
- Behrensmeyer, A.K. Terrestrial Ecosystems through Time: Evolutionary Paleoecology of Terrestrial Plants and Animals; University of Chicago Press: Chicago, IL, USA, 1992. [Google Scholar]
- Pelegrin, J.S.; Cantalapiedra, J.L.; Gamboa, S.; Menéndez, I.; Hernández Fernández, M. Phylogenetic Biome Conservatism as a Key Concept for an Integrative Understanding of Evolutionary History: Galliformes and Falconiformes as Study Cases. Zool. J. Linn. Soc. 2023, 198, 47–71. [Google Scholar] [CrossRef]
- Nadachowska-Brzyska, K.; Li, C.; Smeds, L.; Zhang, G.; Ellegren, H. Temporal Dynamics of Avian Populations during Pleistocene Revealed by Whole-Genome Sequences. Curr. Biol. 2015, 25, 1375–1380. [Google Scholar] [CrossRef] [PubMed]
- Claramunt, S.; Cracraft, J. A New Time Tree Reveals Earth History’s Imprint on the Evolution of Modern Birds. Sci. Adv. 2015, 1, e1501005. [Google Scholar] [CrossRef] [PubMed]
- Willeit, M.; Ganopolski, A.; Calov, R.; Brovkin, V. Mid-Pleistocene Transition in Glacial Cycles Explained by Declining CO2 and Regolith Removal. Sci. Adv. 2019, 5, eaav7337. [Google Scholar] [CrossRef]
- Matzke, N. Probabilistic Historical Biogeography: New Models for Founder-Event Speciation, Imperfect Detection, and Fossils Allow Improved Accuracy and Model-Testing. Front. Biogeogr. 2013, 5, 242–248. [Google Scholar] [CrossRef]
- Hall, R. The Plate Tectonics of Cenozoic SE Asia and the Distribution of Land and Sea. In Biogeography and Geological Evolution of SE Asia; Backhuys Publishers: Leiden, The Netherlands, 1998. [Google Scholar]
- Sheldon, F.H.; Lim, H.C.; Moyle, R.G. Return to the Malay Archipelago: The Biogeography of Sundaic Rainforest Birds. J. Ornithol. 2015, 156, 91–113. [Google Scholar] [CrossRef]
- Stein, R.W. Multistage Scenarios for the Evolution of Polymorphisms in Birds. Ph.D. Thesis, Simon Fraser University, Burnaby, BC, USA, 2013. [Google Scholar]
- Chen, Y. On the Historical Biogeography of Global Galliformes: Ancestral Range and Diversification Patterns. Avian Res. 2014, 5, 3. [Google Scholar] [CrossRef]
- Hosner, P.A.; Tobias, J.A.; Braun, E.L.; Kimball, R.T. How Do Seemingly Non-Vagile Clades Accomplish Trans-Marine Dispersal? Trait and Dispersal Evolution in the Landfowl (Aves: Galliformes). Proc. R. Soc. B Biol. Sci. 2017, 284, 20170210. [Google Scholar] [CrossRef] [PubMed]
- Crowe, T.M.; Bowie, R.C.K.; Bloomer, P.; Mandiwana, T.G.; Hedderson, T.A.J.; Randi, E.; Pereira, S.L.; Wakeling, J. Phylogenetics, Biogeography and Classification of, and Character Evolution in, Gamebirds (Aves: Galliformes): Effects of Character Exclusion, Data Partitioning and Missing Data. Cladistics 2006, 22, 495–532. [Google Scholar] [CrossRef] [PubMed]
- Masters, J.C.; Génin, F.; Zhang, Y.; Pellen, R.; Huck, T.; Mazza, P.P.A.; Rabineau, M.; Doucouré, M.; Aslanian, D. Biogeographic Mechanisms Involved in the Colonization of Madagascar by African Vertebrates: Rifting, Rafting and Runways. J. Biogeogr. 2021, 48, 492–510. [Google Scholar] [CrossRef]
- Sanmartín, I. Historical Biogeography: Evolution in Time and Space. Evol. Educ. Outreach 2012, 5, 555–568. [Google Scholar] [CrossRef]
- Drury, J.P.; Cowen, M.C.; Grether, G.F. Competition and Hybridization Drive Interspecific Territoriality in Birds. Proc. Natl. Acad. Sci. USA 2020, 117, 12923–12930. [Google Scholar] [CrossRef] [PubMed]
- Guillaumet, A.; Russell, I.J. Bird Communities in a Changing World: The Role of Interspecific Competition. Diversity 2022, 14, 857. [Google Scholar] [CrossRef]
- Deng, T.; Wu, F.; Zhou, Z.; Su, T. Tibetan Plateau: An Evolutionary Junction for the History of Modern Biodiversity. Sci. China Earth Sci. 2020, 63, 172–187. [Google Scholar] [CrossRef]
- Scordato, E.S.C.; Smith, C.C.R.; Semenov, G.A.; Liu, Y.; Wilkins, M.R.; Liang, W.; Rubtsov, A.; Sundev, G.; Koyama, K.; Turbek, S.P.; et al. Migratory Divides Coincide with Reproductive Barriers across Replicated Avian Hybrid Zones above the Tibetan Plateau. Ecol. Lett. 2020, 23, 231–241. [Google Scholar] [CrossRef]
- Klaus, S.; Morley, R.J.; Plath, M.; Zhang, Y.-P.; Li, J.-T. Biotic Interchange between the Indian Subcontinent and Mainland Asia through Time. Nat. Commun. 2016, 7, 12132. [Google Scholar] [CrossRef] [PubMed]
- Greenberg, R.; Marra, P.P. Birds of Two Worlds: The Ecology and Evolution of Migration; JHU Press: Baltimore, MD, USA, 2005; ISBN 978-0-8018-8107-7. [Google Scholar]
- Barilani, M.; Deregnaucourt, S.; Gallego, S.; Galli, L.; Mucci, N.; Piombo, R.; Puigcerver, M.; Rimondi, S.; Rodríguez-Teijeiro, J.; Spanò, S.; et al. Detecting hybridization in wild (Coturnix c. coturnix) and domesticated (Coturnix c. japonica) quail populations. Biol. Conserv. 2005, 126, 445–455. [Google Scholar] [CrossRef]
- Chazara, O.; Minvielle, F.; Roux, D.; Bed’hom, B.; Feve, K.; Coville, J.-L.; Kayang, B.B.; Lumineau, S.; Vignal, A.; Boutin, J.-M.; et al. Evidence for introgressive hybridization of wild common quail (Coturnix coturnix) by domesticated Japanese quail (Coturnix japonica) in France. Conserv. Genet. 2010, 11, 1051–1062. [Google Scholar] [CrossRef]
Disclaimer/Publisher’s Note: The statements, opinions and data contained in all publications are solely those of the individual author(s) and contributor(s) and not of MDPI and/or the editor(s). MDPI and/or the editor(s) disclaim responsibility for any injury to people or property resulting from any ideas, methods, instructions or products referred to in the content. |
© 2024 by the authors. Licensee MDPI, Basel, Switzerland. This article is an open access article distributed under the terms and conditions of the Creative Commons Attribution (CC BY) license (https://creativecommons.org/licenses/by/4.0/).