Article

Genomic Characterization of Quality Wool Traits in Spanish Merino Sheep

1
MERAGEM Research Group, Department of Genetics, University of Córdoba, CN IV KM 396, 17071 Córdoba, Spain
2
National Association of Merino Sheep Breeders (ACME), 28007 Madrid, Spain
3
Agriculture, Livestock and Fisheries Research Institute (IFAPA), 14270 Cordoba, Spain
4
Center of Selection and Reproduction Animals (CENSYRA), 06007 Badajoz, Spain
*
Author to whom correspondence should be addressed.
Genes 2024, 15(6), 795; https://doi.org/10.3390/genes15060795
Submission received: 15 May 2024 / Revised: 12 June 2024 / Accepted: 13 June 2024 / Published: 17 June 2024
(This article belongs to the Section Animal Genetics and Genomics)

Abstract

:
The native Spanish Merino breed was the founder of all the other Merino and Merino-derived breeds worldwide. Despite the fact that this breed was created and improved to produce the highest quality fine wool, the global wool market crisis led to the wholescale crossing of most of the herds with breeds for meat purposes. Nevertheless, there are still some purebred animals with a high potential for producing quality wool. The objective of this study was to characterize the current wool quality of the breed and identify genes associated with these parameters. To achieve this, over 12,800 records from the most representative animals of the breed (registered in the herd book) were analyzed using the Australian OFDA 2000 system, for parameters such as fiber diameter (FD), standard deviation (SD), coefficient of variation (CV), fibers over 15 microns (>15%), staple length (SL), and comfort factor (CRV). Additionally, animals with the most extreme FD values were whole-genome sequenced using NGS. Genome-wide association studies (GWAS) determined the association of 74 variants with the different traits studied, which were located in 70 different genes. Of these genes, EDN2, COL18A1, and LRP1B, associated with fibers over 15%, and FGF12 and ADAM17, associated with SL, play a key role in hair follicle growth and development. Our study reveals the great potential for recovering this breed for fine wool production, and identifies five candidate genes whose understanding may aid in that selection process.

1. Introduction

Genomic studies have confirmed that the Spanish Merino sheep is the origin of all other Merino and Merino-derived breeds worldwide [1,2]. The origin of the breed dates back to Roman times in the Iberian Peninsula, through the improvement of native sheep to obtain animals with a white fleece and fine wool, showing that, from the very beginning, the breed was focused on producing high-quality wool [3].
For centuries, the Spanish Merino population was not affected by any external influences, and its special wool purpose was kept up until the middle of the 20th century when, due to the world wool crisis, many breeders crossed their sheep with other foreign breeds with greater meat production such as Merino Precoce, Fleischschaf, Landschaf, or Île de France, among others, in order to produce animals with this dual use, like the Australian Merino [4,5]. The increase in meat production through this crossbreeding process led to a decrease in the quality of wool in the population, leading to the eventual disappearance of some herds whose sole objective was wool production [6].
To date, only a few breeders have retained practically uncrossed herds, which show the morpho-structural and genomic characteristic of the ancestral population, and therefore its excellent wool quality. Some of these herds have been maintained through closed inbreeding for many generations, resulting in the formation of well-defined genetic lines, which can be clearly distinguished from the undifferentiated animals with phenotypes closer to Merino (Merino type) [7,8,9,10].
For these reasons, there are currently about 3.2 million Spanish Merino-type sheep, of which only 130,000 individuals are registered as purebred in the breed register by the National Association of Merino Sheep Breeders (ACME) [11]. Due to the high number of crossbred ewes of different degrees, wool quality varies greatly between herds and only those herds that have remained purebred retain homogeneously high levels of quality. One common practice consists of blending high-quality wool sourced from purebred Merino sheep with standard-quality wool from other crossbred Spanish sheep, resulting in a devaluation of these superior fleeces and a subsequent decrease in wool prices. Furthermore, the Spanish Merino production system remains largely extensive, with animals raised in mountain pastures or in the unique Iberian habitat known as the “Dehesa”, under semi-free conditions. Consequently, the promotion of wool quality as a premium product is intricately linked to the preservation of the pasture and/or mountain ecosystems in which the animals are raised.
Since 2016, the National Association of Merino Sheep Breeders has promoted the revaluation of wool by incorporating it as an objective in the breed’s improvement plan. In this context, a wool quality control organization was set up, in which about 7000 fleeces are analyzed per year. However, the aim is to go further, and actively search for DNA variations located within or near genes used in marker-assisted selection. Therefore, although genomic tools have already been used to search for genes related to wool quality in some breeds, this is, to the best of our knowledge, the first work carried out in the pure Spanish Merino breed. In addition, our study is the first genomic study in this breed to use NGS approaches. To achieve this, low coverage NGS at a depth of 4x was shown to be a useful, accurate, and reliable tool for detecting polymorphic sites, inferring genotypes [12], or conducting population assays [13].
The aims of the present work were therefore to (i) characterize the current wool traits of pure Spanish Merino sheep; and (ii) search for genes related to the wool quality parameters studied.

2. Materials and Methods

2.1. Ethical Statement

This study did not require at any time the usual handling/management of animals, since we worked directly with the records provided by the National Association of Merino Sheep Breeders. Likewise, the blood samples used were those collected in 2022 during routine and mandatory health controls by the relevant governmental administrations, and taken by official veterinarians in full compliance with animal welfare standards.

2.2. Animal Selection and Phenotyping

A total of 559 sheep of the Spanish Merino breed were sampled for wool quality traits during the years 2022 and 2023. All the animals analyzed came from two herds kept at official centers which receive animals from all the herds that breed pure animals, with all the variability of the breed concentrated in these two herds: the Centre of Animal Selection and Reproduction (CENSYRA, Badajoz, Spain), where a cohort of females was raised to test Merino rams; and the Andalusian Institute of Agriculture, Fisheries, Food and Ecological Production Research and Training. (IFAPA, Andalucía, Spain), which keeps breeding females from all the recognized lines of this breed. The wool samples were obtained from the area between the back of the neck and the top of the scapulae, and were analyzed in the CENSYRA, where the fiber diameter (FD), standard deviation (SD), coefficient of variation (CV%), comfort factor (CF%), percent of fibers less than 15 microns (<15%), staple length (SL) and fiber curvature (CRV) were measured with the Australian OFDA 2000 (BSC Electronics, Ardross, Australia). The description of each of the traits is reflected in Table 1. The descriptive statistic of the traits was calculated for the entire population and by sex with the IBM SPSS Statistics 25.0 software for Windows (IBM Corp., Armonk, NY, USA). The differences between the values of each trait based on sex were calculated using a mean comparison test.

2.3. Sequencing, Alignment and Quality Control

The 76 animals with the highest and lowest values were sequenced according to the fiber diameter into two different groups (42 with high wool quality formed by those with the lowest fiber diameter and 34 with low wool quality represented by animals with the highest fiber diameters). Blood samples from the selected individuals were collected by jugular venipuncture in vacutainers, with EDTA K3 as the anticoagulant. Genomic DNA was purified with the DNeasy Blood and Tissue Kit (QIAGEN, Hilden, Germany), following the manufacturer’s instructions. Samples were sent to NEOGEN Genomics (Lincoln, NE, USA). Paired-end sequencing libraries were constructed according to the manufacturer’s instructions (Illumina Inc., San Diego, CA, USA), and then analyzed for size distribution using TapeStation, quantified using Qubit, and sequenced on the Illumina NovaSeq 6000 platform (Illumina Inc., San Diego, CA, USA) at PE150. A total of 617 GB of data was generated. The quality control of the raw data was conducted with fastqc V0.11.9 software (https://www.bioinformatics.babraham.ac.uk/projects/fastqc/ accessed on 24 March 2023). After filtering, the adapters were removed using fastp v0.23.4 software [14]. The remaining high-quality sequences were aligned with the GCA_016772045.1_ARS-UI_Ramb_v2.0 sheep genome (previously indexed), using the Burrows-Wheeler Aligner (BWA) v0.7.18 software with the “-men” command [15]. Next, the bam files generated for each sample were sorted using the “sort” command in Samtools v1.12 [16]. Duplicates were marked and removed using the “MarkDuplicates” and “RemoveDuplicates” commands in Picard v3.1 software (Picard Toolkit. Cambridge, UK, 2018). The samples were then filtered to keep only the reads with paired reads mapped with quality values of 20, and an alignment score above 100, using Samtools v1.12 software [16].

2.4. Variant Calling

The genotype likelihood was calculated by adding the allelic depth, genotype depth, and strand bias, using the Ovis aries reference genome GCA_016772045.1_ARS-UI_Ramb_v2.0 to generate a bcf file using bcftools (https://github.com/samtools/bcftools accessed on 24 March 2023). Finally, the genotypes were called with bcftools to generate the vcf file.

2.5. Genome-Wide Association

To obtain the genome-wide association (GWAS), the vcf file was converted to a binary file using plink v1.9 software [17]. The resulting file contained 41,093,307 DNA variants distributed over the autosomal chromosomes OAR1 to OAR26 (coded 1 to 26) and the OARX sexual chromosome (coded as 27). After that, all SNPs in linkage disequilibrium (LD) with a variance inflation factor (VIF) of 2 were pruned to leave 15,734,409 DNA variants, using plink v1.9 [17]. To obtain the GWAS, a Univariable Linear Mixed Model (uvLMM) was employed using GEMMA v0.98.5 software [18], using the following formula:
y = Wα + xβ + u + ε
where y is an n-vector of quantitative traits (or binary disease labels) for n individuals; W is an incidence matrix of covariates (fixed effects) including a column of 1 s; α is a vector of the corresponding coefficients including the intercept; x is an n-vector of marker genotypes; β is the effect size of the marker; u is an n-vector of random effects u ∼ N(0, λτ − 1 K), where τ is the variance of the residual errors; λ is the ratio between two variance components; K is the genomic relationship matrix (estimated from the markers); and ε is the n-vector of errors. In addition, the model included a correction for population stratification based on the first ten components of a principal component analysis performed in PLINK v.1.9 as covariates. Data were corrected by population structure, the genomic relationship between individuals, age, sex, and numbers of animals born (first-born, from 2 to 5, 6 and over) and lambs. The assay was repeated for each of the traits studied. Manhattan plots and the quantile–quantile (QQ) plots were obtained using the qqman R package [19] in the R studio environment (RStudio Team 2020 http://www.rstudio.com, accessed on 24 March 2023).

2.6. Identification of Candidate Genes

Based on the chromosomal location and relative position according to the GCA_016772045.1_ARS-UI_Ramb_v2.0, the reference genomes of each variant associated with each trait with a p-value over 1.0005 × 10⁻⁷ were tested to find the candidate genes and sorted into 500 Kb windows (250 Kb upstream and 250 Kb downstream from each point) using the BioMart application from the Ensembl repository. Next, the genes were submitted to the DAVID database to study the Gene Ontology.

3. Results

3.1. Summary Statistics of Phenotype Data

The descriptive statistics of fiber diameter, standard deviation, coefficient of variation, comfort factor, and staple length are shown in Table 2. Fiber diameter ranged from 15.2 to 28.5 microns, with an average of 22.2 microns. The SD mean was 3.9 microns, with an average CV% of 17.5%. Almost the entire population showed a high CF% value, with a mean of 95.7%. The mean of fibers less than 15 microns per sample was 2.7%, and ranged from 0 to 44.4%, including the highest CV (131%). The SL ranged from 15 to 85 mm, with an average of 42.6. Finally, the mean curvature of the fiber was 119.14 degrees per mm. The mean comparison test showed that there was a significant difference in all the studied traits between males and females.

3.2. Statistic of Sequencing Data

The sequencing process generated an average of 15.97 Gb data of information for each sample, with a median coverage of 5.32× and over 105 million reads. The reads were of a high quality, with an average Q20 of 97.17% and a Q30 of 92.58% before filtering. The mean values of Q20 and Q30 after filtering were 97.66% and 93.18%, respectively, with 17.17% of the regions duplicated.

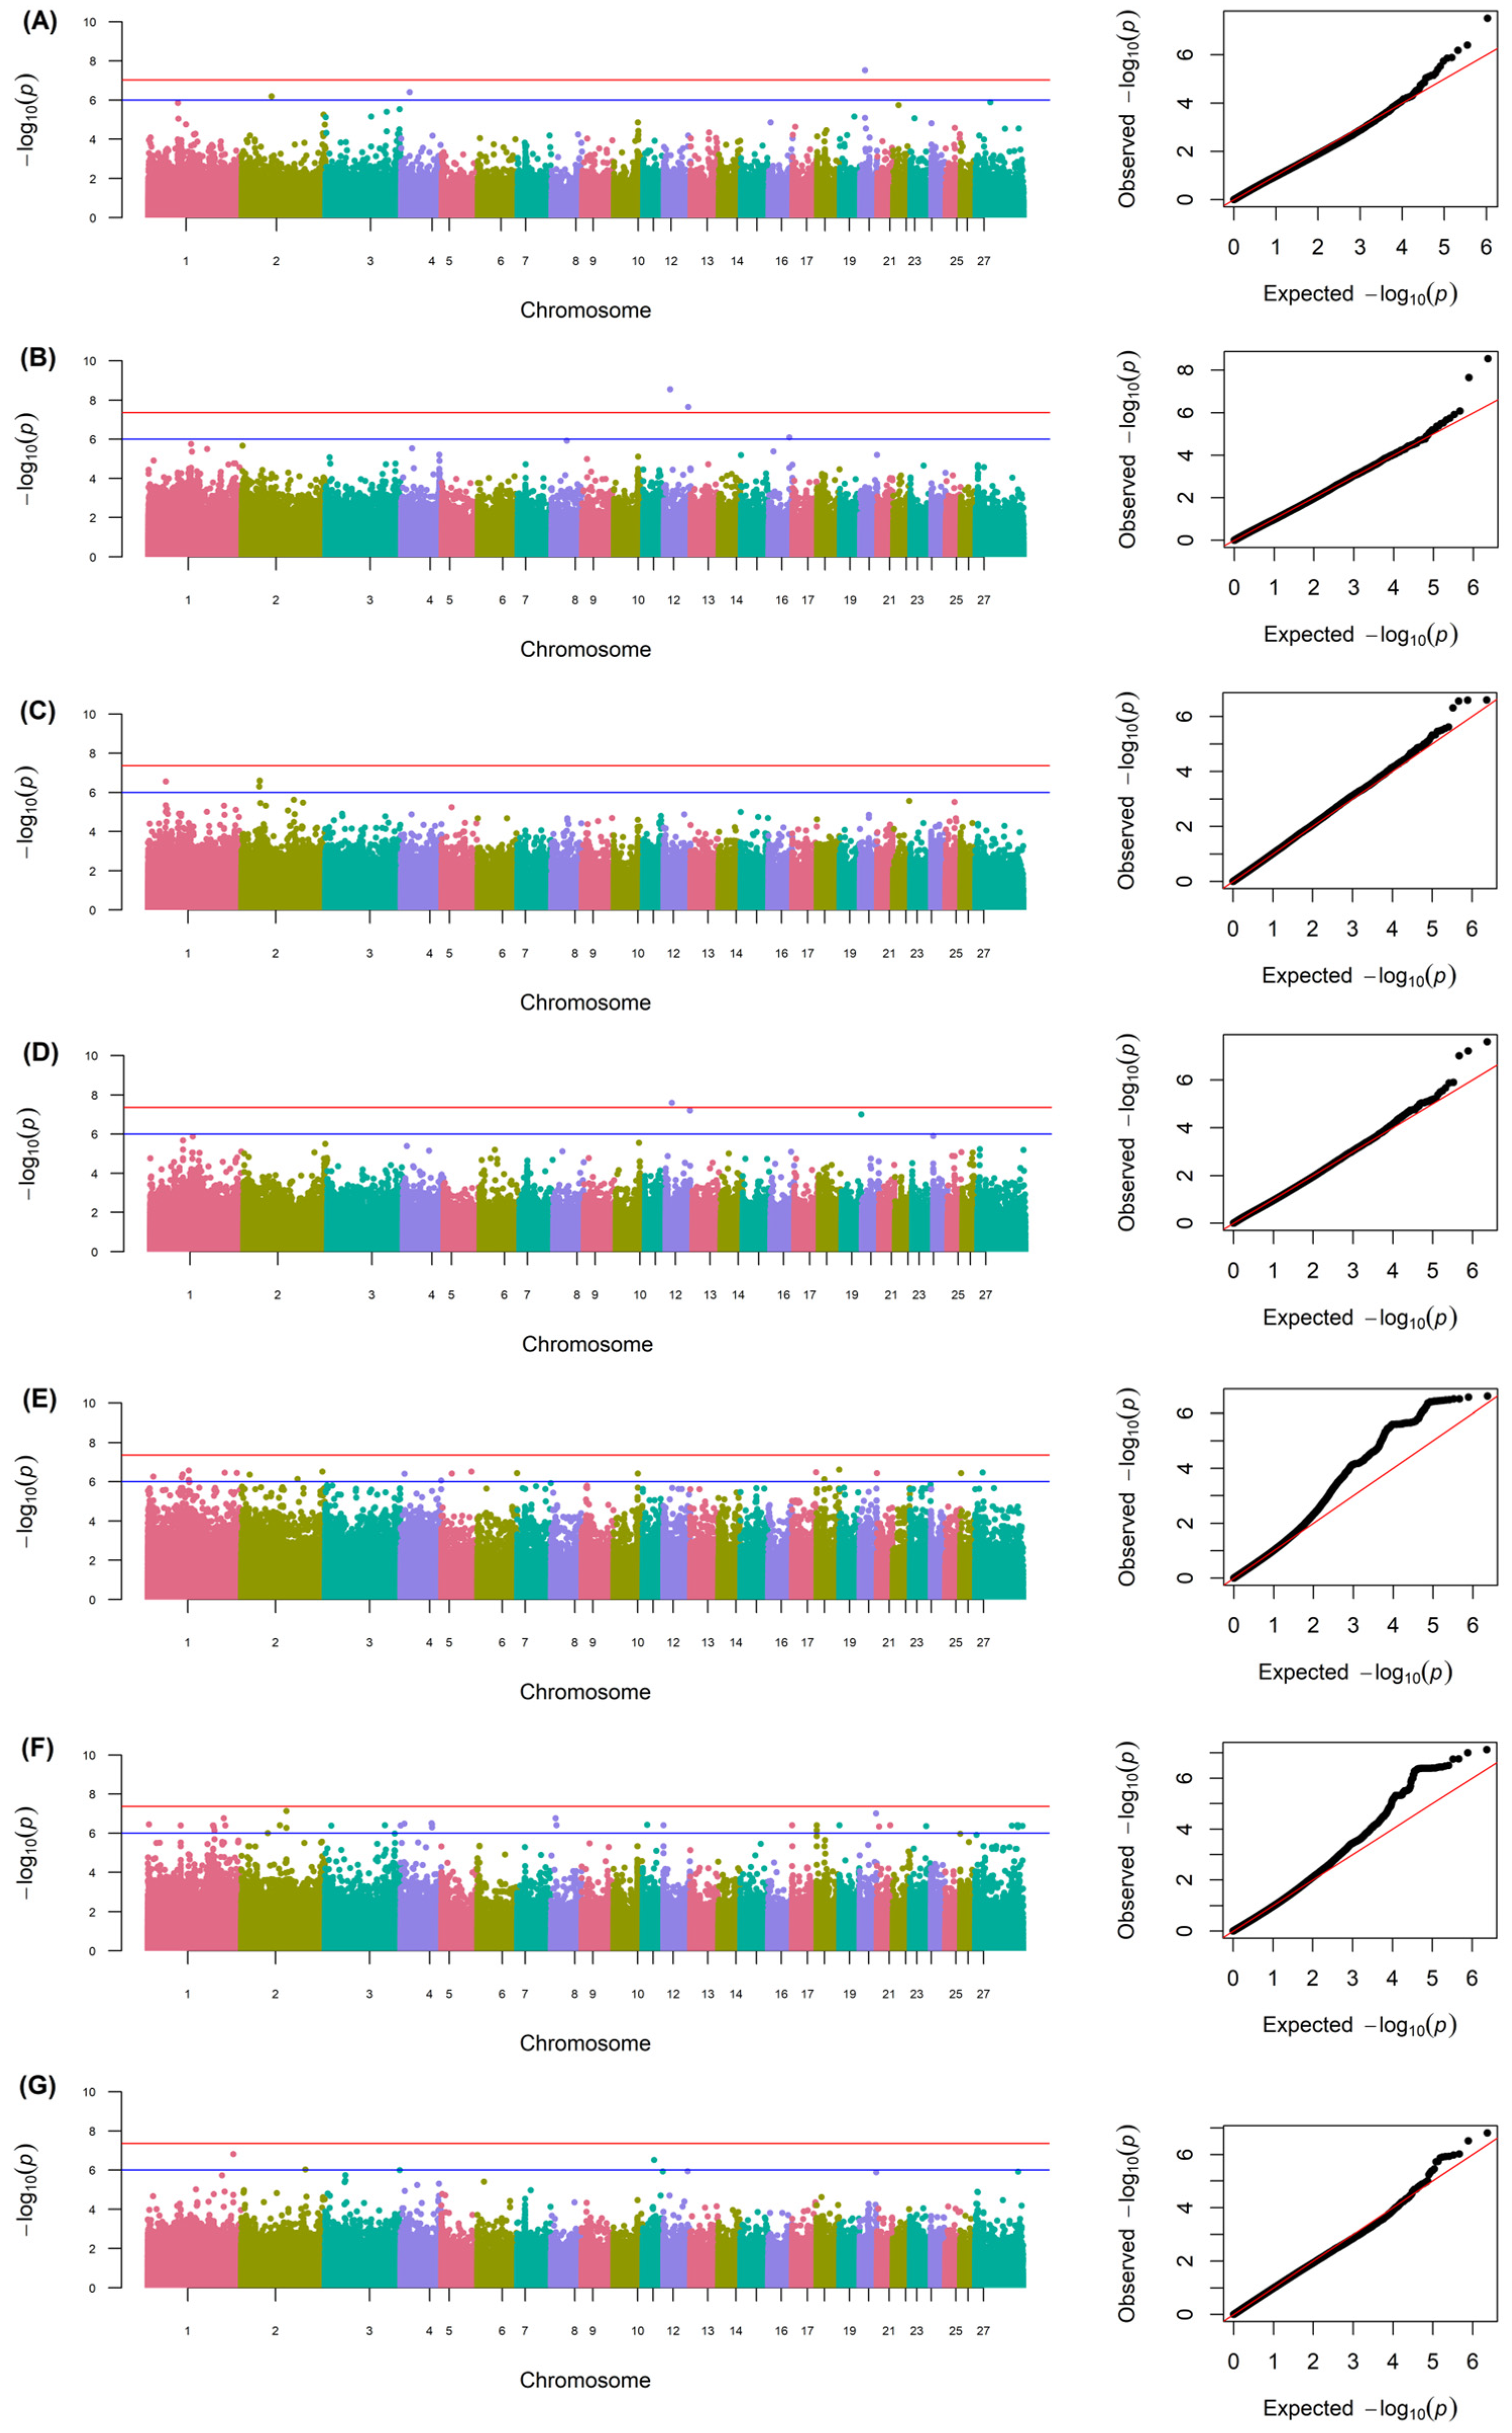
3.3. Genome-Wide Association and Identification of Candidate Genes

Figure 1 shows the Manhattan plots for the 7 traits studied. The Univariable Linear Mixed Model showed a total of 74 SNPs associated with wool quality traits located in the Ovis aries chromosomes (OAR1, 2, 3, 4, 5, 6, 8, 10, 11, 12, 16, 17, 18, 19, 20, 21, 23, 26, and X). Of these, 3 were associated with FD, 3 with SD, 4 with CV, 3 with CF, 23 with <15%, 35 with SL, and 3 with CRV (Table 3). A total of 70 different genes were located within or near the 74 variants detected. A total of 42 of these SNPs were located within 41 different genes, while the other 22 were close to different candidate genes in a range, with the closest one being the FANCG gene related to CV (331 bp upstream from the SNP), and the furthest gene, MKRN3, associated with SL (303,877 bp upstream from the SNP). A total of 27 of the genes were not officially named. The most significative SNPs were within the USH2A gene located in the OAR12 and associated with SD (2.880708 × 10⁻⁹). Some of the SNPs associated with a specific trait were within (RCAN1 for the fibers under 15 microns) or near the same gene (MKRN3 for the trait of staple length). Two SNPs (OAR12:18454843 and OAR12:72689402, found within the USH2A and SYT14 genes, respectively) were associated with both SD and CF traits.

4. Discussion

The results of the present work show that the wool of the pure Spanish Merino continues to be among the finest, despite the fact that for decades, wool quality has not been used as a criterion for selection, with the fiber diameter equaling or surpassing that of other breeds previously studied, such as Akkraman [20], Chinese Merino [21,22,23,24], Crossed Merino [25], or Rambouillet [26]. However, the diameter of the fibers currently observed in Spanish Merino appears to be significantly coarser compared to those typically found in breeds highly selected for producing fine wool, such as Uruguayan sheep, which boast a remarkable fineness, with fibers measuring around 16.6 microns [27], or the Australian Merino, with an average fiber diameter below 16.5 microns [28]. In this way, the highly specific selection being carried out in these breeds can serve as a model for its application in the Spanish Merino to reduce the FD.
Several of the wool quality parameters in Spanish Merino have been studied previously [29], and in recent years, the ACME association has focused on improving wool quality. Although the current average fiber diameter is 1 micron greater than 15 years ago, there are animals with average values of 15.2 microns, which represents a much greater fineness than that found 15 years ago (min: 18 microns) and very close to the figures for breeds which are ultra-selected for wool fineness [27,28]. We can therefore confirm the presence of a foundation stock of animals in the breed with ultra-fine wool, as evidenced by the percentage of fibers measuring below 15 microns. While the population average stands at 2.74% per individual, some animals exhibit as much as 44% of fibers below 15 microns. The comfort factor has improved considerably over the last decade from an average of 66.2% to 95.66%, while regarding fiber length, the coefficient of variation has increased, reflecting that the breed remains highly heterogeneous.
One of the parameters that has decreased is fiber length, which is currently about 2 cm shorter with significant variation among individuals compared to values recorded 20 years earlier [29,30]. This is mainly because breeders who have begun to prioritize the production of high-quality wool still maintain dual-purpose breeding (for meat and wool), noticing that females giving birth more than once a year or experiencing multiple pregnancies exhibit a lower wool growth due to the high demand for energy required by both processes [31]. Compared to other fine-wool-producing breeds, the fiber length of the Spanish Merino is shorter [22], and so staple length (SL) is an aspect that needs to be improved in the breed, in line with industry standards. For all these reasons, more importance is currently given to this trait in the genetic evaluations carried by the National Association of Merino Sheep Breeders. A point to consider is that the fiber of the males’ wool is coarser, and their fleece contains less ultrafine fiber compared to that of the females, although the fiber length of the males is longer (Table 2). This is to be expected due to the pronounced sexual dimorphism present in the breed.
However, although Merino wool has shorter fibers, it presents other characteristics that make it unique, such as the size of the fleece, which is larger than that found in other breeds, the high density of fibers, and especially the curvature of the fiber, which is an interesting property with a view to producing specialized clothing.
Association studies have proven to be a valuable tool in the search for candidate genes related to various traits in sheep, by identifying fixed alleles among the groups analyzed [20,21,22,27]. The relationships between individuals and the structure of the population can lead to the appearance of false positives in these types of association studies [32,33], and in our GWAS, a linear mixed model corrected by population stratification and individual relationship was employed to avoid them. QQ plots support the reliability of the model used and the results obtained (Figure 1). The gene exploration was conducted based on proximity to the identified variant, by which all those within a specified window size upstream or downstream of the sequence are proposed, assuming they are within the same linkage blocks. In some cases, the variant is located directly in the intronic or exonic region of a specific gene.
In our study, 10 genes were proposed as candidates for traits related to fiber diameter and their level of homogeneity in the sample and/or population (FD, SD, and CV). Several of these, such as CTNND2, LRFN2, or SYT14, encode membrane proteins and play important roles in cell adhesion, although none play a known role in wool generation. Similarly, none of the genes associated with the comfort factor appear to be directly related to follicular development or wool generation, although this may be due to our limited knowledge of the ovine genome.
However, among the candidate genes, five could be related to wool production due to their role in regulating hair follicle growth. Of these, genes EDN2, COL18A1, and LRP1B were associated with the percentage of fibers over 15 microns. Gene EDN2, located on OAR1, synthesizes endothelin, a cytokine with a crucial role in the migration of epidermal melanocytes from the hair root, and is produced by keratinocytes [34]. It has also been observed that endothelin, produced by hair follicle progenitors, binds to receptors on dermal sheath cells, triggering their contraction, which is essential for hair follicle regression [35], while gene COL18A1 (collagen, type XVIII, alpha 1), also located on OAR1, synthesizes collagen protein. Collagen plays a vital role in hair and wool production by maintaining the structure of hair follicles, is responsible for keeping hair in good condition, and is involved in the production of new hair, providing the properties of elasticity and strength. In fact, in humans, a mutation in the COL18A1 gene leads to severe myopia, together with alopecia areata in the occipital region, indicating its potential importance in the development or health of hair follicles [36]. Gene LRP1B (LDL Receptor Related Protein 1B) is located on OAR2. Low-density lipoprotein (LDL) is a cholesterol molecule, and an association has been found between cholesterol levels and hair health. Indeed, the presence of LDL seems to be associated with alopecia and other types of skin and hair disorders [37].
Within the candidate genes associated with fiber length, FGF12 and ADAM17, located on OAR1 and OAR3, respectively, were also proposed. It has been suggested that fibroblast growth factor 12 (FGF12) is necessary for the hair growth cycle [38], and it has even been tentatively related to hair length in humans [39]. Meanwhile, another gene belonging to the fibroblast growth factor superfamily (FGFs), FGF5, was previously associated with SL and greasy wool weight in crossbreed Chinese Merino [40] and crossed Merino [25], while FGF20 plays a key role in the regulation of the skin compartments during the early morphogenesis of primary wool follicles [41].
In addition, ADAM17 (disintegrin and metalloproteinase 17) plays a role in skin homeostasis. Specifically, through its effect on keratinocytes, it has been shown that a deficiency of this gene in mice can lead to chronic dermatitis in adulthood [42]. The significant impact it has on keratinocytes suggests that it may play an important role in wool development, as these cells are the basis for wool generation in the follicle [43].
This was the first GWAS carried out in the pure Spanish Merino sheep using a sequencing approach. A number of genes have been proposed as candidates for wool traits in studies of other breeds by [20] (CEP290, PRKCZ, TMTC3, SLC45A1), [22] (LGR4, PIK3CA, SEMA3C, NF1B, OPHN1, THADA, KEGG, UBE2E3, RHPN2), [40] (FGFs), [25] (FGF5, STAT3, KRT86, ALX), [27] (IGF1, TGFB2R, PRKCA), [24] (DKK), and [21] (YWHAZ, KRTCAP3, TSPEAR, PIK3R4, KIFI6B, PTPN3, GPRC5A, DDX47, TCF9, TPTEL, NBEA). Although we found genes of the same molecular family (FGFs) playing an important role in hair development, the lack of agreement with genes proposed in these other studies may be due to differences between breeds and the number of markers used.
However, after detecting the different genes involved in hair growth and development processes, we consider them interesting subjects for potential further investigation. These results require validation using a larger dataset before they can be used in marker-assisted selection in Spanish Merino sheep. Overall, however, our findings will be useful for further genomic studies and genetic improvement programs in this breed.

5. Conclusions

In this study, we first characterized Spanish Merino wool though the analysis of seven traits of interest in the fiber industry. Our results show the immense potential of the breed to return to its origins as a producer of high-quality fine wool, with a significant percentage of fine fibers containing many curls. However, the fiber length must be improved to accommodate the demands of the industry. Furthermore, we found up to 74 genome-wide significant SNPs related to these same traits, located within or near 70 genes, and, most importantly, 3 genes associated with fiber percentage less than 15%, and 2 associated with staple length, which play a key role in hair development and/or growth. The new candidate genes are expected to provide a good theoretical basis for optimizing the selection of this breed to obtain high-quality wool. Our study aimed to analyze the situation of the breed as regards wool production, and enhance the current tools for selecting animals with quality wool, focusing on the parameters that require improvement to restore the wool aptitude that made the Spanish Merino the most coveted breed in the world.

Author Contributions

Conceptualization, G.A. and A.M.; Data curation, A.G., F.A. and A.D.; Formal analysis, G.A., N.L. and C.Z.; Funding acquisition, A.G., F.A. and A.D.; Research, G.A. and A.M.; Methodology, G.A., C.Z. and A.M.; Resources, A.G., F.A. and A.D.; Software, G.A. and N.L.; Supervision, A.M.; Writing—original draft, G.A.; Writing—review and editing, G.A. and A.M. All authors have read and agreed to the published version of the manuscript.

Funding

This research was funded by the National Association of Merino Sheep Breeders (ACME), Ref. OTRI 12020157).

Institutional Review Board Statement

Not applicable.

Informed Consent Statement

Not applicable.

Data Availability Statement

All data contained within the article.

Acknowledgments

The authors would like to thank Cristobal Medina Raso, head of the technical department of the MERAGEM research group for his involvement in this project.

Conflicts of Interest

The authors declare no conflicts of interest.

References

  1. Ciani, E.; Lasagna, E.; D’Andrea, M.; Alloggio, I.; Marroni, F.; Ceccobelli, S.; Delgado Bermejo, J.V.; Sarti, F.M.; Kijas, J.; Lenstra, J.A.; et al. Merino and Merino-derived sheep breeds: A genome-wide intercontinental study. Genet. Sel. Evol. 2015, 47, 64. [Google Scholar] [CrossRef]
  2. Ceccobelli, S.; Landi, V.; Senczuk, G.; Mastrangelo, S.; Sardina, M.T.; Ben-Jemaa, S.; Persichilli, C.; Karsli, T.; Bâlteanu, V.-A.; Raschia, M.A. A comprehensive analysis of the genetic diversity and environmental adaptability in worldwide Merino and Merino-derived sheep breeds. Genet. Sel. Evol. 2023, 55, 24. [Google Scholar] [CrossRef]
  3. Belda, A.S.; Trujillano MC, S. Razas Ovinas Españolas; Ministerio de Agricultura: Madrid, Spain, 1986; p. 887. [Google Scholar]
  4. Esteban, M. La Raza Merina y Sus Cruces en la Producción de Carne; MAPA, Ministerio de Agricultura Pesca y Alimentación del Gobierno de España: Madrid, Spain, 1994; p. 175. [Google Scholar]
  5. Peña Blanco, F.; Alcalde Aldea, M.J. Las Razas Ovinas Integradas en Andalucía: Merino Precoz Francés, Ille de France, Fleischscaff, Landschaff y Lacaune; Las Razas Ganaderas de Andalucía, Patrimonio Ganadero Patrimonio Ganadero Andaluz: Madrid, Spain, 2007; Volume II. [Google Scholar]
  6. Azor, P.C.I.; Valera, M.; Arranz, J.J.; Medina, C.; Gutiérrez, J.P.; Goyache, F.; Muñoz, A. Análisis preliminar de la estructura genética del Merino: Situación de las estirpes tradicionales mediante análisis genealógico y molecular. In XIV Reunión Nacional de Mejora Genética Animal; Asociación Interprofesional para el Desarrollo Agrario (AIDA): Zaragoza, Spain, 2008; Volume 104, pp. 295–302. [Google Scholar]
  7. Granero, A.M.A.; Anaya, G.; Ziadib, C.; Alcalde, M.J. Morphometric differences based on quantitative traits between different genetic lines in the Merino Español sheep breed. ASPA 24th Congress Book of Abstract. Ital. J. Anim. Sci. 2021, 20 (Suppl. 1), 115. [Google Scholar] [CrossRef]
  8. Granero, A.; Anaya, G.; Alcalde, M.J. Morphostructural Differences between the Historical Genetic Lines of the Spanish Merino Sheep. Animals 2023, 13, 313. [Google Scholar] [CrossRef]
  9. Granero, A.; Anaya, G.; Demyda-Peyrás, S.; Alcalde, M.J.; Arrebola, F.; Molina, A. Genomic Population Structure of the Main Historical Genetic Lines of Spanish Merino Sheep. Animals 2022, 12, 1327. [Google Scholar] [CrossRef]
  10. Anaya, G.; Granero, A.; Alcalde, M.J. Situación genética de las principales líneas puras del merino español. ITEA-Inf. Tec. Econ. Agrar. 2024, 120, 133–143. [Google Scholar] [CrossRef]
  11. ARCA. Sistema Nacional de Información de Razas; ARCA: Barcelona, Spain, 2022. [Google Scholar]
  12. Li, H. A statistical framework for SNP calling, mutation discovery, association mapping and population genetical parameter estimation from sequencing data. Bioinformatics 2011, 27, 2987–2993. [Google Scholar] [CrossRef]
  13. Lou, R.N.; Jacobs, A.; Wilder, A.P.; Therkildsen, N.O. A beginner’s guide to low-coverage whole genome sequencing for population genomics. Mol. Ecol. 2021, 30, 5966–5993. [Google Scholar] [CrossRef] [PubMed]
  14. Chen, S.; Zhou, Y.; Chen, Y.; Gu, J. fastp: An ultra-fast all-in-one FASTQ preprocessor. Bioinformatics 2018, 34, i884–i890. [Google Scholar] [CrossRef]
  15. Li, H.; Durbin, R. Fast and accurate short read alignment with Burrows–Wheeler transform. Bioinformatics 2009, 25, 1754–1760. [Google Scholar] [CrossRef]
  16. Danecek, P.; Bonfield, J.K.; Liddle, J.; Marshall, J.; Ohan, V.; Pollard, M.O.; Whitwham, A.; Keane, T.; McCarthy, S.A.; Davies, R.M. Twelve years of SAMtools and BCFtools. GigaScience 2021, 10, giab008. [Google Scholar] [CrossRef]
  17. Chang, C.C.; Chow, C.C.; Tellier, L.C.; Vattikuti, S.; Purcell, S.M.; Lee, J.J. Second-generation PLINK: Rising to the challenge of larger and richer datasets. GigaScience 2015, 4, s13742-015. [Google Scholar] [CrossRef] [PubMed]
  18. Zhou, X.; Stephens, M. Genome-wide efficient mixed-model analysis for association studies. Nat. Genet. 2012, 44, 821–824. [Google Scholar] [CrossRef]
  19. Turner, S. qqman: An R package for visualizing GWAS results using QQ and Manhattan plots. J. Open Source Softw. 2018, 3, 731. [Google Scholar] [CrossRef]
  20. Arzik, Y.; Kizilaslan, M.; Behrem, S.; White, S.N.; Piel, L.M.; Cinar, M.U. Genome-wide scan of wool production traits in Akkaraman sheep. Genes 2023, 14, 713. [Google Scholar] [CrossRef]
  21. Wang, Z.; Zhang, H.; Yang, H.; Wang, S.; Rong, E.; Pei, W.; Li, H.; Wang, N. Genome-wide association study for wool production traits in a Chinese Merino sheep population. PLoS ONE 2014, 9, e107101. [Google Scholar] [CrossRef]
  22. Zhao, H.; Guo, T.; Lu, Z.; Liu, J.; Zhu, S.; Qiao, G.; Han, M.; Yuan, C.; Wang, T.; Li, F. Genome-wide association studies detects candidate genes for wool traits by re-sequencing in Chinese fine-wool sheep. BMC Genom. 2021, 22, 127. [Google Scholar] [CrossRef] [PubMed]
  23. Zhang, W.; Jin, M.; Li, T.; Lu, Z.; Wang, H.; Yuan, Z.; Wei, C. Whole-Genome Resequencing Reveals Selection Signal Related to Sheep Wool Fineness. Animals 2023, 13, 2944. [Google Scholar] [CrossRef] [PubMed]
  24. Mu, F.; Rong, E.; Jing, Y.; Yang, H.; Ma, G.; Yan, X.; Wang, Z.; Li, Y.; Li, H.; Wang, N. Structural Characterization and Association of Ovine Dickkopf-1 Gene with Wool Production and Quality Traits in Chinese Merino. Genes 2017, 8, 400. [Google Scholar] [CrossRef]
  25. Bolormaa, S.; Swan, A.A.; Brown, D.J.; Hatcher, S.; Moghaddar, N.; Van Der Werf, J.H.; Goddard, M.E.; Daetwyler, H.D. Multiple-trait QTL mapping and genomic prediction for wool traits in sheep. Genet. Sel. Evol. 2017, 49, 62. [Google Scholar] [CrossRef]
  26. Becker, G.M.; Woods, J.L.; Schauer, C.S.; Stewart, W.C.; Murdoch, B.M. Genetic association of wool quality characteristics in United States Rambouillet sheep. Front. Genet. 2023, 13, 1081175. [Google Scholar] [CrossRef] [PubMed]
  27. Ramos, Z.; Garrick, D.J.; Blair, H.T.; Vera, B.; Ciappesoni, G.; Kenyon, P.R. Genomic regions associated with wool, growth and reproduction traits in Uruguayan Merino sheep. Genes 2023, 14, 167. [Google Scholar] [CrossRef] [PubMed]
  28. Shaid, A.; Wang, L. Chapter 3—Identification of Australian merino wool. In The Wool Handbook; Jose, S., Thomas, S., Basu, G., Eds.; Woodhead Publishing: Sawston, UK, 2024; pp. 75–99. [Google Scholar]
  29. Valera, M.; Arrebola, F.; Juárez, M.; Molina, A. Genetic improvement of wool production in Spanish Merino sheep: Genetic parameters and simulation of selection strategies. Anim. Prod. Sci. 2009, 49, 43–47. [Google Scholar] [CrossRef]
  30. Arrebola, F. Caracterización Genética de la Aptitud Lanera del Merino Autóctono Español; Universidad de Córdoba: Córdoba, Colombia, 2002. [Google Scholar]
  31. Cannas, A.; Nudda, A.; Pulina, G. Nutritional Strategies to Improve Lactation Persistency in Dairy Ewes; University of Wisconsin: Madison, WI, USA, 2002. [Google Scholar]
  32. Yu, J.; Pressoir, G.; Briggs, W.H.; Vroh Bi, I.; Yamasaki, M.; Doebley, J.F.; McMullen, M.D.; Gaut, B.S.; Nielsen, D.M.; Holland, J.B.; et al. A unified mixed-model method for association mapping that accounts for multiple levels of relatedness. Nat. Genet. 2006, 38, 203–208. [Google Scholar] [CrossRef] [PubMed]
  33. Marchini, J.; Cardon, L.R.; Phillips, M.S.; Donnelly, P. The effects of human population structure on large genetic association studies. Nat. Genet. 2004, 36, 512–517. [Google Scholar] [CrossRef] [PubMed]
  34. Ma, H.-J.; Zhu, W.-Y.; Wang, D.-G.; Yue, X.-Z.; Li, C.-R. Endothelin-1 combined with extracellular matrix proteins promotes the adhesion and chemotaxis of amelanotic melanocytes from human hair follicles in vitro. Cell Biol. Int. 2006, 30, 999–1006. [Google Scholar] [CrossRef] [PubMed]
  35. Martino, P.; Sunkara, R.; Heitman, N.; Rangl, M.; Brown, A.; Saxena, N.; Grisanti, L.; Kohan, D.; Yanagisawa, M.; Rendl, M. Progenitor-derived endothelin controls dermal sheath contraction for hair follicle regression. Nat. Cell Biol. 2023, 25, 222–234. [Google Scholar] [CrossRef] [PubMed]
  36. Wang, P.; Jia, X.; Xiao, X.; Li, S.; Long, Y.; Liu, M.; Li, Y.; Li, J.; Xu, Y.; Zhang, Q. An Early Diagnostic Clue for COL18A1- and LAMA1-Associated Diseases: High Myopia with Alopecia Areata in the Cranial Midline. Front. Cell Dev. Biol. 2021, 9, 644947. [Google Scholar] [CrossRef] [PubMed]
  37. Palmer, M.A.; Blakeborough, L.; Harries, M.; Haslam, I.S. Cholesterol homeostasis: Links to hair follicle biology and hair disorders. Exp. Dermatol. 2020, 29, 299–311. [Google Scholar] [CrossRef]
  38. Lin, W.-H.; Xiang, L.-J.; Shi, H.-X.; Zhang, J.; Jiang, L.-P.; Cai, P.-T.; Lin, Z.-L.; Lin, B.-B.; Huang, Y.; Zhang, H.-L.; et al. Fibroblast Growth Factors Stimulate Hair Growth through β-Catenin and Shh Expression in C57BL/6 Mice. BioMed. Res. Int. 2015, 2015, 730139. [Google Scholar] [CrossRef]
  39. Katsuoka, K.; Schell, H.; Wessel, B.; Hornstein, O.P. Effects of epidermal growth factor, fibroblast growth factor, minoxidil and hydrocortisone on growth kinetics in human hair bulb papilla cells and root sheath fibroblasts cultured in vitro. Arch. Dermatol. Res. 1987, 279, 247–250. [Google Scholar] [CrossRef] [PubMed]
  40. Zhao, H.; Hu, R.; Li, F.; Yue, X. Five SNPs Within the FGF5 Gene Significantly Affect Both Wool Traits and Growth Performance in Fine-Wool Sheep (Ovis aries). Front. Genet. 2021, 12, 732097. [Google Scholar] [CrossRef] [PubMed]
  41. Li, S.; Chen, W.; Zheng, X.; Liu, Z.; Yang, G.; Hu, X.; Mou, C. Comparative investigation of coarse and fine wool sheep skin indicates the early regulators for skin and wool diversity. Gene 2020, 758, 144968. [Google Scholar] [CrossRef] [PubMed]
  42. Franzke, C.W.; Cobzaru, C.; Triantafyllopoulou, A.; Löffek, S.; Horiuchi, K.; Threadgill, D.W.; Kurz, T.; van Rooijen, N.; Bruckner-Tuderman, L.; Blobel, C.P. Epidermal ADAM17 maintains the skin barrier by regulating EGFR ligand-dependent terminal keratinocyte differentiation. J. Exp. Med. 2012, 209, 1105–1119. [Google Scholar] [CrossRef]
  43. Yu, Z.; Gordon, S.; Nixon, A.; Bawden, C.; Rogers, M.; Wildermoth, J.; Maqbool, N.; Pearson, A. Expression patterns of keratin intermediate filament and keratin associated protein genes in wool follicles. Differ. Res. Biol. Divers. 2009, 77, 307–316. [Google Scholar] [CrossRef]
Figure 1. Manhattan plots and quantile–quantile (QQ) plots of the associated DNA points from genome-wide association of fiber diameter (A), standard deviation (B), coefficient of variation (C), comfort factor (D), fibers under 15 microns (E), staple length (F), and fiber curvature (G).
Genes 15 00795 g001
Table 1. Description of the wool traits analyzed in the present study.
TraitCodeDescription
Fiber DiameterFDThe average fiber diameter in a staple of wool, measured in microns. Fibers do not have a uniform thickness within the staple because they grow at different rates and speeds. The differences in thickness can be up to 15 microns.
Standard DeviationSDMeasurement of the variation of wool fiber diameter. Microns of variation between the average of the FD and the minimal and maximal diameter.
Coefficient of VariationCVAnother measure of variability of the fiber diameter, but expressed as a percentage and relative to the average fiber diameter. This is determined mathematically using the equation: CV% = SD/AFD × 100
Comfort FactorCFPercentage of fibers under 30 microns. Fibers wider than 30 microns are rigid and do not bend when they touch the skin, resulting in the wool having a prickly feeling and/or skin irritation.
Fiber under 15 microns<15%Percentage of extra fine fibers under 15 microns.
Staple LengthSLMeasurement of the length of the unstretched staple expressed in millimeters.
Fiber CurvatureCRVFiber curvature expressed in degrees/millimeters. Generally, a greater curvature is associated with a higher crimp frequency.
Name (Trait), identification (Code) and description (Description) of each of the traits studied in the present work cited in Section 2.2.
Table 2. Descriptive statistics of wool traits in the population analyzed.
Trait (Unit)CodeGroupMeanMin.Max.CV %
Fiber diameter (µm)FDGlobal22.2115.228.510
Male25.0721.428.57.41
Female21.9215.228.29.2
Standard deviation (µm)SDGlobal3.892.36.617
Male4.402.76.417
Female3.832.36.616.22
Coefficient of variation (%)CVGlobal17.48122912
Male17.4912.525.213.93
Female17.48122911.94
Comfort factor (%)CFGlobal95.6670.81006
Male87.63711009.38
Female96.4670.81005.1
Fibers under 15 microns (%)<15%Global2.74044.4131
Male0.5503.6138
Female2.96044.4125
Staple length (mm)SLGlobal42.6158524
Male50.78208528.62
Female41.78158022.58
Fiber curvature (degrees/mm)CRVGlobal119.1469.1171.813
Male104.8169.1140.413.31
Female120.5675.1171.812.75
Traits of the present study, FD (fiber diameter), SD (standard deviation), CV% (coefficient of variation), CF% (comfort factor), <15% (percent of fibers under 15 microns), SL (staple length), CRV (fiber curvature) calculated for the entire population (Global) and by sex (Male, Female).
Table 3. Genome-wide analysis of significant SNPs for wool production traits.
TraitChrPos. (bp)p-ValueNearest GeneDistance (bp)
FD289,558,5126.51632 × 10−7LOC114112820−678
425,386,1503.958888 × 10−7ENSOARG00020040429within
2014,330,1173.015784 × 10−8LRFN2within
SD1218,454,8432.880708 × 10−9USH2Awithin
72,689,4022.22192 × 10−8SYT14within
1661,545,9258.147923 × 10−7CTNND2within
CV152,910,6192.798289 × 10−7ST6GALNAC3within
253,391,8084.948564 × 10−7FANCG331
55,005,1182.572812 × 10−7LOC12181862426,374
55,047,2052.521822 × 10−7ENSOARG00020031756within
CF1218,454,8432.542981 × 10−8USH2Awithin
72,689,4026.228683 × 10−8SYT14within
1958,874,3669.867142 × 10−8EFCC1within
>15%115,993,5815.558001 × 10−7EDN232,531
101,310,2015.935847 × 10−7LOC114117513−1293
103,394,6214.247662 × 10−7ENSOARG00020030884within
121,546,3112.677888 × 10−7RCAN1within
121,608,9948.232058 × 10−7RCAN1within
122,856,3969.882277 × 10−7IFNAR1within
229,038,3193.510156 × 10−7ENSOARG00020038272within
265,955,1643.546715 × 10−7COL18A1within
225,569,4864.394279 × 10−7DIRAS268,469
16,8452,7617.346249 × 10−7LRP1Bwithin
242,826,7053.103179 × 10−7HMGCL5056
411,699,9473.954987 × 10−7CALCR−28,368
121,492,6848.785249 × 10−7LOC114114472−40,923
531,265,1843.916315 × 10−7ENSOARG00020027327within
89,990,1793.08966 × 10−7TRNAW-CCA−279,579
6117,917,6153.670075 × 10−7CTBP1−899
1072,536,4583.864163 × 10−7UGGT2within
1771,252,6653.322203 × 10−7LOC105602956within
1822,794,7387.483516 × 10−7LOC114118854within
66,955,4412.417579 × 10−7SIVA1within
2116,6073.724726 × 10−7PANX1177,023
262,331,4823.70147 × 10−7CSMD1within
X21,855,9013.363513 × 10−7PTCHD1−10,474
SL12,983,3913.575274 × 10−7TRAF3IP1within
97,859,3784.074127 × 10−7LOC1141122159239
194,406,3964.074127 × 10−7LOC12181668916,194
195,679,7494.082481 × 10−7FGF12within
196,441,6305.059276 × 10−7ENSOARG00020027852within
198,957,6017.336839 × 10−7TPRG1within
227,004,3751.747904 × 10−7NMD3within
231,145,4704.074127 × 10−7VEPH1within
2115,507,5823.980196 × 10−7LOC106990902−20,393
135,022,0097.476657 × 10−8ENSOARG00020033964within
135,336,8615.380042 × 10−7CHRNA1within
318,857,5974.179918 × 10−7ADAM17within
179,239,9103.971237 × 10−7HMOX1, ENSOARG00020039035within
443,5474.107503 × 10−7LOC105605926265,080
11,316,4513.296337 × 10−7HEPACAM2within
92,353,5663.143381 × 10−7GRM8within
93,899,8323.592256 × 10−7SND1within
93,938,1455.156819 × 10−7LRRC4within
813,764,7771.733298 × 10−7NKAIN2within
16,549,1194.012221 × 10−7LOC132660198102,411
1114,111,7383.757219 × 10−7ENSOARG00020021921within
12192,4834.012221 × 10−7ENSOARG00020035247within
1737,9354.012221 × 10−7LOC105605790243,265
18221,1404.012221 × 10−7MKRN3303,877
226,9677.148295 × 10−7MKRN3298,050
1979,7864.012221 × 10−7MRPS24142,918
2049,080,1511.000487 × 10−7LOC114109591within
216,275,5444.693387 × 10−7GRM5, ENSOARG00020035270within
40,000,7824.009804 × 10−7TIGD3within
2348,181,8944.356746 × 10−7ZBTB7Cwithin
X109,190,3514.158501 × 10−7TENM1within
125,810,9563.979989 × 10−7GUCY2Fwithin
127,195,4284.009804 × 10−7VSIG1within
127,703,4934.928113 × 10−7FRMPD3within
141,116,9844.336624 × 10−7TRNAC-ACA−21,661
CRV1255,629,8881.540812 × 10−7AMOTL2−6948
2191,763,5349.518238 × 10−7LOC101116805112,736
1134,467,4043.054953 × 10−7ENSOARG00020039760within
Trait: FD (fiber diameter), SD (standard deviation), CV% (coefficient of variation), CF% (comfort factor), <15% (percent of fibers under 15 microns), SL (staple length), CRV (fiber curvature). Chromosome (Chr) and position (Pos) of the SNP according to the reference genome GCA_016772045.1_ARS-UI_Ramb_v2.0. Distance (bp): distance in base pairs from the nearest gene to the associated SNPs (within if the SNPs is inside a gene, negative if the gene is downstream from the SNP, and positive if the gene is upstream from the SNP).
Disclaimer/Publisher’s Note: The statements, opinions and data contained in all publications are solely those of the individual author(s) and contributor(s) and not of MDPI and/or the editor(s). MDPI and/or the editor(s) disclaim responsibility for any injury to people or property resulting from any ideas, methods, instructions or products referred to in the content.

