Article

ROS-Induced Autophagy of Skeletal Muscle Confers Resistance of Rice Flower Carp (Cyprinus carpio) to Short-Term Fasting

1
School of Marine Sciences, Ningbo University, Ningbo 315832, China
2
College of Biological and Chemical Engineering, Hunan Engineering Technology Research Center for Amphibian and Reptile Resource Protection and Product Processing, Changsha University, Changsha 410022, China
*
Authors to whom correspondence should be addressed.
Genes 2024, 15(7), 840; https://doi.org/10.3390/genes15070840
Submission received: 1 May 2024 / Revised: 15 June 2024 / Accepted: 18 June 2024 / Published: 26 June 2024
(This article belongs to the Special Issue Fisheries and Aquaculture Gene Expression)

Abstract

:
Starvation is one of the main stresses for fish due to food shortage, the evasion of predators, and intraspecific competition. This research evaluated the impact of brief fasting periods on reactive oxygen species (ROS) levels, antioxidant response, mRNA expression of antioxidants, autophagy-related signaling genes, and autophagosome development in the muscle tissue of rice flower carp. Following a three-day fasting period, the levels of ROS and MDA rose. Additionally, after 3 d of fasting, there was a notable upregulation of NRF2 and significant increases in the levels of GSH and the activities of enzymes such as SOD, CAT, GST, GR, and GPX, while the expression of the autophagy marker gene LC3B did not change (p < 0.05). After 7 d of fasting, the content of the ROS, the activity of SOD and GR, and the GSH content reached the maximum (p < 0.05). Concurrently, there was a significant rise in the quantity of autophagosomes. An RT-qPCR analysis revealed that seven d of starvation significantly elevated the mRNA expression of genes associated with the initiation and expansion of autophagosome membranes, vesicle recycling, and cargo recruitment, including ULK1, BECLIN1, LC3B, ATG3, ATG4B, ATG4C, ATG5, ATG9, and P62. After feeding resumed for 3 d, the mRNA level of BECLIN1, ATG3, ATG4B, ATG4C, ATG5, LC3B, and P62 still remained at a high level. The LC3II protein reached its highest level. All autophagy-related gene expression decreased in the 7-day resumed feeding group. Our data implied that short-term fasting can cause oxidative stress and disrupt the antioxidant system first and then induce autophagy in the muscles of rice flower carp. These findings shed light on how fasting affects muscle homeostasis in fish. ROS-induced autophagy of the skeletal muscle may confer the resistance of rice flower carp to short-term fasting.

1. Introduction

In nature, starvation is one of the main stresses for fish due to food shortage, the evasion of predators, and intraspecific competition caused by seasonal changes [1,2,3]. During the initial phase of starvation stress, fish undergo various changes, including alterations in enzyme activity and hormone levels, to modify their metabolic rate and cope with the lack of food [4]. As the duration of starvation extends, fish are unable to sustain bodily homeostasis, leading to abnormalities in several physiological and biochemical markers [5]. The research has indicated that an overabundance of reactive oxygen species (ROS) can directly trigger oxidative stress [6]. A moderate amount of ROS helps regulate cell survival signaling, but too many ROS can trigger oxidative stress, causing DNA hydroxylation, tissue damage, and protein denaturation [7].
Active oxygen ROS also undergo a peroxidation reaction with lipids to produce lipid peroxidation products that are harmful to the body, such as malondialdehyde (MDA); MDA is a marker of oxidative lipid damage in the body.
When ROS levels are too high or their removal is compromised, the body’s defense mechanism will initiate an antioxidant response to eliminate the surplus ROS and prevent further damage. Fish have a complex antioxidant defense system, which contains a variety of antioxidant enzymes (SOD, CAT, POX, GST, GPX, GR, etc.) and non-enzyme small molecules [8]. Morales et al. observed that antioxidative enzyme activity, including SOD, CAT, and GPX, markedly increased in fish undergoing starvation. The study also showed that oxidative damage was reversible, as all biomarkers measured returned to baseline levels after the fish were refed [9].
An overaccumulation of ROS may activate pathways associated with NRF2, engaging elements like FOXO3a and Keap1. These elements either control oxidative/antioxidant dynamics or impact cellular redox states directly [10]. The NRF2 is a transcription factor of nuclear factor erythroid 2 (NF-E2). It is a key element in the endogenous antioxidant system. It regulates the antioxidant system under oxidative stress. Typically, NRF2 connects with the antioxidant response element (ARE), and the NRF2/ARE pathway is crucial for the body’s antioxidant defense mechanism. In addition, NRF2 works in combination with its negative regulatory protein KEAP1 in the cytoplasm. Jiang W D found that Cu2+ can induce oxidative stress in fish, interfere with the function of the antioxidant system, and change the NRF2-ARE antioxidant signaling pathway. However, there is limited research on how starvation impacts the adaptive responses in fish muscle. The involvement of the KEAP1-NRF2-ARE pathway in oxidative stress due to fasting is not well understood and requires further investigation, particularly in aquatic organisms.
Antioxidant systems and autophagy are crucial for fish in resisting environmental stress. ROS and autophagy play a part in complex signal transduction processes and various interactions [11,12]. Autophagy is a cellular mechanism where eukaryotic cells employ lysosomes to break down organelles and proteins, thereby sustaining metabolic equilibrium [13,14]. The activation of autophagy is strictly regulated, such as the mammalian rapamycin target protein (mTOR) signal pathway, the phosphatidylinositol 3-kinase (PI3K) pathway, the adenylate-activated protein kinase (AMPK) signal pathway, etc. [15]. At present, there are more than 40 autophagy-related genes that have been identified, which can be grouped into five categories based on their functions: the Atg1 subfamily, Atg9 subfamily, phosphatidylinositol-kinase subfamily, Atg12-Atg5 subfamily, and Atg8 subfamily [16].
Autophagy is crucial when there is a shortage of energy. Takeshi et al. starved the cultured zebrafish cells and found that the lack of amino acids promotes the breakdown of long-lived proteins. It also found that the autophagy process is regulated by the P13K class III pathway [17]. The study of rainbow trout muscle also indicates that autophagy was induced after fasting for 14 d. Autophagy has an impact on ROS levels, potentially breaking them down to prevent cellular damage from toxicity [18]. On the other hand, studies suggest that autophagy activation can lead to higher ROS levels, showing a robust link between autophagy and ROS [19]. This relationship involves complex mechanisms beyond straightforward activation or suppression, suggesting that more investigation is needed.
In vertebrates, skeletal muscle is the primary organ for motor responses and plays a crucial role in both material and energy metabolism [20]. The impact of starvation on the autophagic pathway in fish muscle is not well understood and requires further study. Rice flower carp (Cyprinus carpio) is a characteristic fish in Quanzhou City, Guangxi Province, and is also a typical species under the rice and fish integrated cultivation model, which has been widely popularized.
Therefore, in this study, we focus on how fish muscle adapts to short-term fasting through oxidative stress and autophagy. This research also explores multi-level regulation and signal transduction in fish muscle to understand how oxidative stress affects rice flower carp, aiming to mitigate oxidative damage.

2. Methods and Materials

2.1. Fish Sampling and Tissue Preparation

The fish for this study were sourced from a fish farm. A total of 45 healthy specimens, averaging 120.34 ± 36.72 g, were randomly allocated into five groups, each placed in separate ponds. These groups experienced fasting for 0, 3, or 7 d. After fasting, they resumed regular feeding for 3 or 7 d. Samples from the fast muscle of 9 live fish were collected and kept in a freezer at −80 °C. All the procedures were conducted under anesthesia with sodium pentobarbital to ensure minimal distress to the fish.

2.2. RNA Extraction and Complementary DNA Synthesis

The muscle tissue mRNA was isolated with the Trizol reagent kit (Takara Bio Co., Dalian, China) adhering to the manufacturer’s guidelines. The purity and concentration of the RNA were determined by analyzing the 260/280 nm absorbance ratio using a Nanodrop 2000 spectrometer (Nanodrop Technologies, Wilmington, DE, USA). Then, 1.5% agarose gel electrophoresis was used to verify the integrity and relative amount of the RNA. Complementary DNA (cDNA) was created with the PrimeScript TM reagent kit and the Eraser gDNA kit (Takara Bio Co., Dalian, China).

2.3. Quantitative Real-Time PCR (qPCR)

The primer pairs can be found in Table 1. Rpl13 served as an internal reference. Quantitative real-time PCR (qPCR) was performed using the Bio-Rad CFX96TM system from the USA. The reaction mixture totaled 25 µL, composed of 12.5 µL SYBR Premix Ex Taq (Takara Bio Co., Dalian, China), 10.5 µL RNase-free water, 1 µL cDNA templates, and 0.5 µL of both forward and reverse primers. Amplification proceeded at 95 °C for 30 s, followed by 40 cycles at 95 °C for 5 s and 58 °C for 25 s. The melting curve analysis ranged from 65 °C to 95 °C, increasing in increments of 0.5 °C to measure the fluorescence sequentially.

2.4. ROS, MDA, and Enzyme Activity

The content of the ROS and malondialdehyde (MDA) were determined by using detection kits (Nanjing Jiancheng Bioengineering Institute, Nanjing, China) following the product instructions. The activity of all the enzymes was also identified by enzyme-detection kits (Nanjing Jiancheng Bioengineering Institute, Nanjing, China). The T-SOD activity was detected under 550 nm and the GPX and GST activities at 412 nm. The UV detection wavelength of CAT and GSH was 405 nm.

2.5. Transmission Electron Microscopy (TEM)

The muscle tissue samples were rinsed and then sliced into 2 mm × 2 mm sections and then fixed by fixed solution. An H7600 electron microscope (Hitachi Ltd., Tokyo, Japan) was employed to observe the formation of autophagosomes.

2.6. Western Blot Analysis

A 0.1 g sample of tissue was combined with 1 mL of lysate (containing 50 mM Tris HCl, 150 mM NaCl, 1 mM EDTA, 1 mM PMSF, 1% NP-40, and 0.5% sodium deoxycholate) to fully lyse the proteins. Following homogenization, the homogenates were centrifuged at 12,000× g for 10 min at 4 °C. The total protein content in the supernatant was measured using the Bio-Rad protein assay kit (Bio-Rad, Hercules, CA, USA). The protein samples (40 μg per lane) were resolved through SDS-PAGE and then moved onto a 0.45 μm PVDF membrane for the Western blot analysis. The membrane was blocked for one hour and then incubated with the primary antibody overnight at 4 °C. The anti-LC3A/B antibody (ab128025) was used at a 1/1000 dilution for probing, while anti-β-actin (ab8224) at a 1/1000 dilution functioned as a loading control. The protein levels were measured using densitometric scanning and then adjusted relative to the loading control.

2.7. Statistical Analysis

The data were shown as the means ± SEM. The significance of the results was determined using a one-way analysis of variance (ANOVA), followed by Tukey’s post hoc test. This analysis was performed with SPSS v16.0 (SPSS Inc., Chicago, IL, USA). A p value was employed to evaluate the significant difference between the groups (a p value of 0.05 or less represents the significant differences).

3. Results

3.1. ROS Content of Muscle after Fasting

The effect of fasting on the ROS content in the rice flower carp muscle is shown in Table 2. Following 3 d of fasting, the muscle ROS content was notably higher compared to the fish with normal feeding habits (p < 0.05). Upon 7 d of fasting, the ROS content increased to the highest level and gradually decreased after resuming feeding (p < 0.05).

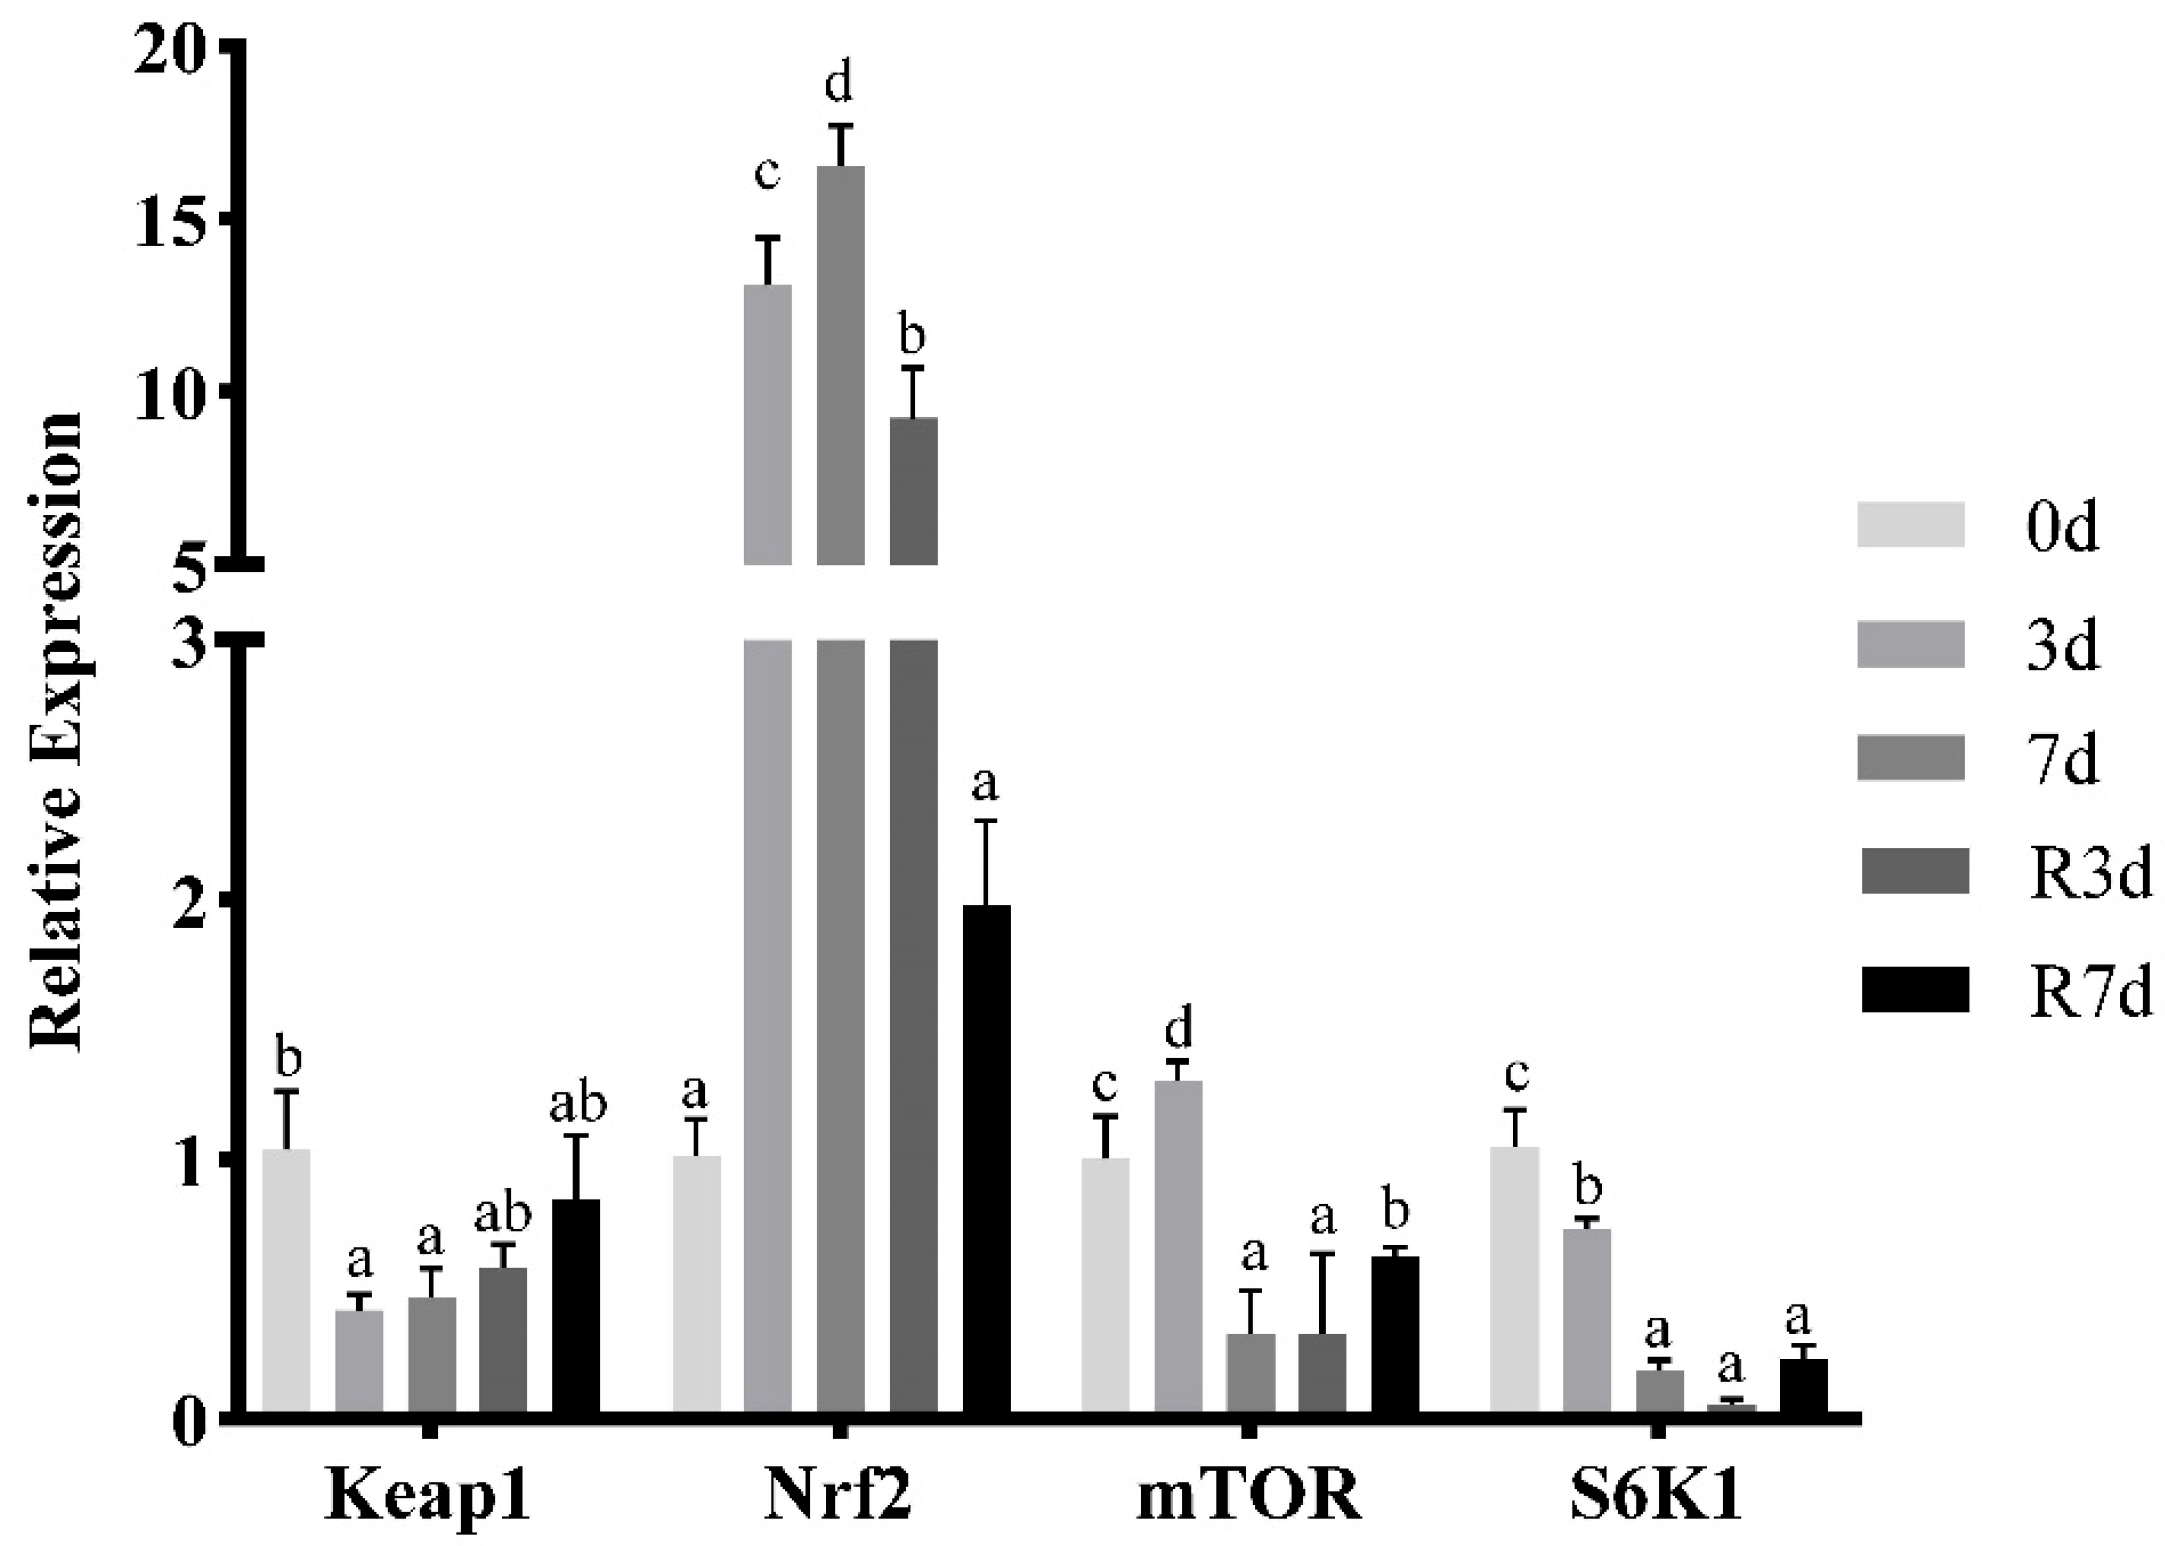
3.2. mRNA Expression of Genes Linked to Antioxidant-Related Signaling in Rice Flower Carp Muscles after Fasting

In the muscle, as shown in Figure 1, the expression of NRF2 was upregulated (p < 0.05) after 3 d of fasting, reached the peak after fasting for 7 d, and decreased gradually after 3 and 7 d of refeeding. mTOR expression showed a significant increase after 3 d of fasting (p < 0.05), then decreased apparently following 7 d of fasting and 3 d of refeeding (p < 0.05), and recovered after refeeding for 7 d (p < 0.05). The expression level of Keap1 and S6K1 decreased significantly (p < 0.05) during fasting and increased after refeeding for 7 d, but the increase was not significant.

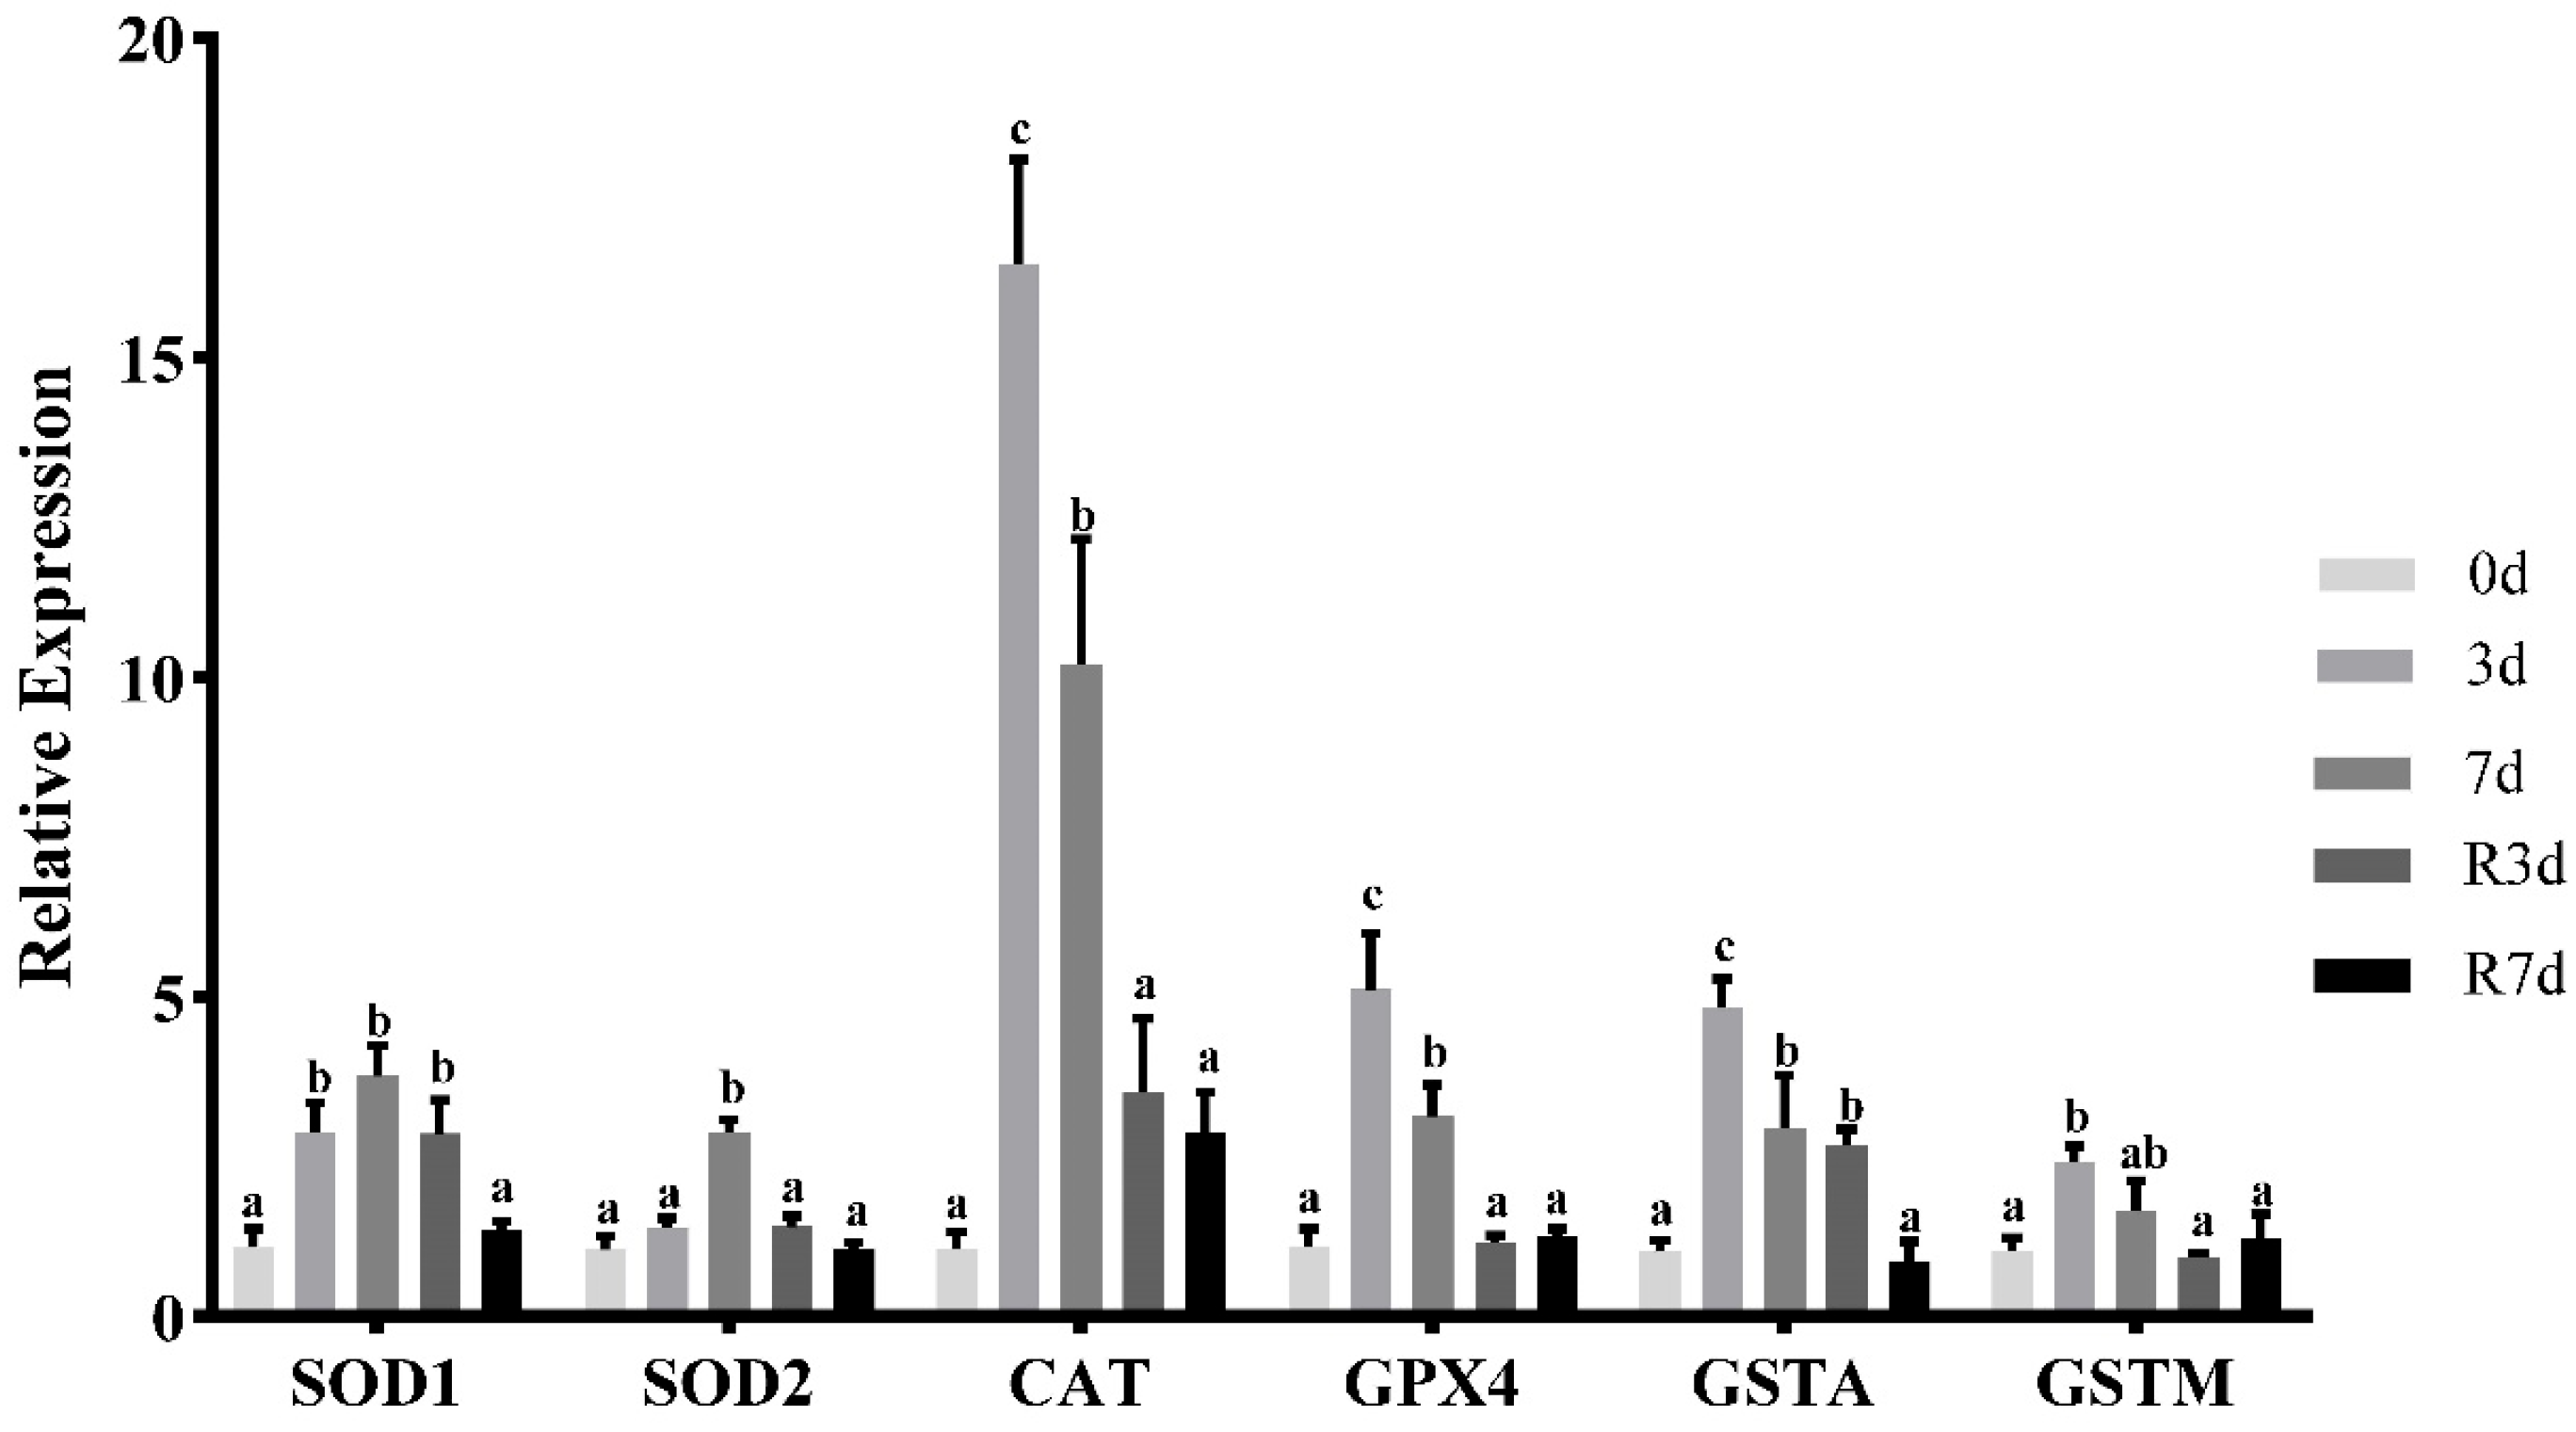
3.3. Antioxidant Parameters after Fasting in Rice Flower Carp Muscles

The effect of fasting on the antioxidant parameters in the muscle is shown in Table 2. After 3 d of fasting, the MDA content in the muscle was considerably higher than that in the normally fed group. The peak was reached after 7 d of fasting (p < 0.05) and then decreased gradually in the refeeding groups (p < 0.05). After fasting for 3 d, the activity of SOD, CAT, GST, GPX, and GR and the content of GSH were significantly upregulated (p < 0.05). Among them, the activity of CAT, GST, and GPX reached the peak at 3 d for the fasting group (p < 0.05), while the activity of SOD and GR and the GSH content reached the maximum after 7 d of fasting (p < 0.05). After resuming feeding, their activity reduced by varying degrees. The activities of these enzymes increased significantly after resuming feeding. The activity of SOD, CAT, GST, and GR and the GSH content decreased significantly at 3 d for the refeeding group (p < 0.05), while the GPX activity remained the same at 7 d for the fasting group. After 7 d of resuming feeding, all the antioxidant parameters further decreased, and the content of MDA and GSH and the GST activity returned to normal levels. The activity of SOD, CAT, GPX, and GR was higher than the normally fed group.
Figure 2 illustrates how fasting impacted the expression of the antioxidant enzymes in rice flower carp. After 3 d of short-term fasting, the expression levels of the SOD1, CAT, GPX4, GSTA, and GSTM genes increased significantly (p < 0.05). Upon 7 d of fasting, the mRNA level of SOD1 and GSTM remained at high levels and the expression of SOD2 rose significantly, while the mRNA levels of CAT, GPX4, and GSTA were significantly lower than that of the 3-day fasting group (p < 0.05). Three days after resuming feeding, the expression of SOD2, CAT, GPX4, and GSTM tended to decline toward normal feeding levels, while the mRNA levels for SOD1 and GSTA remained elevated (p < 0.05) but decreased after 7 d of resuming feeding (p < 0.05).

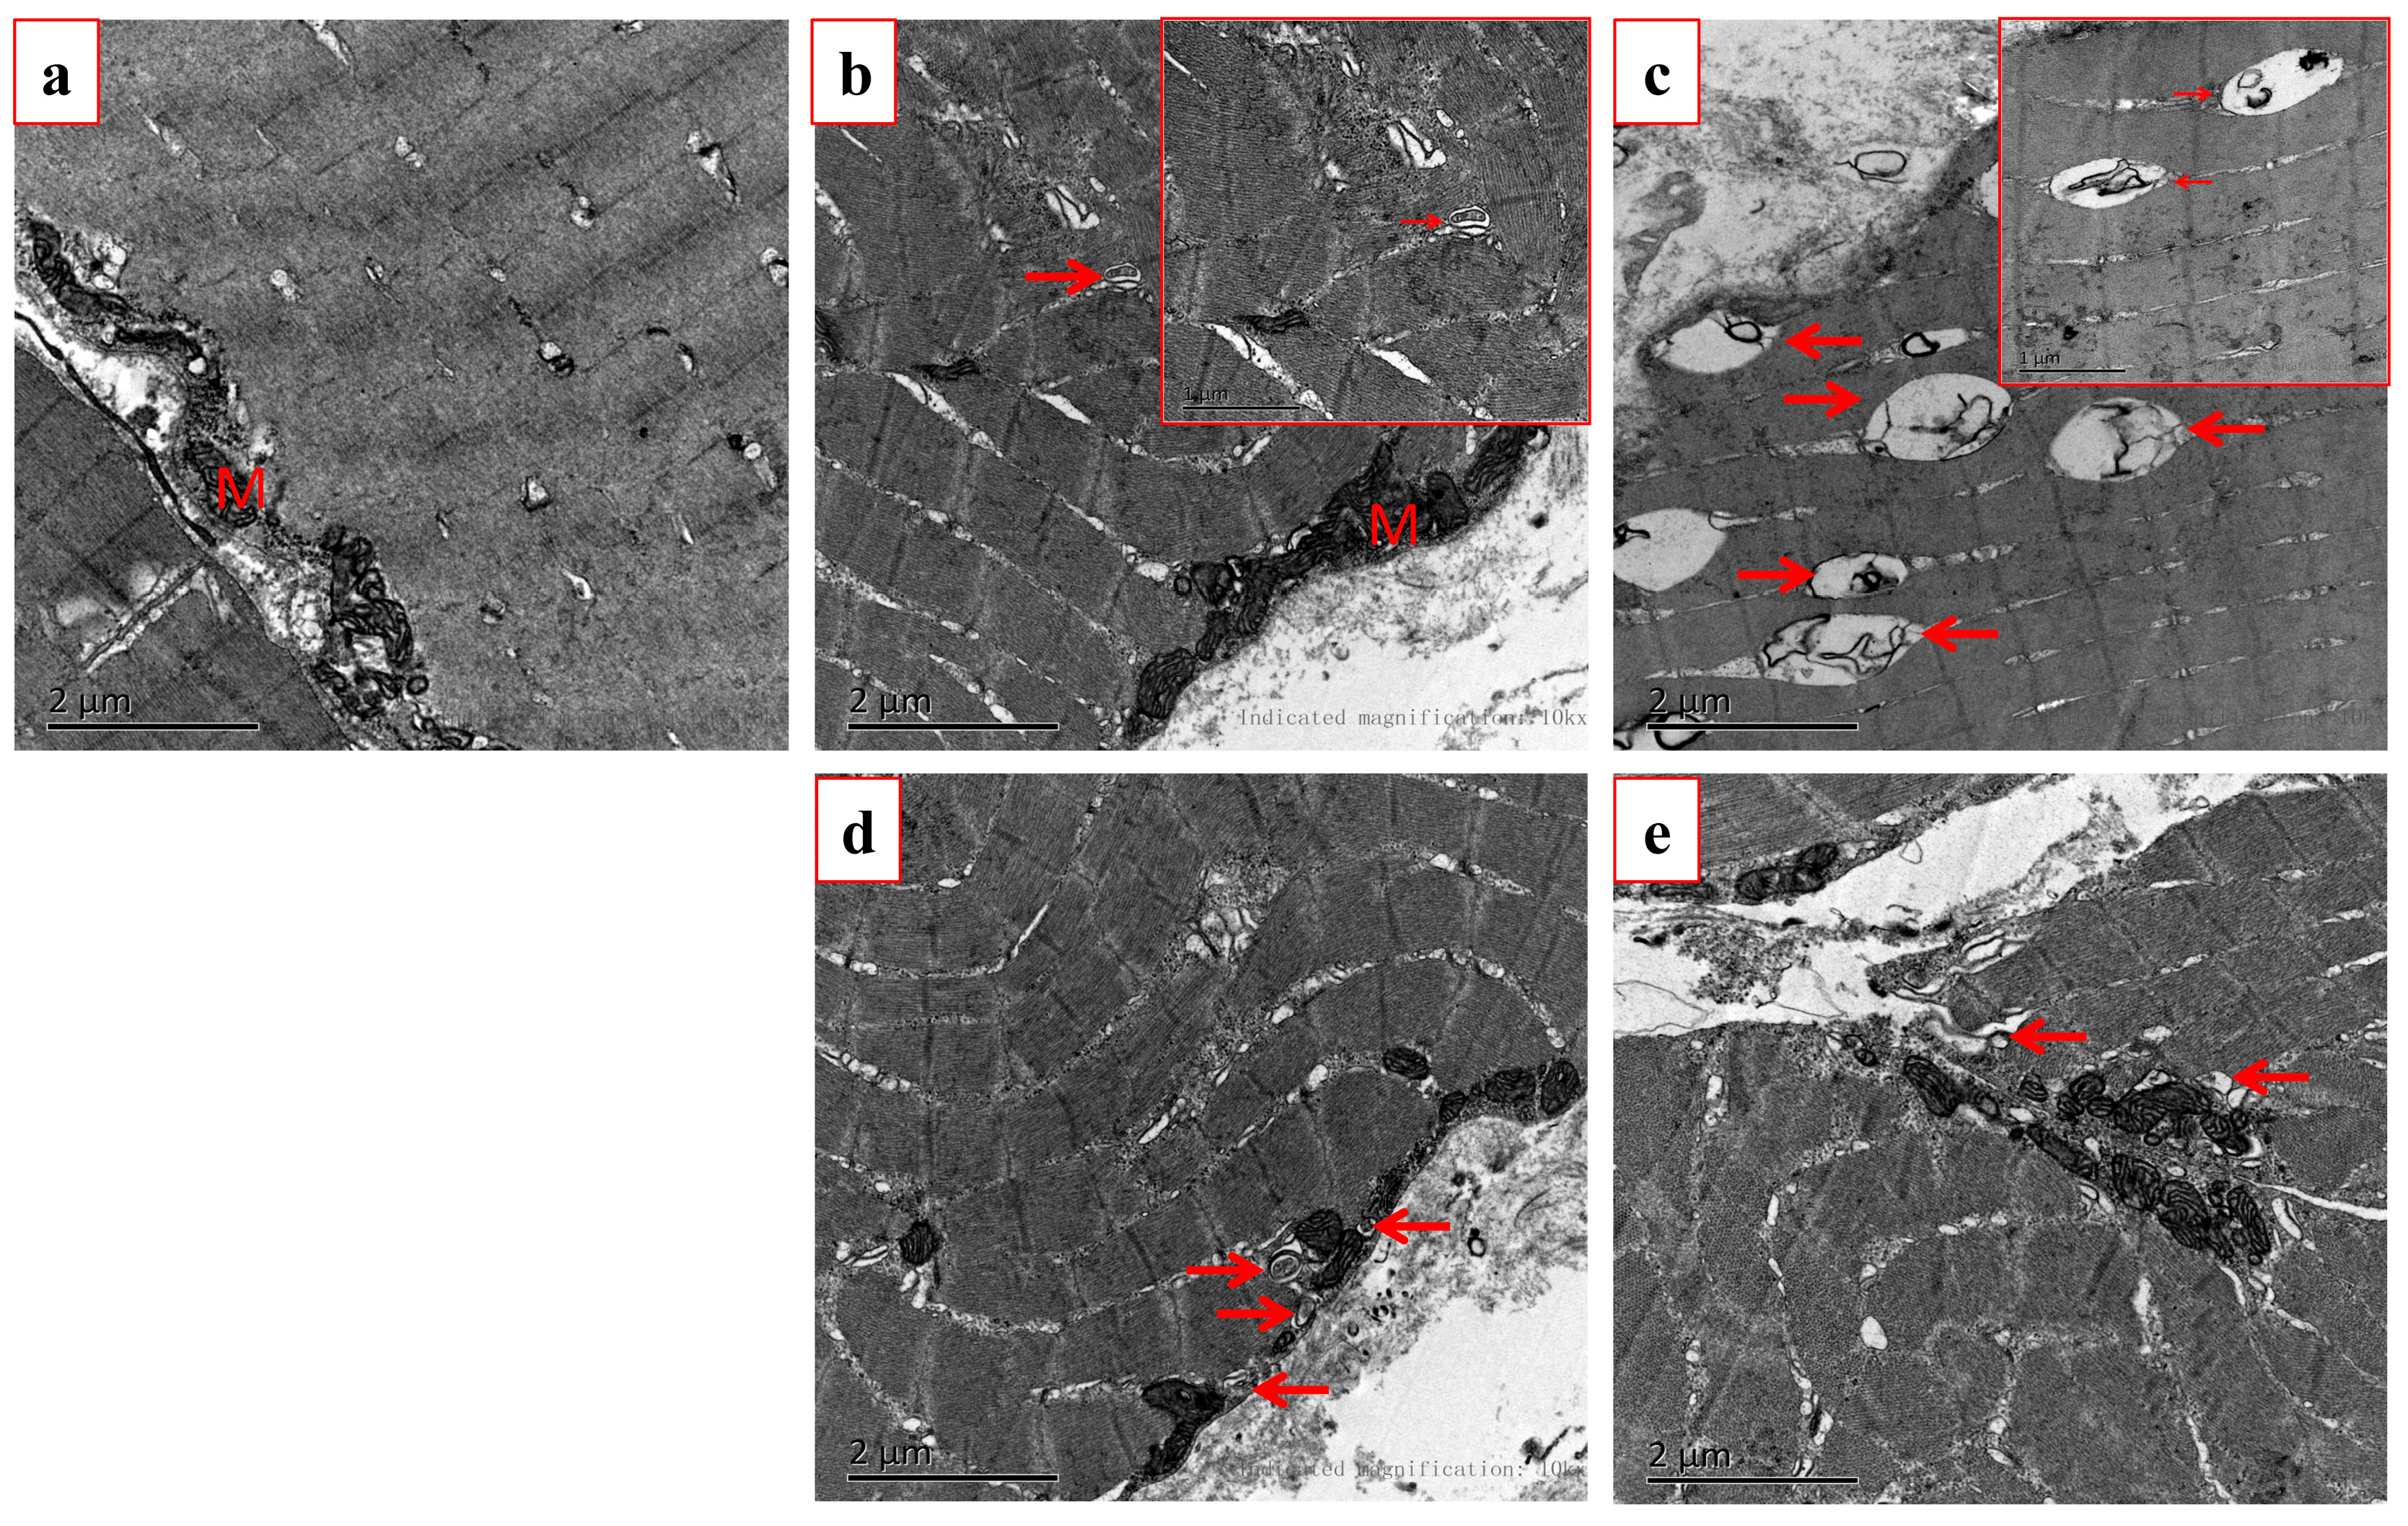
3.4. Effects of Fasting on Autophagosome Formation in Rice Flower Carp Muscle

The impact on the autophagosome formation in the muscle tissue was examined using a transmission electron microscope (Figure 3). Figure 3a displays the muscle from the normally fed fish, with minimal evidence of autophagosomes. After a 3-day fast, autophagosomes began to appear in the muscle tissue (Figure 3b), with an increase in their number. Additionally, after 7 d of fasting, more autophagosomes were visible (shown by the arrows in Figure 3c). Additionally, a lot of autophagosomes were observed after the fish had resumed feeding for 3 d (Figure 3d). And several autophagosomes can be found at 7 d for the fasting group (Figure 3e).

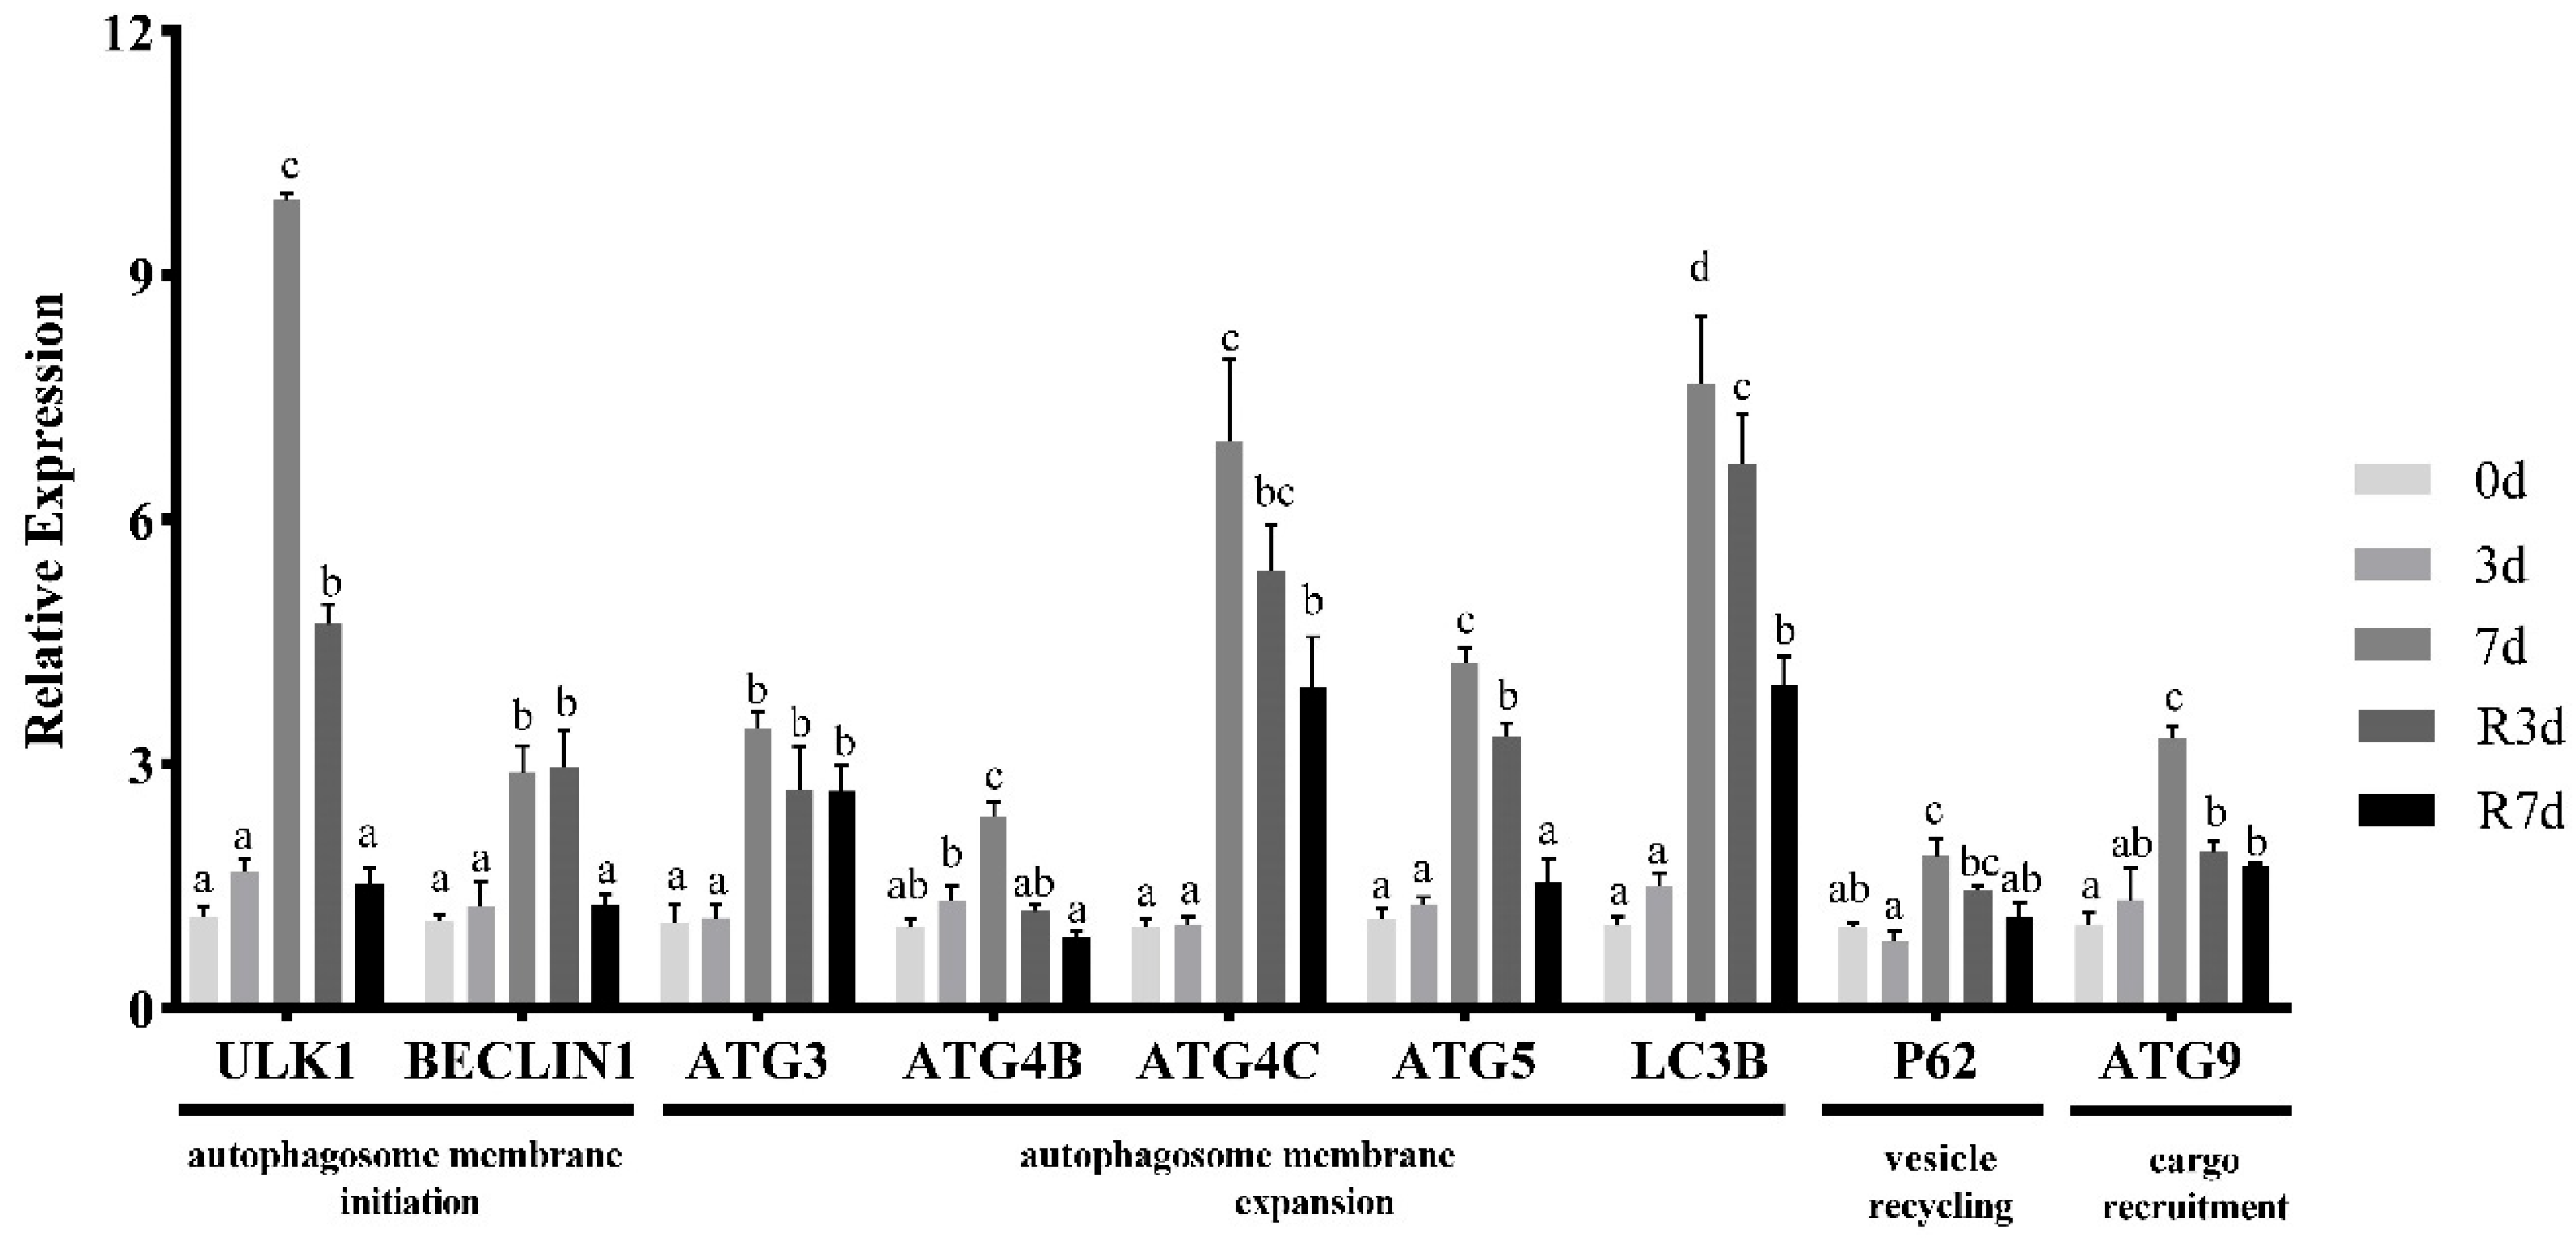
3.5. mRNA Expression of Autophagy-Related Genes

Figure 4 depicts the impact of fasting on the autophagy-related genes in the muscle of rice flower carp. An analysis of autophagy-related gene expression in the rice flower carp muscle revealed that most of the tested genes were not upregulated after a 3 d period of starvation. However, after a 7 d starvation period, the expression of the autophagosome membrane initiation genes (BECLIN1 and ULK1), membrane expansion genes (LC3B, ATG4B, ATG4C, and ATG5), vesicle recycling gene (P62), and cargo recruitment gene (ATG9) in the muscle was significantly increased (p < 0.05). After feeding resumed for 3 d, the mRNA level of BECLIN1, ATG3, ATG4B, ATG4C, ATG5, LC3B, and P62 still remained at a high level (p < 0.05). All autophagy-related gene expression decreased in the 7-day resumed feeding group (p < 0.05).

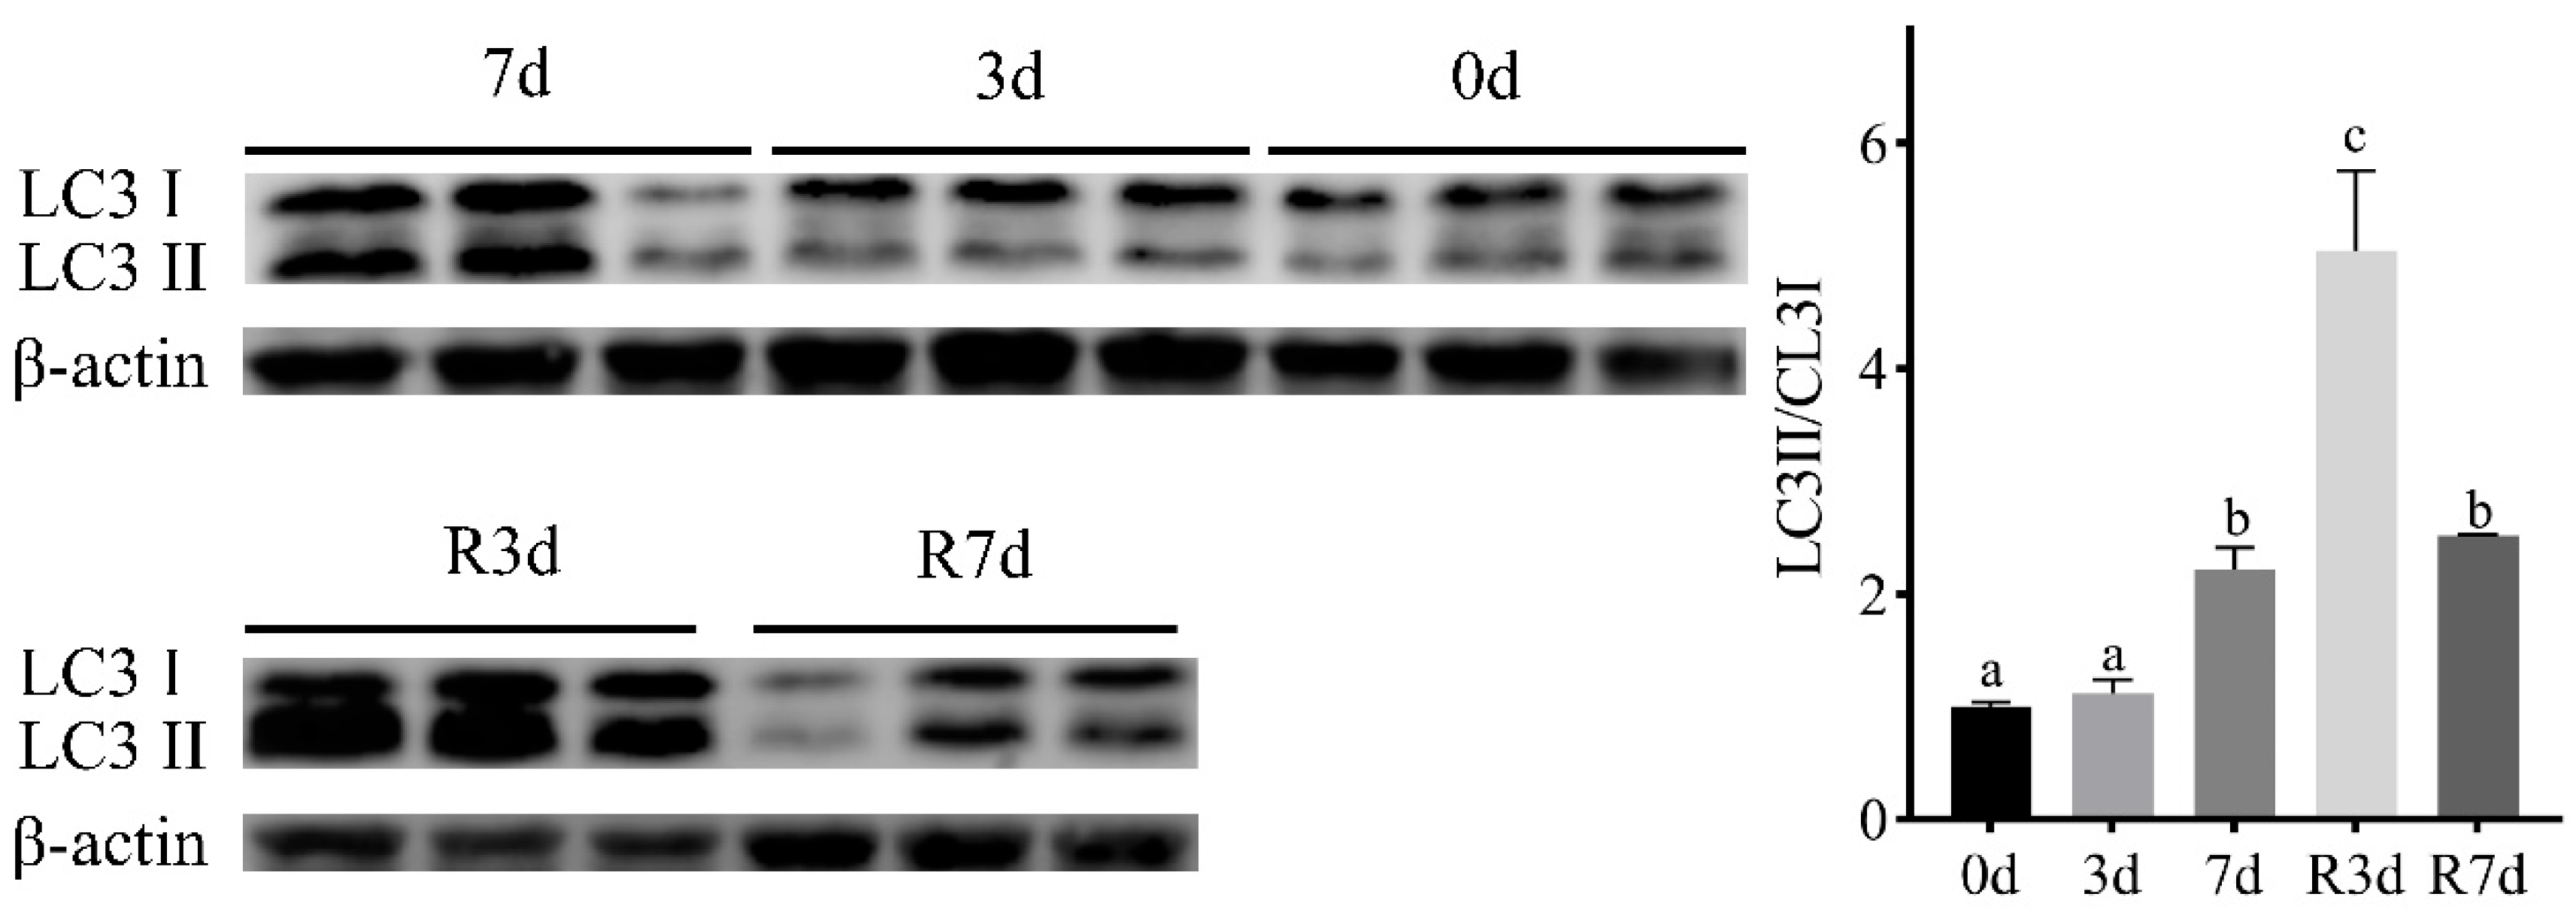
3.6. Conversion of LC3II during Fasting and Refeeding

The ratio of the LC3II to LC3I protein content is a crucial metric for assessing autophagy levels. This ratio significantly rises when autophagy is active. To determine if short-term fasting triggers autophagy, Western blotting was employed to examine the conversion of LC3II. As shown in Figure 5, the LC3II/LC3I ratio did not change significantly after 3 d of fasting (p < 0.05) but increased significantly after fasting for 7 d (p < 0.05). Moreover, the ratio reached the maximum after 3 d of resumed feeding and decreased after 7 d of resumed feeding.

4. Discussion

In this study, we assayed the possible mechanisms by which ROS mediates autophagy in rice flower carp muscle during short-term fasting. After short-term fasting for 3 d there was a mass production of ROS. In order to eliminate the effect of ROS, the antioxidant enzyme system and non-enzymatic antioxidant system were initiated, keeping the muscle in a redox-balanced state. Thus, we examined the expression of KEAP1-NRF2, the upstream regulator of the antioxidant-related signaling molecules. The mRNA expression of NRF2 increased notably following 3 d of fasting, whereas the KEAP1 levels dropped. The expression of the autophagy-related genes, however, stayed relatively stable. The results of the Western blot also confirmed this conclusion. Therefore, short-term fasting for 3 d has no significant effect on the autophagy of the muscle in rice flower carp. By using a transmission electron microscope, we can observe that the number of autophagosomes was increased but not significant. This may be because of the high efficiency of the antioxidant system in ROS elimination.
Following 7 d of fasting, NRF2 reached its peak expression, while Keap1 dropped to its lowest level. The SOD and GR activities, along with the GSH content, peaked, while the CAT, GST, and GPX activities reached their maximum after just 3 d of fasting. However, the ROS content kept rising. These results revealed that, upon 7 d of fasting, the oxidative scavenging ability of the muscle was exceeded, and the cells were damaged by oxidative stress [21]. Furthermore, a large amount of ROS was accumulated in the muscle and caused cell damage and then induced autophagy. In CHO (Chinese hamster ovary) cells, fasting led to increased ROS and H2O2 levels, which subsequently triggered autophagy. On the other hand, cysteine protease hsatg4 can eliminate the formation of autophagosomes and prevent protein degradation [22]. After a 7-day fasting period, there was a significant increase in the quantity of autophagosomes. With the fasting prolonged, the antioxidative system cannot relieve the ROS-mediated oxidative stress. As a result, the number of autophagosomes increases, and proteins begin to degrade. This trend was consistent with the results in rainbow trout muscle [22]. According to Rahman et al., the buildup of endogenous ROS triggered autophagy in C2C12 cells, a reaction to sudden nutrient scarcity and mTORC1 inhibition [11]. Additionally, research with HeLa cells indicates that overexpressing SOD can substantially decrease autophagy rates [23]. ATG4 was identified as a direct target for ROS [24]. Studies of Ctenopharyngodon idellus by Wang et al. showed that O2− is one of the major regulators of autophagy [24,25]. Also, we found that the expression of autophagy-related genes increased significantly following 7 d of starvation (p < 0.05). These genes are crucial for various stages of autophagy, encompassing the initiation, expansion, and formation of autophagosome membranes, as well as vesicle recycling [26]. The ULK1 is crucial for the early stages of autophagosome formation, while BECLIN1 is essential for initiating autophagy by generating the isolation membrane, a structure that encapsulates cytoplasmic components to form the autophagosome [27]. Our findings indicate that nutrient deprivation significantly affects the autophagic process in fish muscle. Likewise, Fan et al. (2020) discovered that fasting triggers the complete autophagic process [28]. In muscle tissue, activated autophagy breaks down cellular components, providing energy or substrates that support cell survival. P62 acts as an important connector between autophagy and oxidative stress by interacting with NRF2 [29]. Our findings show that P62 mRNA expression rose after 7 d of starvation in the muscle of rice flower carp, indicating that autophagy triggered by food deprivation could be associated with oxidative stress.
After resuming feeding for 3 d, the ROS level decreased significantly, indicating that the resumption of feeding can reduce the production of ROS. Meanwhile, the mRNA level of BECLIN1, ATG3, ATG4B, ATG4C, ATG5, LC3B, and P62 still remained at a high level (p < 0.05). All autophagy-related gene expression decreased in the 7-day resumed feeding group (p < 0.05). The results observed were consistent with zebrafish after fasting reported by Huang et al [30]. We propose that ROS contribute to oxidative stress and significantly influence the mediation of autophagy during nutrient deprivation.
In summary, we propose that, under short-term fasting for 3 d, the ROS in rice flower carp muscle was accumulated and then the antioxidative systems were activated to eliminate the free radicals. With the fasting prolonged, the accumulation of ROS in muscles exceeded a certain level, the oxidative metabolism system experienced disruption, and it could not release high concentrations of O2− and H2O2. It eventually led to oxidative damage and triggered widespread autophagy in the muscle of rice flower carp.

Author Contributions

J.C.: Methodology, Investigation, and Writing—Original Draft. J.L.: Sample Collection, Investigation, and Software. Z.X.: Software and Validation. Z.L.: Investigation and Data Curation. L.B.: Investigation, Writing—Review and Editing, Funding Acquisition, and Supervision. L.X.: Formal Analysis, Methodology, Funding Acquisition, and Writing—Review and Editing. All authors have read and agreed to the published version of the manuscript.

Funding

This work was supported by the National Key Research and Development Program of China (2022YFD2400802), National Natural Science Foundation of China (U21A20263), Scientific Research Foundation of Hunan Provincial Education Department (21A0534), Natural Science Foundation of Hunan Province of China (2022JJ30633), and Changsha Municipal Natural Science Foundation (kq2007091).

Institutional Review Board Statement

The animal study protocol was approved by Institutional Animal Care and Use Committee at Changsha University (IACUC, permit #20128945-1, 2015) for studies involving animals.

Data Availability Statement

The original contributions presented in the study are included in the article, further inquiries can be directed to the corresponding author.

Conflicts of Interest

The authors declare that they have no conflicts of interest.

References

  1. Caruso, G.; Maricchiolo, G.; Micale, V.; Genovese, L.; Caruso, R.; Denaro, M.G. Physiological responses to starvation in the European eel (Anguilla anguilla): Effects on haematological, biochemical, non-specific immune parameters and skin structures. Fish Physiol. Biochem. 2010, 36, 71–83. [Google Scholar] [CrossRef]
  2. Krogdahl, Å.; Bakke-McKellep, A.M. Fasting and refeeding cause rapid changes in intestinal tissue mass and digestive enzyme capacities of Atlantic salmon (Salmo salar L.). Comp. Biochem. Physiol. Part A Mol. Integr. Physiol. 2005, 141, 450–460. [Google Scholar] [CrossRef]
  3. Pérez-Jiménez, A.; Cardenete, G.; Hidalgo, M.C.; García-Alcázar, A.; Abellán, E.; Morales, A.E. Metabolic adjustments of Dentex dentex to prolonged starvation and refeeding. Fish Physiol. Biochem. 2012, 38, 1145–1157. [Google Scholar] [CrossRef]
  4. Mehner, T.; Wieser, W. Energetics and metabolic correlates of starvation in juvenile perch (Perca fluviatilis). J. Fish Biol. 2010, 45, 325–333. [Google Scholar] [CrossRef]
  5. Preez, H.H.D.; Strydom, W.; Winter, P.E.D. Oxygen consumption of two marine teleosts, Lithognathus mormyrus (linnaeus, 1758) and Lihognathus lithognathus (cuvier, 1830) (Teleosti: Sparidae). Comp. Biochem. Physiol. Part A Physiol. 1986, 85, 313–331. [Google Scholar] [CrossRef]
  6. Sohal, R.S.; Allen, R.G. Oxidative stress as a causal factor in differentiation and aging: A unifying hypothesis. Exp. Gerontol. 1990, 25, 499–522. [Google Scholar] [CrossRef]
  7. Cooke, M.S.; Evans, M.D.; Dizdaroglu, M.; Lunec, J. Oxidative DNA damage: Mechanisms, mutation, and disease. FASEB J. 2003, 17, 1195–1214. [Google Scholar] [CrossRef]
  8. Halliwell, B. Free radicals and antioxidants: A personal view. Nutr. Rev. 1994, 52, 253–265. [Google Scholar] [CrossRef]
  9. Morales, A.E.; Pérez-Jiménez, A.; Hidalgo, M.C.; Abellán, E.; Cardenete, G. Oxidative stress and antioxidant defenses after prolonged starvation in Dentex dentex liver. Comp. Biochem. Physiol. Part C Toxicol. Pharmacol. 2004, 139, 153–161. [Google Scholar] [CrossRef]
  10. Guan, L.; Zhang, L.; Gong, Z.C.; Hou, X.N.; Xu, Y.X.; Feng, X.H.; Wang, H.Y.; You, H. FoxO3 inactivation promotes human cholangiocarcinoma tumorigenesis and chemoresistance through Keap1-Nrf2 signaling. Hepatology 2016, 63, 1914–1927. [Google Scholar] [CrossRef]
  11. Rahman, M.; Mofarrahi, M.; Kristof, A.S.; Nkengfac, B.; Harel, S.; Hussain, S.N. Reactive oxygen species regulation of autophagy in skeletal muscles. Antioxid. Redox Signal. 2014, 20, 443–459. [Google Scholar] [CrossRef]
  12. Saha, S.; Panigrahi, D.P.; Patil, S.; Bhutia, S.K. Autophagy in health and disease: A comprehensive review. Biomed. Pharmacother. 2018, 104, 485–495. [Google Scholar] [CrossRef]
  13. Eisenberg-Lerner, A.; Bialik, S.; Simon, H.U.; Kimchi, A. Life and death partners: Apoptosis, autophagy and the cross-talk between them. Cell Death Differ. 2009, 16, 966–975. [Google Scholar] [CrossRef]
  14. Rabinowitz, J.D.; White, E. Autophagy and metabolism. Science 2010, 330, 1344–1348. [Google Scholar] [CrossRef]
  15. Klionsky, D.J.; Abeliovich, H.; Agostinis, P.; Agrawal, D.K.; Aliev, G.; Askew, D.S.; Paglin, S. Guidelines for the use and interpretation of assays for monitoring autophagy in higher eukaryotes. Autophagy 2008, 4, 151–175. [Google Scholar] [CrossRef]
  16. Mizushima, N.; Komatsu, M. Autophagy: Renovation of cells and tissues. Cell 2011, 147, 728–741. [Google Scholar] [CrossRef]
  17. Yabu, T.; Imamura, S.; Mizusawa, N.; Touhata, K.; Yamashita, M. Induction of autophagy by amino acid starvation in fish cells. Mar. Biotechnol. 2012, 14, 491–501. [Google Scholar] [CrossRef]
  18. Xia, G.; Zhu, T.; Li, X.; Jin, Y.; Zhou, J.; Xiao, J. ROS-mediated autophagy through the AMPK signaling pathway protects INS-1 cells from human islet amyloid polypeptide-induced cytotoxicity. Mol. Med. Rep. 2018, 18, 2744–2752. [Google Scholar] [CrossRef]
  19. Yang, M.; Chuan, Y.; Guo, C.; Liao, J.; Xu, Y.; Mei, X.; Liu, Y.X.; Huang, H.C.; He, X.H.; Zhu, S.S. Panax notoginseng root cell death caused by the autotoxic ginsenoside Rg1 is due to over-accumulation of ROS, as revealed by transcriptomic and cellular approaches. Front. Plant Sci. 2018, 9, 264. [Google Scholar] [CrossRef]
  20. Periasamy, M.; Herrera, J.L.; Reis, F.C. Skeletal muscle thermogenesis and its role in whole body energy metabolism. Diabetes Metab. J. 2017, 41, 327–336. [Google Scholar] [CrossRef]
  21. Robinson, M.K.; Rustum, R.R.; Chambers, E.A.; Rounds, J.D.; Wilmore, D.W.; Danny, O.; Jacobs, M.D. Starvation enhances hepatic free radical release following endotoxemia. J. Surg. Res. 1997, 69, 325–330. [Google Scholar] [CrossRef]
  22. Scherz-Shouval, R.; Shvets, E.; Fass, E.; Shorer, H.; Gil, L.; Elazar, Z. Reactive oxygen species are essential for autophagy and specifically regulate the activity of Atg4. EMBO J. 2019, 38, e101812. [Google Scholar] [CrossRef]
  23. Hosoki, A.; Yonekura, S.I.; Zhao, Q.L.; Wei, Z.L.; Takasaki, I.; Tabuchi, Y.; Wang, L.L.; Hasuike, S.; Nomura, T.; Tachibana, A.; et al. Mitochondria-targeted superoxide dismutase (SOD2) regulates radiation resistance and radiation stress response in HeLa cells. J. Radiat. Res. 2012, 53, 58–71. [Google Scholar] [CrossRef]
  24. Azad, M.B.; Chen, Y.; Gibson, S.B. Regulation of autophagy by reactive oxygen species (ROS): Implications for cancer progression and treatment. Antioxid. Redox Signal. 2009, 11, 777–790. [Google Scholar] [CrossRef]
  25. Wang, Q.; Ju, X.; Chen, Y.; Dong, X.; Luo, S.; Liu, H.; Zhang, D. Effects of L-carnitine against H2O2-induced oxidative stress in grass carp ovary cells (Ctenopharyngodon idellus). Fish Physiol. Biochem. 2016, 42, 845–857. [Google Scholar] [CrossRef] [PubMed]
  26. Sun, T.; Liu, H.; Ming, L. Multiple roles of autophagy in the sorafenib resistance of hepatocellular carcinoma. Cell. Physiol. Biochem. 2017, 44, 716–727. [Google Scholar] [CrossRef]
  27. Levine, B.; Kroemer, G. Biological functions of autophagy genes: A disease perspective. Cell 2019, 176, 11–42. [Google Scholar] [CrossRef]
  28. Fan, X.; Hou, T.; Zhang, S.; Guan, Y.; Jia, J.; Wang, Z. The cellular responses of autophagy, apoptosis, and 5-methylcytosine level in zebrafish cells upon nutrient deprivation stress. Chemosphere 2020, 241, 124989. [Google Scholar] [CrossRef] [PubMed]
  29. Jiang, T.; Harder, B.; De La Vega, M.R.; Wong, P.K.; Chapman, E.; Zhang, D.D. p62 links autophagy and Nrf2 signaling. Free Radic. Biol. Med. 2015, 88, 199–204. [Google Scholar] [CrossRef] [PubMed]
  30. Huang, G.; Zhang, F.; Ye, Q.; Wang, H. The circadian clock regulates autophagy directly through the nuclear hormone receptor Nr1d1/Rev-erbα and indirectly via Cebpb/(C/ebpβ) in zebrafish. Autophagy 2016, 12, 1292–1309. [Google Scholar] [CrossRef] [PubMed]
Figure 1. The expression of the antioxidant-related signaling molecules in the rice flower carp muscle during short-term fasting and resuming feeding. The values are shown as the mean ± SEM of the normalized transcript levels of each antioxidant-related signaling molecule (n = 3 replicate tanks), 3 fish were sampled for each tank, and the data with different letters indicate a significant difference (p < 0.05).
Genes 15 00840 g001
Figure 2. The expression of the antioxidant enzymes in rice flower carp. The muscle during short-term fasting and resuming feeding. The values are shown as the mean ± SEM of the normalized transcript levels of each antioxidant enzyme (n = 3 replicate tanks), 3 fish were sampled for each tank, and the data with different letters indicate a significant difference (p < 0.05).
Genes 15 00840 g002
Figure 3. An autophagosome identified by using electron microscopy in the muscle of rice flower carp. (a) Starvation for 0 d, (b) fasting for 3 d, (c) fasting for 7 d, (d) recovery feeding for 3 d, and (e) recovery feeding for 7 d. The arrow points to the autophagosomes, M indicates mitochondria.
Genes 15 00840 g003
Figure 4. The expression of the autophagy and autophagy-related genes in the rice flower carp muscle during short-term fasting and resuming feeding. The values are shown as the mean ± SEM of the normalized transcript levels of each autophagy-related gene (n = 3 replicate tanks), 3 fish were sampled for each tank, and the data with different letters indicate a significant difference (p < 0.05).
Genes 15 00840 g004
Figure 5. A Western blot analysis of the LC3 protein in the muscle of rice flower carp during short-term fasting and resuming feeding. In the figure above, from right to left, they were fasting for 0 d, fasting for 3 d, and fasting for 7 d. In the figure below, from left to right, they resumed feeding for 3 d and resumed feeding for 7 d. β-actin was used as the loading control. The values represent the mean ± SEM (n = 3 replicate tanks), 3 fish were sampled for each tank, and the data with different letters indicate a significant difference (p < 0.05).
Genes 15 00840 g005
Table 1. The primer sequences used in this study.
GenePrimer (5′-3′)Product (bp)
ATG3 FCGCCAGTTTTGAAGGAATCT142
ATG3 RAGATAGGGCTTCACCTTTGCT
ATG4B FTAGGTGGGAAGCCGAACA202
ATG4B RCAGAAGAAGCCAGCAGCAA
ATG4C FCCGAGGCATTAGATGACGATA119
ATG4C RGATGGTGGAGCCAGGAAGA
ATG5 FCGTTGGGAGACCTGCTGAA180
ATG5 RTTGGTGCTGGGATGATGCT
CAT FAGCAGACACCGTCCGAGAT200
CAT RGCAAACTCCAGAAGTCCCAA
GPX4 FAACCAGTTTGGAAAGCAGGAG227
GPX4 RTTCACCACCTGACCTTCTCG
GSTA FAGACGACCCGACTGAACAAG188
GSTA RTCTCCAAGTATCCATCCCACA
GSTM FCTTGCTCAACCAATCCGTCT188
GSTM RGCATTGCTTTGGACCACTTT
ULK1 FAGGGAGGAAGCCGTAGAAACA161
ULK1 RACAGTGGACAAAAGCCAAGGT
BECLIN1 FAGGAGGTGAAGAGCGATAAGG123
BECLIN1 RCCAGGCGACGGTTGTGA
LC3B FACATTTGAGCAGCGGGTG208
LC3B RGGAAGAAAGCCTGATTGGAGT
SOD1 FATGGTGGACCGACGGATAGT187
SOD1 RTCTTCATTGCCTCCTTTACCC
SOD2 FACTACAGGTCTCGTCCCACT123
SOD2 RGACATTCTCCCAGTTCACAA
Nrf2 FTGCCCAATGAGAATCCCTT166
Nrf2 RATGGGACTTTACTACGGTGG
Keap1 FTTTGCGGAGGAGATTGGC202
Keap1 RTGACCCAAGCGACCCTAC
mTOR FAGGATGGCACCTGACTATGA252
mTOR RATTTGAGCCCTGAGATGAAG
S6K1 FCTGCTCCACATTAGACACCT233
S6K1 RTCTTCCTGGGCTTTACATAC
P62 FCTCTTTACCCTCACCTGCCTCA101
P62 RAGTCAACCAGCCGCCTTCAT
ATG9 FTCAATGAGTTGGACCACGAGC151
ATG9 RGCGATGAGGACAGCCAGAAGA
RpL13 FCAGAGGCTGAAGGAGTACCG122
RpL13 RATGACGGGTCCAGTAAGCTG
Table 2. The antioxidant index in the skeletal muscle of rice flower carp.
Name0 Day3 Day7 DayR3R7
ROS100.03 ± 0.67 a119.42 ± 5.11 bc130.56 ± 4.29 c106.93 ± 3.52 ab107.98 ± 3.95 ab
MDA1.63 ± 0.28 b2.51 ± 0.20 c3.44 ± 0.14 d1.56 ± 0.29 b0.96 ± 0.086 a
SOD5.97 ± 0.45 a16.37 ± 0.34 c24.05 ± 2.08 d18.66 ± 0.97 c11.41 ± 0.73 b
CAT1.65 ± 0.54 a3.56 ± 0.96 e3.03 ± 0.07 d2.45 ± 0.13 c2.14 ± 0.10 b
GST10.91 ± 0.56 ab37.25 ± 8.51 d27.63 ± 1.93 cd17.28 ± 2.01 bc3.82 ± 0.85 a
GPX36.09 ± 1.55 a76.96 ± 3.22 d64.25 ± 2.11 c61.27 ± 2.15 bc54.20 ± 4.43 b
GR23.40 ± 2.23 a74.87 ± 2.74 c94.31 ± 6.04 d73.79 ± 7.82 c49.00 ± 4.55 b
GSH10.39 ± 0.15 ab25.17 ± 2.00 c52.55 ± 0.47 d13.73 ± 1.33 b7.55 ± 1.43 a
The values represent the mean ± SEM (n = 3 replicate tanks); 3 fish were sampled for each tank. The values within the same row having different superscripts are significantly different (p < 0.05). ROS (% DCF florescen), MDA (nmol/mg prot), GST (U/mg prot), CAT (U/mg prot), SOD (U/mg prot), GSH (µmol/L prot), and GPX (U/mg prot).
Disclaimer/Publisher’s Note: The statements, opinions and data contained in all publications are solely those of the individual author(s) and contributor(s) and not of MDPI and/or the editor(s). MDPI and/or the editor(s) disclaim responsibility for any injury to people or property resulting from any ideas, methods, instructions or products referred to in the content.

