Abstract
Cephaleuros species are well-known as plant pathogens that cause red rust or algae spot diseases in many economically cultivated plants that grow in shady and humid environments. Despite their prevalence, the adaptive evolution of these pathogens remains poorly understood. We sequenced and characterized three Cephaleuros (Cephaleuros lagerheimii, Cephaleuros diffusus, and Cephaleuros virescens) chloroplast genomes, and compared them with seven previously reported chloroplast genomes. The chloroplast sequences of C. lagerheimii, C. diffusus, and C. virescens were 480,613 bp, 383,846 bp, and 472,444 bp in length, respectively. These chloroplast genomes encoded 94 genes, including 27 tRNA genes, 3 rRNA genes, and 64 protein-coding genes. Comparative analysis uncovered that the variation in genome size was principally due to the length of intergenic spacer sequences, followed by introns. Furthermore, several highly variable regions (trnY-GTA, trnL-TAG, petA, psbT, trnD-GTC, trnL-TAA, ccsA, petG, psaA, psaB, rps11, rps2, and rps14) were identified. Codon bias analysis revealed that the codon usage pattern of Cephaleuros is predominantly shaped by natural selection. Additionally, six chloroplast protein-coding genes (atpF, chlN, psaA, psaB, psbA, and rbcL) were determined to be under positive selection, suggesting they may play a vital roles in the adaptation of Cephaleuros to low-light intensity habitats.
1. Introduction
The genus Cephaleuros Kunze, from the order Trentepohliales, consists of approximately 17 species found in tropical and subtropical regions [1,2,3]. Cephaleuros species are well-known plant pathogens, parasitic or endophytic in many economically important plants, such as Lansium parasiticum, Psidium guajava, Dimlongan, blackberry, and tea trees [4,5,6,7,8]. Plants infected by Cephaleuros species reduce the photosynthetic area of the leaves and damage their aesthetic value [1]. Moreover, lesions on the surface of fruits, such as guava, may affect their marketability [5]. Members of Trentepohlia are free-living, with several species identified as phycobionts in lichens [9]. The distinct habitat characteristics of two genera are not only important taxonomic traits that distinguish them, but also make them excellent taxa for the study of adaptive evolution.
Plastids are organelles that are unique to plant and algae. They are essential for plant growth and development, including carbon fixation, ATP synthesis, photosynthesis, and lipid biosynthesis [10]. The plastid genome has developed into an essential molecular tool for studying plant adaptive evolution. For example, three plastid genes (rpl16, ndhA, and ndhH) under positive selection may be involved in the adaptation of Rhodiola to low CO2 levels and high-intensity light environments [11]. Similarly, positive selection on nine plastid genes may help Paraboea species adapt to harsh karst environments [12]. Recently, the positive selection of the atpA and ycf2 genes may help Meconopsis adapt to the low CO2 concentration and cold conditions of the plateau habitats [13]. Environmental stress may apply selective pressure to genes, leaving a natural selection footprint on chloroplast genomes. However, the adaptive evolution of Cephaleuros species is still poorly known.
We successfully sequenced three Cephaleuros chloroplast genomes. We then compared these chloroplast genomes with previously published genomes to investigate genome traits and adaptive evolution in the Cephaleuros and Trentepohlia genera. Furthermore, the hotspot regions in the chloroplast genomes were identified. Selective pressure analyses were conducted to determine whether certain genes were subject to purifying or positive selection in Cephaleuros. Finally, phylogenetic relationships were constructed using chloroplast protein-coding sequences and ITS rDNA to verify the genetic relationship of the sequenced chloroplast genomes in genera Cephaleuros and Trentepohlia. Our results provide insights into the adaptive evolution of Cephaleuros.
2. Materials and Methods
2.1. Sample Collection and DNA Extraction
C. lagerheimii was collected from Qingxiu Mountain in Nanning City, Guangxi Province. C. diffusus was obtained from the Wuhan Botanical Garden, Chinese Academy of Sciences in Wuhan City, Hubei Province, and C. virescens from Longkong Cave in Longyan City, Fujian Province. Voucher specimens were identified by Jiao Fang and Huan Zhu based on previous articles [2,3,9]. These specimens were stored at the herbarium of the Institute of Hydrobiology (Wuhan, China), Chinese Academy of Sciences (FACHB) under deposition numbers FACHB-3599, FACHB-3600, and FACHB-3601, respectively. Three samples were cultivated in BBM solid culture dishes containing 1.2% agar. The culture conditions were 12 h light and 12 h dark cycle, and the illumination intensity was 35–50 μmol photons m−2 s−1. A constant 20 °C temperature was maintained within a dedicated culture chamber.
The algal thalli were initially merged with 1 mL ceramic beads (0.5 mm) and 350 μL of phosphate buffer solution (pH 7.0), followed by lysis using a Bioprep-24 Homogenizer (BH-24; Hangzhou Miu Instruments Co., Ltd., Hangzhou, China) at 4000 rpm for 2 min. The UE DNA preparation kit (US Everbright, Suzhou, China) was used to obtain total DNA. The primers and PCR amplification settings for the ITS rDNA were described in a previous article [2]. The results of PCR were subsequently delivered to Sangon Biotech in Shanghai, China, for sequencing. The ITS sequences of Cephaleuros diffusus were deposited in GenBank with accession number PP033476. The ITS sequences of C. lagerheimii and Cephaleuros virescens were retrieved from the National Center for Biotechnology Information (NCBI) website (https://www.ncbi.nlm.nih.gov/, accessed on 20 November 2022).
2.2. Chloroplast Genome Assembly and Annotation
The genomic DNA was acquired using the CTAB technique [14]. Subsequently, sequencing was executed using an Illumina NovaSeq 6000 at the Benagen company in Wuhan, China. To ensure the reliability of the data, it was essential to filter the raw data for low-quality sequences and remove adapters. We utilized the SOAPnuke 2.X version to filter the raw data, resulting in the high-quality and clean reads [15]. This critical step was taken to ensure the reliability and accuracy of subsequent analyses. SPAdes 3.15.5 was then used to assemble the clean reads [16].
The annotation of chloroplast genomes was executed utilizing GeSeq (https://chlorobox.mpimp-golm.mpg.de/geseq.html, accessed on 18 December 2022) [17]. Additionally, the refinement of protein-coding and rRNA genes was achieved through BLAST alignment with the chloroplast sequence of Trentepohlia odorata. The identification of tRNA genes was validated by tRNAScan-SE [18]. Chloroplast genomic maps were generated with OGDRAW [19]. The annotated chloroplast sequences of C. virescens, C. lagerheimii, and C. diffusus were subsequently uploaded to the NCBI, with numbers OQ848499, OQ848500, and OQ848501, respectively (Table 1).

Table 1.
General characteristics and comparison of the chloroplast genomes of Cephaleuros and Trentepohlia. The three chloroplast genomes obtained in this study are shown in bold.
2.3. Genome Comparison and Divergent Hotspots Identification
Seven sequences from the Cephaleuros and Trentepohlia genera were obtained from the NCBI, including three sequences from Cephaleuros and four from Trentepohlia (Table 1). Whole genome alignments were performed using progressiveMauve, which was integrated into the Mauve version 20150226, employing the default settings [20]. Double-cut-and-join (DCJ) genome distances were calculated using UniMoG [21]. Furthermore, to identify variable regions within the two genera, nucleotide diversity (Pi) values were obtained for common genes using DnaSP v6 [22].
2.4. Codon Bias Analyses
Parameters related to codon bias analysis were obtained employing CodonW 1.4.2 (https://codonw.sourceforge.net/culong.html#CodonW, accessed on 25 December 2022). These included T3, C3, A3, and G3, representing the frequencies of T, C, A, and G usage at the third base of the codons. Additionally, GC3s refers to the GC content in the third position of the synonymous codons, and the ENc (effective number of codons) was also calculated using CodonW 1.4.2.
The GC content of the first (GC1), second (GC2), and third codon (GC3) positions was determined using the online CUSP tool (https://www.bioinformatics.nl/emboss-explorer/, accessed on 25 December 2022).
The parity rule 2 (PR2) plot was utilized to explore the nucleotide composition at the third position of codons. This commonly adopted method facilitates the determination of whether mutation pressure or selection pressure dominates the nucleotide composition in DNA double strands. In the PR2 plot, the horizontal and vertical coordinates represent G3/(G3+C3) and A3/(A3+T3), respectively. If only mutation pressure influences the codons, the result is all the points being in the center of the plot. Alternatively, if codon usage is influenced by natural selection and other factors, it causes the points to deviate from the center of the plot [23].
In the ENc-GC3s plot, the GC3s is plotted on the horizontal axis, while the actual ENc values (actENc) are plotted on the vertical axis. Notably, codons encoding methionine (Met) and tryptophan (Trp) were excluded due to their absence of synonymous codons. The expected ENc (expENc) values were obtained using the following formula:
A standard curve was generated based on the expected values. Data points that lie on the standard curve indicate a significant influence of mutational pressure on codon usage. Conversely, data points significantly below the standard curve indicate that natural selection and other factors may be the primary driving forces influencing codon usage patterns [24]. ENC ratio (ENcratio) was determined using the following formula, which illustrates the difference between the actENc and expENc values:
Neutrality plot analysis was conducted to investigate the extent of influence between mutation pressure and natural selection on codon usage patterns. GC12 (the average GC content at the first and second positions of codon), GC1, GC2, and GC3 were analyzed. The GC3 content was plotted on the horizontal axis, while the GC12 content was plotted on the vertical axis, resulting in two-dimensional scatter plots representing individual genes. In the neutrality plot, if the slope of the regression curve approaches 0, and there is no significant correlation between GC12 and GC3, it shows that natural selection is the primary factor driving codon usage patterns. Conversely, when the slope is close to or equal to 1, and a significant correlation exists, it indicates that mutation pressure is likely to exert significant influence on gene evolution [25].
2.5. Selective Pressure Analyses
A selective pressure analysis was performed on 10 chloroplast genomes of Trentepohliales, employing three distinct calculations. Firstly, pairwise Ka/Ks ratios were calculated based on concatenated protein-coding genes. Secondly, Ka/Ks ratios were determined as the single protein-coding gene. Finally, the branch-site model was employed for further analysis. Sixty-four protein-coding genes were obtained and concatenated into a super array using PhyloSuite v1.2.3 [26]. Each gene was aligned by muscle (codons) pattern in MEGA 6 [27]. The KaKs_Calculator v2.0 was applied to determine the pairwise Ka/Ks ratios for each species [28]. Similarly, Ka/Ks ratios were calculated for each protein-coding gene independently.
The ratio between nonsynonymous and synonymous substitution rates (ω) was employed to assess the selective pressure. This ratio provides insights into the presence of negative purifying selection (0 < ω < 1), neutral evolution (ω = 1), or positive selection (ω > 1). To identify potential positive selection, we employed the branch-site model within the CODEML tool of the PAML v4.9 [29]. In this analysis, we focused on 54 single-copy genes extracted from chloroplast genomes, with the genus Cephaleuros designated as the foreground branch.
Two models were employed within the branch-site analysis: a null branch-site model (model = 2, NSsites = 2, fix_omega = 1, omega = 1) and an alternative branch-site model (model = 2, NSsites = 2, fix_omega = 0, omega = 2). A statistical likelihood ratio test (LRT) was employed to evaluate the potential for positive selection by comparing the alternative branch-site model to the null branch-site model. The p-values were calculated using the Chi-square program in PAMLX v1.3.1 [30]. Furthermore, a Bayes Empirical Bayes (BEB) analysis was performed to assess the posterior probabilities of positive selection sites [31]. Sites with BEB values > 0.95 and p-values < 0.05 were considered to be positively selected. Finally, the PSIPRED server was employed to visualize the amino acid sequences and their corresponding secondary structures in positively selected genes [32]. Additionally, the protein structures of these genes were predicted using SWISS-MODEL online web-server [33].
2.6. Phylogenetic Inference
Phylogenetic inferences were constructed, based on the ITS rDNA and chloroplast protein-coding sequences, to verify the identity of the strains. In the first phylogenetic analysis, Trentepohlia prolifera KX586859 and Trentepohlia sp. KX586863, downloaded from GenBank, were selected as the outgroup. Alignment of all sequences was achieved using MAFFT v7.520 [34], and unclear regions were subsequently trimmed through TrimAl v1.2 with the -gt 0.8 option [35]. The best models were detected using ModelFinder [36].
A phylogenetic tree was constructed for the core Chlorophyta, comprising 102 core Chlorophyta species, with 5 Prasinophyte species selected as outgroups. In order to facilitate phylogenetic reconstruction, 31 conserved protein-coding genes identified in a previous study were used [37], encompassing atpA, atpB, atpF, atpH, rps7, rps8, rps9, petB, petD, petG, psaB, psaC, clpP, rbcL, rpl2, rpl5, rpl14, rpl16, rpl20, rps11, rps18, rps19, tufA, ycf3, psbA, psbB, psbJ, psbK, psbM, psbN, and psbZ.
Protein-coding genes were extracted by PhyloSuite v1.2.3 [26]. Sequences were aligned utilizing MAFFT v7 with the ‘-auto’ strategy and codon alignment mode [34]. The alignments were optimized using MACSE v2.06 to obtain a final alignment [38]. The Gblocks program was employed to eliminate the ambiguously aligned regions of alignments [39]. Subsequently, the Concatenate Sequence tool in PhyloSuite v1.2.3 was used to concatenate the aligned sequences [26].
Phylogenetic analyses were conducted employing Bayesian inference (BI) and maximum likelihood (ML) methods. The software MrBayes v3.2.6 and the online tool IQ-TREE (https://www.hiv.lanl.gov/content/sequence/IQTREE/iqtree.html, accessed on 27 December 2022) were employed for the BI and ML analyses, respectively [40,41]. ModelFinder was employed to identify the optimal partition model based on the Bayesian Information Criterion (BIC) [36]. The ML analysis was performed using 1000 bootstrap replicates. The BI tree was performed for 8,000,000 generations in the ITS rDNA. The first quarter of the trees were burned in. The remaining trees were harnessed for the generation of a consensus tree. The resulting phylogenetic trees were visualized using FigTree v1.4.2 (http://tree.bio.ed.ac.uk/software/figtree/, accessed on 27 December 2022).
3. Results
3.1. Three New Cephaleuros Chloroplast Genomes
The assembled plastid lengths for C. lagerheimii (OQ848500), C. diffusus (OQ848501), and C. virescens (OQ848499) were 480,613 bp, 383,846 bp, and 472,444 bp, respectively. The 3 sequenced chloroplast genomes exhibited a circular molecule, with no inverted repeat (IR) regions (Figure 1). Within these 3 Cephaleuros genomes, 94 genes were determined, including 64 protein-encoding genes, 27 tRNA genes, and 3 rRNA genes (Table 1 and Table S1). The total GC contents of C. lagerheimii, C. diffusus, and C. virescens were 29.5%, 33.4%, and 33.7%, respectively. The rpoC2 was absent in C. lagerheimii, the ycf1 was missing in C. virescens, and the rpl32 was completely absent in C. diffusus.
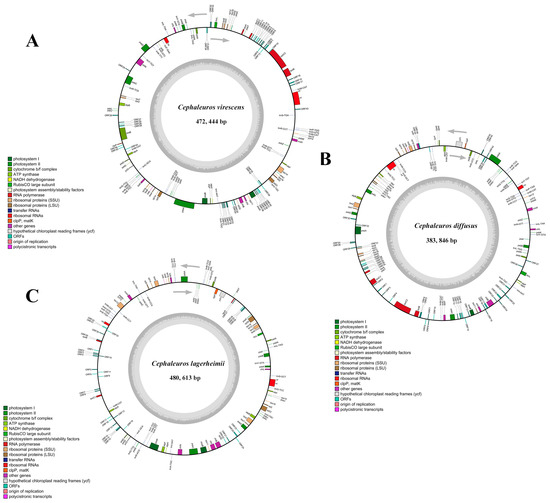
Figure 1.
Gene maps of three Cephaleuros chloroplast genomes: (A) Cephaleuros virescens; (B) Cephaleuros diffusus; and (C) C. lagerheimii. The clockwise arrow denotes the direction of transcription of genes inside the circle. The counterclockwise arrow denotes the direction of transcription of genes outside the circle. The GC content is shown in dark gray, and the AT content is shown in light gray. Genes are annotated with various colors according to the different functions.
The results of the nucleotide diversity analysis, based on 77 common genes, are depicted in Figure 2A. The average pairwise sequence divergence (Pi) value was 0.15699, and Pi values varied from 0 to 0.53162. Notably, 13 genes (trnY-GTA, trnL-TAG, petA, psbT, trnD-GTC, trnL-TAA, ccsA, petG, psaA, psaB, rps11, rps2, and rps14) exhibited relatively high Pi values (Figure 2A). These highly variable loci may prove useful for phylogenetic inference. In general, protein-coding genes displayed more polymorphisms compared to tRNA genes (Figure 2B).
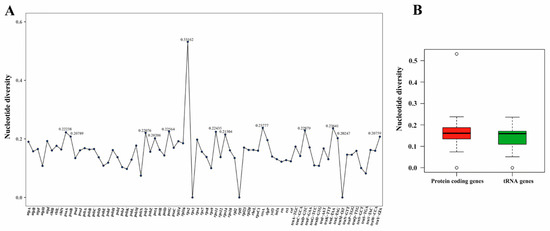
Figure 2.
The variation of nucleotide diversity among the genera Cephaleuros and Trentepohlia: (A) nucleotide diversity values (Pi) among the 10 sequenced chloroplast genomes and (B) comparison of Pi values between chloroplast coding genes and tRNA genes. The bold solid black line in the graph represents the location of the median.
3.2. Comparative Analysis
A comparative analysis based on chloroplast genomes was conducted within the genus Cephaleuros. In addition to the newly sequenced genomes, three previously published Cephaleuros chloroplast genomes, accessible in the NCBI database, were included in the analysis. The lengths of Cephaleuros chloroplast genomes ranged from 266,729 bp (C. parasiticus) to 480,613 bp (C. lagerheimii), and the three sequenced chloroplast genomes have no inverted repeat regions (Table 1). The number of genes ranged from 94 to 98.
Furthermore, comparative analysis of the genera Cephaleuros and Trentepohlia was performed. Only T. odorata exhibited a quadripartite structure, comprising the large single-copy (LSC) sequence, the small single-copy (SSC) sequence, and two inverted repeats (IRs). However, in Trentepohlia sp. YN1242 and Trentepohlia sp. YN1317, as well as in the genus Cephaleuros, the IR region had been lost. The sequenced chloroplast genomes of two genera ranged in length from 216,308 bp to 480,613 bp. The variation of chloroplast genome length was primarily attributed to differences in intergenic regions, followed by introns (Figure 3A). The genes in these genomes ranged from 93 to 97, including 3 rRNA genes, 25 to 30 tRNA genes, and 63 to 65 protein-coding genes. The range of the total GC content was 25.9% to 36.1% (Table 1).
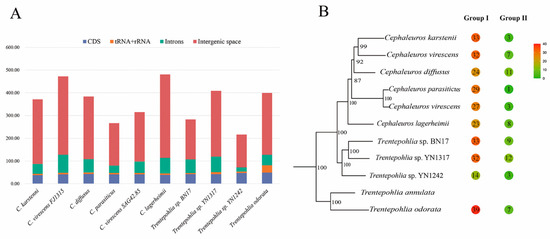
Figure 3.
(A) Variation of chloroplast genomes size in the genera Cephaleuros and Trentepohlia. The plastid protein-coding regions are conserved, and differences in genome size are primarily explained by intergenic space and introns. (B) Group I introns and group II introns of Cephaleuros and Trentepohlia. In the colored circles, red represents a higher number of introns, while green represents a lower number of introns. The number inside the circle represents the number of introns.
Intron variation played a crucial role in chloroplast genome size (Figure 3A). The chloroplast introns were identified in both rRNA and protein-coding genes, but not in tRNA genes. Notably, the number of group I introns was significantly higher than that of group II introns (Figure 3B). Among the species analyzed, only T. odorata, which possessed the inverted repeats (IRs), exhibited the highest number of group I introns. Interestingly, the presence of group I introns in the rpl2 gene was exclusive to Trentepohlia algal strains (Figure S1). Furthermore, group I introns were identified in the psbC and rrl genes of all sequenced chloroplast genomes, and all introns in rRNA were classified as group I.
More than 50 local collinear blocks were found, revealing significant rearrangements and inversions within Cephaleuros (Figure S2). Notably, the highly divergent regions were primarily located in the intergenic regions, such as trnM–rpoB, rpoC2–rpoC1, chlN–psbC, atpB–psbL, psbJ–petB, and trnM–atpA. Additionally, some divergences were observed in the coding regions, including psaC–rpl20–rps18–rpl12–rps3–rps9, rps7–rps2, psbB, psbK, and petD. Genome rearrangements provide insights into evolutionary dynamics at the genomic level. The lowest DCJ value (10) was observed between C. virescens SAG 42.85 and C. parasiticus GD1927, while the highest value (41) was found among different C. virescens algae strains (Table S2). Similarly, synteny analysis of the genera Cephaleuros and Trentepohlia revealed considerable inversions and rearrangements (Figure S3). The DCJ values for pair-to-pair comparisons among two genera are presented in Table S3. The highest DCJ value (69) was observed between C. parasiticus and T. odorata, while the DCJ values between T. odorata and C. virescens SAG 42.85 was 68 (Table S3).
3.3. Codon Usage Analyses
In PR2 plot analysis, the expected pattern under the influence of mutation pressure alone is that the frequencies of nucleotides A and T are equal to that of C and G at the third codon position. This causes the genes to cluster in the center of the plot. Conversely, if natural selection is at play, the relative usage of A and T bases would differ from that of G and C nucleotides, resulting in genes deviating from the center of the plot. The scatter plots representing the A3/(A3+T3) and G3/(G3+C3) values are depicted in Figure 4. The A/T-bias values were determined as 0.522, 0.524, 0.520, 0.514, 0.517, 0.517, 0.508, 0.523, 0.518, and 0.537 for C. diffusus, C. karstenii, C. lagerheimii, C. parasiticus, C. virescens (FJ1315), C. virescens (SAG 42.85), T. odorata, Trentepohlia sp. (BN17), Trentepohlia sp. (YN1242), and Trentepohlia sp. (YN1317), respectively. The G/C-bias values were 0.443, 0.461, 0.474, 0.484, 0.503, 0.483, 0.416, 0.495, 0.455, and 0.463, respectively. Notably, the distribution of coding sequences (CDSs) did not exhibit an even distribution around the center point (A=T, G=C). The majority of genes were positioned above the horizontal centerline of 0.5, indicating a ratio of A3/(A3+T3) > 0.5, particularly observed in Trentepohlia species. These findings indicate a bias towards A and C at the third position of codons in chloroplast genes, suggesting a significant influence of selection pressure on codon usage patterns. Nevertheless, it is important to note that a few genes were positioned close to the center, illustrating that the mutation pressure cannot be disregarded.
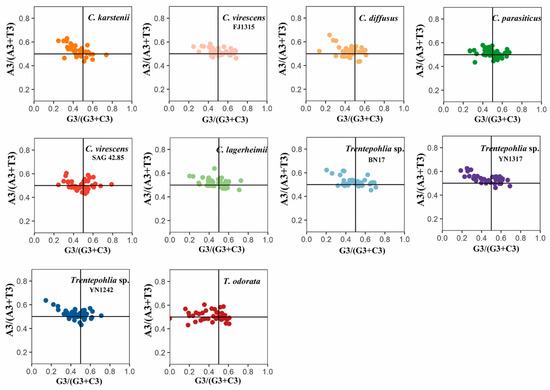
Figure 4.
PR2 plot of chloroplast genomes of the genera Cephaleuros and Trentepohlia. If there is no codon usage bias, A=T and C=G, and the point lies at the center of the graph. The first quadrant represents codon bias towards A/G at the third position of the codon, while the third quadrant represents a preference for T/C at the third position of the codon. The different coloured dots in the figure represent genes from different species.
In an ENc plot, the points located on the standard curve indicate an influence of mutation pressure on codon usage. Conversely, the points that deviate from the standard curve suggest that natural selection and other factors may be the primary driving forces influencing codon usage patterns. The distributions of ENc and GC3s in the 10 chloroplast genomes exhibit similarity (Figure 5). Some points are dispersed along or around the standard curve, while others are below the standard curve. These results indicate that the codon usage bias of the chloroplast genomes of the two genera is influenced not only by mutation pressure but also by natural selection and other factors. The ENC frequency of chloroplast genes in the 10 sequenced chloroplast genomes was calculated to better observe the difference between the actENC and expENC value (Figure 6). In Figure 6, most of the ENC ratios were distributed between 0~0.1, indicating that the actual ENC were slightly smaller than expected. The results verified that most of the points in Figure 5 were below the standard curve, suggesting that mutation pressure might be a weak factor affecting the evolutionary history of the two genera.
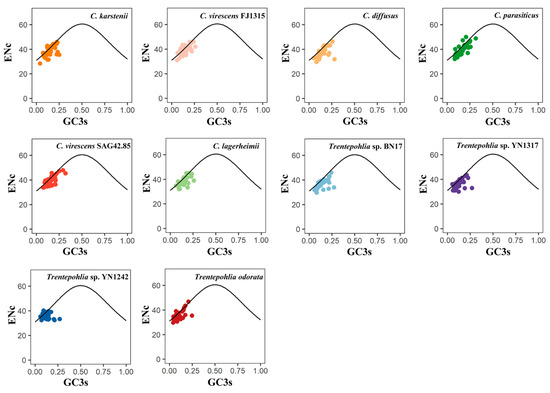
Figure 5.
ENc plot of chloroplast genomes of the genera Cephaleuros and Trentepohlia. ENC denotes the effective number of codons, and GC3s denotes GC content in the third position of synonymous codons. The standard curve represents the expected ENC values. Points on or near the curve suggest bias caused by mutation pressure. Points that deviate from the curve suggest bias influenced by natural selection or other factors. The different coloured dots in the figure represent genes from different species.
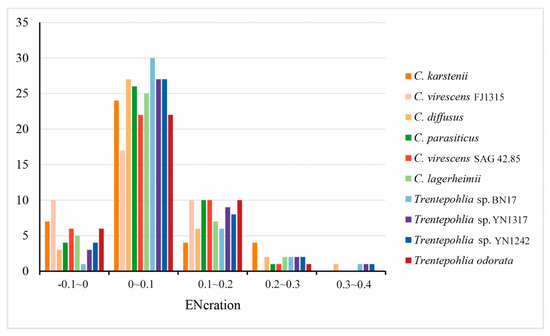
Figure 6.
Distribution of ENC frequency of chloroplast genomes in the genera Cephaleuros and Trentepohlia.
In the neutrality plots, these genes had a narrow range of GC12 (0.26~0.51) and GC3 (0.04~0.345) values (Figure 7). There was no significant correlation between GC12 and GC3 in the 10 sequenced chloroplast genomes (rck = 0.2851, rcv = 0.0265, rcd = 0.3561, rcp = 0.1425, rcv4285 = 0.1789, rcl = 0.0141, rT17 = 0.1386, rT1317 = 0.2377, rT1242 = 0.3161, and rTo = 0.0529), which indicated that mutation pressure had a slight effect on the codon usage bias. Among the 10 chloroplast genomes, the slopes of the regression lines were 0.2586, 0.0236, 0.3596, 0.0027, 0.1414, 0.0154, 0.1185, 0.2354, 0.3773, and −0.0627. This indicates that the mutation pressure effect accounted for only 0.27% to 37.73%, highlighting the significant role of natural selection. The results demonstrate that codon usage bias is slightly affected by mutation pressure, while natural selection and other factors may play important roles.
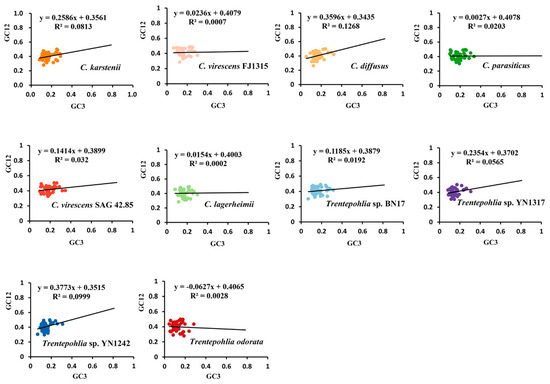
Figure 7.
Neutrality–plot of chloroplast genomes of the genera Cephaleuros and Trentepohlia. GC12 represents the average GC content at the first and second positions of the codons. GC3 represents the GC content in the third position of codons. The black solid line represents the regression line. The equation of the regression line is shown at the top of each plot. The different coloured dots in the figure represent genes from different species.
3.4. Selective Pressure Analyses
We conducted Ka/Ks calculations to assess selective pressures within the 10 sequenced chloroplast genomes by constructing a super-matrix from all 64 coding sequences. The majority of Ka/Ks values fell within the range of 0.05 to 0.2, indicating evidence of purifying selection on these chloroplast genes (Figure 8A, Table S4).
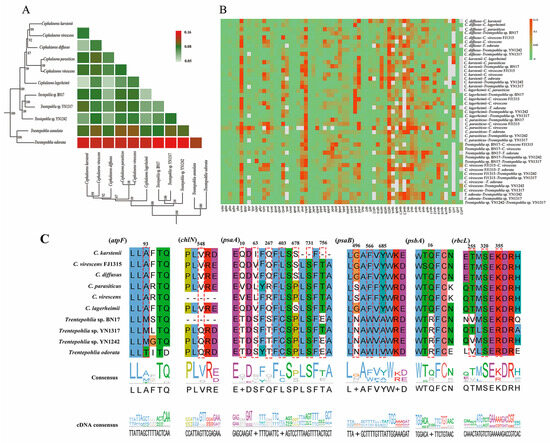
Figure 8.
(A) Pairwise Ka/Ks ratios among the Cephaleuros and Trentepohlia species. Heatmap denotes pairwise Ka/Ks ratios between every sequence in the multigene nucleotide alignment. (B) Pairwise Ka/Ks ratios of different genes of Cephaleuros and Trentepohlia species. Heatmap indicates pairwise Ka/Ks ratios among each individual gene in the 10 sequenced chloroplast genomes. Grey represents missing genes so that the Ka/Ks ratio cannot be calculated. (C) The amino acids sequences of six genes of positive selection. The red dashed lines denote the amino acids with a high BEB posterior probability in Cephaleuros and Trentepohlia species.
Additionally, we calculated Ka/Ks values individually for all 64 protein-coding genes (Figure 8B, Supplementary Table S5). Among these genes, three (psbA, psbT, and rps9) exhibited Ka/Ks values around 0.5 in certain species, suggesting the possibility of positive selection. Most of the other genes exhibited Ka/Ks values ranging from 0.01 to 0.1, indicating strong purifying selection (Supplementary Table S5).
To further determine the chloroplast protein-coding genes that potentially underwent positive selection in the 10 sequenced chloroplast genomes, a branch-site model analysis was conducted for 54 single-copy genes, and the free-living Trentepohlia species were selected as foreground branches. The result indicated six protein-coding genes (atpF, chlN, psaA, psaB, psbA, and rbcL) have been under positive selection, most of which are related to photosynthesis (e.g., psaA, psaB, psbA) (Figure 8C, Table S6).
Bayes Empirical Bayes analysis identified 16 sites with significant posterior probabilities, indicating positive selection. Among the identified sites, six exhibited Bayes Empirical Bayes posterior probabilities exceeding 0.99, the remaining sites exhibited probabilities exceeding 0.95. Three genes (atpF, chlN, and psbA) had only one positively selected site, whereas psaA, psaB, and rbcL contained 7, 3, and 3 positively selected sites, respectively. Notably, in the positively selected sites of atpF, all Cephaleuros species encoded alanine, Trentepohlia species without IR encoded methionine, and species containing IR encoded threonine (Figure 8C). This further elucidates the specificality of Cephaleuros. In the psaA gene, all Trentepohlia chloroplast genomes encoded the same amino acids at the 10th and 63rd sites, while the amino acids encoded in Cephaleuros were different. At the 403rd site, all Cephaleuros encoded leucine (L), while all Trentepohlia encoded cysteine (C). A similar pattern was observed at the 566th and 685th sites of psaB and the 16th site of psbA, where all Trentepohlia encoded the same amino acid, whereas all Cephaleuros encoded another identical amino acid. All 10 sequenced species encoded serine at the 731st site of psaA and the 320th site of rbcL, but variations occurred at the codon level (Figure 8C). Furthermore, the spatial analysis of the atpF protein revealed that the site under positive selection was inside in the α-helix (Figure 9A). The positive selection sites of both the chlN and psbA genes were also located in the α-helix. Four amino acid sites (403rd, 678th, 731st and 756th) under positive selection in psaA were found in the α-helix, two amino acid sites (10th and 63rd) were located in a random coil, and one amino acid site (267th) was located in β-turn. Three amino acid sites (496th, 566th and 685th) that were subject to positive selection in psaB were located in a random coil. One amino acid site (255th) under positive selection in rbcL was situated in an α-helix and two sites were displayed in a random coil.
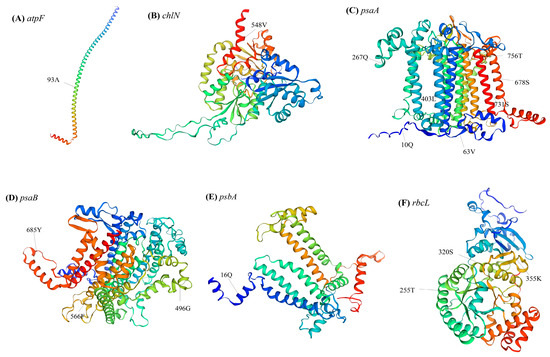
Figure 9.
Spatial distribution of the positively selected sites: (A) spatial distribution of the positively selected sites in the atpF; (B) spatial distribution of the positively selected sites in the chlN; (C) spatial distribution of the positively selected sites in the psaA; (D) spatial distribution of the positively selected sites in the psaB; (E) spatial distribution of the positively selected sites in the psbA; and (F) spatial distribution of the positively selected sites in the rbcL.
3.5. Phylogenetic Inferences
The first phylogenetic tree based on ITS rDNA was constructed to confirm the identity of our algal strains. The best-fit models for the Bayesian inference (BI) and maximum likelihood (ML) analyses were K2P+G4 and GTR+F+G4, respectively. The phylogenetic trees constructed by the ML and Bayesian methods showed similar topologies. The phylogenetic analysis supported that C. diffusus HB1902 was located within the C. diffusus branch with a strong support value (Figure S4). C. virescens FJ1315 was found to cluster with other C. virescens downloaded from the NCBI database. C. lagerheimii was distinguished from other Cephaleuros species and formed a single branch (Figure S4).
The phylogenetic relationships of the three Cephaleuros species were inferred, based on 31 chloroplast protein-coding genes, using Prasinophytes as an outgroup. The best-fit models for the maximum likelihood (ML) analysis are presented in Table S7. C. virescens FJ 1315 was found to cluster with the morphologically similar C. karstenii, and C. diffusus was sister to C. virescens and C. karstenii (Figure S5). Furthermore, this result showed that Cephaleuros virescens was not monophyletic. C. lagerheimii formed a distinct branch, which was consistent with the phylogeny of ITS rDNA (Figures S4 and S5).
4. Discussion
4.1. Variations in Chloroplast Genomes
Cephaleuros species are parasitic, and Trentepohlia species are free-living. Their distinct habitats make them excellent materials for studying adaptive evolution. Previous studies have reported three Cephaleuros chloroplast genomes and four Trebtepohlia chloroplast genomes, and compared them with other Ulvophyceae taxa [37,42]. However, few studies have been conducted on codon usage bias and adaptive evolution of these two genera with distinct habitats. We present the chloroplast genomes of C. lagerheimii and Cephaleuros diffusus for the first time and add the chloroplast genome data of C. virescens, which facilitate the analysis of Cephaleuros adaptive evolution. We then compared these chloroplast genomes with previous published genomes [37,42], and conducted adaptive evolution analyses in Cephaleuros and Trentepohlia.
Chloroplast genomes typically exhibit highly conserved structures, consisting of a circular molecule containing a large single-copy (LSC) region, a small single-copy (SSC) region, and a pair of inverted repeats (IRs) [43]. In this study, three sequenced genomes had no IR region, which was consistent with previously released Cephaleuros chloroplast genomes [37]. The IR regions of some organisms were absent, which seems to be common in green algae groups, such as Cephaleuros (this article), Bryopsidales, Chaetophorales, and Watanabeales [44,45,46]. The chloroplast genomes of the parasitic habitat-dwelling Cuscuta also lacked inverted repeat regions [47]. Moreover, the plastid genome of Chromera velia was linear [48], the Cladophorales chloroplast genome was entirely broken into hairpin chromosomes [49], and the chloroplast genome of dinoflagellates exhibited an unusual splitting into minicircles ranging from 2 to 10 kb in size [50].
Photosynthetic land plant plastid genomes range from 120 to 160 kb [51]. The chloroplast genomes of Cephaleuros and Trentepohlia species exhibit a broader size range, spanning from 216,308 to 480,613 bp. Notably, 9 out of the 10 sequenced chloroplast genomes exceeded 250 kb in size (Table 1). The significant differences in genome length are mainly due to variations in the length of intergenic regions (Figure 3A). For instance, the largest chloroplast genome is more than two times larger than the smallest chloroplast genome in the two genera. This is primarily due to discrepancy in the length of intergenic regions. The chloroplast genome of Floydiella terrestris, which is found in soil habitats, was the largest chloroplast genome ever sequenced (521,168 bp). Intergenic regions accounted for 77.8% of its genome length [52]. Furthermore, the intergenic regions significantly contribute to the variation in chloroplast genome size in Prasiolopsis and Watanabea species [46,53]. Previous studies indicate that the intergenic regions of terrestrial algae chloroplast genomes tend to be larger than those of their aquatic counterparts [54]. A synteny analysis revealed numerous rearrangements and inversions in the intergenic regions (Figures S2 and S3). Therefore, the intergenic regions may play an essential role in the adaptive evolution of terrestrial algae.
4.2. Codon Usage Bias
Research on codon usage bias has been conducted in bacteria, plants, and animals [55]. This is the first study to systematically analyze the codon usage pattern of the Cephaleuros and Trentepohlia species. The advancement of next-generation sequencing technology has made it possible to gain a large number of algal chloroplast genomes, including those of Trentepohliales species, thus facilitating the study of codon usage bias. In the present study, we analyzed 10 chloroplast genomes of Cephaleuros and Trentepohlia genera to investigate codon usage patterns and the factors that influenced the codon usage bias.
In PR2 plot analysis, when only mutational pressure acts on the codons of chloroplast genes, all the points should be located in the center of the plot. It was obvious that our results showed an uneven distribution of genes in the four quadrants (Figure 4). The numerous data points deviate from the center, while a few points are situated near or on the center (Figure 4), indicating that codon usage patterns are jointly influenced by mutations and selection pressure, with natural selection playing a prominent role. Furthermore, in the vertical direction, the majority of genes were situated above the center line. In the horizontal direction, there were more genes on the left than on the right. Therefore, A was used more frequently compared to T, and C was used more frequently compared to G at the third position of codons.
In the ENC plot, a few genes were found to be close to the expected line, indicating that the codon bias of these genes was correlated to mutation pressure. However, the majority of genes were situated below the expected curve, revealing the actual ENc values were smaller than expected (Figure 5 and Figure 6). This indicates that codon bias was influenced by natural selection.
Neutrality analysis indicates that if there is a significant correlation between GC12 and GC3, and the slope of the regression line is near to one, it can be concluded that mutation pressure is the predominant factor influencing codon usage patterns. Conversely, if the relationship is not significant, then the slope of the regression line is close to 0, indicating that codon bias is primarily influenced by natural selection [25]. In the present study, there was no significant correlation between GC12 and GC3, and the slope of the regression line was close to 0 (Figure 7). Our results showed that the GC3 contents in the chloroplast genomes of Cephaleuros and Trentepohlia species were consistently less than 40% (Figure 7). This suggests a preference for codons ending with A and T. The PR2 plot and ENC plot revealed that natural selection plays a dominant role in determining the codon usage in the genera Cephaleuros and Trentepohlia, while mutation pressure plays a secondary role.
4.3. Adaptive Evolution and Positive Selection
Genome sequences of closely related species make it possible to quantify the frequency of positive and negative selection in the genome [28]. The Ka/Ks ratio serves as a measure of natural selection. The values of Ka/Ks < 1, =1, and >1 indicate negative purifying selection, neutral evolution, and positive selection, respectively [28]. In the genera Cephaleuros and Trentepohlia, the pairwise Ka/Ks ratios at the chloroplast genome level were significantly less than 1, indicating strong purifying selection (Figure 8A, Table S4). The average Ka/Ks ratio for the chloroplast protein genes analyzed in the 10 genomes was 0.0442. The majority of genes have Ka/Ks values between 0 and 0.01, indicating that most genes were subjected to purifying selection in order to maintain their conserved functions (Table S5). A small number of genes, such as psbA, psbT, and rps9, had Ka/Ks ratios around 0.5, implying the presence of potential positive selection sites.
The Cephaleuros species are parasitic or endoparasitic on the leaves or twigs of plants that inhabit shaded and humid environments [2]. We inferred that some genes in the plastids of Cephaleuros might have undergone adaptive evolution to adapt to shaded and humid environments. In our study, the branch-site analysis revealed positive selection in six genes (atpF, chlN, psaA, psaB, psbA, and rbcL) of Cephaleuros species (Figure 8C). These genes can be classified into three categories: photosystem subunit genes (psbA, psaA, psaB, and rbcL), ATP subunit genes (atpF), and chlorophyll biosynthesis gene (chlN).
Notably, four genes (psbA, psaA, psaB, and rbcL) associated with photosynthesis are under positive selection, and psbA encodes one of the two reaction center proteins in photosystem II. The reaction center of photosynthesis is photosystem II, which uses light energy to drive the oxidation of water, producing O2 and a proton gradient subsequently used to produce ATP [56]. The psbA is vital for the assembly or function of the photosystem II complex. The psbA gene was detected under positive selection in Curcuma and Oedogonium [57,58]. It is speculated to play an important role in the evolutionary adaptation of these organisms to different light intensities. Two photosystem I subunits (psaA and psaB) were under positive selection. The psaA and psaB bind P700 (the primary electron donor of photosystem I), as well as the electron acceptors A0, A1, and FX in photosystem I. Photosystem I is a plastocyanin/cytochrome c6-ferredoxin oxidoreductase, converting photonic excitation into a charge separation, which transfers an electron from the donor P700 chlorophyll pair to the spectroscopically characterized acceptors A0, A1, FX, FA and FB [59]. Notably, the psaA gene possessed the highest number of sites under positive selection, suggesting its pivotal role in the adaptive evolution of Cephaleuros species. The three positive selection sites in rbcL gene were discovered in Cephaleuros species. The rbcL gene encoded the large subunits of Rubisco, which plays an important modulating role in photosynthetic electron transport [60]. Previous studies revealed that the rbcL had also undergone adaptive evolution in Orchidaceae, Zingiberoideae, and Lardizabaloideae [61,62,63]. Genes related to photosynthesis are more likely to evolve adaptively in plants distributed in shady or sunny environments. In particular, rbcL and atpF are also under selection pressure in shade-tolerant Oryza species and shade-demanding Panax species, probably in response to low-light intensity [64,65]. Cephaleuros species are typically parasitic or endoparasitic on leaves or twigs of plants in wet and shady habitats. Therefore, the positive selection genes involved in photosynthesis may play a crucial role in the adaptive evolution of Cephaleuros to low-intensity light.
The atpF encodes the subunits of the H+-ATP synthase, which plays an essential role in ATP synthase and photophosphorylation during photosynthesis [66]. Positive selection on the atpF genes may contribute to meeting the energy demands of Cephaleuros during its adaptation to diverse environmental conditions. The chlN gene, together with chlB and chlL, encodes the light-independent protochlorophyllide oxidoreductase (LIPOR) proteins, which play a crucial role in the conversion of protochlorophyllide to chlorophyllide during chlorophyll biosynthesis in the dark [67]. The chlN genes were not universally distributed in plastids, and have been subjected to pseudogenization or lost in cryptophyte algae [68]. However, the gene remains in the Cephaleuros plastid, and is under positive selection. Therefore, it may confer an evolutionary advantage to the Cephaleuros species for survival and proliferation within its unique ecological niche.
4.4. Phylogenetic Analysis
The phylogenetic trees were constructed based on ITS rDNA and chloroplast protein-coding genes. In the ITS rDNA phylogenetic tree, C. lagerheimii formed a distinct lineage and was sister to other Cephaleuros species (Figure S4), which was consistent with the result based on the chloroplast protein-coding genes (Figure S5). The position of C. diffusus in the ITS phylogenetic tree was inconsistent with its position in the phylogenetic tree based on chloroplast protein-coding genes. C. diffusus was located in the C. diffusus lineage in Figure S4, while it was a sister group to C. karstenii and C. virescens in Figure S5. This may be due to the limited number of chloroplast genomes of C. diffusus in the database. Previous studies have confirmed that C. virescens was paraphyletic [9,69,70,71]. C. virescens was found to be monophyletic on the ITS rDNA phylogenetic tree, which could be attributed to our inadequate sampling. The non-monophyletic trait of Cephaleuros virescens was confirmed by the phylogenetic tree constructed using chloroplast protein-coding genes in this study. In Figure S5, C. virescens NC060531 was clustered with C. parasiticus, while C. virescens OQ848499 formed a sister relationship with C. karstenii. Previous studies speculated that the limited morphological characteristics, such as rhizoids and host invasion type, were the primary reasons for the incongruity between molecular phylogeny and morphological data in Cephaleuros [9,71]. Another possible reason is that the morphological and molecular evidence was not obtained from the same algal spot [71]. Therefore, sufficient morphological characteristics and correct sampling methods are crucial for delineating the boundaries of Cephaleuros species in future studies.
Supplementary Materials
The following supporting information can be downloaded at: https://www.mdpi.com/article/10.3390/genes15070839/s1, Figure S1: Number of group I introns and group II introns. The top box is the number of group I introns, and the bottom box is the number of group II introns; Figure S2: Synteny comparison of Cephaleuros chloroplast genomes; Figure S3: Synteny comparison of Trentepohlia chloroplast genomes; Figure S4: BI tree of Cephaleuros species inferred from ITS rDNA sequences. The values of BI posterior probabilities (left) and MLbootstrap (right) are shown at the nodes. Support values of bootstrap/posterior probabilities >50/0.5 were shown. Scale bar indicates substitutions per site; Figure S5: ML phylogenetic tree based on chloroplast protein-coding genes. Maximum likelihood bootstrap values (1000 replicates) are given near the nodes. Scale bar indicates substitutions per site; Table S1: List of genes annotated in the three Cephaleuros chloroplast genomes. The number in brackets after the genes represents the copy number; Table S2: DCJ values of Cephaleuros chloroplast genomes; Table S3: DCJ values of chloroplast genomes of the genera Cephaleuros and Trentepohlia; Table S4: Summary of pairwise Ka/Ks ratios in the genera Cephaleuros and Trentepohlia; Table S5: The statistic of genetic Ka/Ks among the genera Cephaleuros and Trentepohlia; Table S6: The positive selection sites based on the branch-site model; Table S7: The partitions and best model for IQtree.
Author Contributions
J.F. and H.Z. conceived this study. L.Z. and J.F. performed the experiments, assembled and annotated the genomes, and analyzed the data. J.F. wrote the manuscript. H.Z. and G.L. revised the manuscript. All authors have read and agreed to the published version of the manuscript.
Funding
This work was funded by the Natural Science Research Start-up Foundation of Jianghan University (No. 08840001).
Institutional Review Board Statement
Not applicable.
Informed Consent Statement
Not applicable.
Data Availability Statement
All newly chloroplast genome sequences in this study have been submitted to NCBI (https://www.ncbi.nlm.nih.gov/, accessed on 20 November 2023) with accession numbers from OQ848499 to OQ848501 listed in Table 1. The ITS sequence of Cephaleuros diffusus was also available in NCBI with accession number PP033476.
Conflicts of Interest
The authors declare no conflicts of interest.
References
- Brooks, F.E.; Rindi, F.; Suto, Y.; Ohtani, S.; Green, M. The Trentepohliales (Ulvophyceae, Chlorophyta): An Unusual Algal Order and its Novel Plant Pathogen, Cephaleuros. Plant Dis. 2015, 99, 740–753. [Google Scholar] [CrossRef] [PubMed]
- Fang, J.; Li, S.Y.; Liu, B.W.; Liu, G.X.; Hu, Z.Y.; Zhu, H. Molecular phylogeny and morphology of Cephaleuros (Trentepohliales, Chlorophyta) from southern China. Phycologia 2021, 60, 189–199. [Google Scholar] [CrossRef]
- Suto, Y.; Ohtani, S. Morphology and taxonomy of five Cephaleuros species (Trentepohliaceae, Chlorophyta) from Japan, including three new species. Phycologia 2009, 48, 213–236. [Google Scholar] [CrossRef]
- Sunpapao, A.; Thithuan, N.; Pitaloka, M.K.; Arikit, S. Algal leaf spot of Lansium parasiticum caused by Cephaleuros sp in Thailand. J. Plant Pathol. 2016, 98, 369. [Google Scholar] [CrossRef]
- Sunpapao, A.; Thithuan, N.; Bunjongsiri, P.; Arikit, S. Cephaleuros parasiticus, associated with algal spot disease on Psidium guajava in Thailand. Australas. Plant Dis. Notes 2016, 11, 12. [Google Scholar] [CrossRef][Green Version]
- Kumar, V.; Anal, A.K.D.; Gupta, A.K.; Nath, V.J.T.I.J.o.A.S. Occurrence of algal leaf spot on longan (Dimocarpus longan) caused by Cephaleuros virescens in India. Indian J. Agric. Sci. 2019, 89, 1241–1244. [Google Scholar] [CrossRef]
- Cortés-Martínez, J.; Cruz-Esteban, S.; Garay-Serrano, E. Identificación del alga Cephaleuros virescens s.l. en plantas de zarzamora (Rubus sp.) en el estado de Michoacán, México. Acta Bot. Mex. 2023, 130, e2260. [Google Scholar] [CrossRef]
- Ramya, M.; Ponmurugan, P.; Saravanan, D. Management of Cephaleuros parasiticaus Karst (Trentepohliales: Trentepohliaceae), an algal pathogen of tea plant, Camellia sinsensis (L) (O. Kuntze). Crop Protect. 2013, 44, 66–74. [Google Scholar] [CrossRef]
- Zhu, H.; Hu, Z.Y.; Liu, G.X. Morphology and molecular phylogeny of Trentepohliales (Chlorophyta) from China. Eur. J. Phycol. 2017, 52, 330–341. [Google Scholar] [CrossRef]
- Jensen, P.E.; Leister, D. Chloroplast evolution, structure and functions. F1000prime Rep. 2014, 6, 40. [Google Scholar] [CrossRef]
- Zhao, D.-N.; Ren, Y.; Zhang, J.-Q. Conservation and innovation: Plastome evolution during rapid radiation of Rhodiola on the Qinghai-Tibetan Plateau. Mol. Phylogen. Evol. 2020, 144, 106713. [Google Scholar] [CrossRef] [PubMed]
- Wang, Y.; Wen, F.; Hong, X.; Li, Z.; Mi, Y.; Zhao, B. Comparative chloroplast genome analyses of Paraboea (Gesneriaceae): Insights into adaptive evolution and phylogenetic analysis. Front. Plant. Sci. 2022, 13, 1019831. [Google Scholar] [CrossRef] [PubMed]
- Zhao, S.; Gao, X.; Yu, X.; Yuan, T.; Zhang, G.; Liu, C.; Li, X.; Wei, P.; Li, X.; Liu, X. Comparative Analysis of Chloroplast Genome of Meconopsis (Papaveraceae) Provides Insights into Their Genomic Evolution and Adaptation to High Elevation. Int. J. Mol. Sci. 2024, 25, 2193. [Google Scholar] [CrossRef] [PubMed]
- Doyle, J. DNA protocols for plants-CTAB total DNA isolation. Mol. Tech. Taxon. 1991, 642, 283–293. [Google Scholar] [CrossRef]
- Chen, Y.X.; Chen, Y.S.; Shi, C.M.; Huang, Z.B.; Zhang, Y.; Li, S.K.; Li, Y.; Ye, J.; Yu, C.; Li, Z.; et al. SOAPnuke: A MapReduce acceleration-supported software for integrated quality control and preprocessing of high-throughput sequencing data. Gigascience 2017, 7, gix120. [Google Scholar] [CrossRef] [PubMed]
- Prjibelski, A.; Antipov, D.; Meleshko, D.; Lapidus, A.; Korobeynikov, A. Using SPAdes De Novo Assembler. Curr. Protoc. Bioinformatics. 2020, 70, e102. [Google Scholar] [CrossRef]
- Tillich, M.; Lehwark, P.; Pellizzer, T.; Ulbricht-Jones, E.S.; Fischer, A.; Bock, R.; Greiner, S. GeSeq—Versatile and accurate annotation of organelle genomes. Nucleic Acids Res. 2017, 45, W6–W11. [Google Scholar] [CrossRef] [PubMed]
- Lowe, T.M.; Chan, P.P. tRNAscan-SE On-line: Integrating search and context for analysis of transfer RNA genes. Nucleic Acids Res. 2016, 44, W54–W57. [Google Scholar] [CrossRef] [PubMed]
- Greiner, S.; Lehwark, P.; Bock, R. OrganellarGenomeDRAW (OGDRAW) version 1.3.1: Expanded toolkit for the graphical visualization of organellar genomes. Nucleic Acids Res. 2019, 47, W59–W64. [Google Scholar] [CrossRef]
- Darling, A.C.E.; Mau, B.; Blattner, F.R.; Perna, N.T. Mauve: Multiple alignment of conserved genomic sequence with rearrangements. Genome Res. 2004, 14, 1394–1403. [Google Scholar] [CrossRef]
- Hilker, R.; Sickinger, C.; Pedersen, C.N.S.; Stoye, J. UniMoG—A unifying framework for genomic distance calculation and sorting based on DCJ. Bioinformatics 2012, 28, 2509–2511. [Google Scholar] [CrossRef]
- Rozas, J.; Ferrer-Mata, A.; Sanchez-DelBarrio, J.C.; Guirao-Rico, S.; Librado, P.; Ramos-Onsins, S.E.; Sanchez-Gracia, A. DnaSP 6: DNA Sequence Polymorphism Analysis of Large Data Sets. Mol. Biol. Evol. 2017, 34, 3299–3302. [Google Scholar] [CrossRef]
- Sueoka, N. Intrastrand parity rules of DNA base composition and usage biases of synonymous codons. J. Mol. Evol. 1995, 40, 318–325. [Google Scholar] [CrossRef]
- Wright, F. The ‘effective number of codons’ used in a gene. Gene 1990, 87, 23–29. [Google Scholar] [CrossRef]
- Sueoka, N. Directional mutation pressure and neutral molecular evolution. Proc. Natl. Acad. Sci. USA 1988, 85, 2653–2657. [Google Scholar] [CrossRef]
- Zhang, D.; Gao, F.; Jakovlić, I.; Zou, H.; Zhang, J.; Li, W.X.; Wang, G.T. PhyloSuite: An integrated and scalable desktop platform for streamlined molecular sequence data management and evolutionary phylogenetics studies. Mol. Ecol. Resour. 2020, 20, 348–355. [Google Scholar] [CrossRef]
- Tamura, K.; Stecher, G.; Peterson, D.; Filipski, A.; Kumar, S. MEGA6: Molecular Evolutionary Genetics Analysis version 6.0. Mol. Biol. Evol. 2013, 30, 2725–2729. [Google Scholar] [CrossRef]
- Wang, D.; Zhang, Y.; Zhang, Z.; Zhu, J.; Yu, J. KaKs_Calculator 2.0: A Toolkit Incorporating γ-Series Methods and Sliding Window Strategies. Genom. Proteom. Bioinform. 2010, 8, 77–80. [Google Scholar] [CrossRef]
- Yang, Z.H. PAML 4: Phylogenetic analysis by maximum likelihood. Mol. Biol. Evol. 2007, 24, 1586–1591. [Google Scholar] [CrossRef]
- Xu, B.; Yang, Z. pamlX: A Graphical User Interface for PAML. Mol. Biol. Evol. 2013, 30, 2723–2724. [Google Scholar] [CrossRef]
- Yang, Z.; Wong, W.S.W.; Nielsen, R. Bayes Empirical Bayes Inference of Amino Acid Sites Under Positive Selection. Mol. Biol. Evol. 2005, 22, 1107–1118. [Google Scholar] [CrossRef]
- Buchan, D.W.A.; Minneci, F.; Nugent, T.C.O.; Bryson, K.; Jones, D.T. Scalable web services for the PSIPRED Protein Analysis Workbench. Nucleic Acids Res. 2013, 41, W349–W357. [Google Scholar] [CrossRef]
- Waterhouse, A.; Bertoni, M.; Bienert, S.; Studer, G.; Tauriello, G.; Gumienny, R.; Heer, F.T.; de Beer, T.A.P.; Rempfer, C.; Bordoli, L.; et al. SWISS-MODEL: Homology modelling of protein structures and complexes. Nucleic Acids Res. 2018, 46, W296–W303. [Google Scholar] [CrossRef]
- Katoh, K.; Standley, D.M. MAFFT Multiple Sequence Alignment Software Version 7: Improvements in Performance and Usability. Mol. Biol. Evol. 2013, 30, 772–780. [Google Scholar] [CrossRef]
- Capella-Gutiérrez, S.; Silla-Martínez, J.M.; Gabaldón, T. trimAl: A tool for automated alignment trimming in large-scale phylogenetic analyses. Bioinformatics 2009, 25, 1972–1973. [Google Scholar] [CrossRef]
- Kalyaanamoorthy, S.; Minh, B.Q.; Wong, T.K.F.; von Haeseler, A.; Jermiin, L.S. ModelFinder: Fast model selection for accurate phylogenetic estimates. Nat. Methods 2017, 14, 587–589. [Google Scholar] [CrossRef]
- Fang, J.; Liu, B.; Liu, G.; Verbruggen, H.; Zhu, H. Six Newly Sequenced Chloroplast Genomes from Trentepohliales: The Inflated Genomes, Alternative Genetic Code and Dynamic Evolution. Front. Plant. Sci. 2021, 12, 780054. [Google Scholar] [CrossRef]
- Ranwez, V.; Douzery, E.J.P.; Cambon, C.; Chantret, N.; Delsuc, F. MACSE v2: Toolkit for the Alignment of Coding Sequences Accounting for Frameshifts and Stop Codons. Mol. Biol. Evol. 2018, 35, 2582–2584. [Google Scholar] [CrossRef]
- Talavera, G.; Castresana, J. Improvement of phylogenies after removing divergent and ambiguously aligned blocks from protein sequence alignments. Syst. Biol. 2007, 56, 564–577. [Google Scholar] [CrossRef]
- Ronquist, F.; Teslenko, M.; van der Mark, P.; Ayres, D.L.; Darling, A.; Hohna, S.; Larget, B.; Liu, L.; Suchard, M.A.; Huelsenbeck, J.P. MrBayes 3.2: Efficient Bayesian Phylogenetic Inference and Model Choice Across a Large Model Space. Syst. Biol. 2012, 61, 539–542. [Google Scholar] [CrossRef]
- Nguyen, L.T.; Schmidt, H.A.; von Haeseler, A.; Minh, B.Q. IQ-TREE: A Fast and Effective Stochastic Algorithm for Estimating Maximum-Likelihood Phylogenies. Mol. Biol. Evol. 2015, 32, 268–274. [Google Scholar] [CrossRef]
- Zhu, H.; Hu, Y.; Liu, F.; Hu, Z.; Liu, G. Characterization of the Chloroplast Genome of Trentepohlia odorata (Trentepohliales, Chlorophyta), and Discussion of its Taxonomy. Int. J. Mol. Sci. 2019, 20, 1774. [Google Scholar] [CrossRef]
- Daniell, H.; Lin, C.-S.; Yu, M.; Chang, W.-J. Chloroplast genomes: Diversity, evolution, and applications in genetic engineering. Genome Biology 2016, 17, 134. [Google Scholar] [CrossRef]
- Cremen, M.C.M.; Leliaert, F.; Marcelino, V.R.; Verbruggen, H. Large Diversity of Nonstandard Genes and Dynamic Evolution of Chloroplast Genomes in Siphonous Green Algae (Bryopsidales, Chlorophyta). Genome Biol. Evol. 2018, 10, 1048–1061. [Google Scholar] [CrossRef]
- Liu, B.; Hu, Y.; Hu, Z.; Liu, G.; Zhu, H. Taxonomic scheme of the order Chaetophorales (Chlorophyceae, Chlorophyta) based on chloroplast genomes. BMC Genomics 2020, 21, 442. [Google Scholar] [CrossRef]
- Liu, B.W.; Li, S.Y.; Yan, Q.F.; Zhu, H.; Liu, G.X. Seven newly sequenced chloroplast genomes from the order Watanabeales (Trebouxiophyceae, Chlorophyta): Phylogenetic and comparative analysis. Gene 2023, 863, 147287. [Google Scholar] [CrossRef]
- Pan, H.; Zagorchev, L.; Chen, L.; Tao, Y.; Cai, C.; Jiang, M.; Sun, Z.; Li, J. Complete chloroplast genomes of five Cuscuta species and their evolutionary significance in the Cuscuta genus. BMC Genomics 2023, 24, 310. [Google Scholar] [CrossRef]
- Janouškovec, J.; Sobotka, R.; Lai, D.-H.; Flegontov, P.; Koník, P.; Komenda, J.; Ali, S.; Prášil, O.; Pain, A.; Oborník, M.; et al. Split Photosystem Protein, Linear-Mapping Topology, and Growth of Structural Complexity in the Plastid Genome of Chromera velia. Mol. Biol. Evol. 2013, 30, 2447–2462. [Google Scholar] [CrossRef][Green Version]
- Del Cortona, A.; Leliaert, F.; Bogaert, K.A.; Turmel, M.; Boedeker, C.; Janouškovec, J.; Lopez-Bautista, J.M.; Verbruggen, H.; Vandepoele, K.; De Clerck, O. The Plastid Genome in Cladophorales Green Algae Is Encoded by Hairpin Chromosomes. Curr. Biol. 2017, 27, 3771–3782.e3776. [Google Scholar] [CrossRef]
- Barbrook, A.C.; Santucci, N.; Plenderleith, L.J.; Hiller, R.G.; Howe, C.J. Comparative analysis of dinoflagellate chloroplast genomes reveals rRNA and tRNA genes. BMC Genom. 2006, 7, 297. [Google Scholar] [CrossRef]
- Wicke, S.; Schneeweiss, G.M.; dePamphilis, C.W.; Muller, K.F.; Quandt, D. The evolution of the plastid chromosome in land plants: Gene content, gene order, gene function. Plant Mol. Biol. 2011, 76, 273–297. [Google Scholar] [CrossRef] [PubMed]
- Brouard, J.-S.; Otis, C.; Lemieux, C.; Turmel, M. The Exceptionally Large Chloroplast Genome of the Green Alga Floydiella terrestris Illuminates the Evolutionary History of the Chlorophyceae. Genome Biol. Evol. 2010, 2, 240–256. [Google Scholar] [CrossRef] [PubMed]
- Turmel, M.; Otis, C.; Lemieux, C. Dynamic Evolution of the Chloroplast Genome in the Green Algal Classes Pedinophyceae and Trebouxiophyceae. Genome Biol. Evol. 2015, 7, 2062–2082. [Google Scholar] [CrossRef] [PubMed]
- Fang, J.; Chen, Y.L.; Liu, G.X.; Verbruggen, H.; Zhu, H. Chloroplast Genome Traits Correlate with Organismal Complexity and Ecological Traits in Chlorophyta. Front. Ecol. Evol. 2021, 9, 791166. [Google Scholar] [CrossRef]
- Parvathy, S.T.; Udayasuriyan, V.; Bhadana, V. Codon usage bias. Mol. Biol. Rep. 2022, 49, 539–565. [Google Scholar] [CrossRef] [PubMed]
- Xuan, M.; Li, J. Photosystem II-based biomimetic assembly for enhanced photosynthesis. Natl. Sci. Rev. 2021, 8, nwab051. [Google Scholar] [CrossRef]
- Gui, L.-J.; Jiang, S.; Xie, D.; Yu, L.; Huang, Y.; Zhang, Z.; Liu, Y.-y.J.G. Analysis of Complete Chloroplast Genomes of Curcuma and the Contribution to Phylogeny and Adaptive Evolution. Gene 2020, 732, 144355. [Google Scholar] [CrossRef] [PubMed]
- Xiong, Q.; Hu, Y.; Lv, W.; Wang, Q.; Liu, G.; Hu, Z. Chloroplast genomes of five Oedogonium species: Genome structure, phylogenetic analysis and adaptive evolution. BMC Genomics 2021, 22, 707. [Google Scholar] [CrossRef] [PubMed]
- Caspy, I.; Borovikova-Sheinker, A.; Klaiman, D.; Shkolnisky, Y.; Nelson, N. The structure of a triple complex of plant photosystem I with ferredoxin and plastocyanin. Nature Plants 2020, 6, 1300–1305. [Google Scholar] [CrossRef]
- Andersson, I.; Backlund, A. Structure and function of Rubisco. Plant Physiol. Biochem. 2008, 46, 275–291. [Google Scholar] [CrossRef]
- Dong, W.-L.; Wang, R.-N.; Zhang, N.-Y.; Fan, W.-B.; Fang, M.-F.; Li, Z.-H. Molecular Evolution of Chloroplast Genomes of Orchid Species: Insights into Phylogenetic Relationship and Adaptive Evolution. Int. J. Mol. Sci. 2018, 19, 716. [Google Scholar] [CrossRef]
- Li, D.-M.; Li, J.; Wang, D.-R.; Xu, Y.-C.; Zhu, G.-F. Molecular evolution of chloroplast genomes in subfamily Zingiberoideae (Zingiberaceae). BMC Plant Biol. 2021, 21, 558. [Google Scholar] [CrossRef]
- Wen, F.; Wu, X.; Li, T.; Jia, M.; Liu, X.; Liao, L. The complete chloroplast genome of Stauntonia chinensis and compared analysis revealed adaptive evolution of subfamily Lardizabaloideae species in China. BMC Genom. 2021, 22, 161. [Google Scholar] [CrossRef] [PubMed]
- Gao, L.-Z.; Liu, Y.-L.; Zhang, D.; Li, W.; Gao, J.; Liu, Y.; Li, K.; Shi, C.; Zhao, Y.; Zhao, Y.-J.; et al. Evolution of Oryza chloroplast genomes promoted adaptation to diverse ecological habitats. Commun. Biol. 2019, 2, 278. [Google Scholar] [CrossRef]
- Jiang, P.; Shi, F.X.; Li, M.R.; Liu, B.; Wen, J.; Xiao, H.X.; Li, L.F. Positive Selection Driving Cytoplasmic Genome Evolution of the Medicinally Important Ginseng Plant Genus Panax. Front. Plant. Sci. 2018, 9, 359. [Google Scholar] [CrossRef]
- Hudson, G.S.; Mason, J.G. The chloroplast genes encoding subunits of the H+-ATP synthase. Photosynth. Res. 1988, 18, 205–222. [Google Scholar] [CrossRef]
- Shi, C.; Shi, X. Characterization of Three Genes Encoding the Subunits of Light-Independent Protochlorophyllide Reductase in Chlorella protothecoides CS-41. Biotechnol. Prog. 2006, 22, 1050–1055. [Google Scholar] [CrossRef]
- Kim, J.I.; Moore, C.E.; Archibald, J.M.; Bhattacharya, D.; Yi, G.; Yoon, H.S.; Shin, W. Evolutionary Dynamics of Cryptophyte Plastid Genomes. Genome Biol. Evol. 2017, 9, 1859–1872. [Google Scholar] [CrossRef]
- López-Bautista, J.M.; Rindi, F.; Guiry, M.D. Molecular systematics of the subaerial green algal order Trentepohliales: An assessment based on morphological and molecular data. Int. J. Syst. Evol. Microbiol. 2006, 56, 1709–1715. [Google Scholar] [CrossRef] [PubMed]
- Rindi, F.; Lam, D.W.; Lopez-Bautista, J.M. Phylogenetic relationships and species circumscription in Trentepohlia and Printzina (Trentepohliales, Chlorophyta). Mol. Phylogen. Evol. 2009, 52, 329–339. [Google Scholar] [CrossRef] [PubMed]
- Huang, Y.C.; Tsai, C.Y.; Wang, C.L. Host Invasion Type Is a Phylogenetically Conserved Characteristic of Cephaleuros. Plant Dis. 2023, 107, 3222–3229. [Google Scholar] [CrossRef] [PubMed]
Disclaimer/Publisher’s Note: The statements, opinions and data contained in all publications are solely those of the individual author(s) and contributor(s) and not of MDPI and/or the editor(s). MDPI and/or the editor(s) disclaim responsibility for any injury to people or property resulting from any ideas, methods, instructions or products referred to in the content. |
© 2024 by the authors. Licensee MDPI, Basel, Switzerland. This article is an open access article distributed under the terms and conditions of the Creative Commons Attribution (CC BY) license (https://creativecommons.org/licenses/by/4.0/).