Article

Quantitative Trait Loci Mapping and Comparative Transcriptome Analysis of Fruit Weight (FW) in Watermelon (Citrullus lanatus L.)

1
Horticulture College, China Agricultural University, Beijing 100193, China
2
Institute of Horticultural Research, Ningxia Academy of Agriculture and Forestry Sciences, Yinchuan 750002, China
*
Authors to whom correspondence should be addressed.
Genes 2024, 15(7), 933; https://doi.org/10.3390/genes15070933 (registering DOI)
Submission received: 19 June 2024 / Revised: 8 July 2024 / Accepted: 15 July 2024 / Published: 17 July 2024
(This article belongs to the Section Plant Genetics and Genomics)

Abstract

:
The watermelon (Citrullus lanatus L.) holds substantial economic value as a globally cultivated horticultural crop. However, the genetic architecture of watermelon fruit weight (FW) remains poorly understood. In this study, we used sh14-11 with small fruit and N14 with big fruit to construct 100 recombinant inbred lines (RILs). Based on whole-genome resequencing (WGR), 218,127 single nucleotide polymorphisms (SNPs) were detected to construct a high-quality genetic map. After quantitative trait loci (QTL) mapping, a candidate interval of 31–38 Mb on chromosome 2 was identified for FW. Simultaneously, the bulked segregant analysis (BSA) in the F2 population corroborated the identification of the same interval, encompassing the homologous gene linked to the known FW-related gene fas. Additionally, RNA-seq was carried out across 11 tissues from sh14-11 and N14, revealing expression profiles that identified 1695 new genes and corrected the annotation of 2941 genes. Subsequent differential expression analysis unveiled 8969 differentially expressed genes (DEGs), with 354 of these genes exhibiting significant differences across four key developmental stages. The integration of QTL mapping and differential expression analysis facilitated the identification of 14 FW-related genes, including annotated TGA and NAC transcription factors implicated in fruit development. This combined approach offers valuable insights into the genetic basis of FW, providing crucial resources for enhancing watermelon cultivation.

1. Introduction

The watermelon (Citrullus lanatus L.) (2n = 2x = 22) stands as a vital cash crop globally, renowned not only for its widespread cultivation but also as a favored fresh fruit replete with health-enhancing compounds such as vitamin C, lycopene, and β-carotene [1]. The annual worldwide production of watermelon surpasses 100 million tons, solidifying its significance in the agricultural landscape. Notably, China emerges as the leading producer and consumer of watermelon, boasting an extensive harvested area exceeding 1.47 million hectares and a production exceeding 60 million tons in 2019. Simultaneously, the watermelon production in China reached 63.241 million tons, accounting for 60.61% of the global total.
High-density genetic maps serve as invaluable tools for quantitative trait loci (QTL) mapping and candidate gene identification. In the early stages, genetic linkage maps for watermelon relied on various markers, such as isozymes [2,3], amplified fragment length polymorphisms (AFLPs), and simple sequence repeat (SSR) [4,5]. With advanced sequencing technology and decreased costs, next-generation sequencing (NGS) has facilitated the application of single nucleotide polymorphism (SNP) markers [6]. BSA stands out as a time- and cost-efficient QTL mapping approach [7,8]. Various algorithms for BSA have been documented and widely implemented, such as G’ [9], Δ(SNP-index) [10], ED4 [11], QTG-seq [12] and DeepBSA [13]. Meanwhile, a high-quality reference genome could greatly enhance the accuracy of QTL mapping. Several reference genomes of watermelon have been reported [14,15,16,17], including a telomere-to-telomere (T2T) gap-free genome [18]. Based on the NGS technology, BSA algorithms and the high-quality genome, several genetic maps were constructed and QTLs were identified in watermelon [19,20,21].
Fruit shape (FS) constitutes an agriculturally important fruit yield trait, and various related QTLs and genes have been documented in cucurbits [22]. As FW is a useful indicator, complementary to fruit length (FL) and fruit width (FD), for describing three-dimensional fruit growth, FW is an important fruit trait worth studying [23]. By constructing segregating populations derived from a cross between WI7238 (long fruit) and WI7239 (round fruit) for QTL mapping, two QTLs, FS1.2 and FS2.1, were found to control FS. These two loci encode the tomato homologs SUN (CsSUN25-26-27a) [24] and SlTRM5 (CsTRM5) [25], respectively. In watermelon, Sandlin identified 10 QTLs linked to FL, explaining phenotypic variation (PV) ranging from 7.3% to 40.8%. Additionally, eight QTLs associated with FD (ranging from 8.7% to 50.0%) and five QTLs related to fruit shape indices (FSIs) (ranging from 2.8% to 56.6%) were discovered [26]. Subsequent efforts aimed at refining the genetic map through the development of four RILs continued to uncover additional QTLs associated with watermelon FS [27]. Another study identified four QTLs related to the watermelon FSI, elucidating 31.9% of the PV, thus contributing to a more comprehensive understanding of the genetic underpinnings of watermelon FS [28]. In several recent studies, ClSUN25-26-27a was identified as a putative candidate gene co-localizing with ClFSI3.1 [29,30].
Although many QTLs related to FW have been found in watermelon, few key genes have been confirmed. Therefore, combining QTL mapping and differential gene expression analysis is a potential way to mine FW key genes. In this study, the construction of 100 RILs from sh14-11 and N14, coupled with QTL mapping, led to the identification of the chromosome 2 interval (31–38 Mb) as a candidate region influencing FW in watermelon. Notably, consistent results were obtained through BSA in the F2 population, further corroborating the significance of this interval. Subsequent differential expression analysis across eleven crucial developmental stages between sh14-11 and N14 unveiled a total of 8969 DEGs, with 354 genes exhibiting variations in the key stages. Finally, 14 genes within the QTLs were mined for FW and annotated. We believe this study is of great significance for the genetic understanding and cultivation improvement of FW in watermelon.

2. Materials and Methods

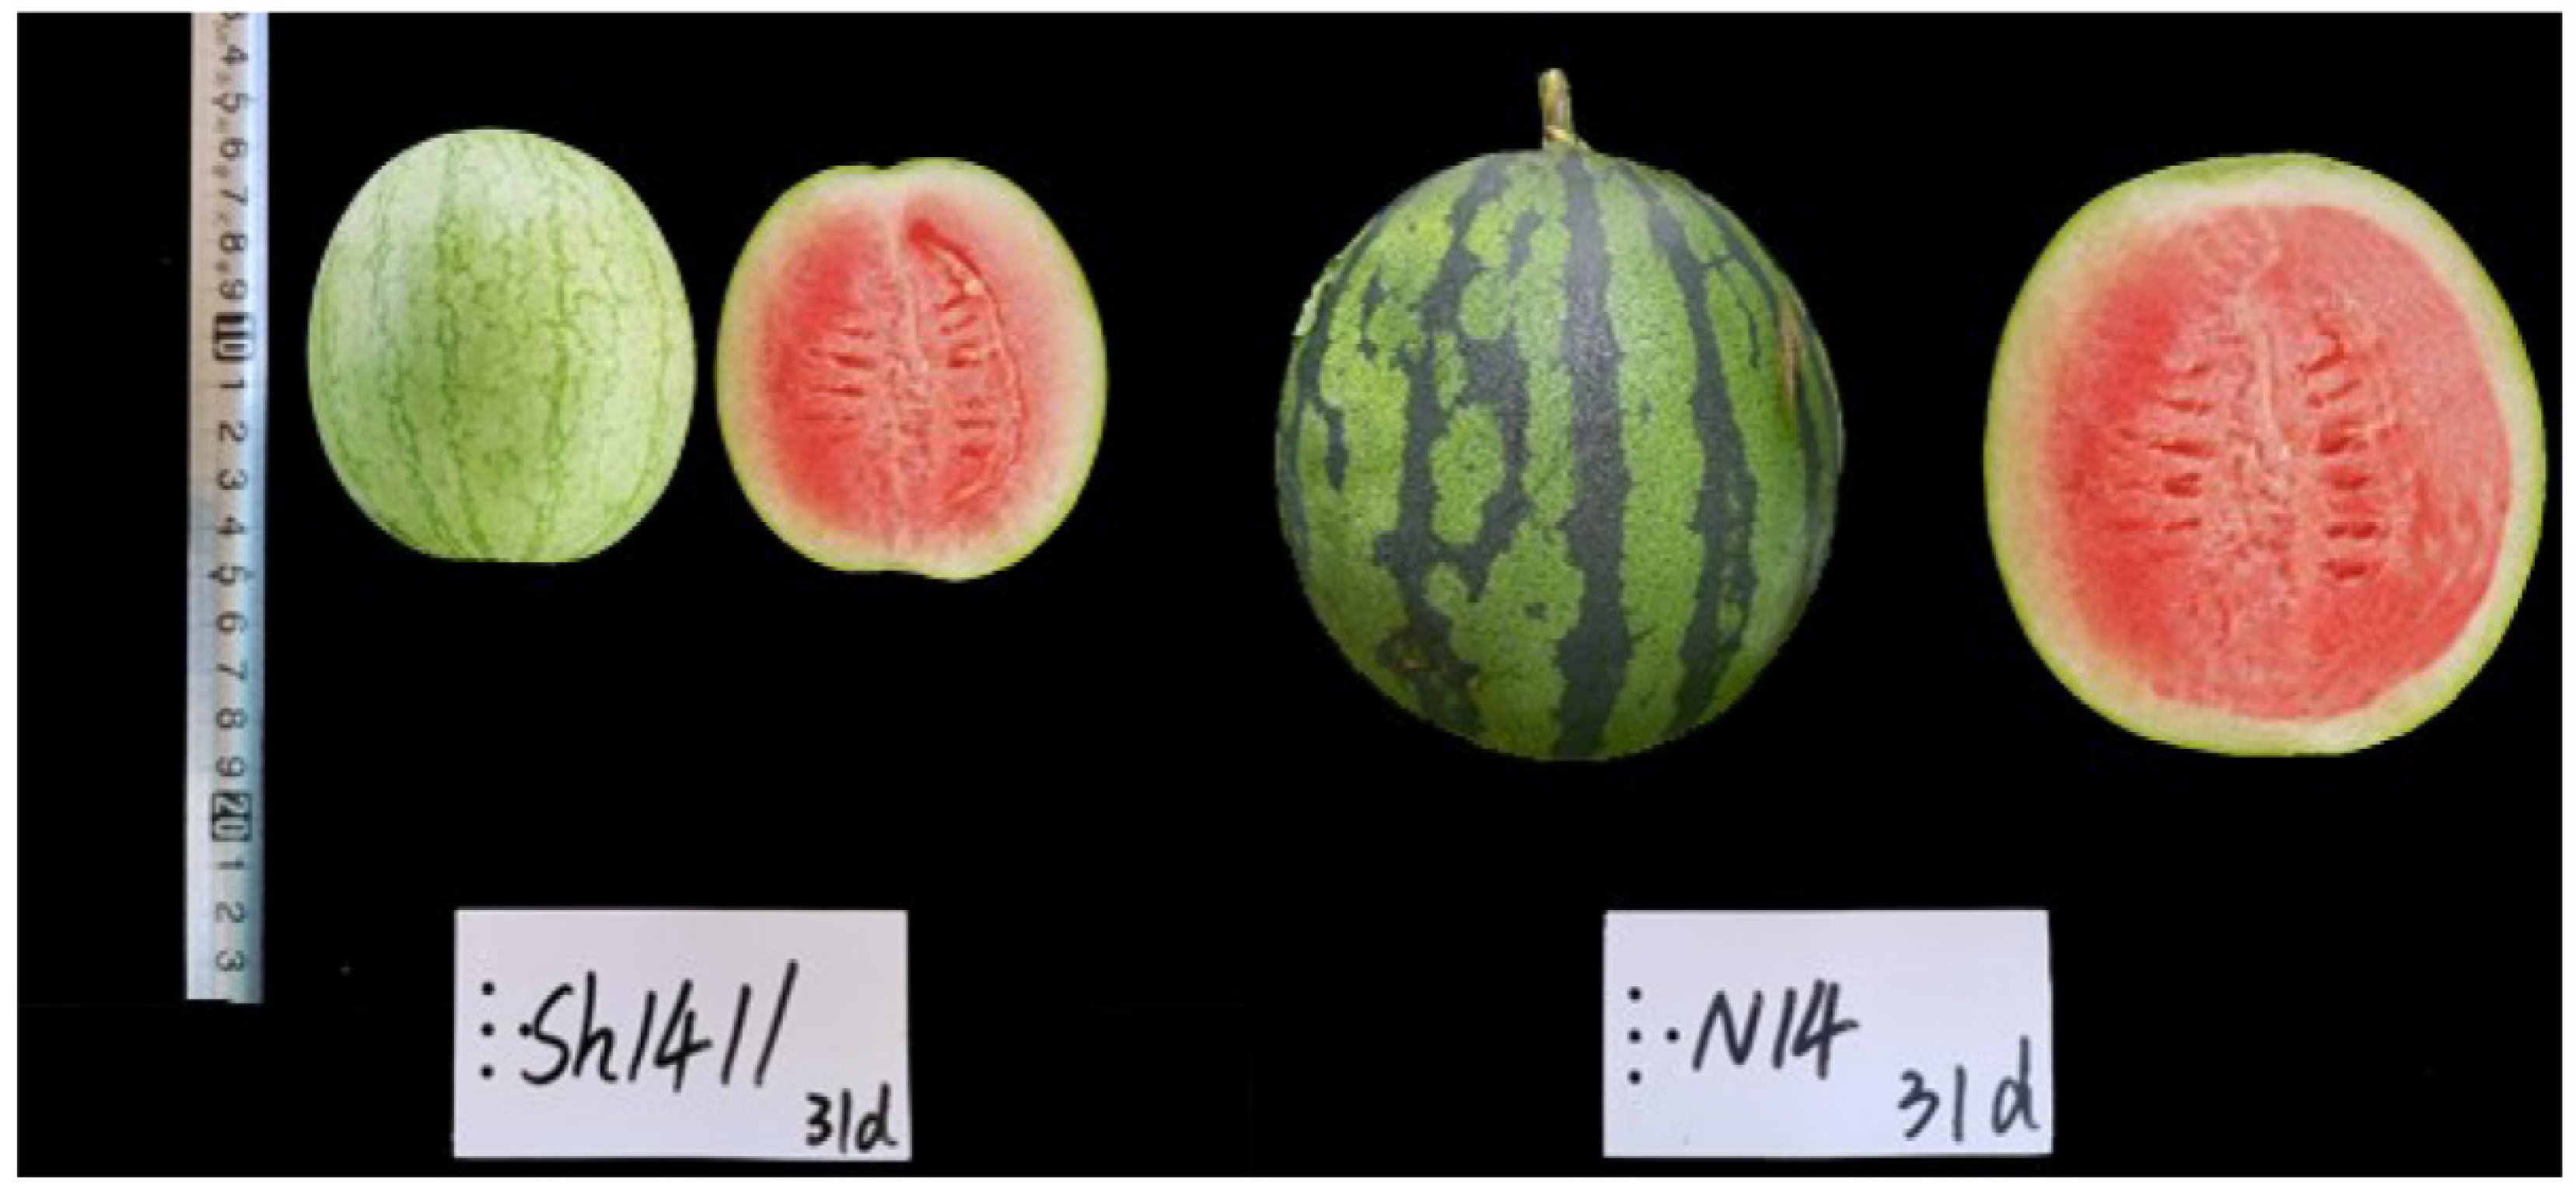
2.1. Plant Material and DNA Extraction

The female line (N14) and the male line (sh14-11) are cultivated inbred lines of watermelon from the Institute of Horticulture Research, Ningxia Academy of Agricultural and Forestry Sciences (NAAFS), whose fruit weight is stable. The mapping populations were generated from a cross between N14 and sh14-11, in which the F2 segregation population consisted of 100 individual plants that were planted in NAAFS in the spring of 2021. The recombinant inbred lines (RILs, F5), consisting of 2 parents and 100 offspring, were derived by single seed descent and were planted in NAAFS during the winter of 2022. In the watermelon field, all plants were grown under identical conditions. The soil was uniformly prepared and fertilized, and a consistent watering schedule was maintained. The plants were spaced evenly to avoid competition. The pest control measures, light exposure and temperature were standardized. This ensured that any observed differences in fruit size were due to genetic or experimental variables rather than environmental factors. Each fruit from the plant at the mature stage was weighed using an electronic scale, with each sampling repeated 5 times. The weight of each fruit at the mature stage was recorded to two decimal places.
Leaf tissue from both the F2 population and the RIL population was extracted using the CTAB method, with slight modifications. Twenty individual lines with significantly large fruits and another 20 lines with notably small fruits from the F2 population were chosen based on the subsequent bulked segregant analysis (BSA). The DNA extracted from both parents and 100 RILs was utilized in the construction of the genetic map.

2.2. High-Throughput Sequencing and Data Processing and Analysis

The DNA libraries underwent terminal repair for sequencing, including the addition of a 3′ A and a sequencing linker. Subsequently, the samples were purified and amplified via PCR. Paired-end sequencing was conducted using the HiSeq2500 system (Illumina, San Diego, CA, USA). Raw paired-end sequencing reads were initially preprocessed to eliminate reads with adapters and excessively low-quality pair reads (q < 10). Then, the clean reads were mapped to the Citrullus_lanatus. The WCG_v1 watermelon reference genome (http://cucurbitgenomics.org/ftp/genome/watermelon/WCG/v1/ accessed on 14 July 2024) was mapped using the BWA (Burrows–Wheeler Aligner program).

2.3. SNP/InDel Identification and Annotation

GATK was utilized for base recalibration, variant calling and for stringent filtering of variants to obtain the final variant clusters. The default parameters were used for variant calling and mapping for all samples. The MarkDuplicates tool was applied to remove duplicated reads originating from PCR amplification. Then, SnpEff was employed to annotate and predict the variation (SNP, Small InDel).

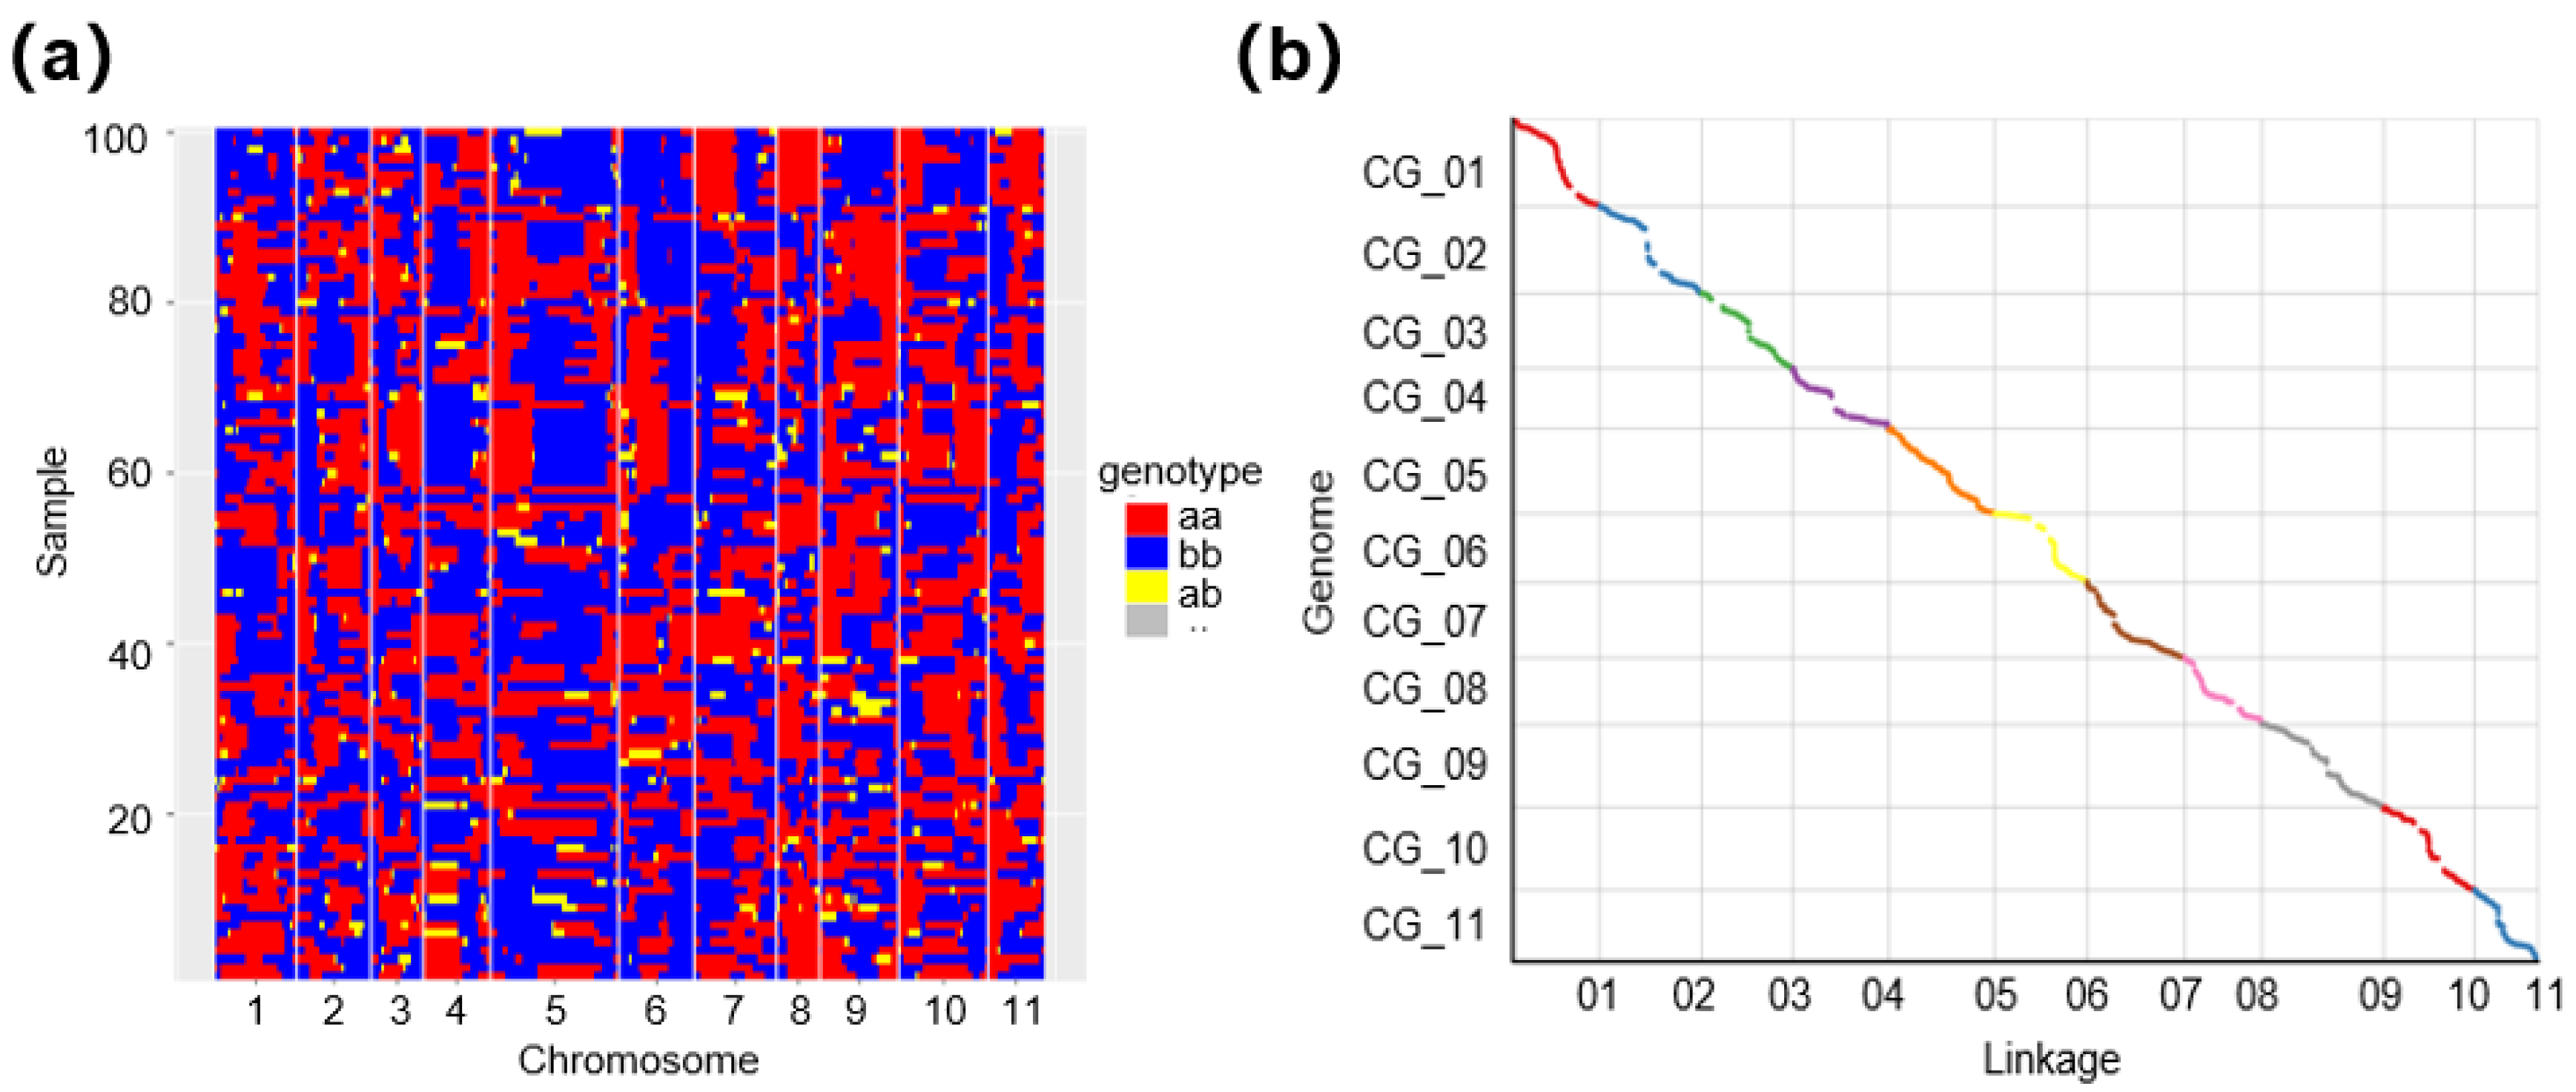
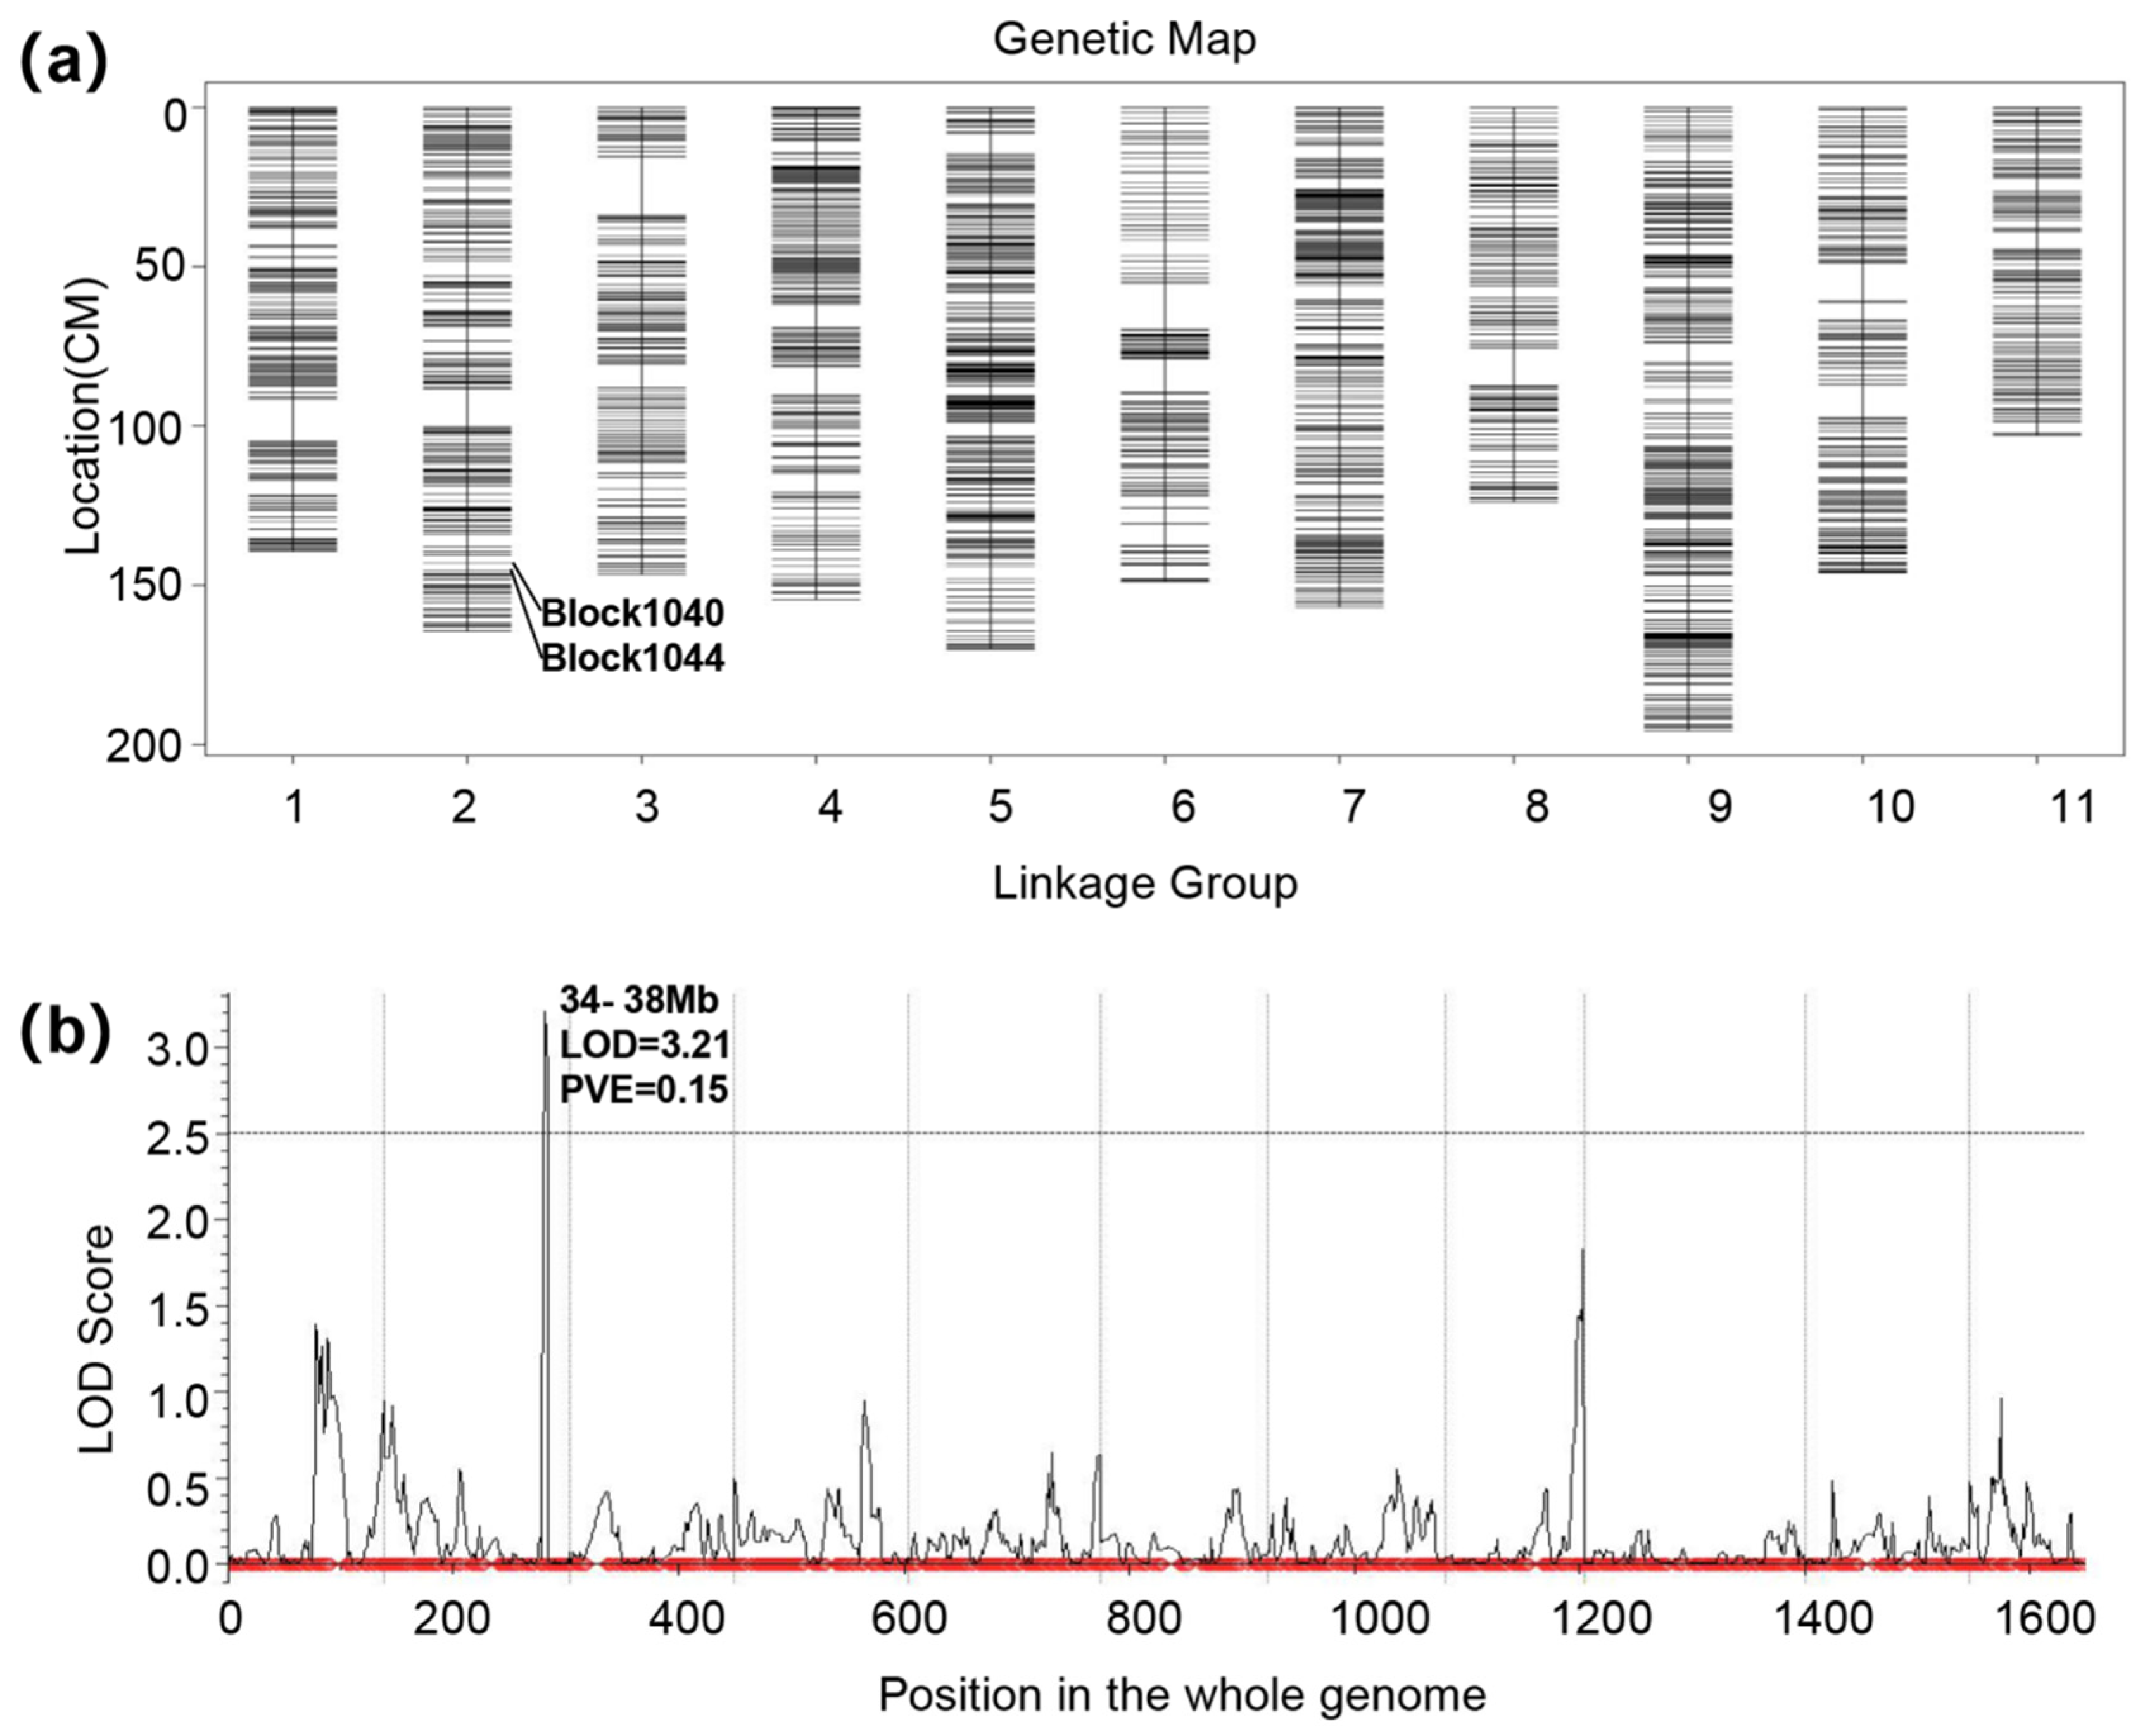
2.4. Construction of Genetic Map and Mapping QTL

After identifying the highly qualified SNP/InDel markers, we used HighMap (http://highmap.biomarker.com.cn/ accessed on 14 July 2024) to construct the genetic map, including the steps of linkage grouping, marker sequencing, genotyping error correction and mapping evaluation. During chromosome scanning and genotyping in each window, a 1-SNP step and a 15-SNP sliding window were adopted. The SNPs located between adjacent recombination breakpoints aggregate into recombination bins. These binding markers are helpful to construct linkage groups using HighMap tools.
QTL IciMapping (Version 4.0) software was employed to detect QTLs with genetic maps. The F2 individuals displaying band patterns resembling those of the female and male parents were designated as A and B, respectively, while the patterns resembling the F1 type were labeled as H. The results were imported into QTL IciMapping for analysis, with the parameter “mapping steps = 1 cM”. The statistical analysis used for the identification of the QTLs included composite interval mapping (ICIM) with a filtering threshold of locus at “LOD > 2.5”.

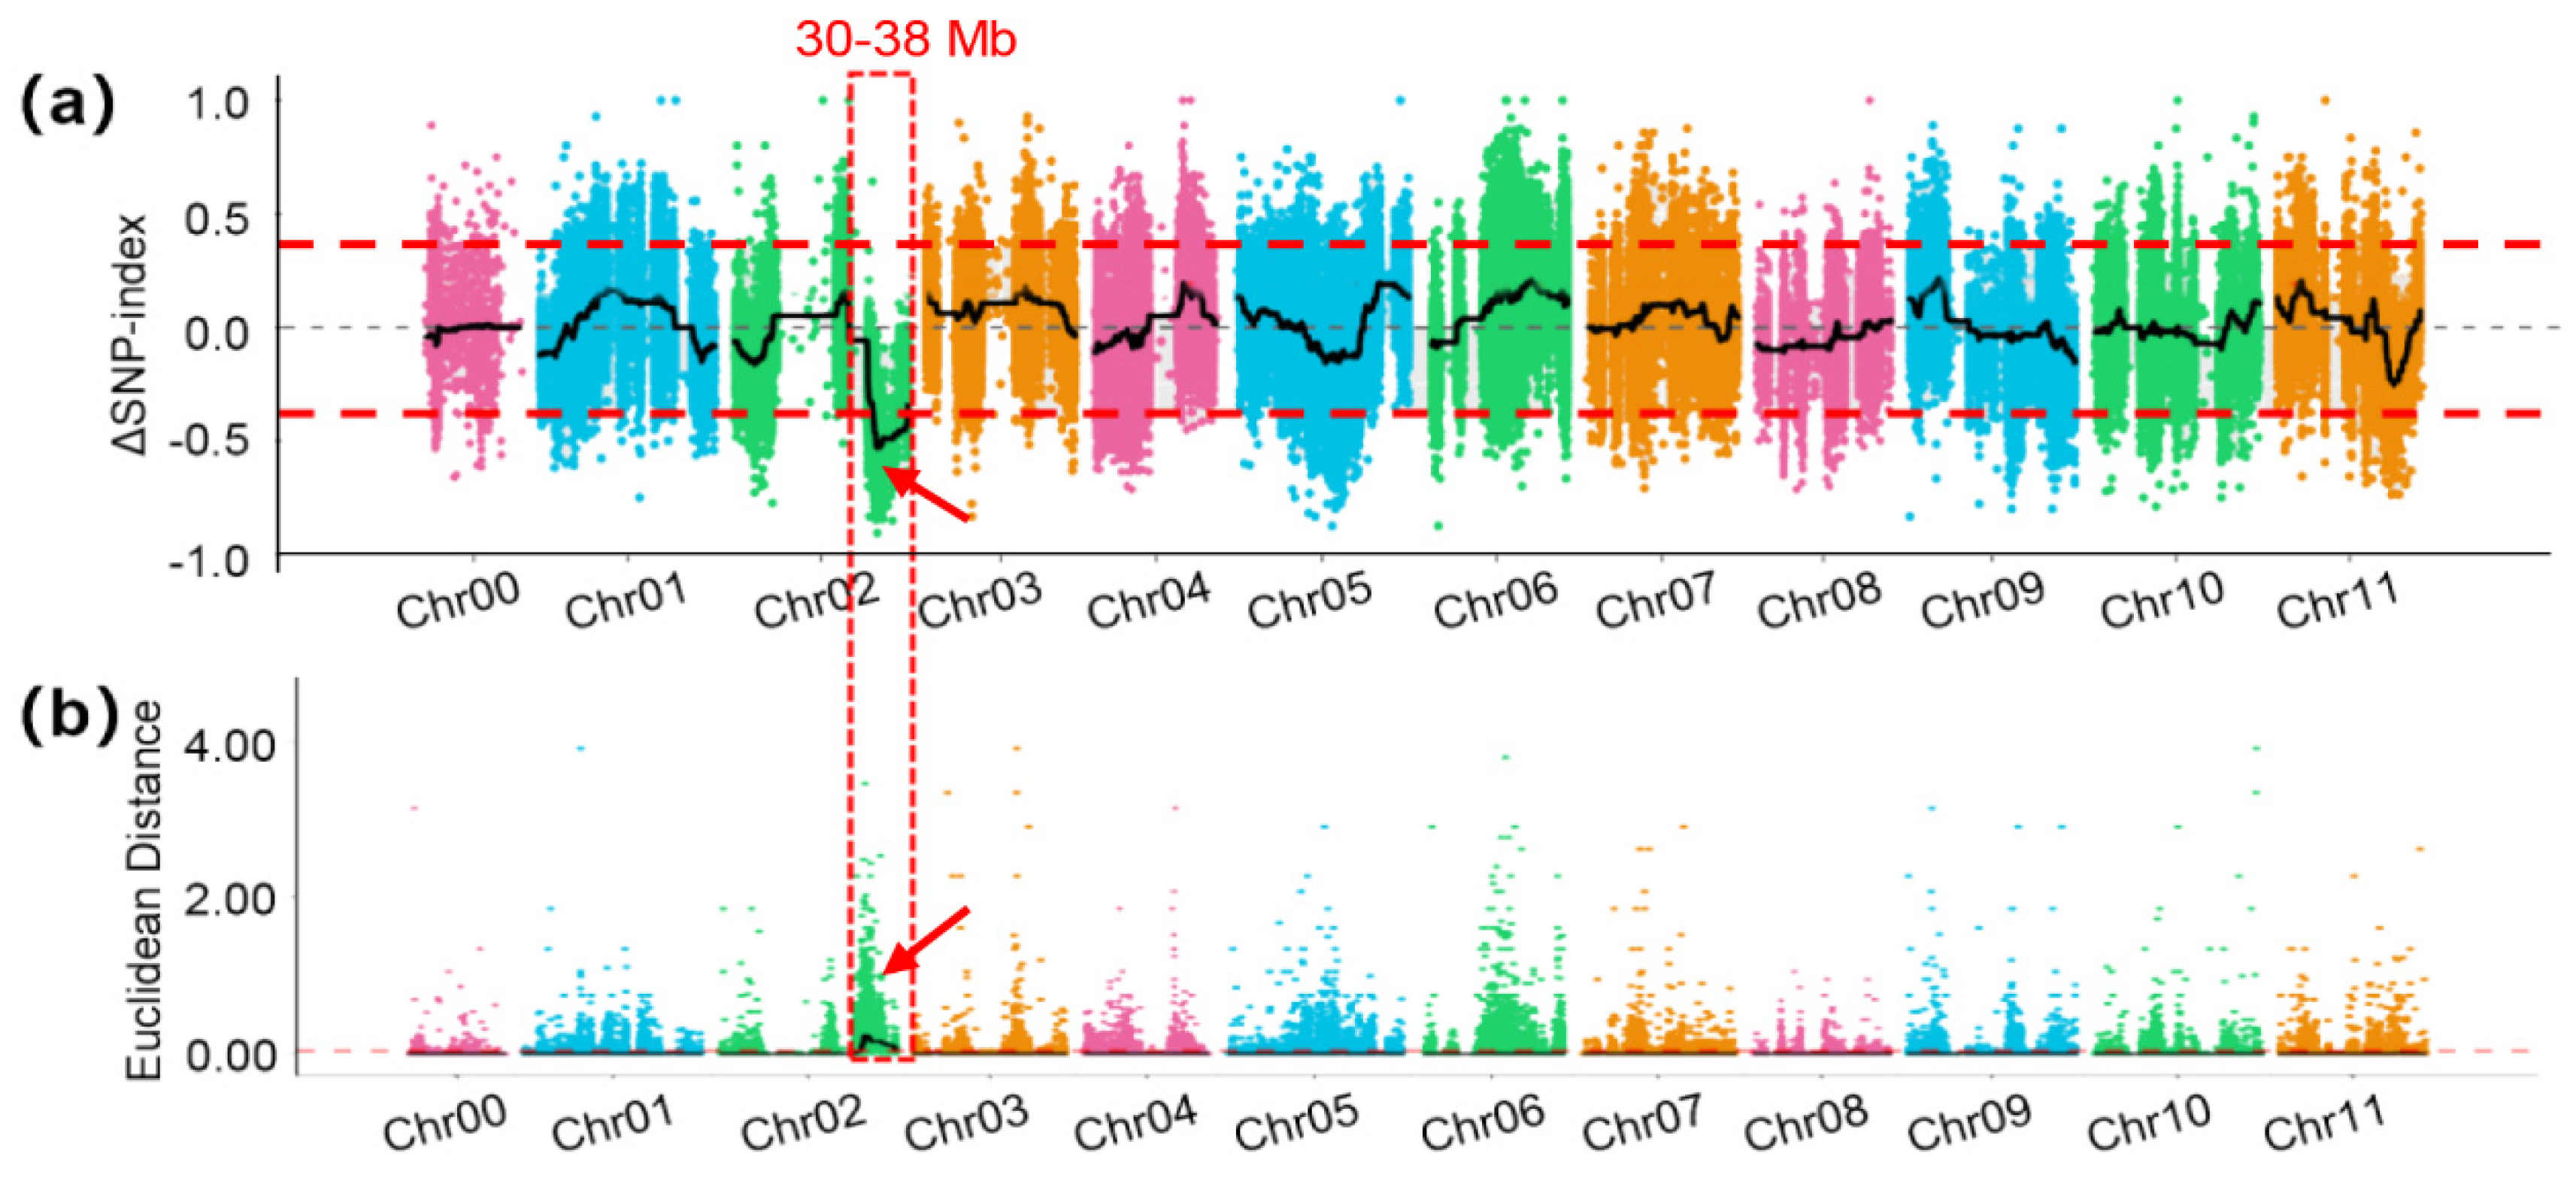
2.5. BSA and Mapping Strategy

Twenty F2 individuals with extreme big fruit were carefully chosen to represent the big-fruit pool and twenty F2 individuals with extreme small fruit represent the small-fruit pool. Combined with two parent lines, four samples were created to extract DNA and conduct genomic sequencing. The variant sites were called by aligning sequence reads to the Citrullus_lanatus.WCG_v1 genome. SNP-index values were calculated for all SNPs across the genome, and QTLs were detected based on these calculations.

2.6. Transcriptome Analysis and Candidate Gene Prediction

The RNA-seq of watermelon contained 22 tissue samples, including flowers collected two days before flowering (nF2, shF2), one day before flowering (nF1, shF1) and on the day of flowering (nF0, shF0), as well as 7 days after fruit setting (shR7, nR7, shP7, nP7), 15 days (shR15, nR15, shP15, nP15), 23 days (shR23, nR23, shP23, nP23) and 31 days (shR31, nR31, shP31, nP31). Each tissue underwent three biological replicates, totaling 66 tissue samples. Following library construction, an initial quantification was conducted using the Qubit 2.0 fluorometer, with subsequent dilution of the library to 1.5 ng/μL. The insert size of the library was assessed using an Agilent 2100 bioanalyzer. Upon confirmation that the insert size met the anticipated specifications, accurate quantification of the library’s effective concentration (ensuring it exceeded 2 nM) was carried out through qRT-PCR. This meticulous process was implemented to guarantee the library’s quality before proceeding with Illumina sequencing for the various libraries.
After sequencing, the reads with adapters were removed. Hisat2 was employed to align the reads with the Citrullus_lanatus (WCG_v1) genome [17] to obtain the location of the genes and transcripts. Differentially expressed genes (DEGs) among sample groups were identified with DESeq2. To ensure the precision of DEG categorization, we established stringent criteria, with a false discovery rate (FDR) threshold set at ≤0.05 and an absolute log2(ratio) value of ≥1. These thresholds were employed to discern significant differences in gene expression between N14 and sh14-11.

3. Results

3.1. Population Establishment and Genetic Map Construction

To construct a stable watermelon population exhibiting variable FW, the male parent N14, characterized by large fruit, was crossed with the female parent sh14-11, known for its small FW. The fruit of sh14-11 was about 0.30 kg, while the fruit of N14 was 1.51 kg (Figure 1). Following single seed descent, a population of 100 recombinant inbred lines (RILs) was developed, encompassing a range of fruit from 0.11 kg to 3.84 kg, with each line demonstrating consistent FW.
Following whole-genome resequencing, we procured a total of 10.87 Gb and 10.71 Gb of high-quality reads from the respective parental inbred lines. The RIL population, comprising 100 individuals, contributed to a cumulative 219.68 Gb of high-quality reads. The markers displayed an average coverage depth of 23-fold for the male parent, 22-fold for the female parent and 4.23-fold for their offspring (Supplementary Table S1). Remarkably, over 98% of clean reads were effectively mapped to the reference genome. With SNP filtering, a total of 218,127 SNPs were identified, with a minimum 4-fold depth in the parent lines. This dataset was employed to construct a high-density genetic map consisting of 11 linkage groups (LGs) (Table 1).

3.2. Evaluating the Genetic Map and Mapping QTL for FW

Individual haplotype maps were created for 100 RILs, successfully outlining nearly all recombination blocks (Figure 2a). To assess the genetic map’s quality, we examined the collinearity between the genetic map and the physical map across the 11 chromosomes. It is noteworthy that all Spearman correlation coefficients for linkage groups (LGs) exceeded 0.995, signifying a high degree of collinearity between the genetic map and the physical map (Figure 2b).
The completed high-density genetic map was established across 11 chromosomes, integrating 2597 recombination bins housing 218,127 SNPs and demonstrating a well-dispersed linkage distance (Figure 3a). The cumulative map length reached 1649.42 cM, showcasing an average distance of 0.64 cM between neighboring bin markers. On the whole, the bin markers exhibited a balanced distribution throughout the genome, with nearly 96.19% of intervals between adjacent markers measuring less than 5 cM. LG9 emerged as the most extensive linkage group, covering 195.71 cM and featuring 247 bin markers, with an average inter-marker distance of 0.8 cM. Conversely, LG11 represented the smallest linkage group, covering 102.93 cM and hosting 175 bin markers, with an average distance of 0.59 cM between adjacent markers (Table 1).
The composite interval mapping (CIM) method was employed to pinpoint loci significantly linked to FW. A distinct locus emerged on chromosome 2, reaching maximum LOD scores of 3.21, exceeding the threshold of 2.5 (Figure 3b). This noteworthy locus explained 15.135% of the phenotypic variation in FW, showing an additive effect of 0.246. This locus is located at 143 cM/34 Mb on chromosome 2, which is between block1040 and block1044 from the marker of the genetic map.

3.3. Bulked Segregant Analysis for FW

After crossing the parental lines to create the F2 population, the FW of all individuals was assessed. The 20 individuals with the largest fruit weight were selected as high pools, and the 20 individuals with the smallest fruit weight were selected as low pools. High-quality sequencing generated a total of 38.78 Gb reads, with an approximate sequencing depth of 23× for each pool. The average Q30 ratio was an impressive 94.9%, and over 98.7% of clean reads were successfully aligned to the reference genome. Following the quality-check procedures, the clean short reads underwent alignment to the reference genome using BWA. Subsequently, employing stringent selection criteria in the QTL-seq pipeline, a total of 384,411 SNPs were identified across all 11 chromosomes.
Subsequently, we computed the Δ(SNP-index) value for each SNP and plotted it on the genome. Applying a threshold of 0.4, the locus influencing FW in watermelon was identified (Figure 4a). This locus spans from 30,966,186 bp to 38,769,378 bp on chromosome 2, covering a total of 7.8 Mb. Concurrently, the Euclidean distance (ED) value was calculated and depicted, corroborating the identical genomic region (Figure 4b) and affirming the reliability of the results. Remarkably, the locus identified by BSA in the F2 population aligned with the locus identified through map-based cloning in the RIL populations, emphasizing its pivotal role as a significant interval for FW in watermelon.

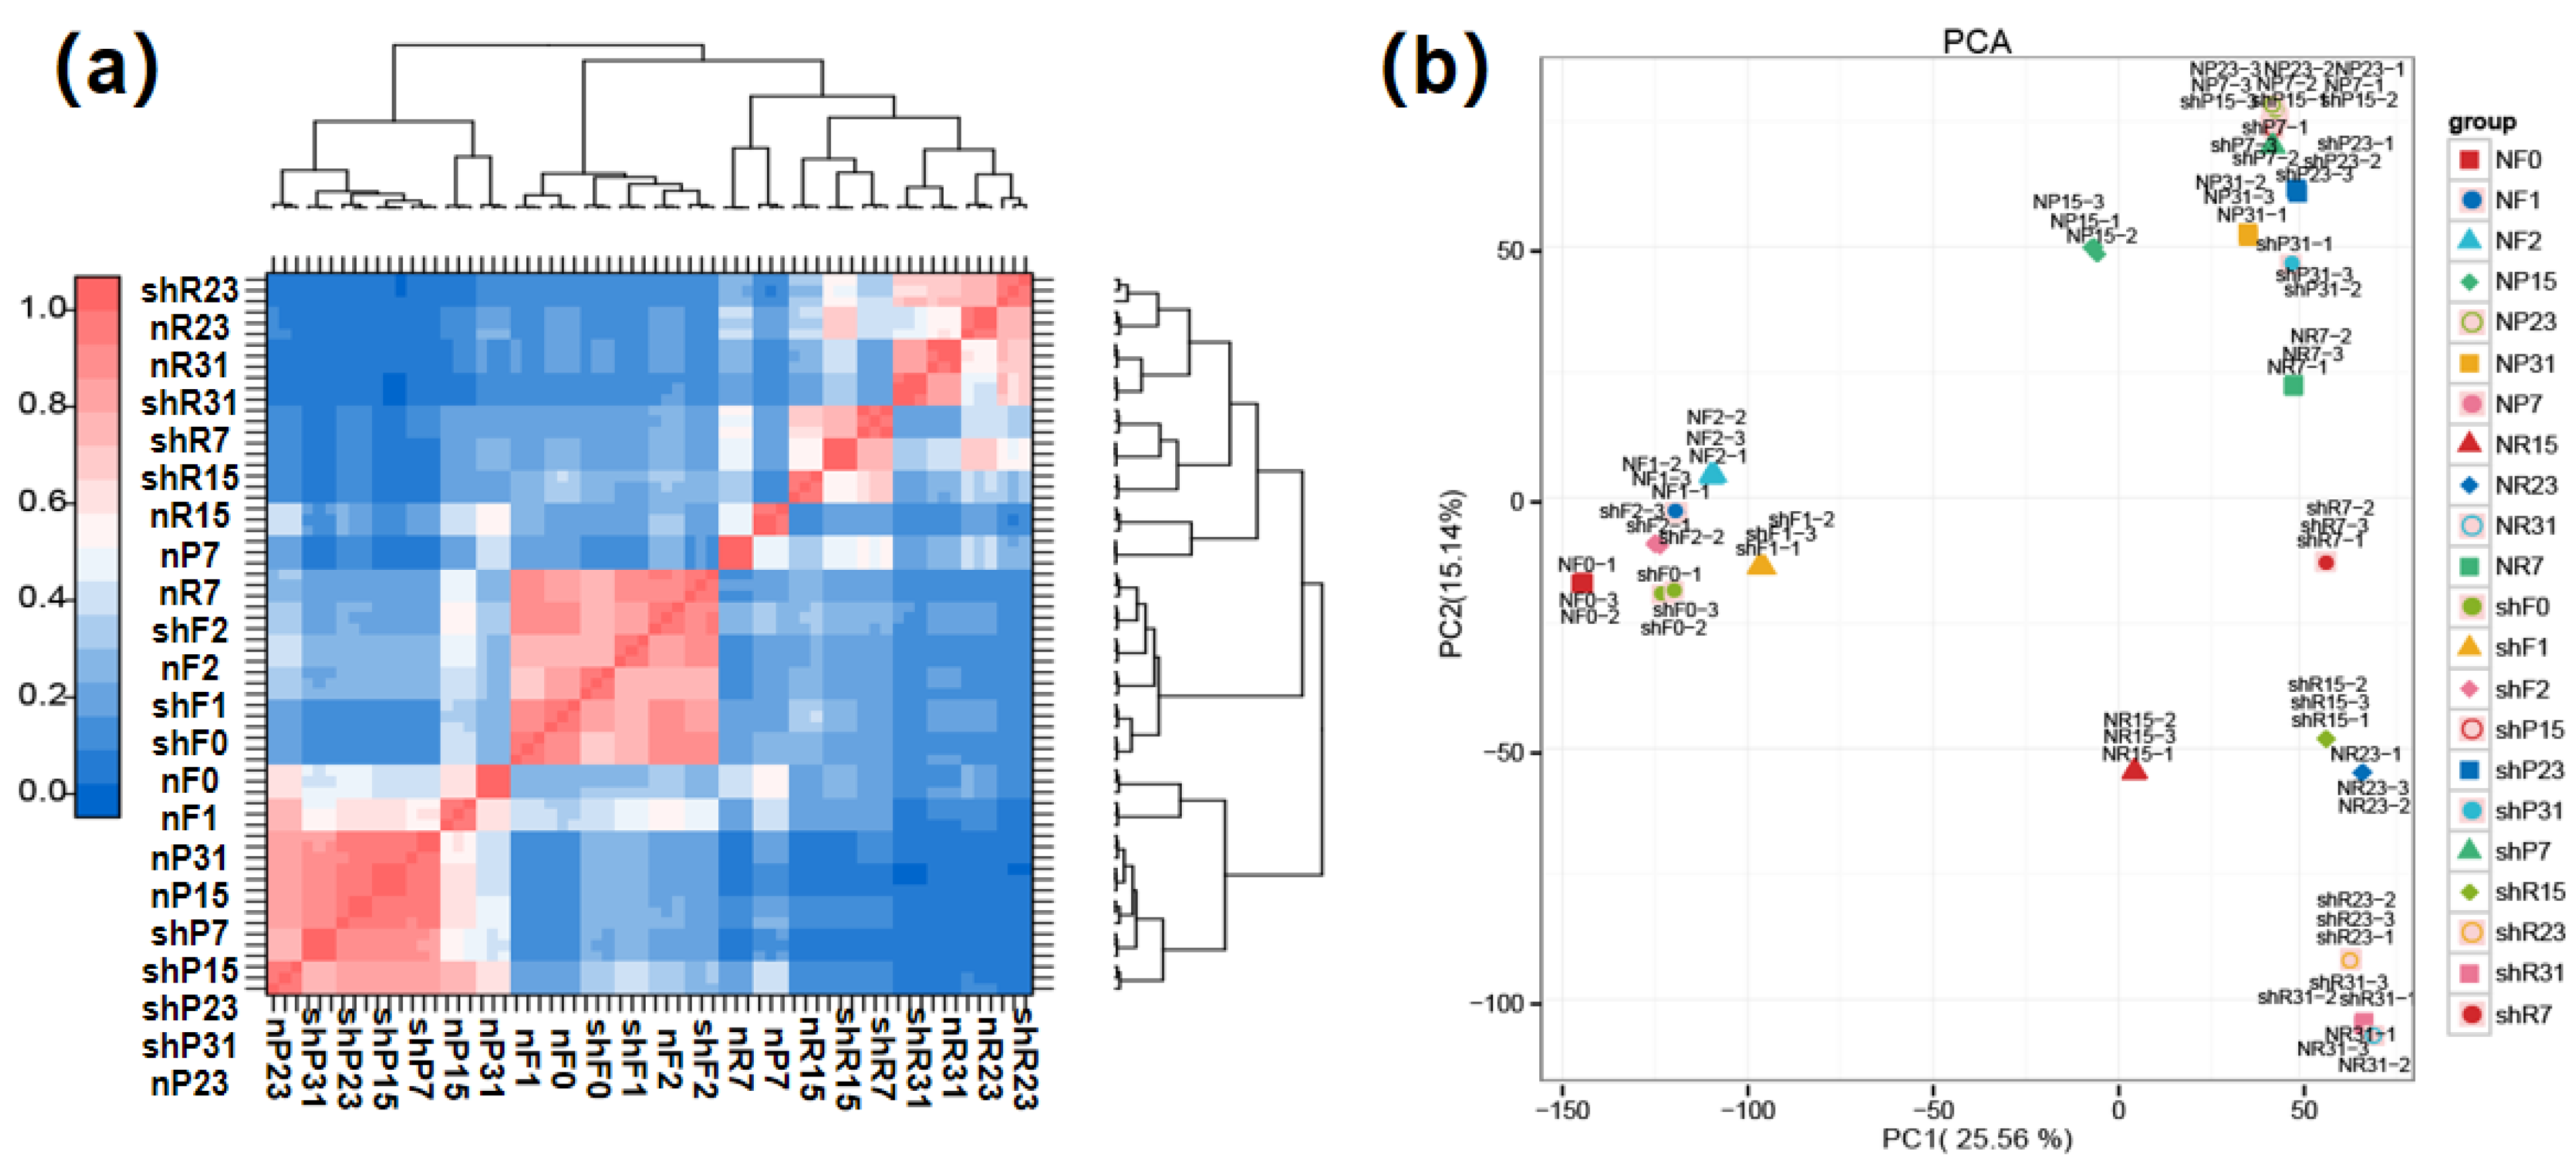
3.4. Multi-Tissue Gene Expression Profiles of Two Parental Lines

To delineate the expression profiles between the parental lines sh14-11 and N14, we collected 22 tissue samples for RNA sequencing. These samples included flowers collected two days before flowering (nF2, shF2), one day before flowering (nF1, shF1) and on the day of flowering (nF0, shF0), as well as fruit pulp and fruit peel collected 7 days after fruit setting (shR7, nR7, shP7, nP7), 15 days after fruit setting (shR15, nR15, shP15, nP15), 23 days after fruit setting (shR23, nR23, shP23, nP23) and 31 days after fruit setting (shR31, nR31, shP31, nP31). Each tissue underwent three biological replicates, totaling 66 tissue samples. After conducting RNA-seq analysis, a cumulative 423.37 Gb of clean data were obtained. The average clean data for each sample reached 5.75 Gb, with the Q30 base percentage being 92.25% or higher. The clean reads from each sample were juxtaposed with the designated reference genome, showcasing a comparison efficiency ranging from 96.48% to 97.87% (Supplementary Table S2).
To assess the consistency among the biological replicates, we employed Pearson’s correlation coefficient as the evaluation index. The findings revealed correlation coefficients between biological replicates of the 22 tissue samples ranging from 0.97 to 1 (Figure 5a, Supplementary Table S3), signifying a high degree of consistency and data reliability among the biological replicates. Simultaneously, a principal component analysis (PCA) was conducted, illustrating that PC1 could explain 25.56% of the variation, and PC2 could explain 15.14% of the variation. Meanwhile, three replicates of the same tissue nearly overlapped, and analogous tissues clustered together, indicating that our data are both in line with the expectations and reliable (Figure 5b).
The structural annotation of genes and transcripts in reference genome is often incomplete, as transcriptome data usually lack annotation. After the identification of continuous mapped reads beyond the initial gene boundaries, prompting the extension of the untranslated region (UTR) both upstream and downstream to rectify the gene boundary, we succeed in optimizing the structure annotation of 2941 genes. Simultaneously, StringTie2 software was employed to splice the mapped reads and compare the results with the original genome annotation. This facilitated the identification of original annotation regions and the exploration of new transcripts and genes within this species. After filtering out sequences with excessively short, coded peptide chains (less than 50 amino acid residues) or those containing only a single exon, 1965 new genes were discovered. Consequently, the expression profile analysis not only rectified inaccuracies in the annotation of previous transcripts but also unveiled new genes. This represents a valuable resource for enhancing our understanding of the watermelon genome.

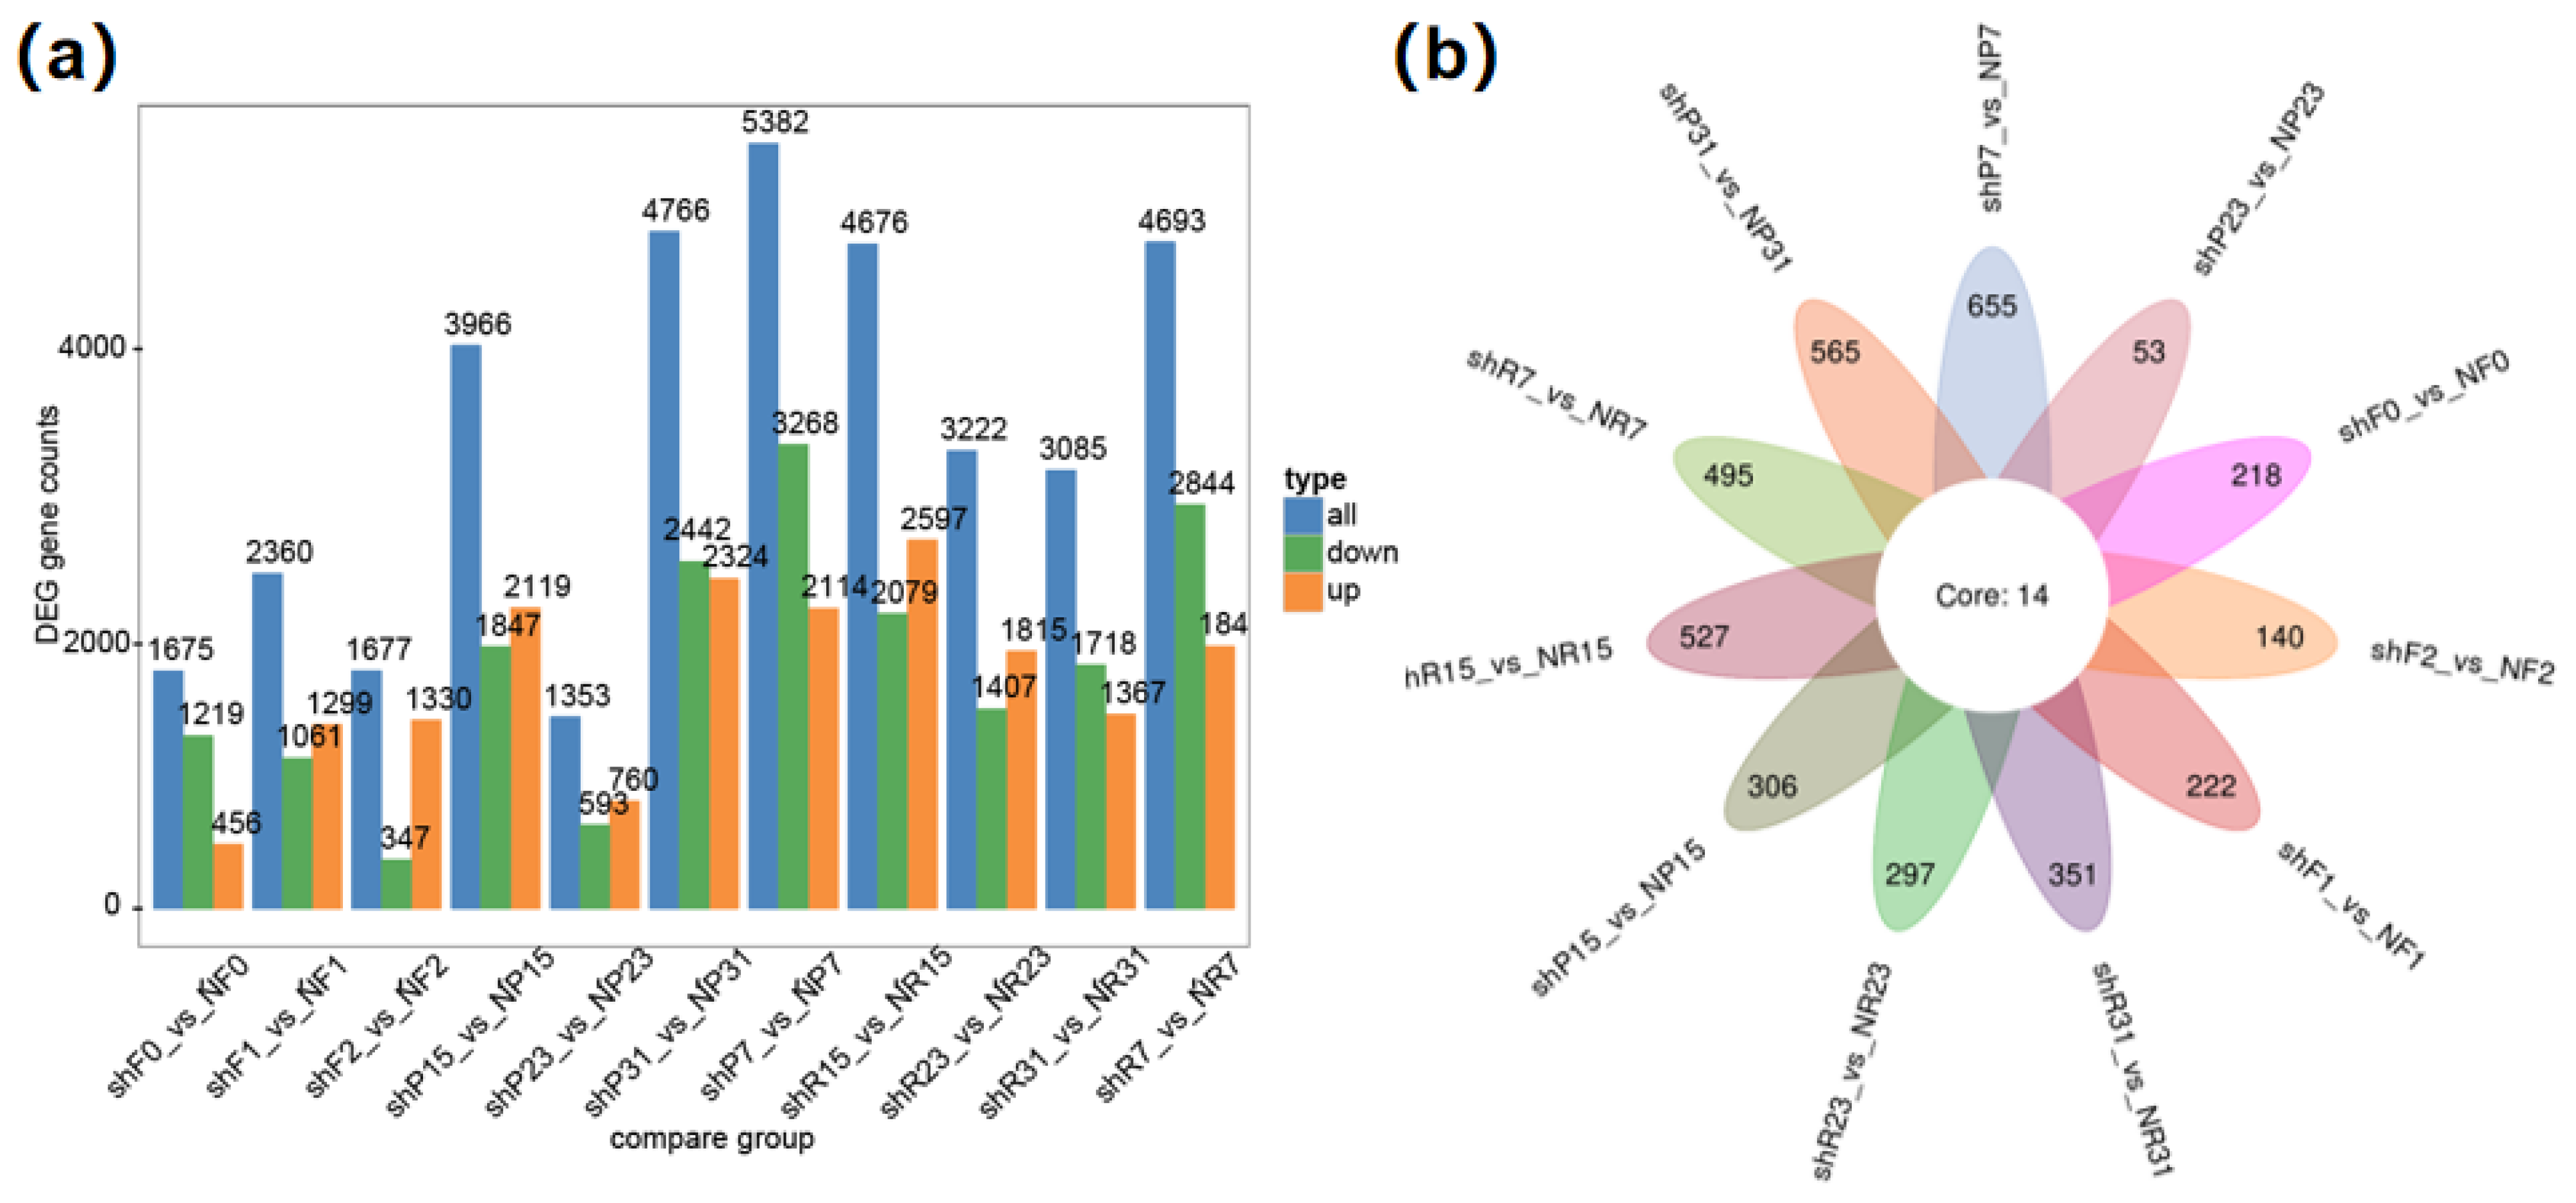
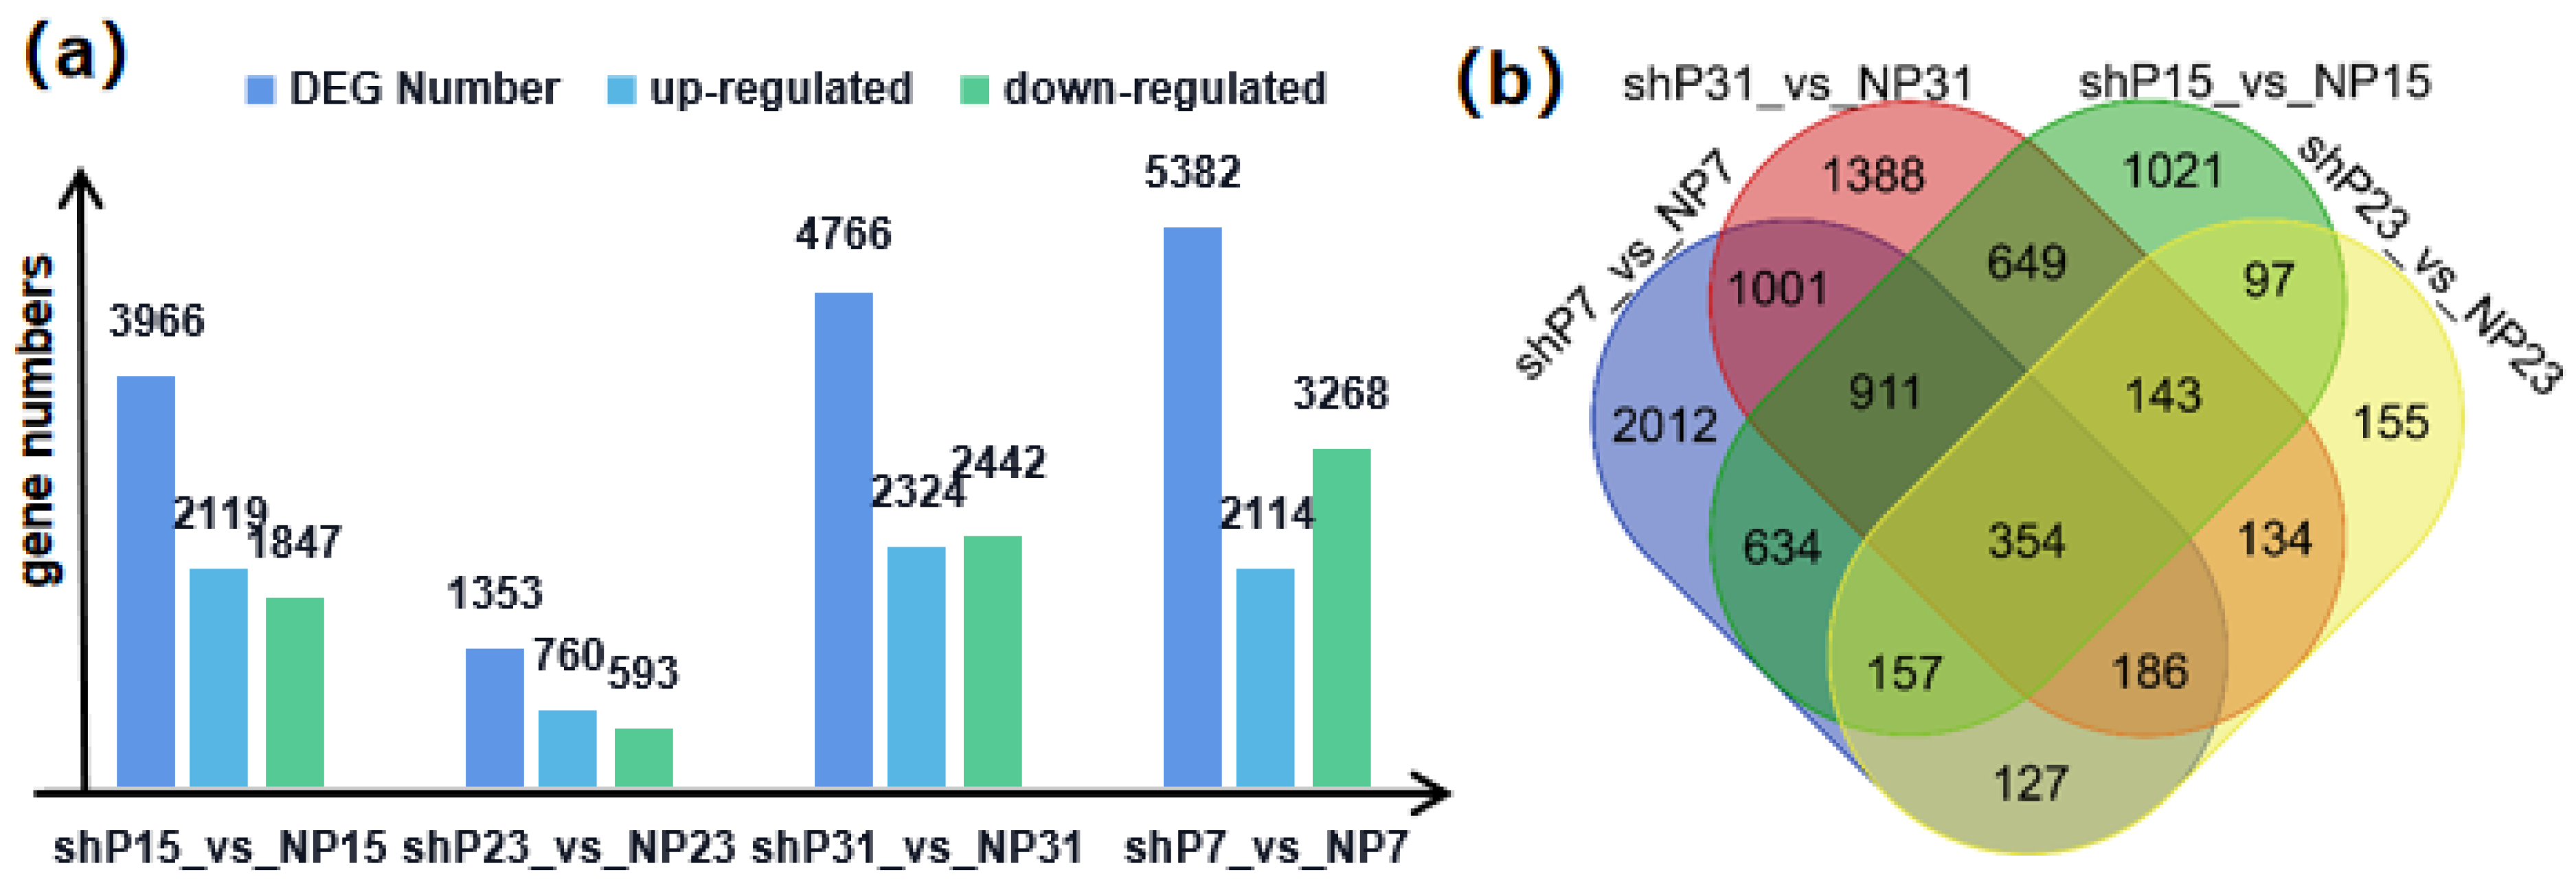
3.5. Identification of Differentially Expressed Genes (DEGs) Related to FW

Utilizing high-quality transcriptome data, we identified DEGs in the samples from the corresponding tissues of parental lines. This analysis involved 11 pairs of tissues, revealing a range of 1353 to 5382 DEGs between each pair (Figure 6a). Notably, the fruit peel sampled 7 days after fruit setting exhibited the highest number of DEGs, while the fruit peel sampled 23 days after fruit setting showed the fewest. As FW has changed dramatically during this period between sh14-11 and N14, these drastically changed DEGs may be related to the FW. After combining differential expression analysis across 11 pairs of tissues, fourteen genes were selected (Figure 6b). These genes display varied expression in flowers, fruit pulps, and fruit peels, potentially indicating fundamental disparities in parental germplasm. Importantly, these genes did not intersect with the identified QTL associated with FW.
To unravel the genetic basis contributing to variations in FW in watermelon, we selected fruit peel for differential expression analysis between sh14-11 (shP7, shP15, shP23, and shP31) and N14 (nP7, nP15, nP23 and nP31). A total of 8969 DEGs were identified between sh14-11 and N14 (Figure 7a). Notably, 354 genes exhibited significant differential expression among the four stages (Figure 7b). Given the concurrent significant differences in FW at these stages, these 354 DEGs are potential key players influencing FW variations.

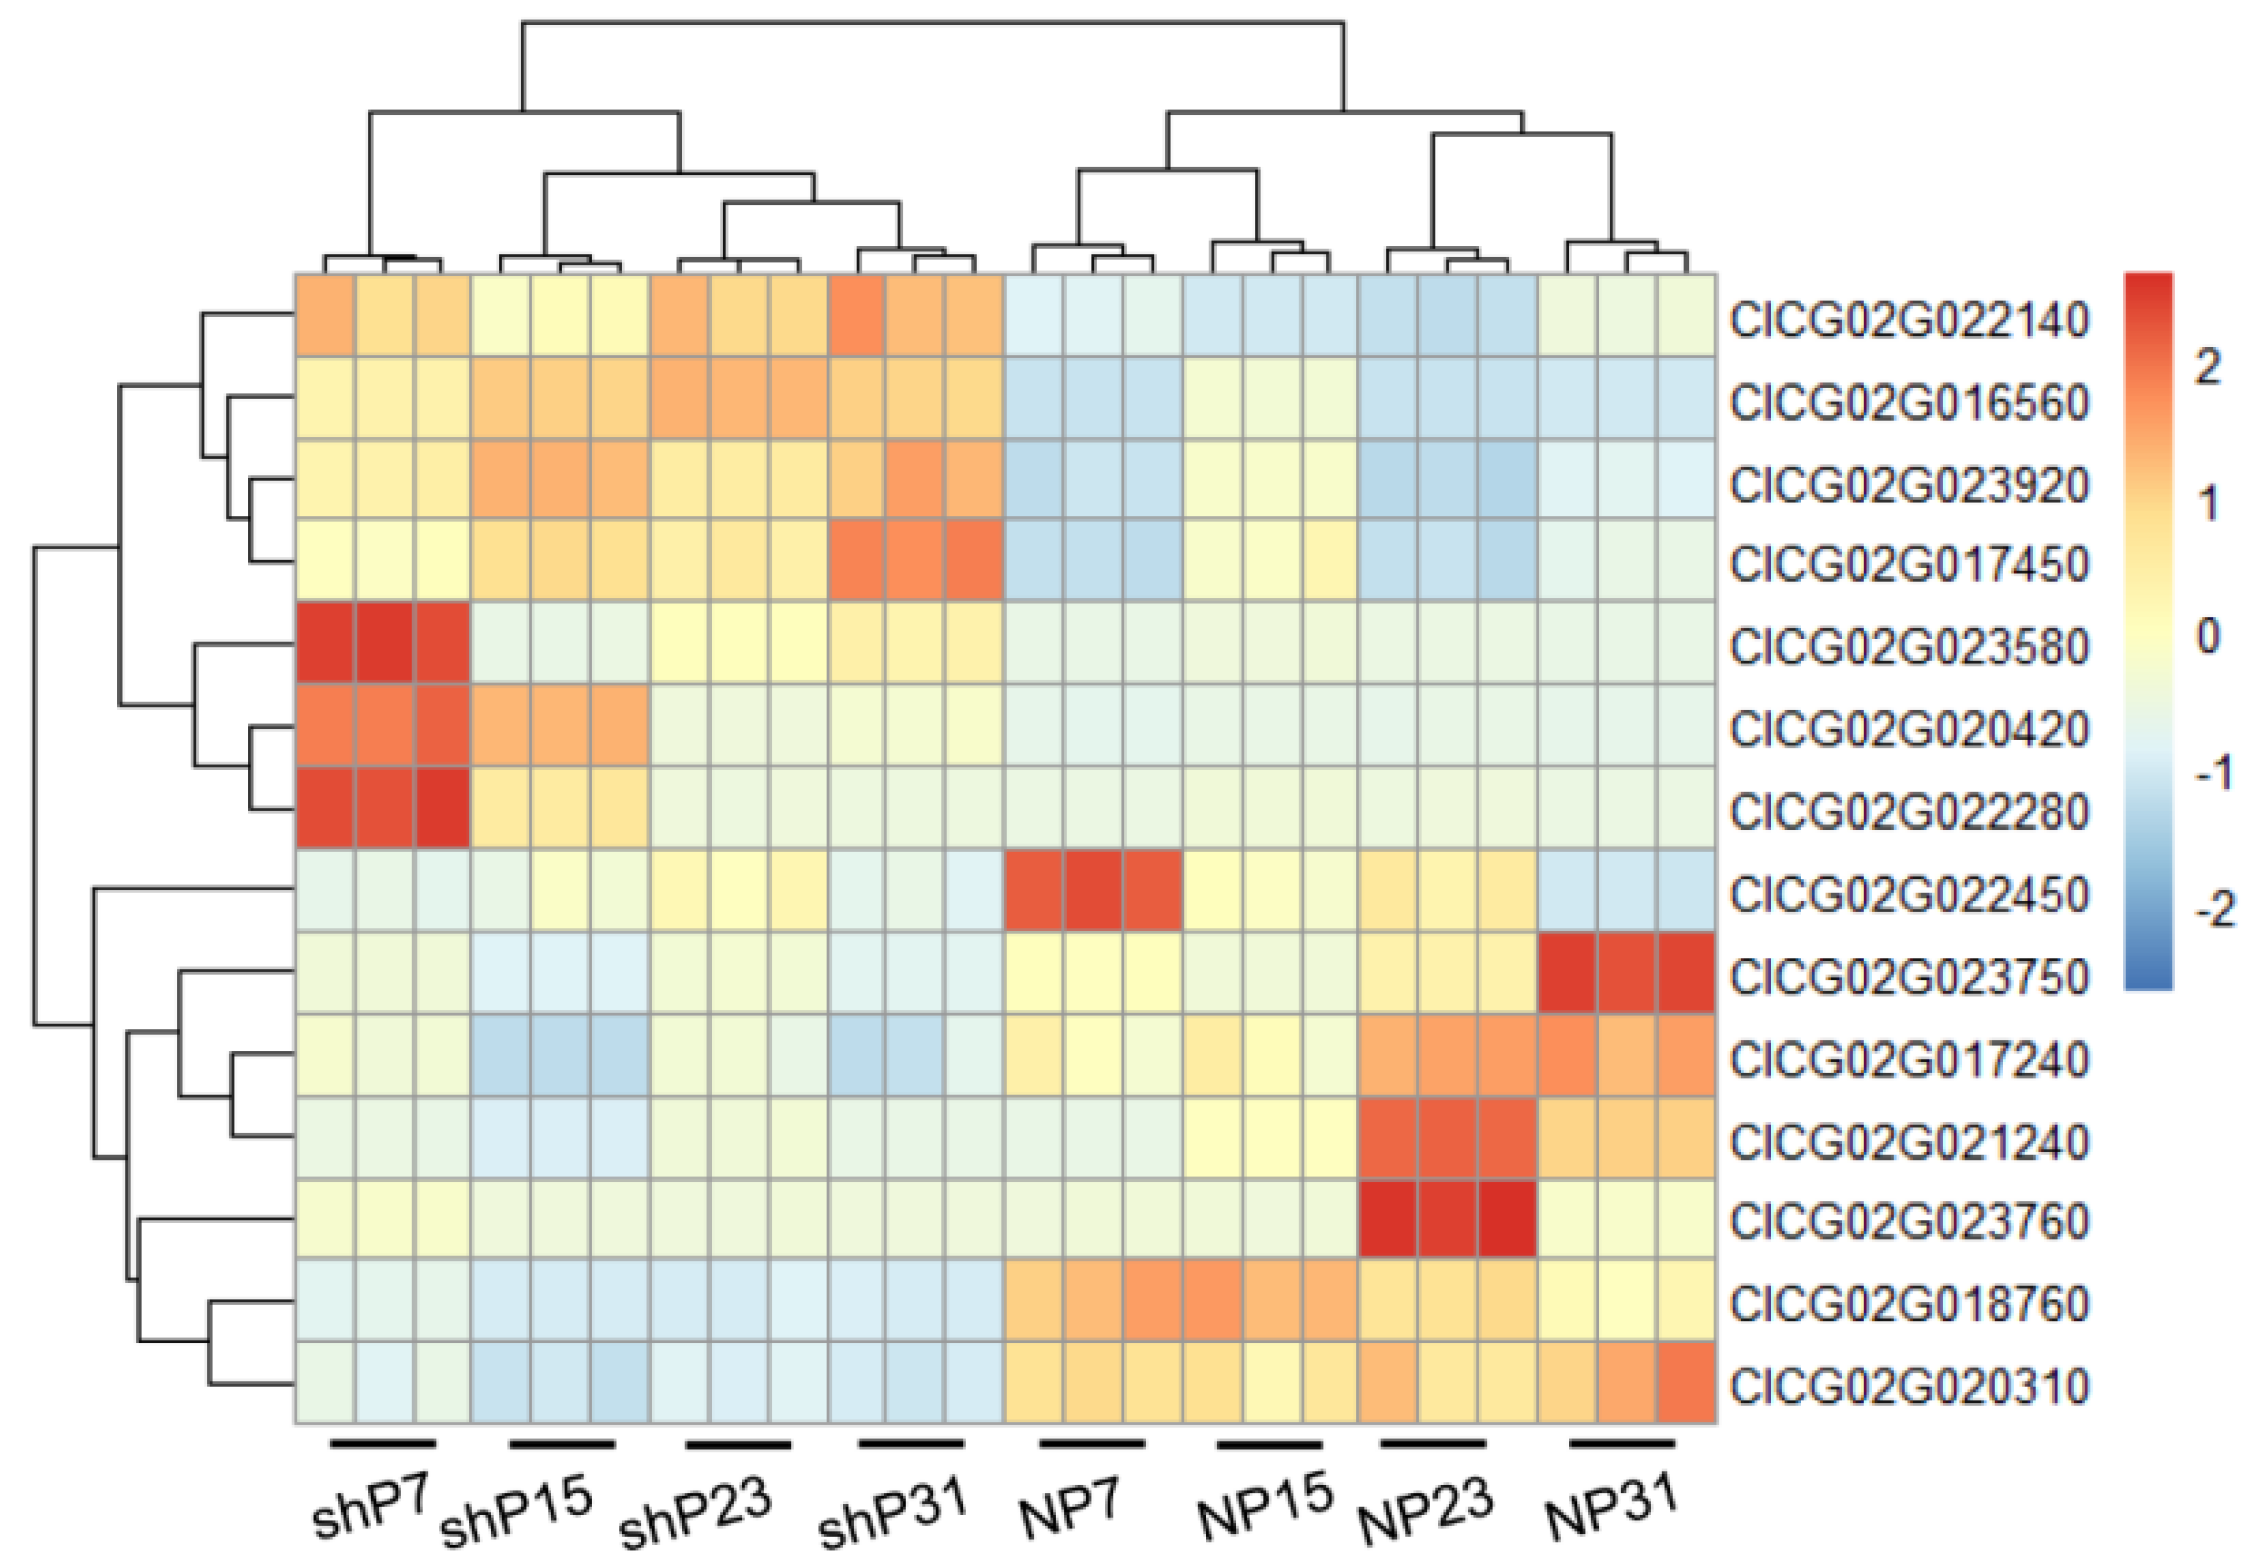
3.6. Co-Localization of QTL Mapping and Differentially Expressed Genes

In the findings, the genomic region spanning 31–38 Mb on chromosome 2 emerged as significantly associated with FW in the QTL mapping of 100 RIL materials. Simultaneously, BSA pinpointed the same region in the F2 population, characterized by distinct FW traits. The interval of 31–38 Mb was identified as a promising candidate region through both the ED and Δ(SNP-index) methods. Differential expression analysis between the two parental lines revealed 354 genes with potential relevance to FW. Consequently, co-locating these differentially expressed genes with the identified candidate intervals yielded 14 genes as notable candidates for FW variation (Supplementary Table S4).
The expression patterns of these genes in the parents are different across the four stages of fruit peel (Figure 8). Among them, ClCG02G022140, ClCG02G023920, ClCG02G016560, ClCG02G017450, ClCG02G023580, ClCG02G022280 and ClCG02G020420 exhibit high expression in sh14-11, while ClCG02G023750, ClCG02G022450, ClCG02G017240, ClCG02G018760, ClCG02G020310, ClCG02G021240 and ClCG02G023760 show elevated expression in N14.
Utilizing the Non-Redundant Protein Sequence Database (NR), we conducted functional annotations for the 14 identified candidate genes. The majority of these genes are associated with pivotal roles in plant growth and development (Table 2). For instance, ClCG02G022140 is annotated as a TGA transcription factor known to regulate the expression of target genes. Additionally, ClCG02G022280 and ClCG02G018760 are, respectively, identified as distinct constituent proteins of NAC transcription factors, which are recognized for their significant involvement in plant fruit development. Furthermore, ClCG02G020420 is annotated as a zinc finger protein, and so forth. In summary, the differentially expressed genes we identified are likely to exert a substantial impact on the FW variation in watermelon.

4. Discussion

Up to now, there have been many studies on the construction of the watermelon genetic map, but most of them are based on low-density markers [4,5,31]. By deep sequencing the whole genome of 100 RIL lines, we constructed a high-quality genetic map containing 218,127 SNP markers and further completed the QTL mapping of FW. This method was successfully implemented across various species [32,33,34,35,36,37]. Furthermore, using the differential expression analysis of multiple tissues between parents to identify candidate genes saves a lot of time and energy compared to building a large population for fine positioning and speeds up the screening of candidate genes [38]. In the next step, rapid genotyping methods such as iBP-seq can be used for validating and verifying candidate genes [39], and the mutant phenotypes of the corresponding genes can be observed.
Previous studies on fruit size have mainly focused on FSI, FL and FD, with less emphasis on FW because the phenotype of FW is more affected by the environment and unstable. However, FW is a three-dimensional description of fruit size, which can also fully reflect the variation in fruit size. Some studies show that FW is a trait that is different from fruit size, but they are inherently correlated [22,40]. Previous reports demonstrated that the PVE for FSI, FL and FD could reach up to 31.9% [28]. In contrast, our QTL analysis for FW only accounted for 15.1% of the variation, suggesting a higher environmental influence on this trait. We identified the identical locus, located at 31–38 Mb on chromosome 2, using distinct methods in different populations—BSA in the F2 population and QTL mapping in RILs. This outcome underscores the mutual verification capability between the two mapping approaches, affirming the reliability of this locus. Additionally, the consistency in mapping results between the ED and Δ(SNP-index) indicates that various BSA methods exhibit concordant identification effects on loci with substantial impact [16].
In previous studies, many related loci and genes were identified for fruit size, such as SUN [41] and lc [42], proving their influence on fruit development in various species. The disparity between these known genes and our mapping interval might be attributed to variations in the genetic difference of lines. The two parents we selected both produce round fruits, leading to consistency in their FSI, making it challenging to pinpoint the locus related to FSI while focusing only on FW. Moreover, our lines differ from those used in prior FW mapping studies, potentially resulting in distinct QTLs and effect sites. Nevertheless, within our mapping interval, we identified not only homologous genes to known fruit size-related genes, such as fas [43], but also crucial transcription factors influencing fruit development, such as the TGA and NAC transcription factors.
ClCG02G022140 was annotated as a TGA transcription factor in a previous study on Solanum lycopersicum. TGA transcription factors have been shown to influence fruit development. Specifically, SlTGA2.3 interacts with the auxin amide hydrolase SlILR5 to regulate cell division and participate in the fruit expansion process [44]. Additionally, RNA interference (RNAi) technology used to silence SlTGA2.2 revealed changes in the early development and metabolism of Solanum lycopersicum fruits, leading to delayed fruit ripening [45]. ClCG02G022280 and ClCG02G018760 are annotated as NAC transcription factors, which play an important role in fruit ripening. In citrus, CrNAC036 inhibits fruit ripening by synergistically down-regulating the expression of the ABA pathway gene CrNCED5 through physical interactions with CrMYB68 [46]. In kiwifruit, the AdNAC6 and AdNAC7 proteins function as transcriptional activators, binding to the promoters of AdACS1, AdACO1, AdMAN1 and AaTPS1, thereby activating their transcription and promoting fruit ripening [47]. These studies show that our mapping loci and candidate genes carry high credibility.
Overall, our findings successfully mapped FW trait to a hitherto undiscovered genomic region, employing a multifaceted approach, and identified candidate genes through differential expression analysis. This discovery holds promise for the development of molecular marker-assisted selection strategies in breeding watermelon fruits of varying sizes. Moreover, recognizing that FW can also be influenced by physiological and cultivation conditions, further investigation and functional verification are imperative to more precisely identify genes governing the watermelon FW. The cultivation of compact-sized watermelons is a pivotal aspect of watermelon variety development, characterized by aesthetically pleasant appearance, abbreviated growth cycles and enhanced portability. This investigation introduces valuable techniques and preliminary data for elucidating watermelon FW-related traits, expediting the watermelon breeding process and contributing significant to practical implications.

5. Conclusions

To dissect the genetic architecture of watermelon FW variation, we constructed 100 RIL lines from sh14-11 and N14 and sequenced the whole genome. A genetic map of 1649.42 cM was constructed, and 34–38 Mb on chromosome 2 was detected as a candidate interval for FW. Meanwhile, crossing sh14-11 and N14, a total of 100 plants in the F2 population were constructed, and the plants with extremely big fruit and small fruit were selected for BSA. Using Δ(SNP-index) and ED algorithms, a region spanning 31–38 Mb was detected on chromosome 2 that is related to FW, consistent with map-based mapping.
RNA-seq were carried out among 11 pairs of tissues between sh14-11 and N14. The expression profiles identified 1695 new genes and corrected the annotation of 2941 genes. After differential expression analysis in four stages between sh14-11 and N14, 354 differentially expressed genes were detected among four stages. Combining QTL mapping and differential expression analysis, 14 genes were located in the QTL mapping interval, including the annotated TGA and NAC transcription factors implicated in fruit development. We mined 14 candidate genes related to the FW by QTL mapping and differential expression analysis. It is believed that this identification is of great significance for genetic understanding and cultivation improvement in watermelon.

Supplementary Materials

The following supporting information can be downloaded at: https://www.mdpi.com/article/10.3390/genes15070933/s1. Supplementary Table S1: Data statistics for the resequencing of 100 RILs; Supplementary Table S2: Data statistics for the RNA-seq of 11 stages between sh14-11 and N14; Supplementary Table S3: Correlation coefficient of biological repetition for all samples; Supplementary Table S4: Expression levels of 14 differentially expressed genes in each sample.

Author Contributions

H.S. and R.Y. designed and supervised this study. S.G., M.T., H.D., S.L., R.Y. and H.S. performed the data analysis. S.G. and M.T. conducted field experiments and DNA extraction. H.S. and S.G. prepared the manuscript. All authors have read and agreed to the published version of the manuscript.

Funding

This research was supported by the National Modern Agricultural Industrial Technology System Project “West Melon System Ningxia Zhongwei Comprehensive Experimental Station” (CARS-25) and Ningxia Natural Science Foundation Project (2023AAC03423) Genetic Analysis and Gene Mapping of Watermelon “Tomoto Type” Seed Characteristics.

Institutional Review Board Statement

This study does not involve human or animal research.

Informed Consent Statement

This study does not involve humans.

Data Availability Statement

All the original data in this study have been deposited into CNGB Sequence Archive (CNSA) of China National GeneBank DataBase. The bulked sergeant analysis datasets of fruit weight in the F2 population are deposited with accession number CNP0005458. The re-sequencing datasets of the RIL population are deposited with accession number CNP0005460, and the RNA-seq datasets of 22 samples are deposited with accession number CNP0005461.

Conflicts of Interest

The authors declare no conflicts of interest.

Abbreviations

AFLPamplified fragment length polymorphisms
BSAbulked segregant analysis
CIMcomposite interval mapping
DEGsdifferentially expressed genes
EDEuclidean distance
FDfruit width
FLfruit length
FSfruit shape
FSIfruit shape indices
FWfruit weight
LGslinkage groups
NGSnext-generation sequencing
PCAprincipal component analysis
PVEphenotypic variation effect
QTLquantitative trait loci
RILsrecombinant inbred lines
SNPssingle nucleotide polymorphisms
SSRsimple sequence repeat
WGRwhole-genome resequencing

References

  1. Maoto, M.M.; Beswa, D.; Jideani, A.I.O. Watermelon as a potential fruit snack. Int. J. Food Prop. 2019, 22, 355–370. [Google Scholar] [CrossRef]
  2. Navot, N.; Zamir, D. Isozyme and seed protein phylogeny of the genusCitrullus (Cucurbitaceae). Plant Syst. Evol. 1987, 156, 61–67. [Google Scholar] [CrossRef]
  3. Zamir, D.; Navot, N.; Rudich, J. Enzyme polymorphism in Citrullus lanatus and C. colocynthis in Israel and Sinai. Plant Syst. Evol. 1984, 146, 163–170. [Google Scholar] [CrossRef]
  4. Hawkins, L.; Dane, F.; Kubisiak, T. Molecular Markers Associated with Morphological Traits in Watermelon. Am. Soc. Hortic. Sci. 2001, 36, 1318–1322. [Google Scholar] [CrossRef]
  5. Levi, A.; Thomas, C.; Trebitsh, T.; Salman, A.; King, J.; Karalius, J.; Newman, M.; Reddy, O.; Xu, Y.; Zhang, X. An extended linkage map for watermelon based on SRAP, AFLP, SSR, ISSR, and RAPD markers. J. Am. Soc. Hortic. Sci. 2006, 131, 393–402. [Google Scholar] [CrossRef]
  6. Davey, J.W.; Hohenlohe, P.A.; Etter, P.D.; Boone, J.Q.; Catchen, J.M.; Blaxter, M.L. Genome-wide genetic marker discovery and genotyping using next-generation sequencing. Nat. Rev. Genet. 2011, 12, 499–510. [Google Scholar] [CrossRef] [PubMed]
  7. Schneeberger, K.; Ossowski, S.; Lanz, C.; Juul, T.; Petersen, A.H.; Nielsen, K.L.; Jørgensen, J.-E.; Weigel, D.; Andersen, S.U. SHOREmap: Simultaneous mapping and mutation identification by deep sequencing. Nat. Methods. 2009, 6, 550–551. [Google Scholar] [CrossRef]
  8. Liu, S.; Yeh, C.-T.; Tang, H.M.; Nettleton, D.; Schnable, P.S. Gene Mapping via Bulked Segregant RNA-Seq (BSR-Seq). PLoS ONE 2012, 7, e36406. [Google Scholar] [CrossRef] [PubMed]
  9. Magwene, P.M.; Willis, J.H.; Kelly, J.K. The Statistics of Bulk Segregant Analysis Using Next Generation Sequencing. PLoS Comput. Biol. 2011, 7, e1002255. [Google Scholar] [CrossRef]
  10. Abe, A.; Kosugi, S.; Yoshida, K.; Natsume, S.; Takagi, H.; Kanzaki, H.; Matsumura, H.; Yoshida, K.; Mitsuoka, C.; Tamiru, M.; et al. Genome sequencing reveals agronomically important loci in rice using MutMap. Nat. Biotechnol. 2012, 30, 174–178. [Google Scholar] [CrossRef]
  11. Hill, J.T.; Demarest, B.L.; Bisgrove, B.W.; Gorsi, B.; Su, Y.-C.; Yost, H.J. MMAPPR: Mutation mapping analysis pipeline for pooled RNA-seq. Genome Res. 2013, 23, 687–697. [Google Scholar] [CrossRef] [PubMed]
  12. Zhang, H.; Wang, X.; Pan, Q.; Li, P.; Liu, Y.; Lu, X.; Zhong, W.; Li, M.; Han, L.; Li, J.; et al. QTG-Seq Accelerates QTL Fine Mapping through QTL Partitioning and Whole-Genome Sequencing of Bulked Segregant Samples. Mol. Plant. 2019, 12, 426–437. [Google Scholar] [CrossRef] [PubMed]
  13. Li, Z.; Chen, X.; Shi, S.; Zhang, H.; Wang, X.; Chen, H.; Li, W.; Li, L. DeepBSA: A deep-learning algorithm improves bulked segregant analysis for dissecting complex traits. Mol. Plant. 2022, 15, 1418–1427. [Google Scholar] [CrossRef] [PubMed]
  14. Guo, S.; Zhang, J.; Sun, H.; Salse, J.; Lucas, W.J.; Zhang, H.; Zheng, Y.; Mao, L.; Ren, Y.; Wang, Z.; et al. The draft genome of watermelon (Citrullus lanatus) and resequencing of 20 diverse accessions. Nat. Genet. 2013, 45, 51–58. [Google Scholar] [CrossRef] [PubMed]
  15. Guo, S.; Zhao, S.; Sun, H.; Wang, X.; Wu, S.; Lin, T.; Ren, Y.; Gao, L.; Deng, Y.; Zhang, J.; et al. Resequencing of 414 cultivated and wild watermelon accessions identifies selection for fruit quality traits. Nat. Genet. 2019, 51, 1616–1623. [Google Scholar] [CrossRef] [PubMed]
  16. Renner, S.S.; Wu, S.; Pérez-Escobar, O.A.; Silber, M.V.; Fei, Z.; Chomicki, G. A chromosome-level genome of a Kordofan melon illuminates the origin of domesticated watermelons. Proc. Natl. Acad. Sci. USA 2021, 118, e2101486118. [Google Scholar] [CrossRef] [PubMed]
  17. Wu, S.; Wang, X.; Reddy, U.; Sun, H.; Bao, K.; Gao, L.; Mao, L.; Patel, T.; Ortiz, C.; Abburi, V.L.; et al. Genome of ‘Charleston Gray’, the principal American watermelon cultivar, and genetic characterization of 1,365 accessions in the U.S. National Plant Germplasm System watermelon collection. Plant Biotechnol. J. 2019, 17, 2246–2258. [Google Scholar] [CrossRef] [PubMed]
  18. Deng, Y.; Liu, S.; Zhang, Y.; Tan, J.; Li, X.; Chu, X.; Xu, B.; Tian, Y.; Sun, Y.; Li, B.; et al. A telomere-to-telomere gap-free reference genome of watermelon and its mutation library provide important resources for gene discovery and breeding. Mol. Plant. 2022, 15, 1268–1284. [Google Scholar] [CrossRef]
  19. Liu, S.; Gao, P.; Zhu, Q.; Luan, F.; Davis, A.R.; Wang, X. Development of cleaved amplified polymorphic sequence markers and a CAPS-based genetic linkage map in watermelon (Citrullus lanatus Matsum and Nakai) constructed using whole-genome re-sequencing data. Breed. Sci. 2016, 66, 244–259. [Google Scholar] [CrossRef]
  20. Ren, R.; Ray, R.; Li, P.; Xu, J.; Zhang, M.; Liu, G.; Yao, X.; Kilian, A.; Yang, X. Construction of a high-density DArTseq SNP-based genetic map and identification of genomic regions with segregation distortion in a genetic population derived from a cross between feral and cultivated-type watermelon. Mol. Genet. Genom. 2015, 290, 1457–1470. [Google Scholar] [CrossRef]
  21. Shang, J.; Li, N.; Li, N.; Xu, Y.; Ma, S.; Wang, J. Construction of a high-density genetic map for watermelon (Citrullus lanatus L.) based on large-scale SNP discovery by specific length amplified fragment sequencing (SLAF-seq). Sci. Hortic. 2016, 203, 38–46. [Google Scholar] [CrossRef]
  22. Pan, Y.; Wang, Y.; McGregor, C.; Liu, S.; Luan, F.; Gao, M.; Weng, Y. Genetic architecture of fruit weight and shape variation in cucurbits: A comparative perspective. Theor. Appl. Genet. 2020, 133, 1–21. [Google Scholar]
  23. Wei, Q.Z.; Fu, W.Y.; Wang, Y.Z.; Qin, X.D.; Wang, J.; Li, J.; Lou, Q.F.; Chen, J.F. Rapid identification of fruit length loci in cucumber (Cucumis sativus L.) using next-generation sequencing (NGS)based QTL analysis. Sci. Rep. UK 2016, 6, 27496. [Google Scholar] [CrossRef] [PubMed]
  24. Pan, Y.P.; Liang, X.J.; Gao, M.L.; Liu, H.Q.; Meng, H.W.; Weng, Y.Q.; Cheng, Z.H. Round fruit shape in WI7239 cucumber is controlled by two interacting quantitative trait loci with one putatively encoding a tomato SUN homolog. Theor. Appl. Genet. 2017, 130, 573–586. [Google Scholar] [CrossRef] [PubMed]
  25. Wu, S.H.A.N.; Zhang, B.Y.; Keyhaninejad, N.; Rodríguez, G.R.; Kim, H.J.; Chakrabarti, M.; Illa-Berenguer, E.; Taitano, N.K.; Gonzalo, M.J.; Díaz, A. Tomato reveals a common mechanism underlying morphological diversification in domesticated plants. Nat. Commun. 2018, 9, 4734. [Google Scholar] [CrossRef] [PubMed]
  26. Sandlin, K.; Prothro, J.; Heesacker, A.; Khalilian, N.; Okashah, R.; Xiang, W.; Bachlava, E.; Caldwell, D.G.; Taylor, C.A.; Seymour, D.K.; et al. Comparative mapping in watermelon [Citrullus lanatus (Thunb.) Matsum. et Nakai]. Theor. Appl. Genet. 2012, 125, 1603–1618. [Google Scholar] [CrossRef] [PubMed]
  27. Ren, Y.; McGregor, C.; Zhang, Y.; Gong, G.; Zhang, H.; Guo, S.; Sun, H.; Cai, W.; Zhang, J.; Xu, Y. An integrated genetic map based on four mapping populations and quantitative trait loci associated with economically important traits in watermelon (Citrullus lanatus). BMC Plant Biol. 2014, 14, 33. [Google Scholar]
  28. Kim, K.-H.; Hwang, J.-H.; Han, D.-Y.; Park, M.; Kim, S.; Choi, D.; Kim, Y.; Lee, G.P.; Kim, S.-T.; Park, Y.-H. Major Quantitative Trait Loci and Putative Candidate Genes for Powdery Mildew Resistance and Fruit-Related Traits Revealed by an Intraspecific Genetic Map for Watermelon (Citrullus lanatus var. lanatus). PLoS ONE 2015, 10, e0145665. [Google Scholar] [CrossRef] [PubMed]
  29. Dou, J.; Zhao, S.; Lu, X.; He, N.; Zhang, L.; Ali, A.; Kuang, H.; Liu, W. Genetic mapping reveals a candidate gene (ClFS1) for fruit shape in watermelon (Citrullus lanatus L.). Theor. Appl. Genet. 2018, 131, 947–958. [Google Scholar] [CrossRef]
  30. Tanaka, T.; Wimol, S.; Mizutani, T. Inheritance of fruit shape and seed size of watermelon. J. Jpn. Soc. Hortic. Sci. 1995, 64, 543–548. [Google Scholar] [CrossRef]
  31. Cheng, Y.; Luan, F.; Wang, X.; Gao, P.; Zhu, Z.; Liu, S.; Baloch, A.M.; Zhang, Y. Construction of a genetic linkage map of watermelon (Citrullus lanatus) using CAPS and SSR markers and QTL analysis for fruit quality traits. Sci. Hortic. 2016, 202, 25–31. [Google Scholar] [CrossRef]
  32. Ariyadasa, R.; Mascher, M.; Nussbaumer, T.; Schulte, D.; Frenkel, Z.; Poursarebani, N.; Zhou, R.; Steuernagel, B.; Gundlach, H.; Taudien, S.; et al. A sequence-ready physical map of barley anchored genetically by two million single-nucleotide polymorphisms. Plant Physiol. 2014, 164, 412–423. [Google Scholar] [CrossRef] [PubMed]
  33. Trick, M.; Long, Y.; Meng, J.; Bancroft, I. Single nucleotide polymorphism (SNP) discovery in the polyploid Brassica napus using Solexa transcriptome sequencing. Plant Biotechnol. J. 2009, 7, 334–346. [Google Scholar] [CrossRef] [PubMed]
  34. Wang, L.; Wang, A.; Huang, X.; Zhao, Q.; Dong, G.; Qian, Q.; Sang, T.; Han, B. Mapping 49 quantitative trait loci at high resolution through sequencing-based genotyping of rice recombinant inbred lines. Theor. Appl. Genet. 2011, 122, 327–340. [Google Scholar] [CrossRef] [PubMed]
  35. Yu, S.; Su, T.; Zhi, S.; Zhang, F.; Wang, W.; Zhang, D.; Zhao, X.; Yu, Y. Construction of a sequence-based bin map and mapping of QTLs for downy mildew resistance at four developmental stages in Chinese cabbage (Brassica rapa L. ssp. pekinensis). Mol. Breed. 2016, 36, 44. [Google Scholar] [CrossRef]
  36. Zhang, D.; Li, H.; Wang, J.; Zhang, H.; Hu, Z.; Chu, S.; Lv, H.; Yu, D. High-Density Genetic Mapping Identifies New Major Loci for Tolerance to Low-Phosphorus Stress in Soybean. Front. Plant Sci. 2016, 7, 372. [Google Scholar] [CrossRef] [PubMed]
  37. Li, B.; Lu, X.; Dou, J.; Aslam, A.; Gao, L.; Zhao, S.; He, N.; Liu, W. Construction of A High-Density Genetic Map and Mapping of Fruit Traits in Watermelon (Citrullus lanatus L.) Based on Whole-Genome Resequencing. Int. J. Mol. Sci. 2018, 19, 3268. [Google Scholar] [CrossRef] [PubMed]
  38. Sun, L.; Zhang, Y.; Cui, H.; Zhang, L.; Sha, T.; Wang, C.; Fan, C.; Luan, F.; Wang, X. Linkage Mapping and Comparative Transcriptome Analysis of Firmness in Watermelon (Citrullus lanatus). Front. Plant Sci. 2020, 11, 831. [Google Scholar] [CrossRef]
  39. Li, J.; Han, R.; Li, R.; Xu, Q.; Li, M.; Tang, Y.; Li, J.; Wang, X.; Li, Z.; Li, Q.; et al. iBP-seq: An efficient and low-cost multiplex targeted genotyping and epigenotyping system. Crop J. 2023, 11, 1605–1610. [Google Scholar] [CrossRef]
  40. Shimomura, K.; Fukino, N.; Sugiyama, M.; Kawazu, Y.; Sakata, Y.; Yoshioka, Y. Quantitative trait locus analysis of cucumber fruit morphological traits based on image analysis. Euphytica 2017, 213, 138. [Google Scholar] [CrossRef]
  41. Xiao, H.; Jiang, N.; Schaffner, E.; Stockinger, E.J.; van der Knaap, E. A retrotransposon-mediated gene duplication underlies morphological variation of tomato fruit. Science 2008, 319, 1527–1530. [Google Scholar] [CrossRef] [PubMed]
  42. Munos, S.; Ranc, N.; Botton, E.; Bérard, A.; Rolland, S.; Duffé, P.; Carretero, Y.; Le Paslier, M.C.; Delalande, C.; Bouzayen, M.; et al. Increase in Tomato Locule Number Is Controlled by Two Single-Nucleotide Polymorphisms Located Near WUSCHEL. Plant Physiol. 2011, 156, 2244–2254. [Google Scholar] [CrossRef] [PubMed]
  43. Cong, B.; Barrero, L.S.; Tanksley, S.D. Regulatory change in YABBY-like transcription factor led to evolution of extreme fruit size during tomato domestication. Nat. Genet. 2008, 40, 800–804. [Google Scholar] [CrossRef] [PubMed]
  44. Liu, X. The Role of Auxin Amide Hydrolase SlILR5 in Tomato Fruit Expansion. Master’s Thesis, Shenyang Agricultural University, Shenyang, China, 2020. [Google Scholar]
  45. Lemaire-Chamley, M.; Koutouan, C.; Jorly, J.; Assali, J.; Yoshida, T.; Nogueira, M.; Tohge, T.; Ferrand, C.; Peres, L.E.; Asamizu, E.; et al. A chimeric TGA repressor slows down fruit maturation and ripening in tomato. Plant Cell Physiol. 2022, 63, 120–134. [Google Scholar] [CrossRef] [PubMed]
  46. Zhu, X.; Chen, J.; Xie, Z.; Gao, J.; Ren, G.; Gao, S.; Zhou, X.; Kuai, B. Jasmonic acid promotes degreening via MYC2/3/4- and ANAC019/055/072-mediated regulation of major chlorophyll catabolic genes. Plant J. 2015, 84, 597–610. [Google Scholar] [CrossRef]
  47. Wang, W.-Q.; Wang, J.; Wu, Y.-Y.; Li, D.-W.; Allan, A.C.; Yin, X.-R. Genome-wide analysis of coding and non-coding RNA reveals a conserved miR164-NAC regulatory pathway for fruit ripening. New Phytol. 2020, 225, 1618–1634. [Google Scholar] [CrossRef]
Figure 1. The FW of sh14-11 and N14 on 31 days after fruit setting.
Genes 15 00933 g001
Figure 2. Haplotype map and genetic map evaluation of RILs. (a) The haplotype map of RILs; aa and bb stand for homozygosity, and ab stands for heterozygosity. (b) The collinearity between genetic map and physical map.
Genes 15 00933 g002
Figure 3. High-density genetic map and quantitative trait loci mapping of FW. (a) The high-density genetic map for watermelon. (b) Mapping QTL for FW.
Genes 15 00933 g003
Figure 4. BSA mapping of FW in watermelon. (a) Distribution of Δ(SNP-index) across the genome. (b) Distribution of Euclidean distance (ED) across the genome. The red dotted box and arrow represent QTL identified by the two methods.
Genes 15 00933 g004
Figure 5. Comparative analysis of three biological repeats in 22 tissues. (a) Correlation coefficient between biological repetitions in 22 tissues. (b) Principal component analysis clustering performed among 22 tissues.
Genes 15 00933 g005
Figure 6. Analysis of differentially expressed genes between sh14-11 and N14 in 11 pairs of tissues, including 3 stages of flower (F0, F1, F2), 4 stages of fruit pulp (R7, R15, R23, R31) and 4 stages of fruit peel (P7, P15, P23, P31). (a) Number of differentially expressed genes in 11 corresponding pairs of tissues between parents; (b) overlapping differentially expressed genes in 11 corresponding pairs of tissues.
Genes 15 00933 g006
Figure 7. Identification of differentially expressed genes between sh14-11 and N14 in 4 pairs of tissues, including 4 stages of fruit peel (P7, P15, P23, P31). (a) The number and expression level changes of DEGs between sh14-11 and N14 in 4 pairs of tissues. (b) A total of 354 genes were differentially expressed across 4 pairs of tissues.
Genes 15 00933 g007
Figure 8. Changes in expression levels of 14 candidate genes in 4 pairs of tissues between sh14–11 (shP7, shP15, shP23, shP31) and N14 (NP7, NP15, NP23, NP31).
Genes 15 00933 g008
Table 1. Distribution of single-nucleotide polymorphism markers on the high-density genetic map.
LG IDTotal Bin MarkerTotal Distance (cM)Average Distance (cM)Max Gap (cM)Gaps < 5 cM (%)
LG01255139.40.5513.4499.21%
LG02234164.390.7111.9599.57%
LG03163146.550.918.3598.77%
LG04211154.580.748.9296.19%
LG05402170.180.426.4999.75%
LG06236148.780.6314.598.72%
LG07259156.880.614.56100%
LG08135123.920.9211.9599.25%
LG09247195.710.86.3199.59%
LG10280146.090.5211.9598.92%
LG11175102.930.595.5899.43%
Total25971649.420.6418.3596.19%
Table 2. Location and annotation information for 14 candidate genes.
Gene IDChrStartEndAnnotation
ClCG02G022140236,608,687 36,616,809 transcription factor TGA9-like
ClCG02G023920238,267,515 38,268,888 protein YLS3-like isoform X2
ClCG02G016560231,036,756 31,040,967 protein ECERIFERUM 26-like
ClCG02G017450231,950,483 31,952,384 probable protein phosphatase 2C 52
ClCG02G023580237,923,184 37,929,184 linoleate 13S-lipoxygenase 2-1
ClCG02G022280236,720,766 36,721,559 NAC domain-containing protein 90
ClCG02G020420234,918,750 34,919,220 zinc finger protein ZAT12-like
ClCG02G023750238,110,302 38,131,226 peroxidase 2-like
ClCG02G022450236,884,417 36,885,709 protein FAF-like, chloroplastic
ClCG02G017240231,779,639 31,782,992 probable E3 ubiquitin-protein ligase RHY1A
ClCG02G018760233,491,641 33,496,029 NAC domain-containing protein 96
ClCG02G020310234,854,388 34,855,109 Glyoxalase_2 domain-containing protein
ClCG02G021240235,752,425 35,755,753 Lysine_decarbox domain-containing protein
ClCG02G023760238,142,602 38,144,446 peroxidase 2-like
Disclaimer/Publisher’s Note: The statements, opinions and data contained in all publications are solely those of the individual author(s) and contributor(s) and not of MDPI and/or the editor(s). MDPI and/or the editor(s) disclaim responsibility for any injury to people or property resulting from any ideas, methods, instructions or products referred to in the content.

