Abstract
To explore the regulatory mechanism of endogenous hormones in the synthesis of anthocyanins in Anoectochilus roxburghii (Wall.) Lindl (A. roxburghii) under different light intensities, this study used metabolomics and transcriptomics techniques to identify the key genes and transcription factors involved in anthocyanin biosynthesis. We also analyzed the changes in and correlations between plant endogenous hormones and anthocyanin metabolites under different light intensities. The results indicate that light intensity significantly affects the levels of anthocyanin glycosides and endogenous hormones in leaves. A total of 38 anthocyanin-related differential metabolites were identified. Under 75% light transmittance (T3 treatment), the leaves exhibited the highest anthocyanin content and differentially expressed genes such as chalcone synthase (CHS), flavonol synthase (FLS), and flavonoid 3′-monooxygenase (F3′H) exhibited the highest expression levels. Additionally, 13 transcription factors were found to have regulatory relationships with 7 enzyme genes, with 11 possessing cis-elements responsive to plant hormones. The expression of six genes and two transcription factors was validated using qRT-PCR, with the results agreeing with those obtained using RNA sequencing. This study revealed that by modulating endogenous hormones and transcription factors, light intensity plays a pivotal role in regulating anthocyanin glycoside synthesis in A. roxburghii leaves. These findings provide insights into the molecular mechanisms underlying light-induced changes in leaf coloration and contribute to our knowledge of plant secondary metabolite regulation caused by environmental factors.
1. Introduction
A. roxburghii (Wall.) Lindl is a perennial herb of the genus Epipactis in the Orchidaceae family and is named for the golden yellow or orange-red reticulate venation on the upper surface of its leaves. With its delicate plant form and elegant leaf shape, it is a valued indoor ornamental plant. A. roxburghii is mainly distributed in China, including Fujian, Zhejiang, Jiangxi, and Guizhou provinces; Japan; Sri Lanka; India; and Nepal [1]. This species has traditionally been considered one of the most valuable medicinal plants. Many years ago, A. roxburghii was listed as a protected species in the Convention on International Trade in Endangered Species of Wild Fauna and Flora (CITES). Because A. roxburghii is widely used in medicine, health care, beauty, drinking products, and many other areas, its market demand as a medicinal plant has increased yearly [1]. However, the market for A. roxburghii as an ornamental plant remains to be developed. The hue of medicinal plants is closely tied to anthocyanin biosynthesis and content levels. Therefore, investigating the biosynthetic mechanism of anthocyanins in A. roxburghii leaves is important for regulating leaf color and the market development of this species as an ornamental plant.
Anthocyanins are among the most significant plant pigments derived from flavonoid metabolism, and their diverse types contribute to the richness of plant colors. They typically accumulate in flowers, fruits, seeds, and leaves of the angiosperms, providing red, purple, and blue plant hues [2]. Depending on the degree of hydroxylation and methylation, anthocyanins can be classified into six major groups: pelargonidin, cyanidin, delphinidin, peonidin, petudinin, and malvidin glycosides [3]. Cyanidin and pelargonidin glycosides are often found in red-colored leaves, such as Acer rubrum L. [4] and Camellia japonica L. [5], while delphinidin glycosides, malvidin, peonidin, and petudinin glycosides are primarily present in deep blue and purple plant organs, such as Muscari botryoides (L.) Mill [6] and Rhododendron pulchrum sweet (Ericaceae) [7]. The biosynthesis and regulation of anthocyanins are accomplished through the combined effects of intrinsic genetic backgrounds and extrinsic environmental factors mediated by a complex regulatory network [8]. The anthocyanin synthesis is regulated by two types of genes: structural genes, which encode various enzymes required in the metabolic pathway, and regulatory genes, which encode transcription factors that control the spatiotemporal expression levels of the structural genes. The structural genes include two significant groups, namely, the upstream gene group (CHS, CHI, and F3H) and the downstream gene group (F3’H, F3′5′H, DFR, ANS, and UFGT). Regulatory genes primarily consist of those that encode the MYB, bHLH, and WD40 transcription factors, which regulate the expression of genes related to anthocyanin biosynthesis by binding to corresponding cis-acting elements in the promoters of structural genes [9]. Research on the biosynthesis pathways of anthocyanins in various plant organs has reached a highly advanced state. Yet, there are few reports on the synthesis mechanism of anthocyanins in A. roxburghii leaves.
The environment in which plants exist has a profound influence on the synthesis of anthocyanins, with light being one of the most significant influencing factors. The relationship between light intensity and anthocyanin biosynthesis is a crucial research direction in horticultural breeding and cultivation. Light can regulate the expression levels of genes involved in anthocyanin synthesis pathways and structural genes [10], enhancing enzyme activity to promote the synthesis and accumulation of anthocyanins in plants. Researchers have screened differentially expressed genes and metabolites in Brassica napus L. seedlings under various light conditions. They found that the color changes in B. napus L. organs and tissues induced by strong light were associated with anthocyanin accumulation and changes in the expression of related genes, which guided tissue research on B. napus L. seedlings [11]. Zhao used combined transcriptomic and metabolomic analysis to identify the nutritional differences in Fagopyrum tataricum (L.) Gaertn. under various light conditions and the impact of light on the anthocyanin synthesis pathway, unearthing 12 anthocyanin-related structural genes [12]. Nakatsuka used a combined analysis of transcriptional metabolism to discover that the flower color of Lilium brownii var. viridulum Baker lightens, anthocyanin content decreases, and bifunctional dihydroflavonol 4-reductase (DFR) gene expression down-regulates after shading [13]. However, there is currently limited research on the regulatory mechanism of anthocyanin synthesis in A. roxburghii in response to changes in light intensity. Therefore, using light to regulate its anthocyanins has become an important objective for enhancing the ornamental value of A. roxburghii.
Studying plant hormones has emerged as a frontier and popular field in contemporary international plant science. Based on current research findings, plant hormones can be categorized into nine major classes, namely, auxins (AUXs), cytokinins (CKs), gibberellins (GAs), abscisic acid (ABA), ethylene (ETH), jasmonic acid (JA), salicylic acid (SA), brassinosteroids (BRs), and strigolactones (SLs) [14]. Anthocyanin biosynthesis is regulated by endogenous plant hormones [15], which act on regulatory genes to control structural genes, ultimately leading to anthocyanin accumulation. For instance, ethylene inhibits the transcription of the SlAN2-like gene in tomatoes (Lycopersicon esculentum Mill.), suppressing the biosynthesis of anthocyanins [16]; treatment with gibberellin induces the expression of the Ipomoea nil (L.) Roth. CHS gene, promoting anthocyanin accumulation [17]; the anthocyanin content in grape (Vitis vinifera L.) skins treated with salicylic acid generally exhibits an initial decrease followed by an increase, unlike in untreated groups, where it increases [18]. However, there is still no research on the leaf coloration mechanism under different light intensities or the endogenous hormone regulation of A. roxburghii.
To explore the mechanism of anthocyanin biosynthesis and the role of closely related endogenous hormones in A. roxburghii leaves under different light intensities, this study used metabolomics and transcriptomics techniques and bioinformatics methods to achieve the following goals: to analyze the transcriptional regulation mechanism underlying the specific accumulation of secondary metabolites; to identify the key genes and transcription factors of anthocyanin biosynthesis under different light intensities; to analyze the changes in and correlation between endogenous hormones and anthocyanin metabolites; and to construct a regulatory network of these genes and metabolites. The results of this study may provide a theoretical basis and practical guidance for hormone regulation in A. roxburghii leaf color production.
2. Materials and Methods
2.1. Treatment of Experimental Materials
A. roxburghii tissue culture seedlings were provided by the experimental base of Fujian Agriculture and Forestry University (Fujian Institute of Tropical Crops, Zhangzhou, China, 117.31° E, 24.38° N) in 2023. The experiment was conducted in the greenhouse of the Tropical Crops Research Institute of Fujian Province from August 2023 to December 2023. The average yearly temperature was 21.1 °C, with a lowest temperature of 25 °C and a highest temperature of 33 °C from August to October. The greenhouse was kept at a temperature range of 23 °C to 25 °C, with a humidity of 75% to 85%, an average light intensity of 120 μmol/(m2·s), and a photoperiod of 12 h by using a water curtain, fan, and spray system.
We selected the A. roxburghii bottle seedlings with a growth stage of about 3 months, a plant height of 8–10 cm, 2–3 roots, and a stem diameter of about 0.25 cm, using a 5 × 5 arrangement with 5 rows of 5 bottles per treatment, for a total of 25 bottles. Both sides of the bottle seedlings were protected plants, and the middle bottle seedlings were selected as experimental materials. Different shading nets (2, 4, and 8 needles) were used under natural light intensity in the greenhouse. The shading nets were not removed during the whole leaf growth period, and the upper layer of the middle test bottle seedlings was selected for sampling. Shading net T1 treatment: 8 stitches, light transmittance of 25%, average light intensity of 25 μmol/(m2·s). Shading net T2 treatment: 4 stitches, light transmittance of 50%, average light intensity of 50 μmol/(m2·s). Shading net T3 treatment: 2 stitches, light transmittance of 75%, average light intensity of 80 μmol/(m2·s). Each treatment was set up with 3 replicates and 5 bottles for each replicate. The sampling period was 15 days. The leaves were taken from the same direction as A. roxburghii plants, frozen with liquid nitrogen, stored in a −80 °C refrigerator, and sent to Beijing BMK Biotechnology (Beijing, China) for metabolomics and transcriptomics analyses and the quantitative real-time PCR (qRT-PCR) analysis. The management measures for all bottle seedlings at the test site were consistent.
2.2. Determination of Metabolome
The leaves of A. roxburghii were vacuum freeze-dried and then ground into a powder. A 50 mg sample of the leaves was weighed, and 1000 μL of an extraction solution containing an internal standard (methanol:acetonitrile:water = 2:2:1, internal standard concentration 20 mg/L) was added. The solution was vortex mixed for 30 s, followed by the addition of steel balls and treatment with a 45 Hz grinding instrument (POWTEQ, Beijing Grinder Instrument Co., Ltd., Beijing, China) for 10 min [19]. Subsequently, it underwent ultrasonication for 10 min (in an ice-water bath). The liquid chromatography-mass spectrometry (LC-MS) system for metabolomics analysis is composed of Waters Acquity I-Class PLUS ultra-high performance liquid tandem Waters (Shanghai, China) Xevo G2-XS QTof high-resolution mass spectrometer. The column used is purchased from Waters (Shanghai, China) Acquity ultra-performance liquid chromatography–tandem (UPLC) HSS T3 column (1.8 um 2.1 × 100 mm). The Kyoto Encyclopedia of Genes and Genomes (KEGG) database (http://www.genome.jp/kegg/, accessed on 17 February 2024) was employed to annotate the differential metabolites of A. roxburghii leaves under different light intensities and to screen for target metabolites for analysis.
2.3. Determination of the Transcriptome
Bowtie2 (version 1.3.3) software [20] was used to compare the clean reading with Universal Gene (UniGene) (https://ncbiinsights.ncbi.nlm.nih.gov/tag/unigene/, accessed on 17 February 2024), and RSEM (version 1.3.3) software [21] was used to calculate the gene expression of each sample. Combined with the KEGG annotation results, the genes related to anthocyanin biosynthesis in the transcriptome database were mined. Based on the count value of genes in each sample, differential analysis software was used to screen differentially expressed genes, and the DESeq R software [22] package (1.10.1) was used to analyze the differential expression of the sample group. Genes with adjusted p values < 0.05 found by deseq were designated as differentially expressed. The p-value was corrected by the false discovery rate (FDR). The differential multiple |log2 foldchange| (FC) threshold value ≥ 2 or ≤0.5 and a FDR < 0.01 were selected to further screen the target differentially expressed genes. The data have been registered in the NCBI Sequence Read Archive (SRA) database (https://trace.ncbi.nlm.nih.gov/Traces/sra/, accessed on 22 June 2024) under the GenBank accession numbers SRR29496896, SRR29496895, SRR29496894, SRR29496893, SRR29496892, SRR29496891, SRR29496890, SRR29496889, SRR29496888, SRR29496887, SRR29496886, and SRR29496885. The electropherograms presenting the RNA bands in agarose gels (Figures S1–S9) and the RNA integrity number (Figure S10) were in the Supplementary Materials.
2.4. Joint Analysis of the Transcriptome and Metabolome
Referring to the method of JI. [23], the differential genes and metabolites were annotated on the KEGG synthesis pathway map (http://www.kegg.jp/kegg/pathway.html, accessed on 17 February 2024) of target metabolites for further analysis. The Pearson correlation analysis was performed on the expression of anthocyanin-related differential genes and the quantitative value of the anthocyanin glycoside score using IBM SPSS Statistics 26 (SPSS) software. The results of Pearson’s correlation coefficient (PCC) values > 0.9 and p < 0.05 were selected, and the interaction network diagram was drawn by Cytoscape 3.10.2 software.
2.5. Correlation Analysis between Endogenous Hormones and Genes of Differential Enzymes in the Anthocyanin Biosynthesis Pathway
To further investigate the correlation between the levels of endogenous plant hormones and the expression of differential enzyme genes involved in anthocyanin synthesis pathways, we selected data with a PCC > 0.9 and p < 0.05 for correlation analysis and used Cytoscape 3.10.2 software to construct a corresponding “plant hormone-enzyme gene expression” correlation network [23].
2.6. Correlation Analysis of Endogenous Hormones and Anthocyanin Metabolites in Plants
To investigate the correlation between differential endogenous plant hormones and differential anthocyanin metabolites in A. roxburghii leaves under different light treatments, Pearson correlation coefficients were used to determine the correlation between the relative content of differential metabolites and plant hormones. Based on the threshold value (correlation coefficient PCC > 0.9, p < 0.05), screening was performed, and the “plant hormone-anthocyanin metabolite” correlation network was constructed using Cytoscape 3.10.2 software [24].
2.7. Prediction of Transcription Factors
The transcription factor prediction tool on the PlantTFDB (https://planttfdb.gao-lab.org/, accessed on 17 February 2024) website was used to predict the transcription factors of all gene sequences in A. roxburghii. Then the transcription factor families were classified and statistically analyzed using Excel (Excel 2023) tools. Pearson correlation analysis (correlation coefficient PCC > 0.9, p < 0.05) was used to analyze the transcriptional regulation relationship between transcription factors and enzyme genes [25] and further construct a possible “transcription factor-enzyme gene expression” regulatory network using Cytoscape 3.10.2 software.
2.8. Analysis of Cis-Acting Elements in Transcription Factor Promoters
To analyze the possible regulatory mechanisms of transcription factors associated with anthocyanin glycoside biosynthesis in A. roxburghii leaves in response to phytohormones. The corresponding transcripts were obtained through the Phytozome database (https://phytozome-next.jgi.doe.gov/, accessed on 17 February 2024) to obtain the nucleic acid sequences 2000 bp upstream of the transcription start sites of the corresponding transcription factors. Then the promoter cis-elements of the transcription factors were analyzed by PlantCARE (http://bioinformatics.Psb.ugent.be/webtools/plantcare/html/, accessed on 17 February 2024), and finally, the transcripts were visualized by using the TBtools 2.102 for visual mapping [26].
2.9. Real-Time Quantitative PCR Verification
Six genes—flavonol synthase (FLS-2), chalcone synthase (CHS-3, CHS-4, CHS-7), flavonoid 3′-monooxygenase (F3′H-3), and bifunctional dihydroflavonol 4-reductase (DFR)—and two transcription factors—bHLH130 and ERF066—were validated with qRT-PCR using the RT2 SYBR Green ROX qPCR Mastermix Kit (Qiagen, Beijing, China) and using the Actin gene as the internal reference gene. All the qRT-PCR analyses were performed using the following conditions: denaturation at 95 °C for 3 min, followed by 40 cycles of 95 °C for 10 s, and then at 60 °C for 30 s. All components were configured according to the qPCR reaction system, followed by centrifugation at 6000 rpm for 30 s at 4 °C on a PCR plate centrifuge. Subsequently, the plate was placed in a quantitative PCR instrument for amplification and melt curve analysis (60~95 °C, +1 °C/cycle, holding time 4 s). The relative expression levels of the key enzyme genes and transcription factor genes were calculated using the 2−ΔΔCt method [27], and each gene was subjected to three biological replicates. The base sequences are shown in Table 1. The GenBank accession of the reference gene is JF825424, the amplification and melt curves are shown in the Supplementary Materials (Figures S11–S28).

Table 1.
Primer sequence information of the key enzyme genes and transcription factors validated by qRT-PCR.
3. Results
3.1. Analysis of Metabolomic Differences
3.1.1. Analysis of Differential Anthocyanin Glycoside Metabolites
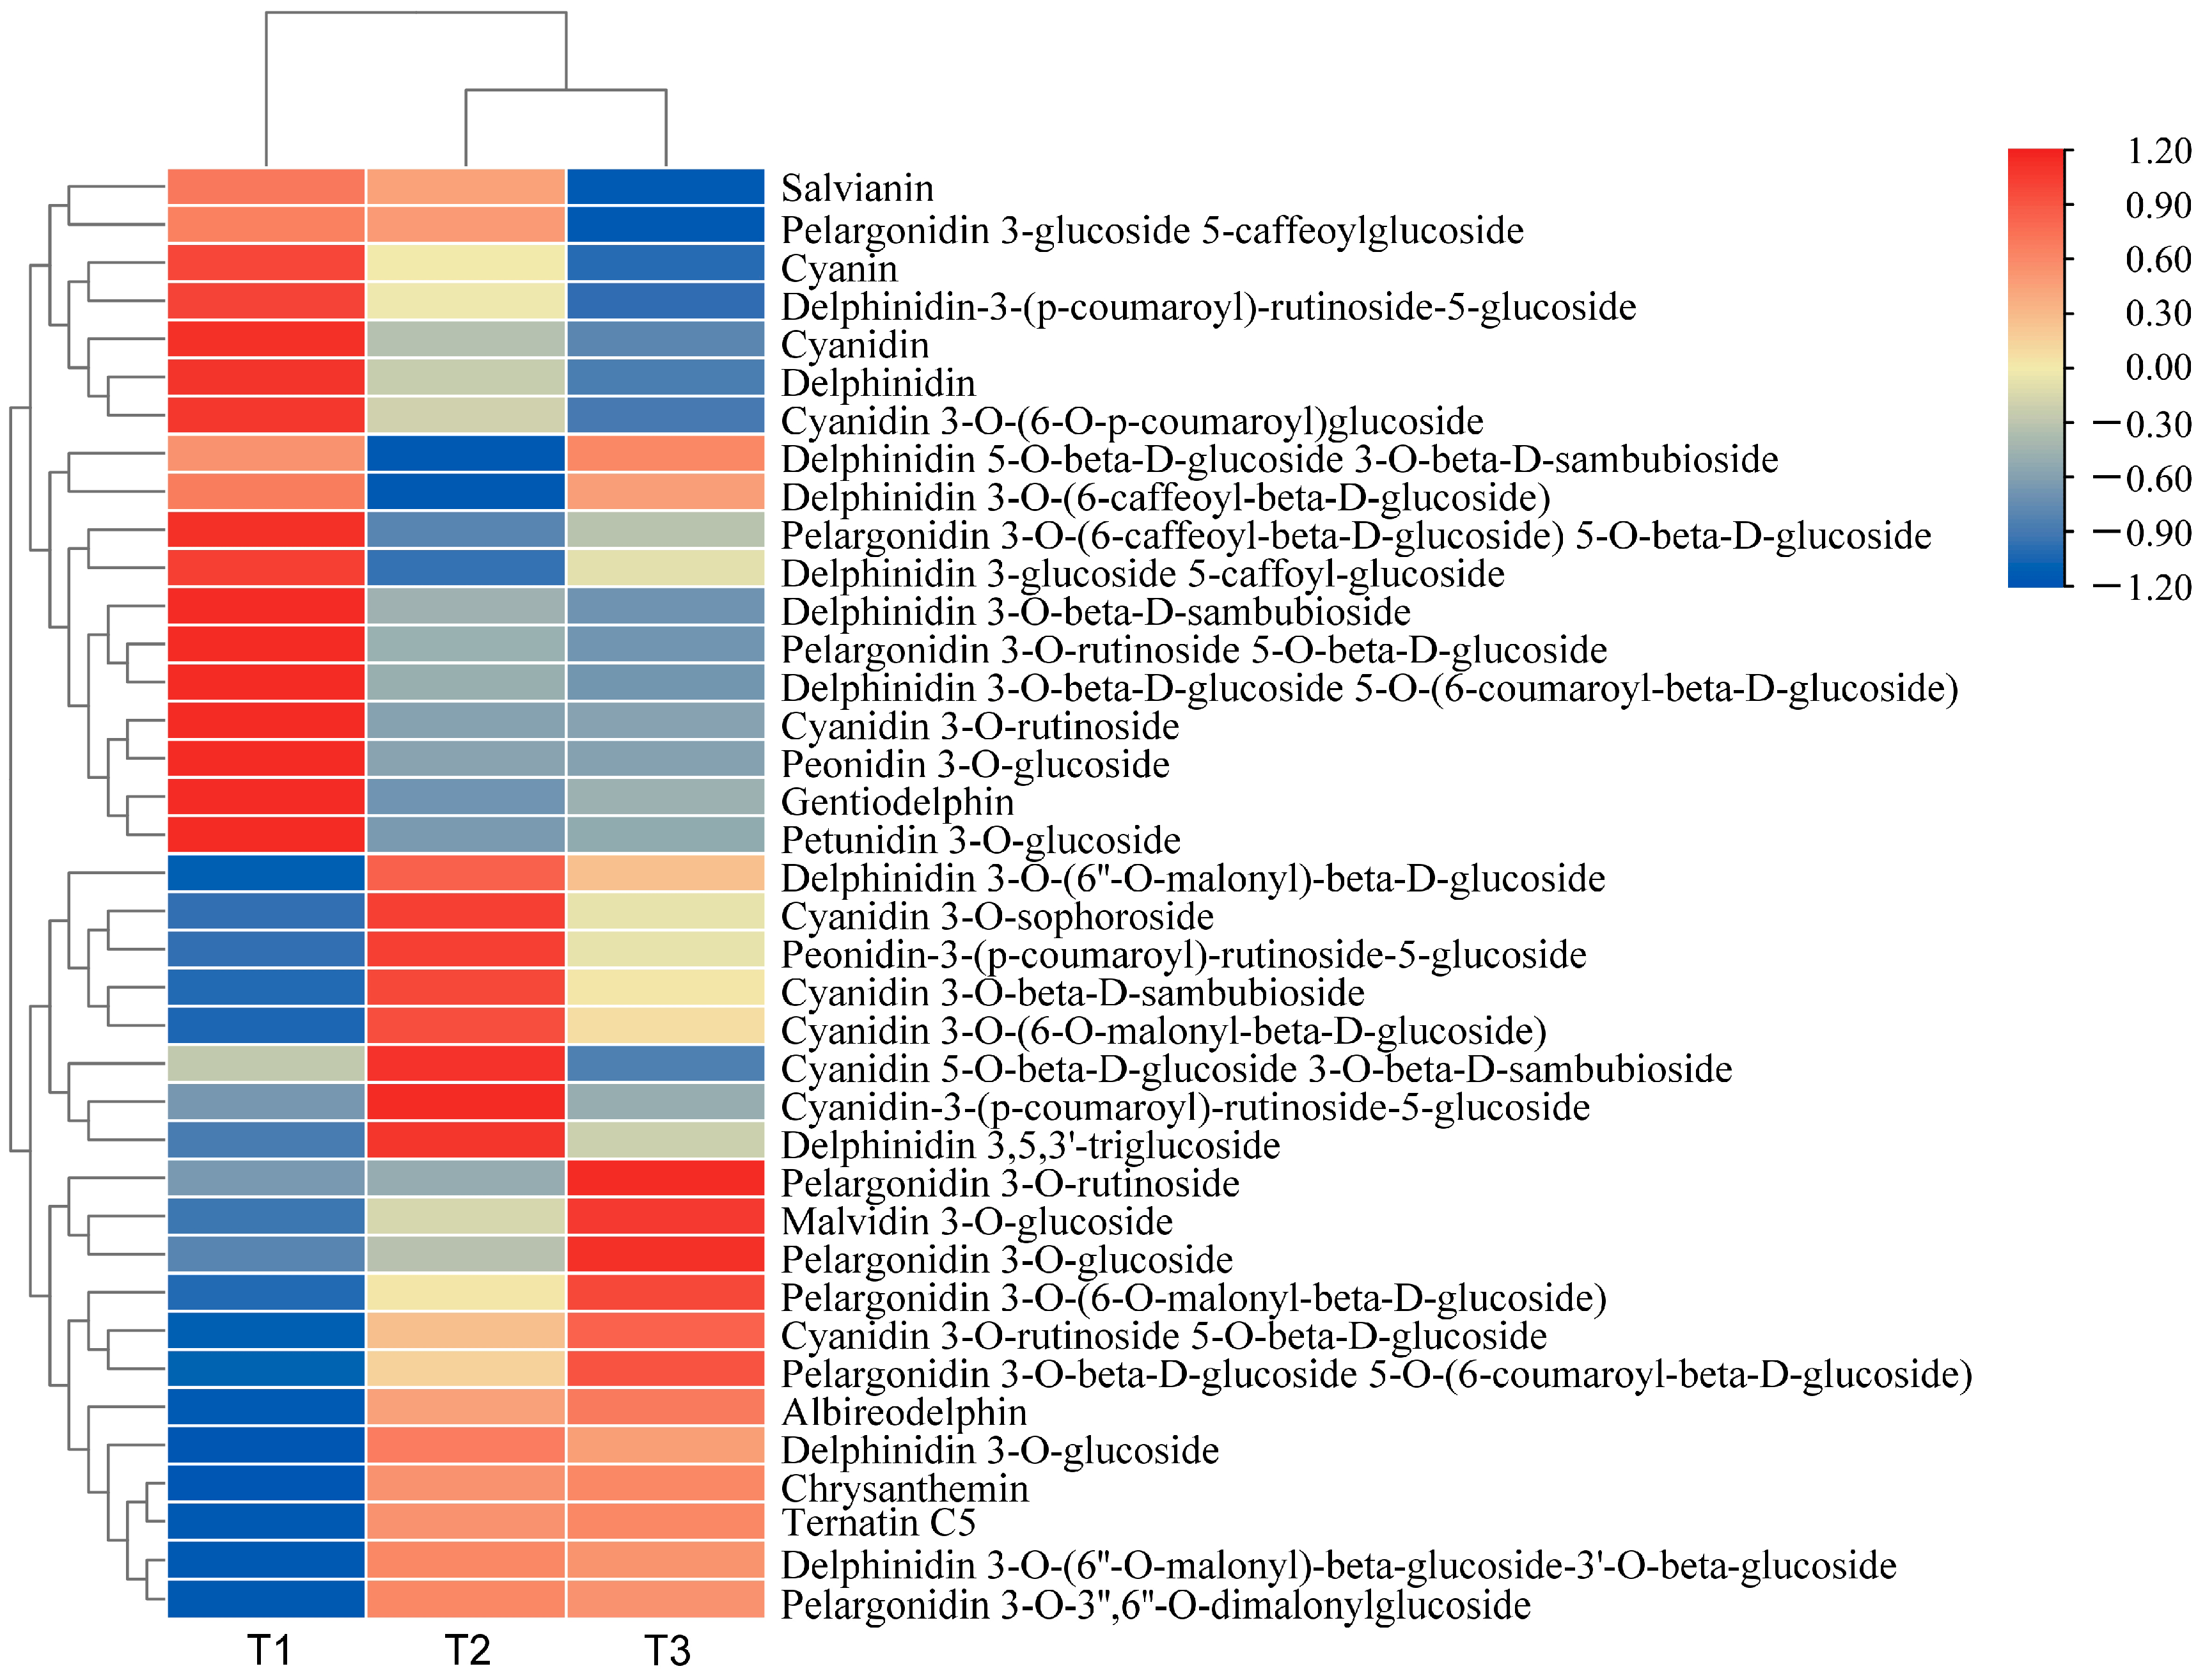
By selecting for variable importance in projection (VIP) ≥ 1, fold change ≥ 2, and fold change ≤ 0.5, differential metabolites related to anthocyanin synthesis were screened. A total of 35 flavonoid-related differential metabolites and 38 differential anthocyanin metabolites were screened. The relative differential anthocyanin glycoside contents were clustered, and a heat map was drawn based on their relative contents (Figure 1). The color block distribution distinguishes A. roxburghii leaves under different light treatments, and the specific differences are shown in Table 2.
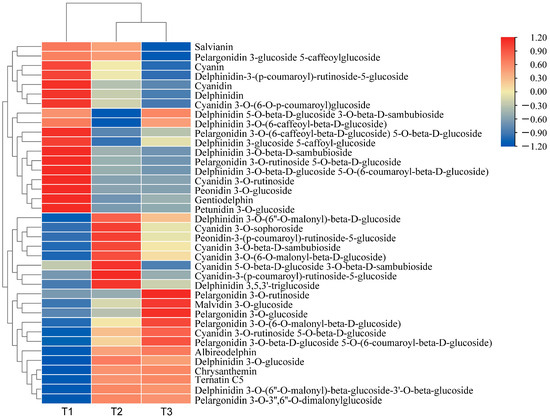
Figure 1.
Heat map of the clustering of differential anthocyanin glycoside metabolites in A. roxburghii (Wall.) Lindl leaves at different light intensities.
Table 2.
Difference of Anthocyanidin glycosides in A. roxburghii leaves under different light treatments.
In the comparison between T1 (with light transmittance of 25%) and T3 (with light transmittance of 75%), a total of 30 distinct anthocyanin metabolites were identified. Among these, 16 metabolites were up-regulated, and 14 were down-regulated. Compared with T1, the content of the 16 metabolites in T3 significantly increased, including pelargonidin 3-O-3″, 6″-O-dimalonylglucoside, chrysanthemin, and delphinidin 3-O-(6″-O-malonyl)-β-D-glucoside. We speculated that delphinidin, cyanidin, and pelargonidin glycosides are the primary metabolites responsible for leaf coloration of the leaves. In T1, delphinidin 3 and 3′-di-glucoside 5-(6-caffeoyl) glucoside were hardly detected, whereas they increased by 37.30 times in T3. This suggests that delphinidin 3 and 3′-di-glucoside 5-(6-caffeoyl) glucoside may be the key metabolites responsible for the color variation in A. roxburghii induced by light.
Between T1 and T2 (with light transmittance of 50%), 34 differential anthocyanin metabolites were identified. Of these, the content of 18 differential metabolites was significantly up-regulated, and the content of 16 was significantly down-regulated. Compared with T1 vs. T3, the contents of peonidin-3-(p-coumaroyl)-rutinoside-5-glucoside, delphinidin 3-O-glucoside, and delphinidin 3,5,3′-triglucoside significantly increased in T1 vs. T2, but there were no significant differences in T1 vs. T3. We speculated that a light transmittance of 50% is more favorable for accumulating these three metabolites.
In the comparison between T2 and T3, 25 differential metabolites were identified, of which 9 were up-regulated and 16 were down-regulated. Compared with the up-regulated metabolites in T1 vs. T3, there were seven down-regulated metabolites in T2 vs. T3, including peonidin-3-p-coumaroyl-rutinoside-5-glucoside and cyanidin-3-(p-coumaroyl)-rutinoside-5-glucoside. We speculated that a certain degree of shading may be more conducive to accumulating these metabolites, while excessively high light intensity may inhibit their synthesis. The content of five metabolites, including malvidin 3-O-glucoside and cyanidin 3-O-rutinoside 5-O-β-d-glucoside, increased across all three comparative groups. We speculated that the increased light intensity may benefit the accumulation of these metabolites.
Compared with the other treatments, the anthocyanin content was higher in T3, and the leaf color was more pronounced. We speculated that accumulating anthocyanins contributes to the vivid appearance of the leaves.
3.1.2. Analysis of Differential Endogenous Hormone Metabolites
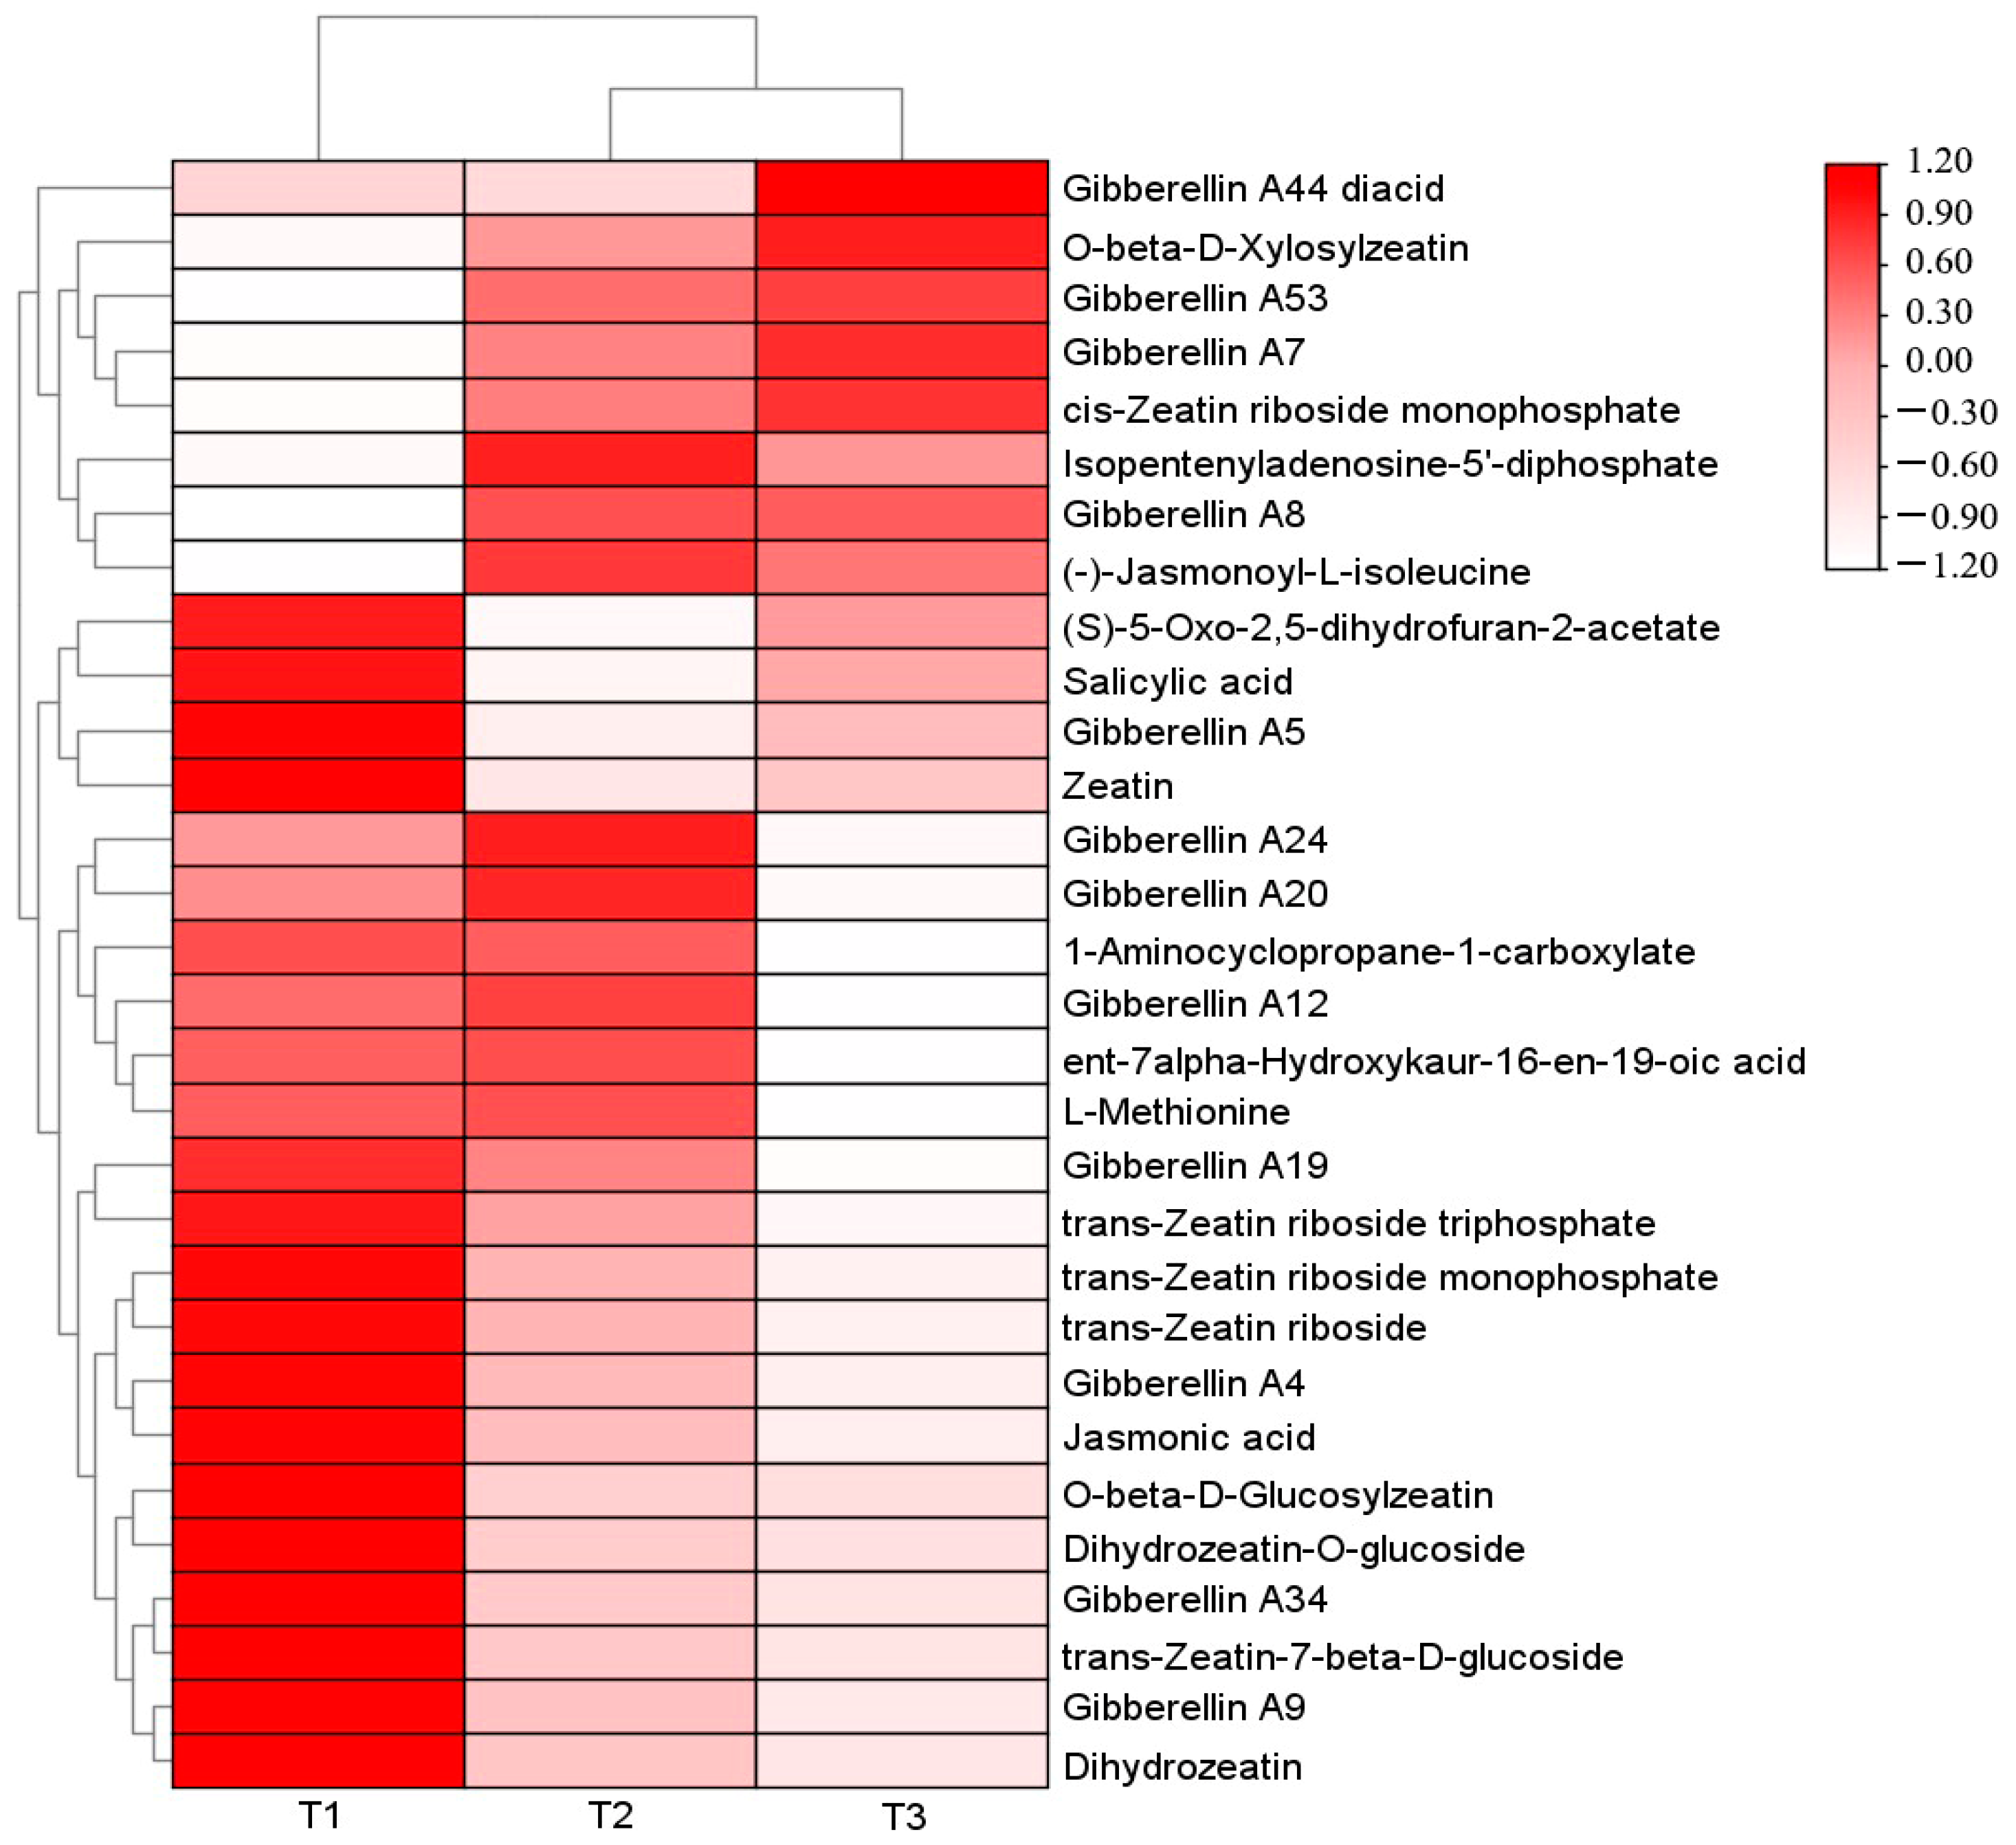
A total of 29 differential metabolites related to plant endogenous hormones were screened among the three comparative groups. Among them, 24 differential metabolites were screened in T1 (with light transmittance of 25%) vs. T2 (with light transmittance of 50%) (8 up-regulated and 16 down-regulated), 22 differential metabolites were screened in T2 vs. T3 (with light transmittance of 75%) (7 up-regulated and 15 down-regulated), and 27 differential metabolites were screened in T1 vs. T3 (7 up-regulated and 20 down-regulated). A heat map was drawn based on their relative content (Figure 2).
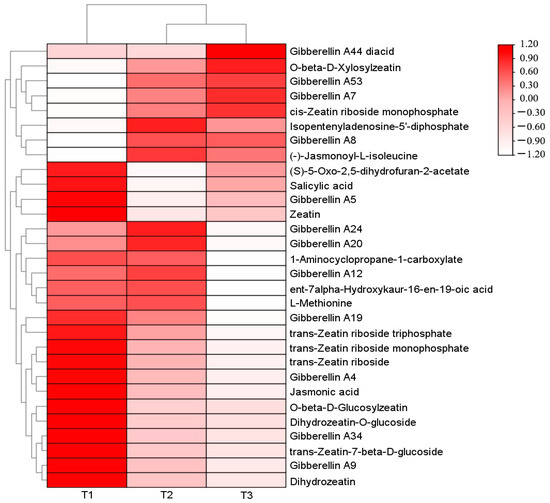
Figure 2.
Heat map of clustering of different phytohormone metabolites in A. roxburghii leaves under different light intensities.
A total of 13 differential metabolites were screened during the synthesis of gibberellins (GA), including 11 types of GA, with the exception of Gibberellin A7 (GA7), Gibberellin A53 (GA53), Gibberellin A8 (GA8), and Gibberellin A44 (GA44) diacid (the precursor substance of GA), which had the highest content under T3 treatment (with light transmittance of 75%). The content of the other identified GA metabolites was higher under T1 treatment than T3. A total of one differential metabolite was screened during the synthesis of salicylic acid (SA), with the highest content under T1 treatment and the lowest content under T3 treatment. A total of 11 different metabolites were screened in the synthesis pathway of zeatin (ZT), among which O-β-d-xylosylzeatin, isopentenyladenosine-5′-diphosphate, and cis-zeatin ribose side monophosphate had the highest content in T3, and other zeatin-related metabolites had the highest content in T1. On the synthesis pathways of jasmonic acid (JA) and ethylene (ETH), two differential metabolites were screened, and their content showed a downward trend with the increase in light intensity. The specific metabolite profile is shown in Table 3.
Table 3.
Differences in hormone metabolites in A. roxburghii leaves under different light treatments.
3.2. Transcriptome Differential Gene Expression Analysis
To study the expression of enzymes related to the anthocyanin synthesis pathway in A. roxburghii leaves under different light intensities, the genes related to flavonoid biosynthesis and the anthocyanin synthesis pathway were screened, in total, 66 flavonoid biosynthesis-related sequences and 2 anthocyanin synthesis-related sequences were annotated. With a fold change ≥ 2 and a false discovery rate (FDR) < 0.01 as the criteria, further differential screening of anthocyanin synthesis-related genes in A. roxburghii leaves under different light intensities was performed, showing that these genes were differentially expressed only in the flavonoid synthesis pathway.
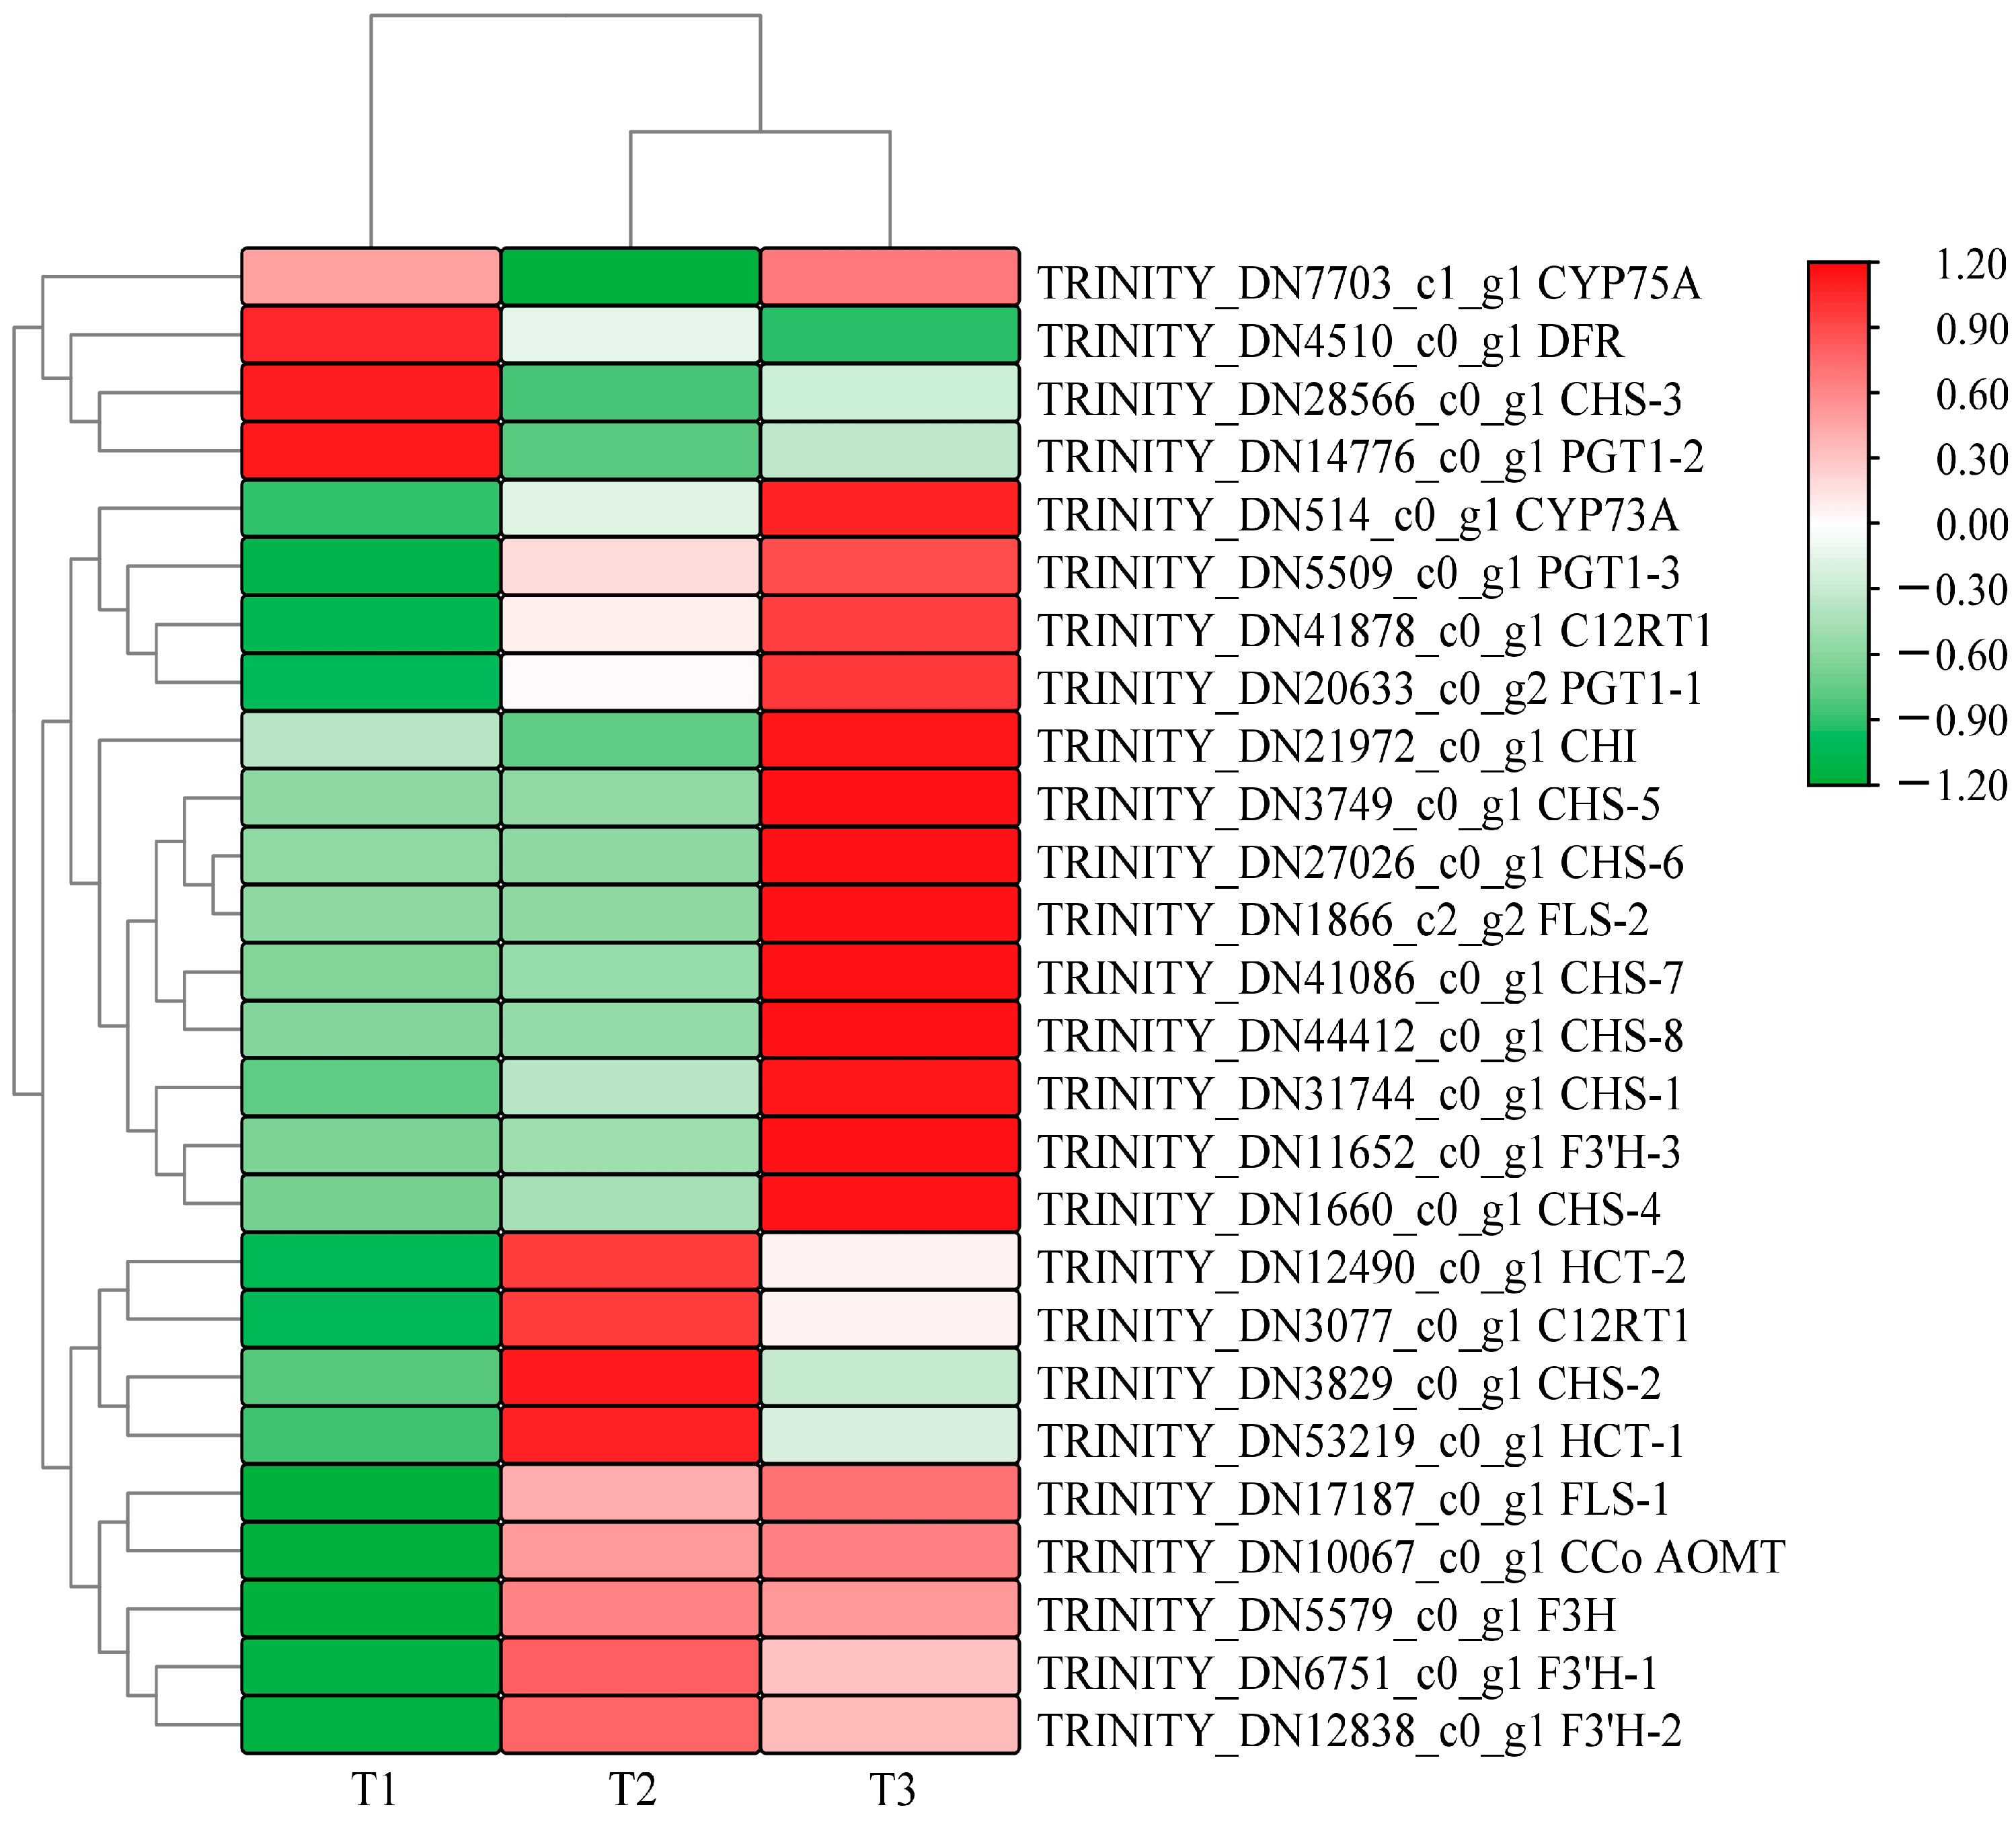
Figure 3 shows that A. roxburghii leaves treated with different light intensities can be distinguished by their color block distribution. Many highly expressed genes were enriched in the T2 (with light transmittance of 50%) and T3 treatments (with light transmittance of 75%), but most genes had relatively low expression levels in the T1 treatment (with light transmittance of 25%). A total of 26 differentially expressed sequences for flavonoid biosynthesis were obtained under different light intensities: 14 existed in T1 vs. T2, 12 existed in T2 vs. T3, and 19 existed in T1 vs. T3. The specific differences are shown in Table 4, Table 5 and Table 6. In the upstream pathway of flavonoid/anthocyanin biosynthesis, some differentially expressed genes were identified in the comparisons of T1 vs. T2, T2 vs. T3, and T1 vs. T3, including chalcone synthase (CHS), chalcone isomerase (CHI), flavanone-3-hydroxylase (F3H), flavonol synthase (FLS), etc. In the three comparison groups, several genes had their highest expression levels in T3, including one FLS gene, six CHS genes, and one flavonoid 3′-monooxygenase (F3′H-3) gene, indicating that increased light intensity comprehensively promoted the overall metabolism of flavonoids in leaves.

Figure 3.
Heat map of clustering of differential genes related to anthocyanins glycoside synthesis in A. roxburghii leaves at different light intensities.
Table 4.
T1 vs. T2 differential Anthocyanidin glycosidase gene.
Table 5.
T2 vs. T3 differential Anthocyanidin glycosidase gene.
Table 6.
T1 vs. T3 differential Anthocyanidin glycosidase gene.
Compared with T1, F3H (TRINITY_DN5579_c0_g1), FLS (TRINITY_DN17187_c0_g1), F3′H (TRINITY_DN12838_c0_g1), PGT1 (TRINITY_DN20633_c0_g2), CCo AOMT (TRINITY_DN10067_c0_g1), and CYP75B1 (TRINITY_DN6751_c0_g1) showed higher gene expression levels in T3 and T2 treatments, but the differences were not significant in T2 vs. T3. CHS (TRINITY_DN31744_c0_g1 and TRINITY_DN1660_c0_g1) was significantly up-regulated in the three comparison groups. Notably, the transcription levels of F3′H-3 (TRINITY_DN12838_c0_g1, TRINITY_DN11652_c0_g1) were significantly higher than the expression levels of other structural genes in the whole anthocyanin synthesis pathway. These results suggest that CHS, F3′H, and FLS may be the key genes regulating the metabolism of flavonoids and anthocyanins in A. roxburghii leaves in response to light intensity.
3.3. Combined Analysis of Transcriptome and Metabolome
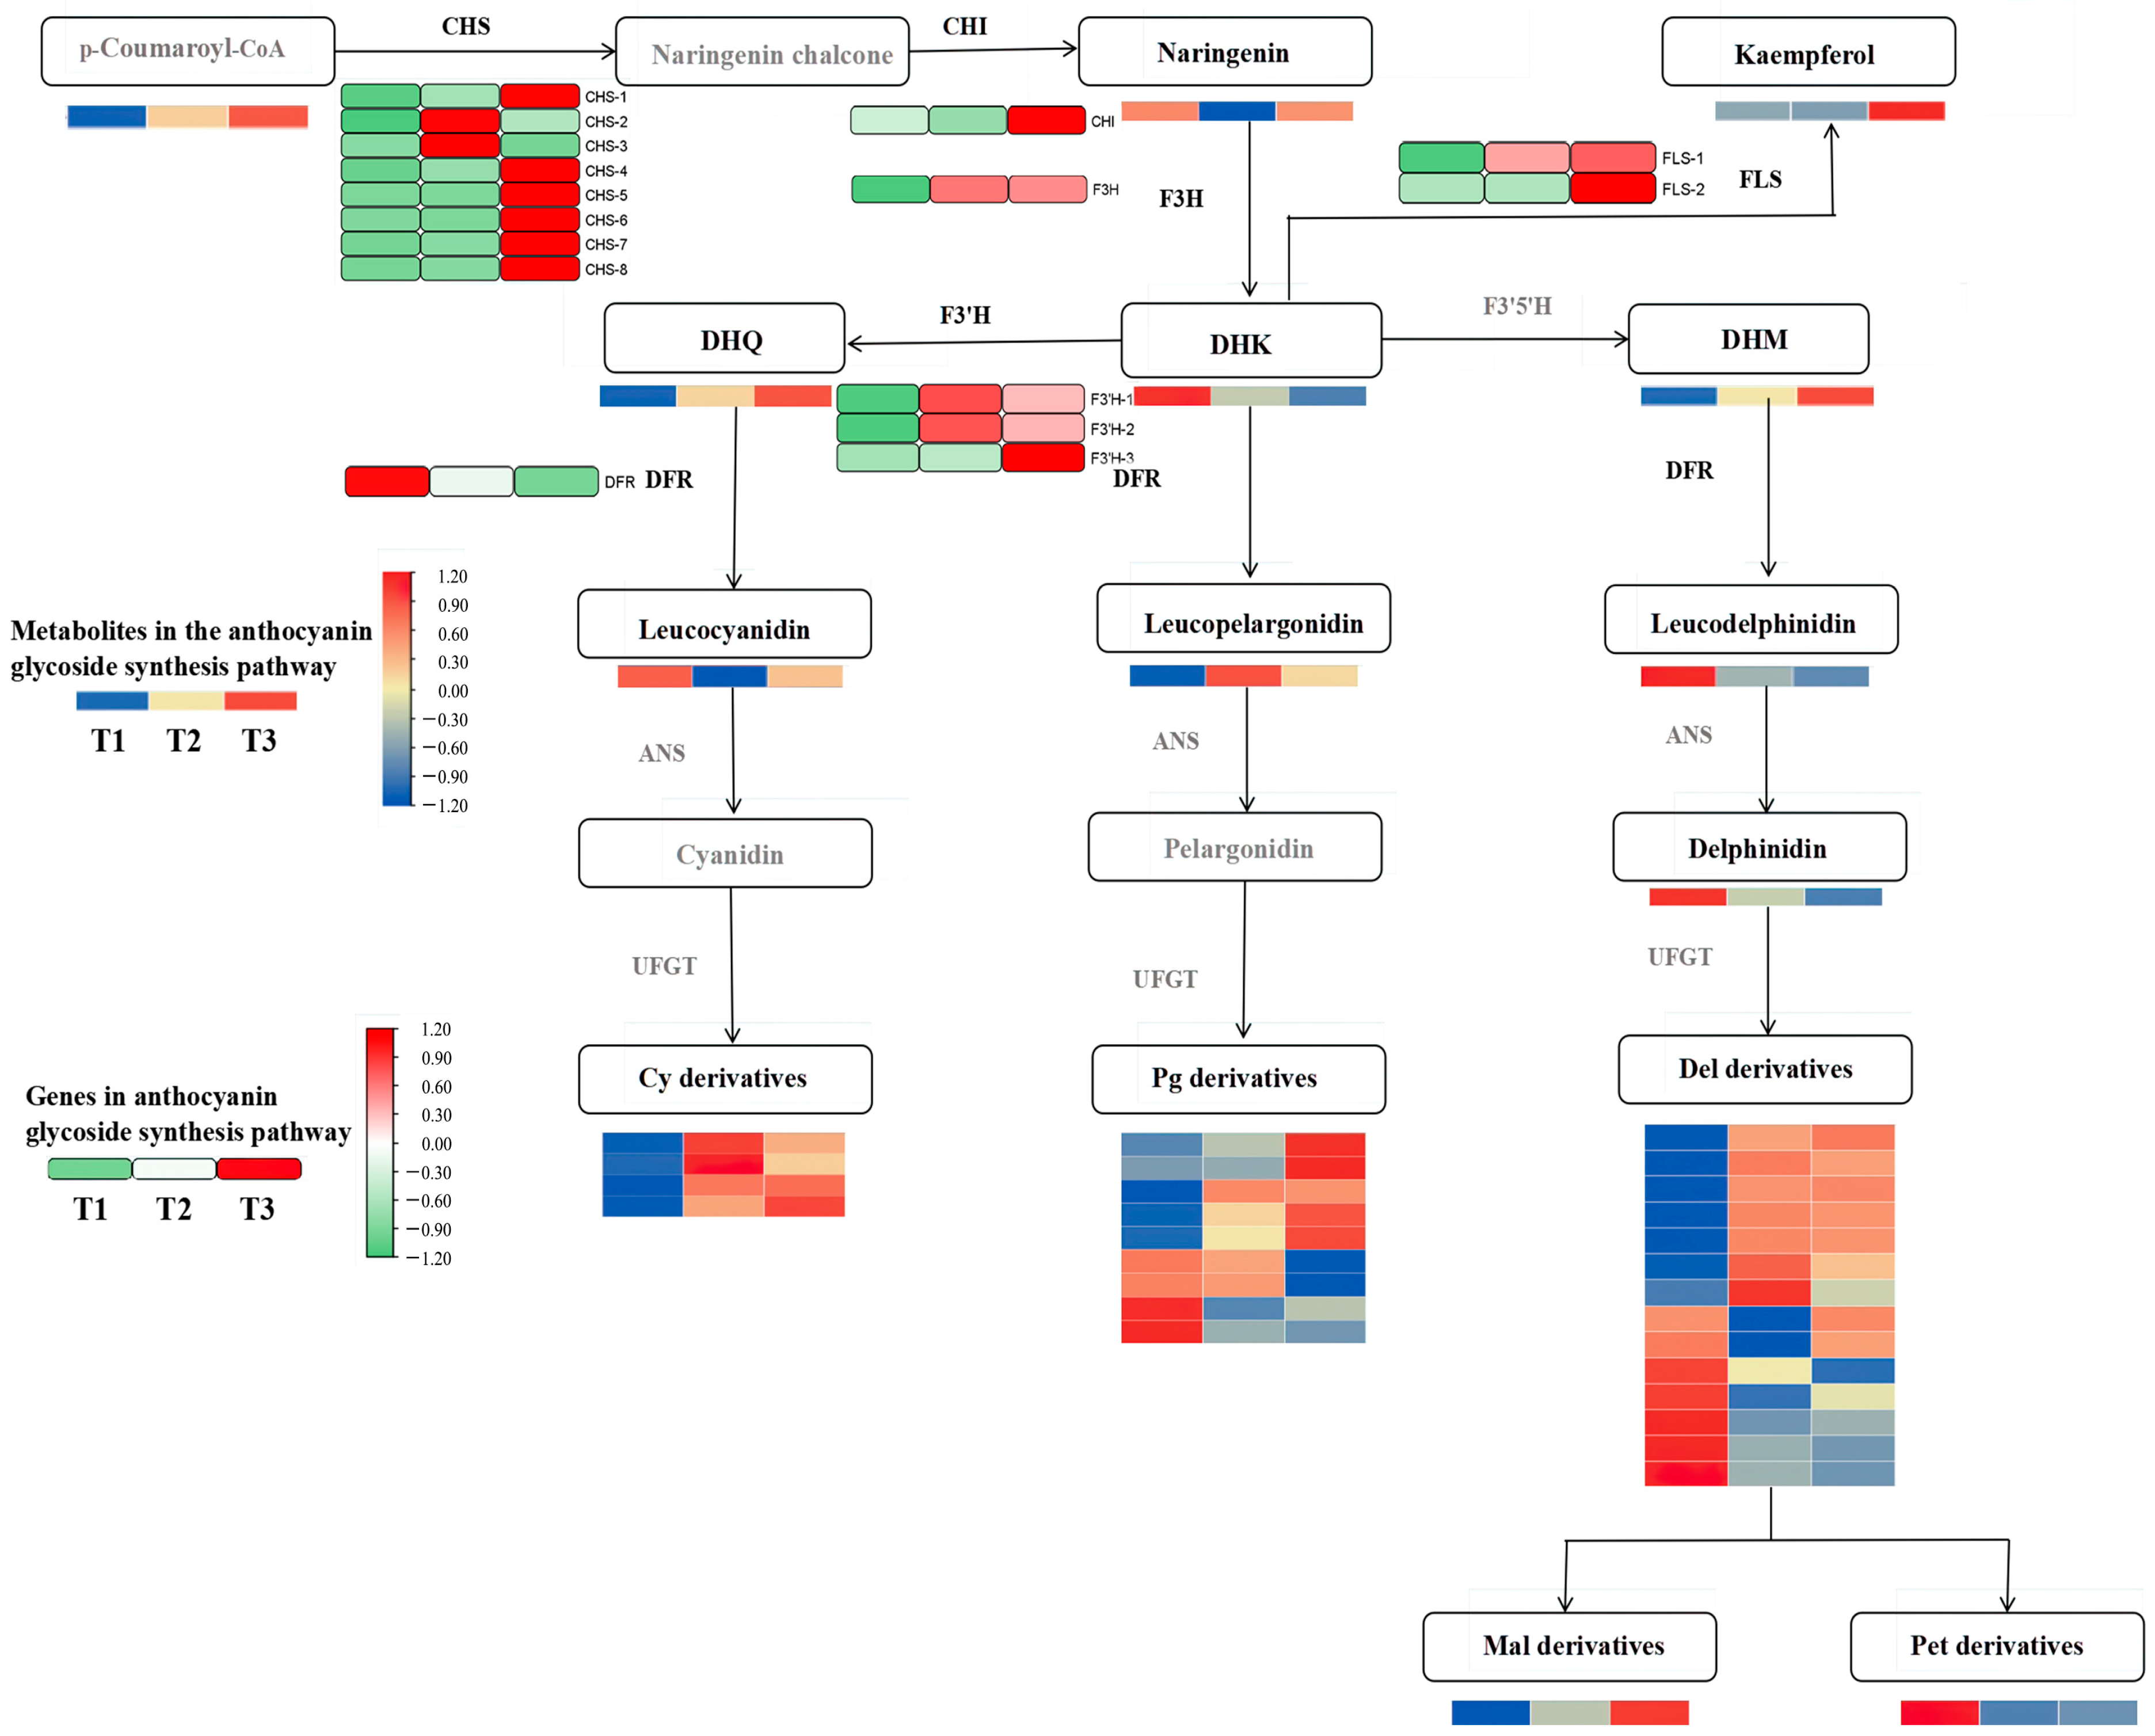
Differential metabolites and genes were jointly mapped onto the anthocyanin pathway. Figure 4 shows that the contents of dihydroquercetin, cyanidin 3-glucoside, delphinidin 3-glucoside, and pelargonidin 3-glucoside were significantly up-regulated in the flavonoid synthesis pathway. Notably, the pelargonidin 3-glucoside content was significantly higher than in other metabolites.
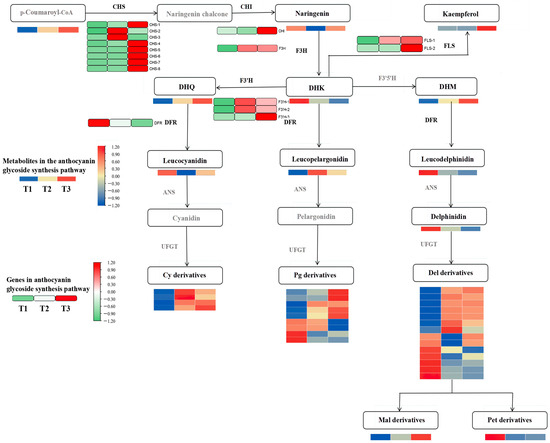
Figure 4.
Conjoint analysis of transcriptome metabolism of anthocyanins in A. roxburghii leaves under different light intensities.
The differentially expressed genes encoded by the key enzymes in the anthocyanin synthesis pathway, including chalcone synthase (CHS), flavonol synthase (FLS), flavonoid 3-hydroxylase (F3H and F3′H), and bifunctional dihydroflavonol 4-reductase (DFR), are associated with the production of metabolic products and catalyze the synthesis of flavonoids and anthocyanins in the phenylpropane pathway. CHS is the initial gene in the upstream pathway of flavonoid synthesis and plays a significant role in the overall content of anthocyanins. Apart from CHS-2 and CHS-3, most of the other CHS genes, as well as the chalcone isomerase (CHI) gene, exhibited the most significant expression levels in the T3 treatment (with light transmittance of 75%), which catalyzed the formation of naringenin chalcone from p-coumaroyl-CoA, leading to naringenin synthesis. F3H is the first key gene in the pelargonidin synthesis pathway and showed a significantly higher expression level in T3 than in T1 (with light transmittance of 25%). This may explain why pelargonidin 3-glucoside content increases with increasing light intensity. The F3H gene catalyzes the formation of naringenin into dihydrokaempferol. Notably, the dihydrokaempferol content was the lowest in T3, which was inconsistent with the expression of the F3H gene. This discrepancy could be attributed to the significant expression of the FLS and F3′H genes in T3. FLS further catalyzes dihydrokaempferol to synthesize other flavonol compounds, and the F3′H catalyzes dihydrokaempferol to form dihydroquercetin.
The content of leucoanthocyanins—precursors for anthocyanin synthesis—was jointly regulated by FLS and DFR. FLS and DFR competed for dihydroflavonol substrates. The expression level of the DFR gene was highest in the T1 treatment and lowest in the T3 treatment, and we speculated that its catalytic capacity for dihydroflavonol substrates diminished in T3, which was negatively correlated with the pattern of anthocyanin glycoside accumulation. In T3, the expression of FLS genes reversed, with their catalytic capacity for dihydroflavonols increasing with an increase in light intensity. The F3′H genes are pivotal in the anthocyanin synthesis pathway, and they displayed elevated expression levels in response to increasing light intensity. Particularly, the expression of F3′H-3 genes was the most significant, mirroring the accumulation patterns of delphinidin and cyanidin glycosides in A. roxburghii leaves under the T3 treatment.
In general, the highest anthocyanin content in A. roxburghii leaves under the T3 treatment may primarily stem from the regulatory role of the CHS gene upstream of flavonoid synthesis. CHS gene expression was significantly up-regulated under the T3 treatment, and many flavonoid compounds were synthesized, further increasing the anthocyanin content in the leaves. Genes closely related to flavonoid synthesis and anthocyanin metabolism downstream include FLS-1, FLS-2, F3′H-3, and DFR. Even though the gene expression of DFR and FLS negatively affected anthocyanin synthesis, the total anthocyanin content in leaves under the T3 treatment was still significantly higher than under the T1 treatment because dihydroflavonol substrate content was significantly higher than under the T1 treatment.
3.4. Correlation between Hormone Levels and Transcript Abundance of Anthocyanin Biosynthesis in A. roxburghii
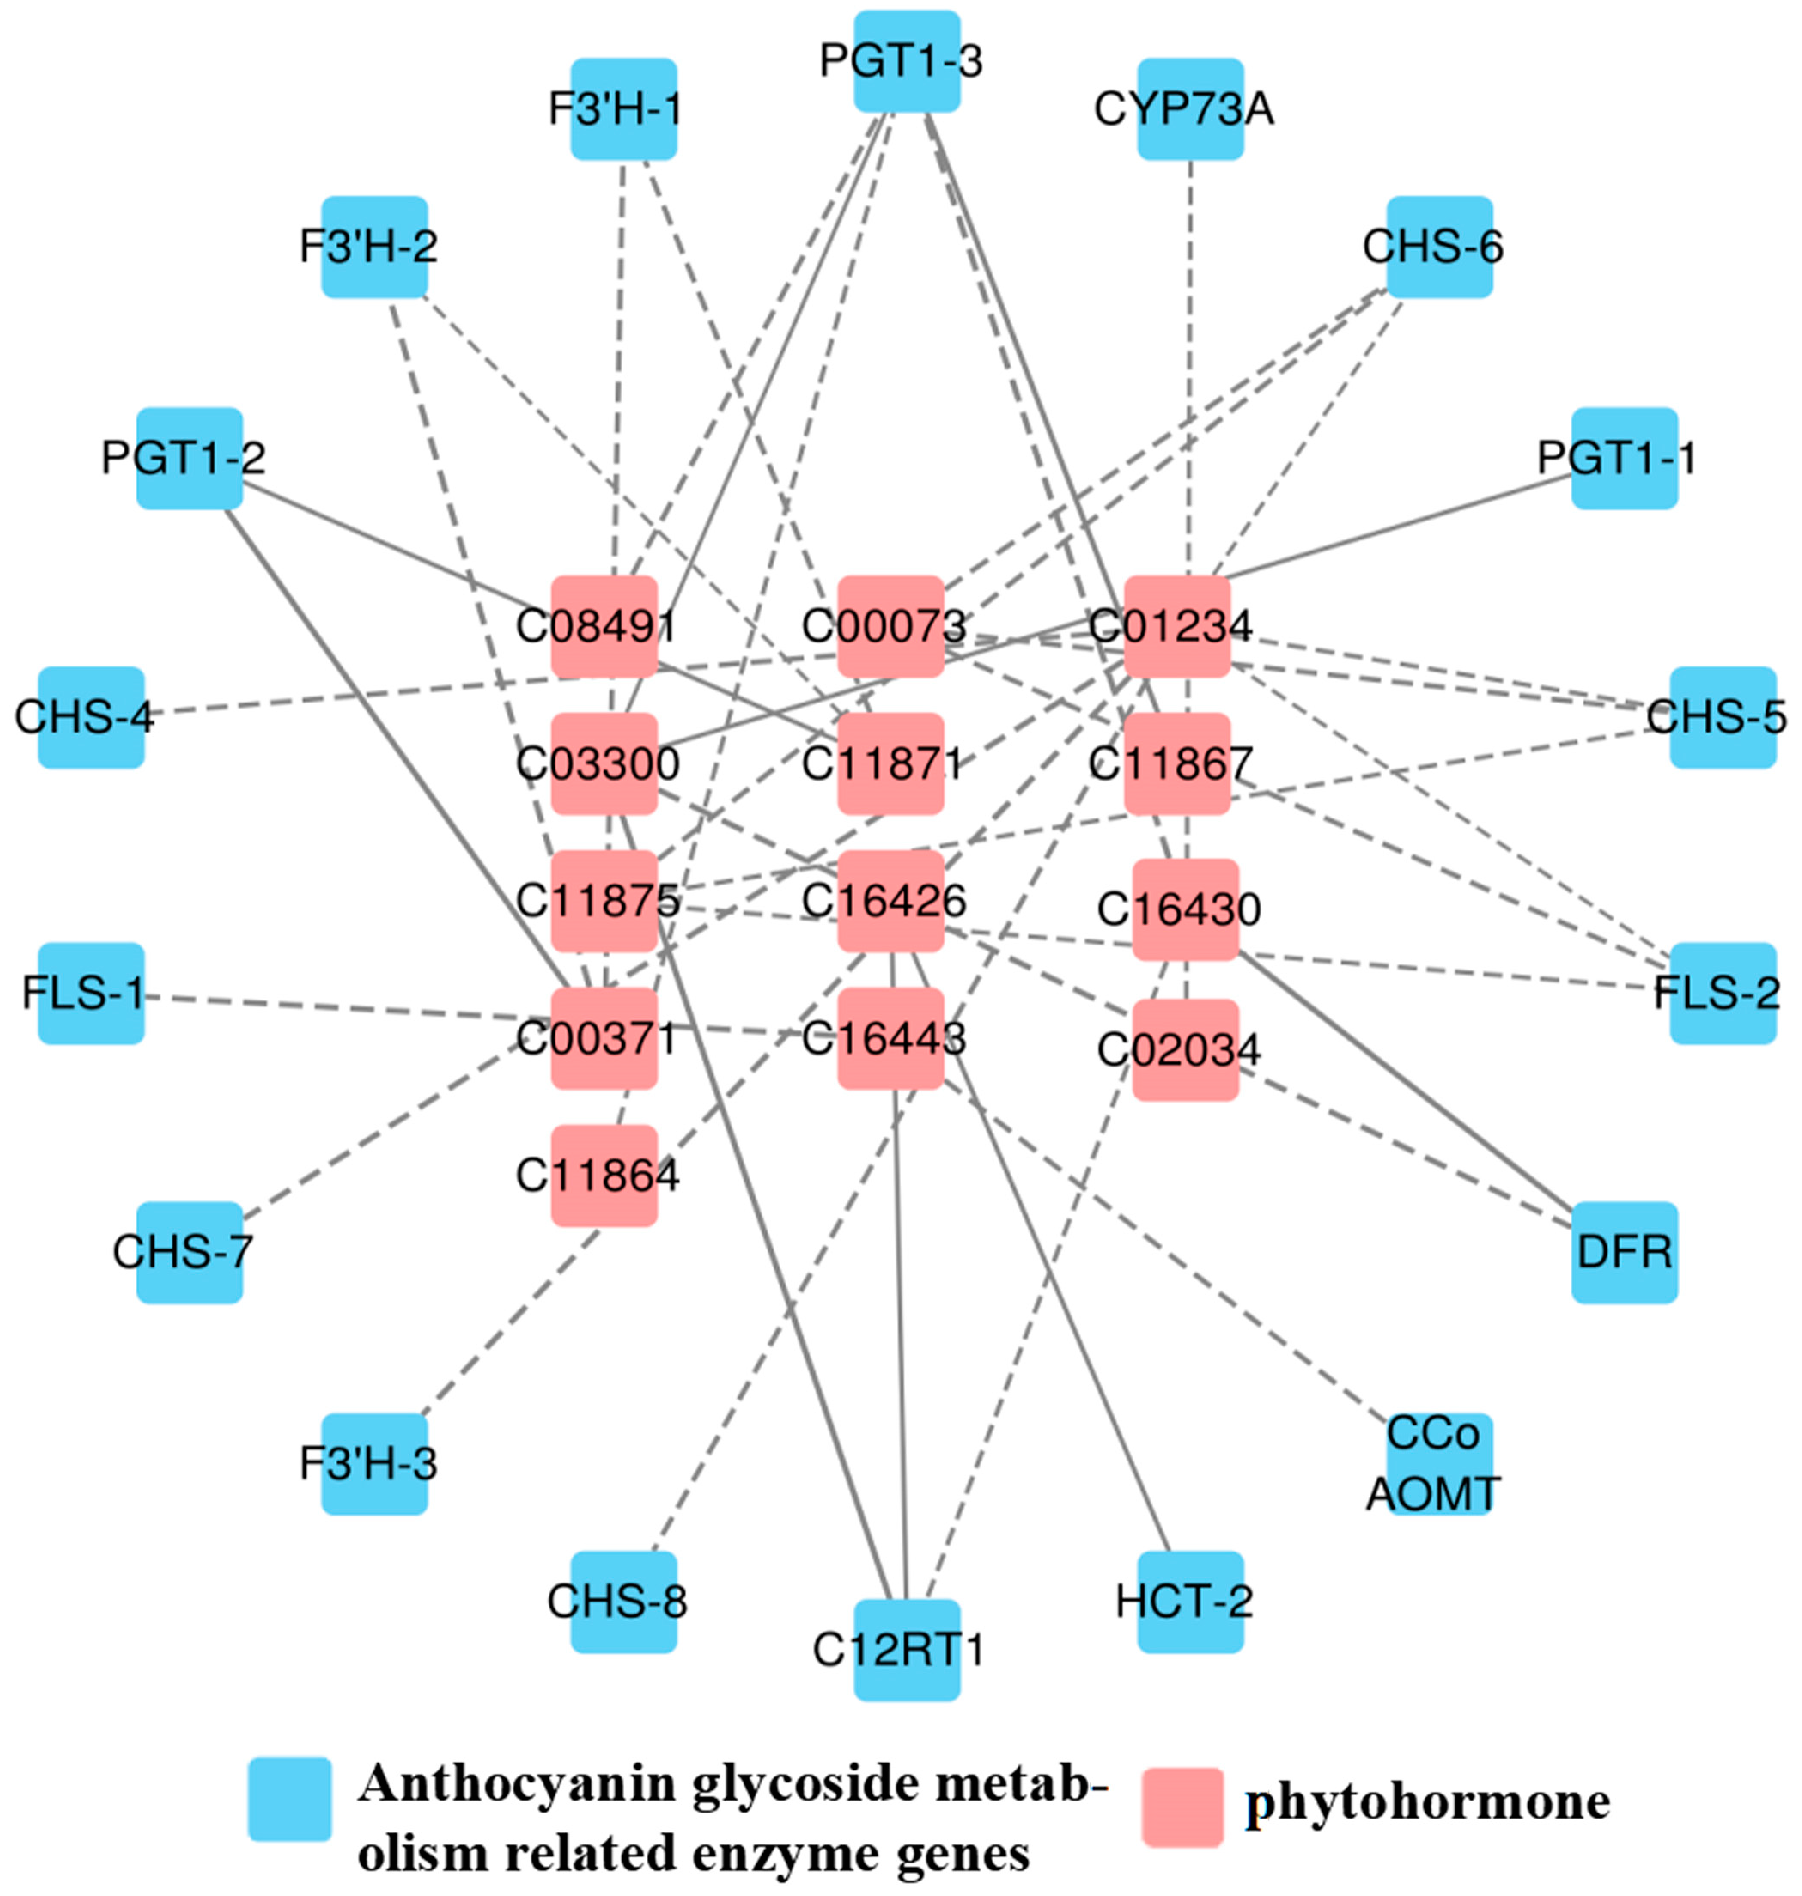
As shown in Figure 5, a total of 13 differential hormones and 18 anthocyanin differential genes were associated, including 2 flavonol synthase (FLS) genes, 1 trans-cinnamate 4-monooxygenase (CYP73A) gene, 3 phlorizin synthase (PGT1) genes, 3 flavonoid 3′-monooxygenase (F3′H) genes, 5 chalcone synthase (CHS) genes, 1 flavanone 7-O-glucoside 2″-O-β-L-rhamnosyltransferase (C12RT1) gene, 1 shikimate O-hydroxycinnamoyltransferase (HCT) gene, 1 caffeoyl-CoA O-methyltransferase (CCo AOMT) gene, and 1 bifunctional dihydroflavonol 4-reductase (DFR) gene.

Figure 5.
Correlation network of “phytohormone–anthocyanin glycoside genes” in A. roxburghii leaves at different light intensities. The solid line indicates positive regulation, the dashed line indicates negative regulation, and the thicker the line, the stronger the correlation of regulation.
In the 34 generated correlation analyses, 25 showed negative coefficients of correlation, while the rest were positive. Among these, genes such as Gibberellin A7 (GA7), Gibberellin A5 (GA5), O-β-d-xylosylzeatin, and PGT1 genes exhibited positive correlations; the trans-zeatin riboside monophosphate and DFR showed a positive correlation; Isopentenyladenosine-5′-diphosphate was positively correlated with C12RT1 and HCT; and O-β-d-xylosylzeatin demonstrated a positive correlation with C12RT1. Otherwise, all other correlation coefficients indicated negative correlations, among which 1-aminocyclopropane-1-carboxylate (ACC) and F3′H-3 exhibit a strong negative correlation, as shown in Table 7.
Table 7.
Correlation between differential hormone and differential Anthocyanidin glycosidase Gene.
3.5. Correlation between Hormone Levels and Anthocyanin Glycoside Metabolite Content in A. roxburghii
As shown in Figure 6, a total of 11 hormones were correlated with 10 anthocyanin glycosides and 3 flavonoid glycosides. Among these, Gibberellin A7 (GA7) was negatively correlated with delphinidin, dihydrokaempferol, and two cyanidin glycosides; Gibberellin A9 (GA9) was positively correlated with cyanidin; and Gibberellin A4 (GA4) was negatively correlated with cyanidin 3-O-rutinoside 5-O-β-d-glucoside and positively correlated with dihydrokaempferol. trans-zeatin-7-β-d-glucoside was negatively correlated with delphinidin 3-O-β-d-glucoside 5-O-(6-coumaroyl-β-d-glucoside) and positively correlated with delphinidin 3-O-β-d-sambubioside; trans-zeatin riboside monophosphate was negatively correlated with pelargonidin 3-O-β-d-glucoside 5-O-(6-coumaroyl-β-d-glucoside) and dihydroquercetin. 1-aminocyclopropane-1-carboxylate (ACC) was negatively correlated with pelargonidin 3-O-β-d-glucoside 5-O-(6-coumaroyl-β-d-glucoside), isopentenyladenosine-5′-diphosphate was positively correlated with leucocyanidin, jasmonic acid was positively correlated with delphinidin. The specific correlation coefficients are presented in Table 8.
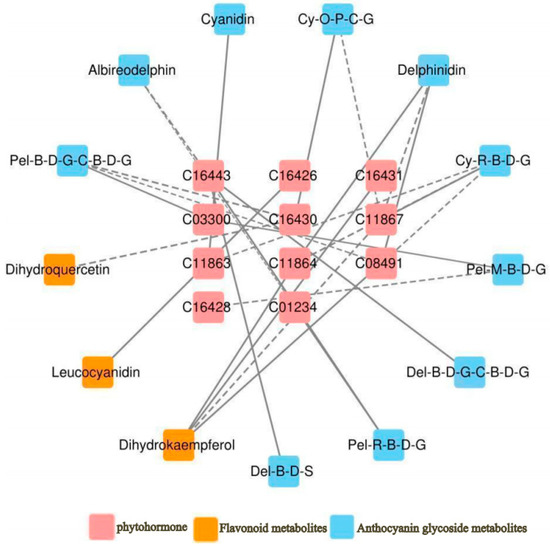
Figure 6.
Correlation network of “phytohormone–anthocyanidin glycoside–related metabolites” in A. roxburghii leaves at different light intensities. The solid line indicates positive regulation, the dashed line indicates negative regulation, and the thicker the line, the stronger the correlation of regulation.
Table 8.
Correlation between differential hormone metabolites and differential Anthocyanidin glycoside-related metabolites.
3.6. Prediction and Analysis of the Regulatory Relationship between Endogenous Plant Hormones and Anthocyanin Metabolite Biosynthesis Enzyme Genes in A. roxburghii Using Transcription Factors
In the transcriptome data of A. roxburghii leaves treated with different light intensities, 1422 genes were predicted to encode 55 transcription factor families. The top 10 transcription factor families were MYB_related (33), FAR1 (32), ERF (32), C2H2 (32), bHLH (28), NAC (25), GRAS (21), bZIP (19), WRKY (17), and Dof (15). The results are shown in Table 9.
Table 9.
Transcription factor families with current 10 gene numbers.
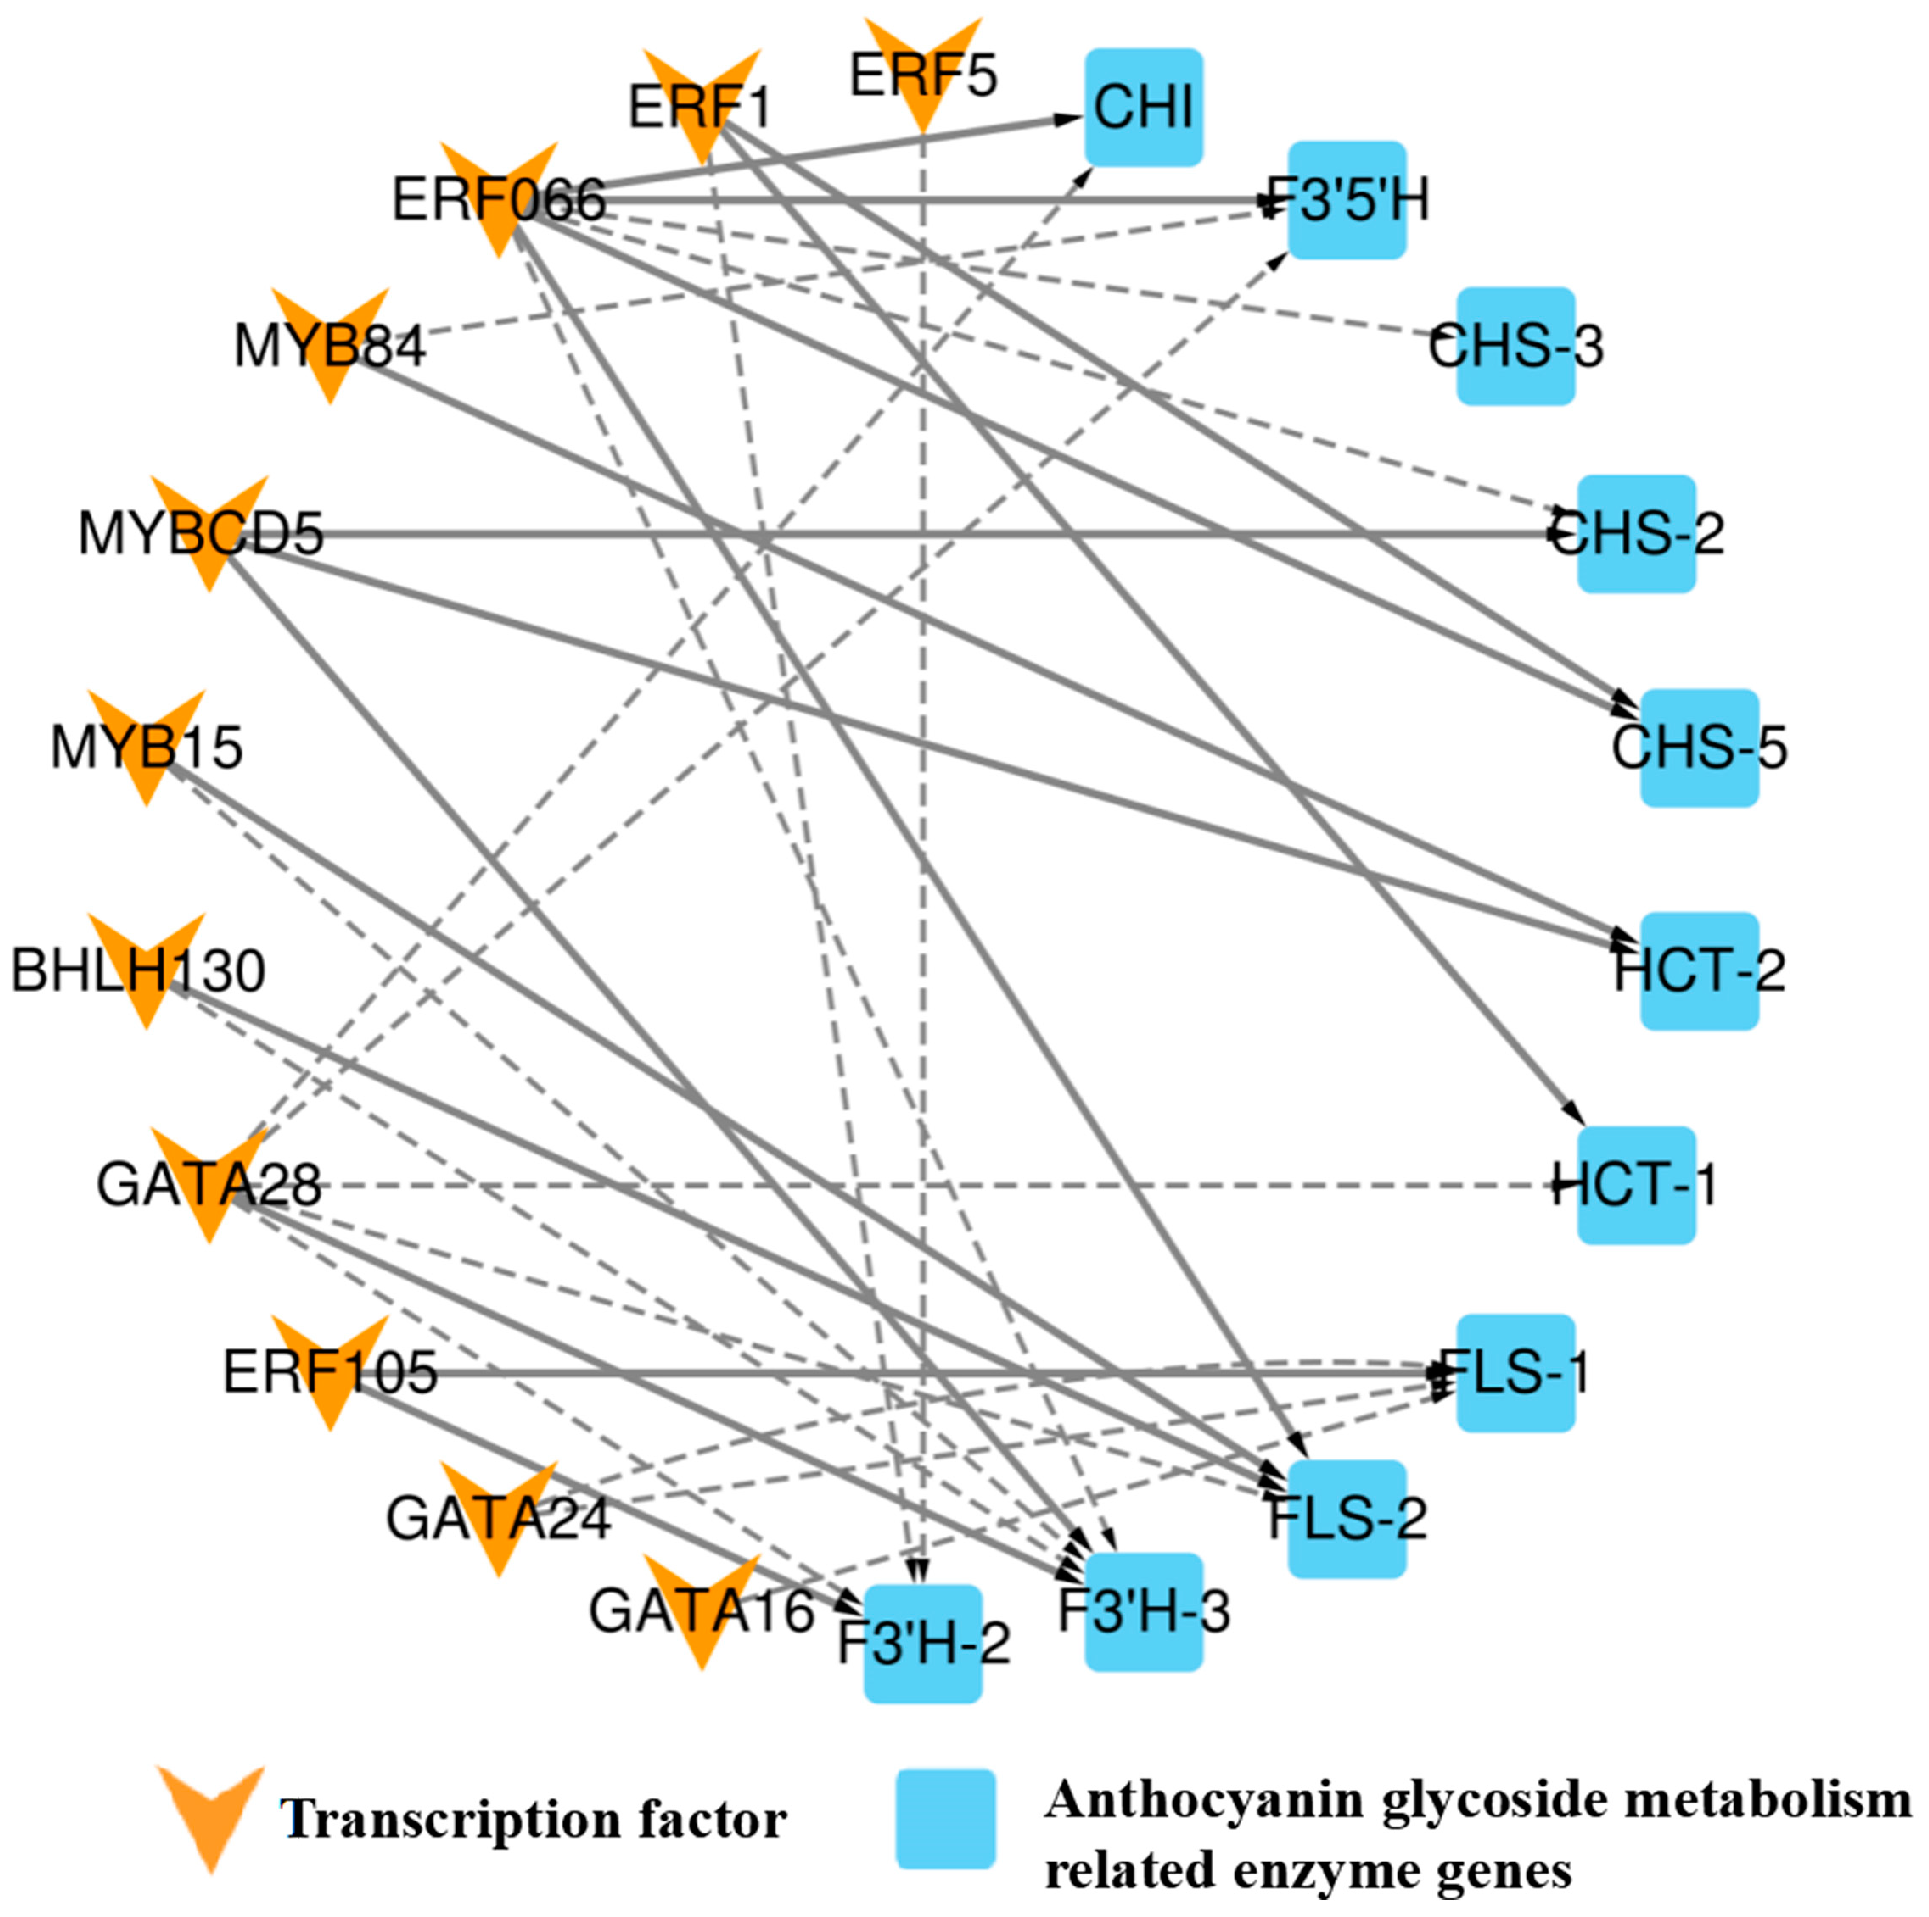
To further investigate the key transcription factors involved in regulating anthocyanin metabolism in A. roxburghii leaves under various light-intensity treatments, we employed Pearson correlation analysis to identify data with a correlation coefficient greater than 90% between the transcription factors and enzyme genes. In conjunction with the PlantTFDB database, we conducted regulation predictions for the six transcription factor families, MYB, bHLH, GATA, ERF, TCP, and bZIP, and constructed a regulatory network diagram for “transcription factor–enzyme gene expression”. Figure 7 shows the regulatory relationship between 13 transcription factors and 7 enzymes.
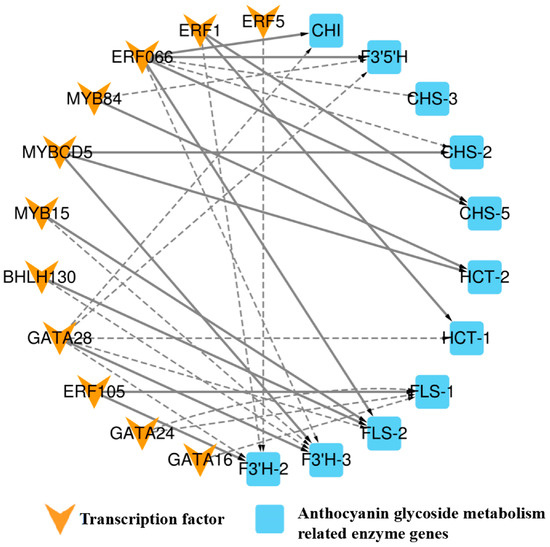
Figure 7.
Regulatory network diagram of “transcription factor–anthocyanin metabolism-related enzyme gene expression” in A. roxburghii leaves under different light intensities. The solid line indicates positive regulation, the dashed line indicates negative regulation, and the thicker the line, the stronger the correlation of regulation.
The figure shows that BHLH30 positively regulated flavonol synthase (FLS-2) and negatively regulated the flavonoid 3′-monooxygenase (F3′H-3) enzyme gene. MYBCD5 was involved in positively regulating the F3′H-3, shikimate O-hydroxycinnamoyltransferase (HCT-2), and chalcone synthase (CHS-2) enzyme genes, while MYB15 negatively regulated F3′H-3 and positively regulated the FLS-2 enzyme gene. MYB84 was positively regulated HCT-2 and negatively regulated flavonoid 3′5′-hydroxylase (F3′5′H) enzyme gene. ERF066 negatively regulated the F3′H-3, CHS-3, and CHS-2 enzyme genes and positively regulated the FLS-2, CHI, CHS-5, and F3′5′H enzyme genes. ERF5 negatively regulated the F3′H-2 enzyme gene, while ERF105 positively regulated the F3′H-2 and FLS-1 genes. GATA28 negatively regulated the FLS-2, CHI, HCT-1, F3′5′H, and F3′H-2 genes and positively regulated the F3′H-3 gene. GATA16 negatively regulated the FLS-1 gene. TCP19 positively regulated the DFR gene, and bZIP21 positively regulated the F3′H-1 gene. ERF1 positively regulated the CHS-5 and HCT-1 genes and negatively regulated the F3′H-2 gene. GATA24 negatively regulated the FLS-1 gene. The coexpression patterns of anthocyanin-related transcription factors and enzyme genes are summarized in Table 10.
Table 10.
Coexpression of transcription factors and key enzyme genes for Anthocyanidin glycoside synthesis.
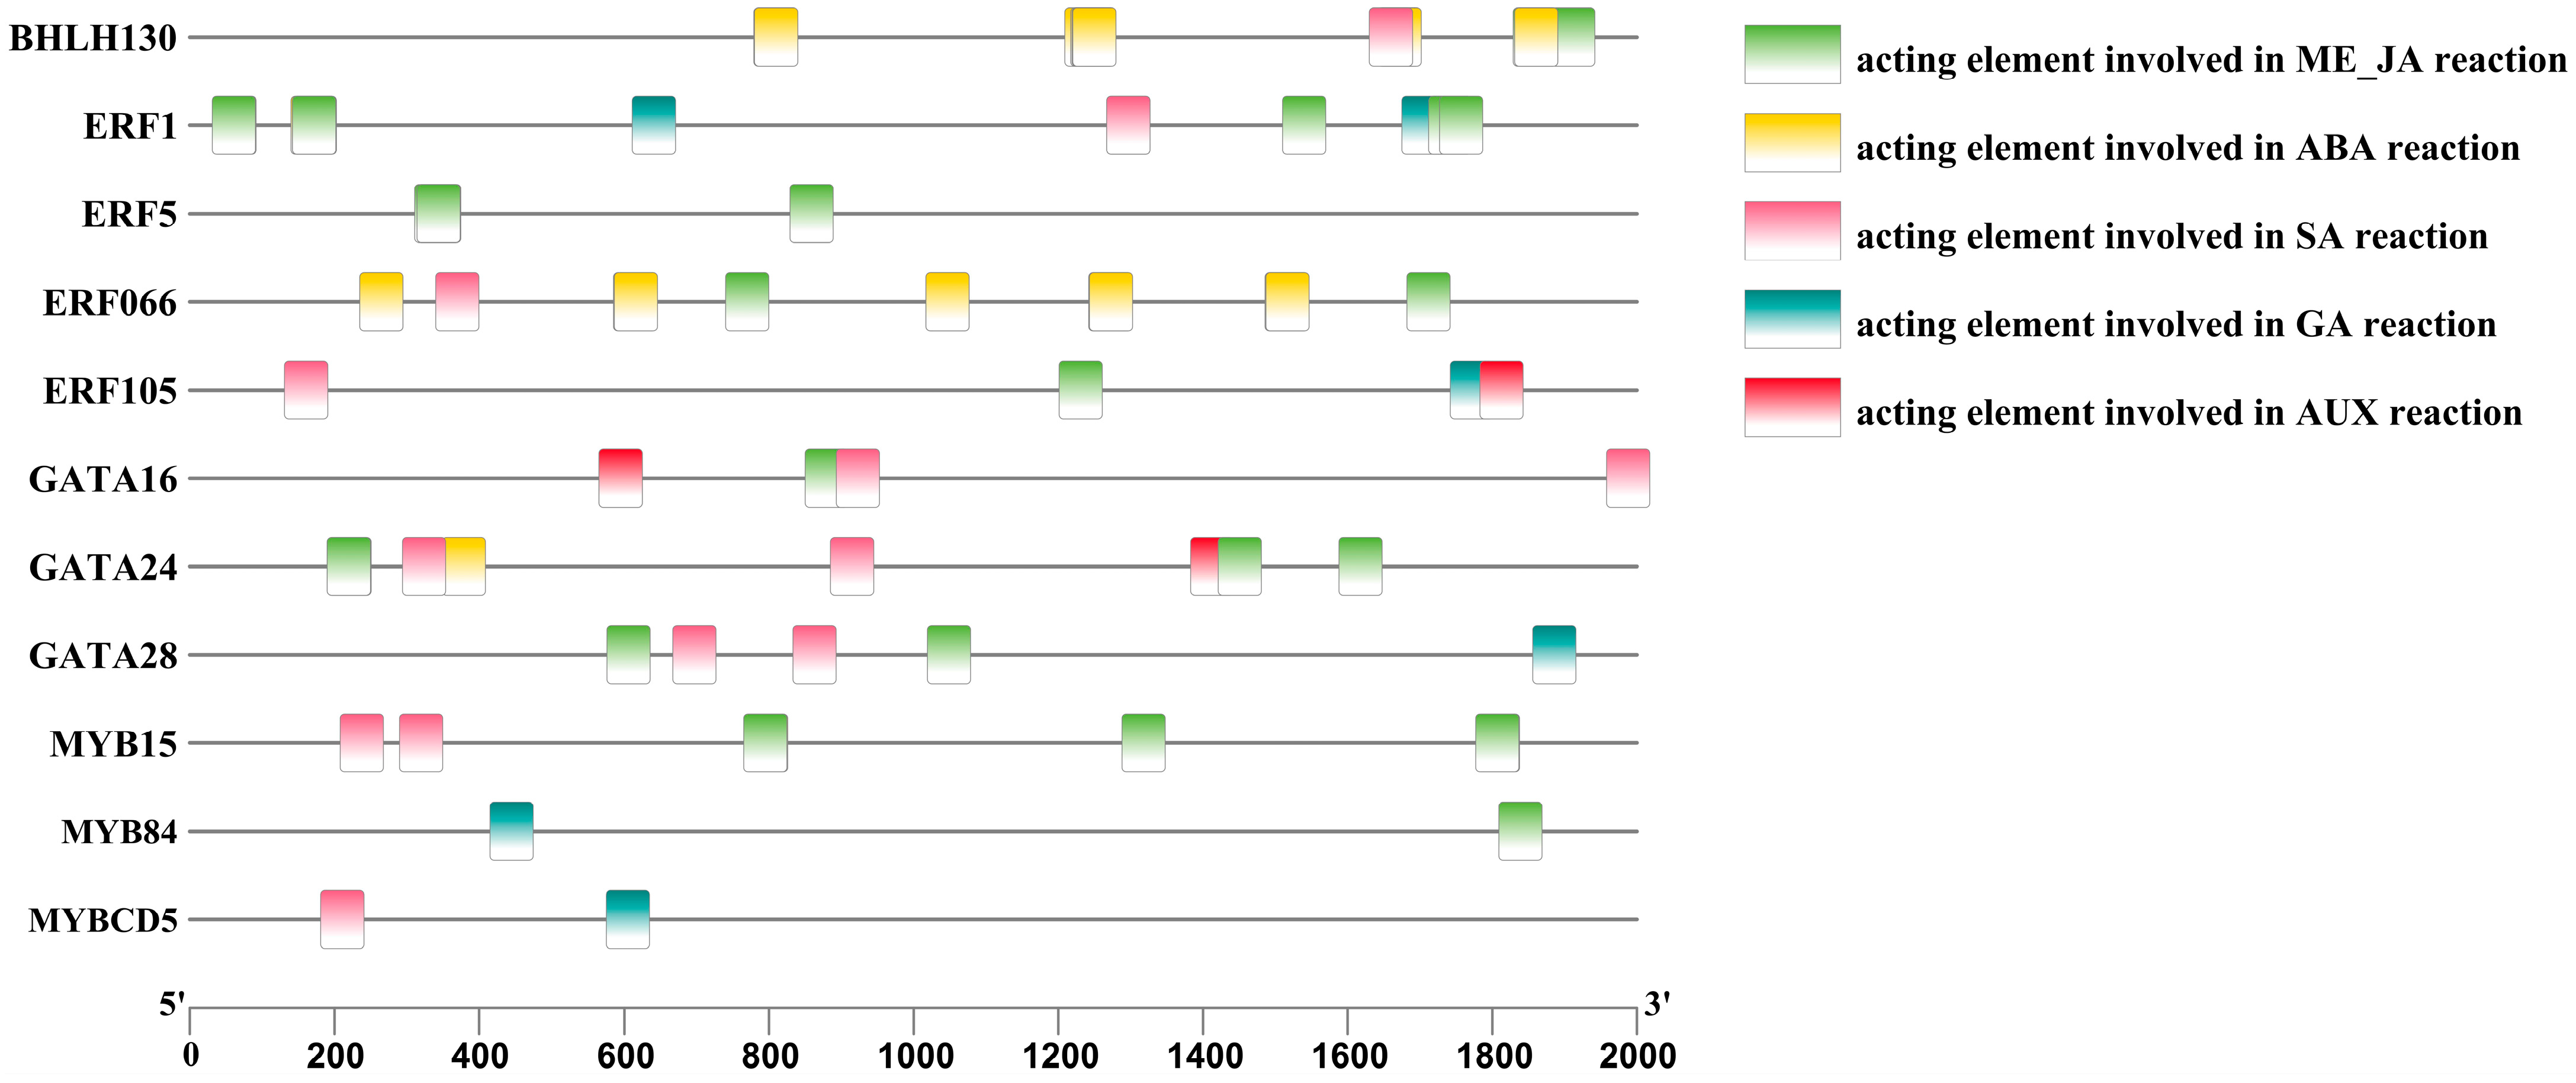
To further investigate the regulatory mechanism of endogenous hormones in anthocyanin metabolism-related key transcription factors in A. roxburghii leaves under different light-intensity treatments, we conducted promoter cis-element analysis on the predicted transcription factors, selecting elements responsive to plant hormones, including the methyl jasmonate response element (G-box/CGTCA-motif), the abscisic acid response element (ABRE9), the salicylic acid response element (TCA-element), the gibberellic acid response element (TATC-box/P-box), and the auxin response element (AuxRR-core).
Figure 8 shows that, among the 13 transcription factors that regulate anthocyanin metabolism-related enzymes, 11 had cis-acting elements that respond to plant hormones. ERF066, MYB15, and BHLH30 were regulated by three plant hormones: salicylic acid (SA), abscisic acid (ABA), and methyl jasmonate (Me_JA). ERF1 was regulated by four plant hormones: SA, Gibberellins (GAs), ABA, and Me_JA. ERF5 was regulated by one plant hormone: Me_JA. ERF105 was regulated by four plant hormones: SA, GA, auxin (AUX), and Me_JA. GATA16 was regulated by three plant hormones: AUX, SA, and Me_JA. GATA24 was regulated by four plant hormones: SA, ABA, Me_JA, and AUX. GATA28 was regulated by three plant hormones: Me_JA, SA, and GA. MYB84 was regulated by two plant hormones: Me_JA and GA. MYBCD5 was regulated by two plant hormones: SA and GA. The promoter status of anthocyanin-related transcription factors in response to plant hormones is shown in Table 11.
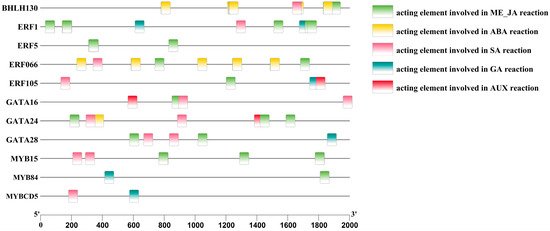
Figure 8.
Analysis of the promoter cis-elements of anthocyanin-related transcription factors in the leaves of A. roxburghii under different light intensities.
Table 11.
Promoter elements of Anthocyanidin glycoside related transcription factors.
To further explore the relationship between plant hormones and transcription factors in A. roxburghii under different light-intensity treatments and identify potential regulatory factors related to anthocyanin accumulation and metabolism, we determined the relationship between plant hormone content and transcription factor expression using the Pearson correlation coefficient. We selected data with a correlation coefficient of Pearson’s correlation coefficient (PCC) > 0.9 and p < 0.05 for analysis.
Ent-7alpha-hydroxykaur-16-en-19-oic acid was negatively correlated with BHLH130 and MYB15, while Gibberellin A53 (GA53) was negatively correlated with NHLH74. Gibberellin A24 (GA24) and Gibberellin A20 (GA20) were positively correlated with MYBCD5 and GATA1, while GA8 was negatively correlated with GATA24. GA44 diacid was positively correlated with BHLH130 and MYB15, Gibberellin A34 (GA34) was positively correlated with BHLH74 and BHLH78, and SA was positively correlated with ERF5. Dihydrozeatin was positively correlated with BHLH74; zeatin was negatively correlated with ERF12; trans-zeatin-7-β-d-glucoside was positively correlated with BHLH8, BHLH74, and BHLH78; and trans-zeatin riboside monophosphate was positively correlated with TCP19 and bZIP21. Isopentenyladenosine-5′-diphosphate was negatively correlated with ERF5, and O-β-d-glucosylzeatin and dihydrozeatin-O-glucoside were positively correlated with BHLH8, BHLH74, and BHLH78, and negatively correlated with ERF105. Trans-zeatin riboside triphosphate was positively correlated with TCP19 and bZIP21, while O-β-D-Xylosylzeatin was negatively correlated with TCP19 and bZIP21. (-)-jasmonoyl-l-isoleucine was positively correlated with ERF12, jasmonic acid was positively correlated with TCP19, L-methionine was negatively correlated with BHLH130 and MYB15, 1-aminocyclopropane-1-carboxylate (ACC) was negatively correlated with BHLH130 and MYB15, and positively correlated with GATA28. The specific correlation coefficients are shown in Table 12.
Table 12.
Correlation between endogenous hormones and Anthocyanidin glycoside-related transcription factors.
3.7. qRT-PCR Verification of Key Transcription Factors and Enzyme Genes in A. roxburghii Leaves under Different Light Intensities
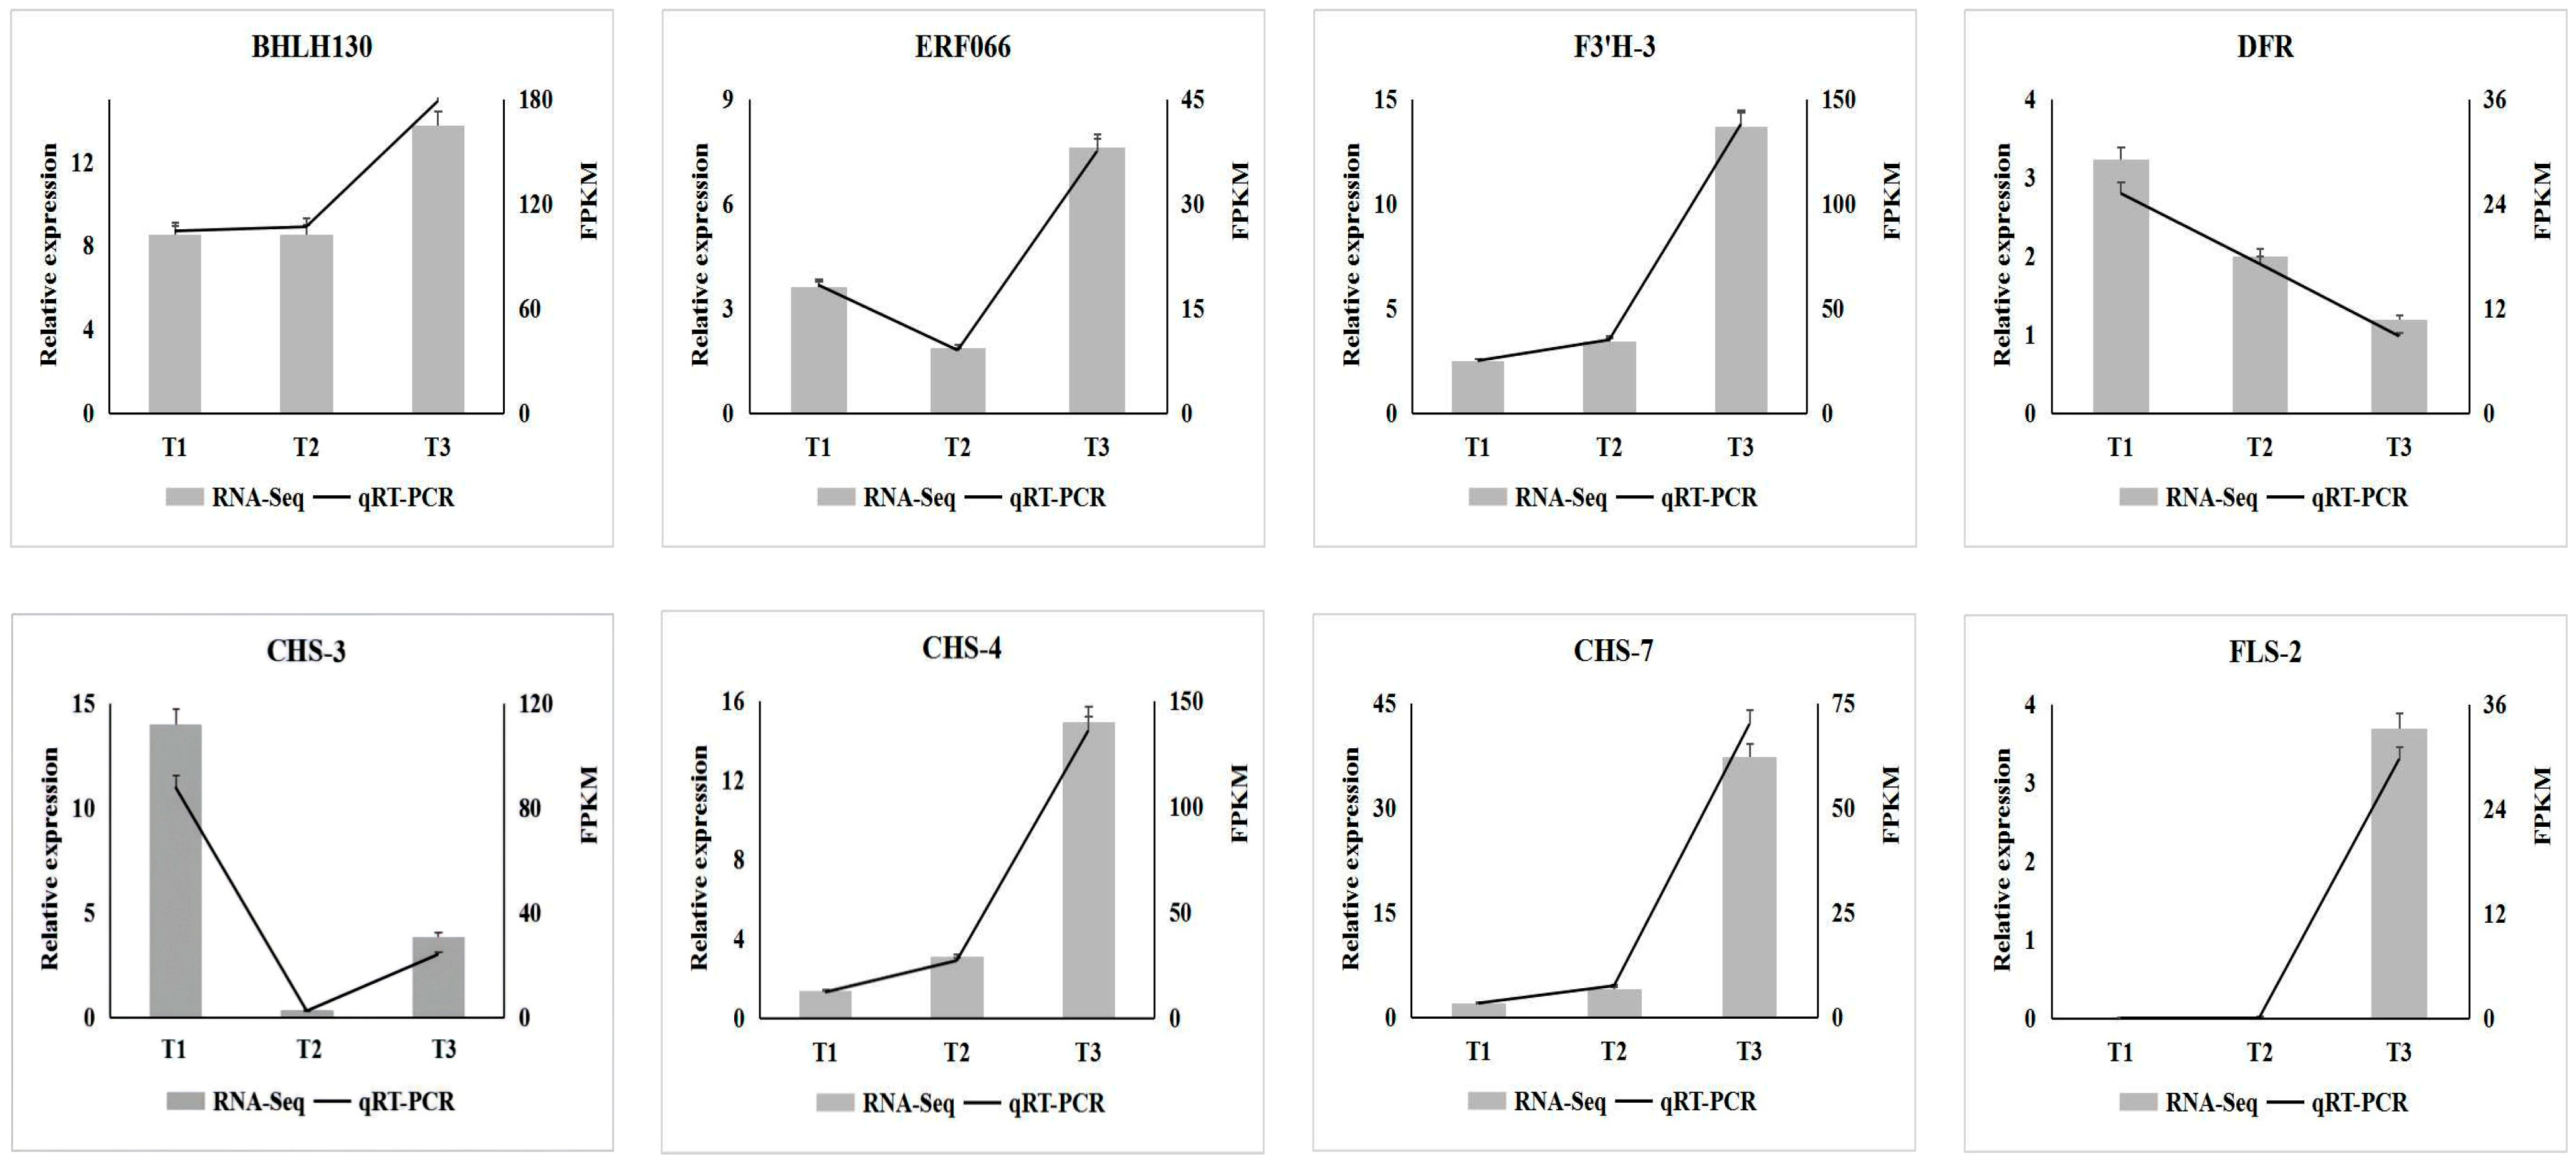
To further verify the expression of key transcription factors and enzyme genes involved in anthocyanin biosynthesis in A. roxburghii under different intensity treatments, eight genes (including two transcription factor genes and six enzyme genes) were selected from the screened key genes for qRT-PCR detection. As shown in Figure 9, the expression levels of transcription factor genes BHLH130 (TRINITY_DN221_c1_g1), FLS-2 (TRINITY_DN1866_c2_g2), CHS-7 (TRINITY_DN41086_c0_g1), CHS-4 (TRINITY_DN1660_c0_g1) and F3′H-3 (TRINITY_DN11652_c0_g1) involved in anthocyanin biosynthesis gradually increased with the increase in light intensity. With the increase in light intensity, the expression level of ERF066 (TRINITY_DN7304_c0_g1) and CHS-3 (TRINITY_DN28566_c0_g1) first decreased and then increased, while the expression level of DFR (TRINITY_DN4510_c0_g1) gradually decreased. The expression of the eight genes in A. roxburghii leaves under different light-intensity treatments obtained by quantitative analysis through qRT-PCR was consistent with the results of transcriptome sequencing.
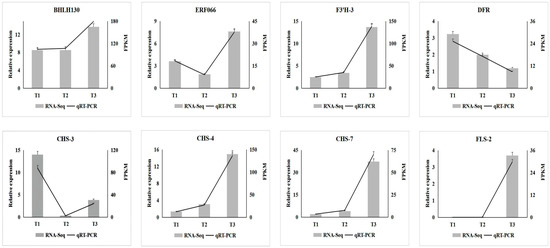
Figure 9.
qRT-PCR analysis of differential enzymes and transcription factors in A. roxburghii leaves under different light intensity treatments.
4. Discussion
4.1. Light Intensity Directly Promotes Anthocyanin Synthesis by Regulating the Content of Endogenous Hormones
The metabolome analysis showed that the relative content of anthocyanins in the leaves was highest in T3 (with light transmittance of 75%), while the content and types of anthocyanins in the leaves were the lowest in T1 (with light transmittance of 25%). We speculated that a light transmittance of 75% was more conducive to accumulating anthocyanins in A. roxburghii leaves. The authors of [15] determined the anthocyanin content of Vaccinium uliginosum L. under four different light intensities. With increased light intensity, the anthocyanin content significantly increased, and the content of anthocyanin metabolites under 75% light intensity was 1.09 to 4.08 times that of other light-intensity treatments. This is consistent with the results of this study, indicating that appropriate light can significantly promote the synthesis of anthocyanins and increase anthocyanin content in leaves. By measuring the anthocyanin compounds in A. roxburghii under different light intensities, we found that pelargonidin, delphinidin, cyanidin, and malvidin may be the main anthocyanins responsible for the differences in leaf color, similar to the results of Li’s study on the detection of anthocyanin components in the light-induced O’Neil blueberry variety (Vaccinium corymbosum L.) [26]. This was the main reason for the color deepening during the growth and development of this blueberry variety.
The endogenous phytohormone difference analysis showed that a total of 30 metabolites related to plant endogenous hormones (including jasmonic acid, salicylic acid, ethylene, zeatin, and gibberellins) were identified in the leaves under different light intensities. We observed that most of the gibberellin, salicylic acid, zeatin, jasmonic acid, and ethylene had the highest content under the treatment of 25% light transmittance, and their levels gradually decreased with increasing light intensity, indicating that shading is more conducive to accumulating plant hormones. In oilseed peony leaves, mild, moderate, and severe shading increases Indole acetic acid concentrations by 38.1%, 45.5%, and 49.0%, respectively, while gibberellin A3 concentrations rise by 6.3%, 7.6%, and 11.7% [28]. In Camellia sinensis, the content of gibberellin and ethylene decreases with increasing light intensity [29]. This is consistent with the results of the present study, indicating that weaker light is more conducive to accumulating endogenous hormones in plants.
Research has found that the synthesis of anthocyanins is largely influenced by various plant hormones, such as gibberellin, cytokinins, and ethylene [30]. However, there are few studies on whether there is an intrinsic relationship between endogenous plant hormones and the differential distribution of anthocyanins in A. roxburghii under different light-intensity treatments. Therefore, we attempted to construct a preliminary “plant hormone–anthocyanin metabolite” correlation network under different light-intensity treatments through Pearson correlation analysis. The results showed 11 hormones correlate with 10 anthocyanin metabolites and 3 flavonoid metabolites. Most gibberellins have different regulatory effects on anthocyanins owing to different types and concentrations. Gibberellin A7 was negatively correlated with delphinidin, dihydrokaempferol, and two cyanidin glycosides; Gibberellin A9 was positively correlated with cyanidin; and ACC was negatively correlated with pelargonidin 3-O-β-d-glucoside 5-O-(6-coumaroyl-β-d-glucoside). We discovered that the levels of these phytohormones and anthocyanin metabolites exhibit either a positive or negative correlation under different light intensities, and we speculate that an intrinsic regulatory mechanism may exist between them. Gao [31] discovered that under different exogenous gibberellin treatment conditions, there were variations in the peak contents of quercetin, kaempferol, and anthocyanin in Ginkgo biloba leaves; Ahmad [32] discovered that the accumulation of flavonoids (quercetin, kaempferol) in the Talinum paniculatum exhibits a peak under different concentrations of salicylic acid treatment; Macarena [33] found that using an exogenous ethylene treatment on “Honeycrisp” apples (Malus pumila) resulted in the largest increase in anthocyanin biosynthesis genes and total anthocyanins.
In summary, many studies have confirmed the intrinsic regulatory relationship between plant hormones and anthocyanin metabolites. Therefore, we can try to regulate the content of endogenous plant hormones in A. roxburghii and thereby affect the content of highly related anthocyanin metabolites to highly accumulate target metabolites in the leaves of A. roxburghii and regulate its leaf color changes. However, its intrinsic regulatory mechanism needs further research.
4.2. Endogenous Hormones Regulate the Synthesis of Anthocyanin Metabolites by Regulating the Expression of Key Enzyme Genes
Through transcriptome data analysis, we found that synthesizing anthocyanins under different light-intensity treatments may be mainly affected by flavonoid 3′-monooxygenase (F3′H), chalcone synthase (CHS), flavonol synthase (FLS), and bifunctional dihydroflavonol 4-reductase (DFR). The expression of the F3H gene significantly increased under the T3 treatment (75% transmittance), indicating that the F3H gene is involved in biosynthesizing related pigments, which has also been confirmed in flower color research on Impatiens uliginosa. The expression level of the F3H gene was the highest in the dark red color at the beginning of flowering and lowest in the pink color at the peak of flowering [34]. The F3′H gene may be expressed in various plant tissues. The up-regulated expression of the F3′H gene often causes leaves to turn red, while down-regulated expression reduces the total anthocyanin content [35]; its main role is catalyzing the synthesis of dihydroquercetin from dihydrokaempferol. The gene expression of the F3′H enzyme was also high under the T3 treatment, which may have led to an increase in F3′H enzyme activity and a decrease in dihydrokaempferol content, consistent with previous research results. The enzymes encoded by the CHS and CHI genes catalyze p-coumaroyl-COA and naringenin-chalcone, respectively, which form dihydrokaempferol, an important precursor for anthocyanin synthesis. The expression of the CHS and CHI genes was consistent with the pattern of anthocyanin accumulation, suggesting that they may affect anthocyanin synthesis in A. roxburghii leaves.
Plant hormones are important signaling molecules in plants and regulate (promote or inhibit) their own physiological processes under certain conditions. Previous studies have shown that plant hormones can regulate anthocyanin synthesis by affecting structural genes related to anthocyanin synthesis [36]. However, the changes in hormones and related mechanisms of anthocyanin biosynthesis in A. roxburghii were unknown. Therefore, we analyzed the differences in endogenous plant hormones in A. roxburghii under different light treatments and attempted to analyze the relationship between plant hormones and anthocyanin-related enzyme genes in A. roxburghii leaves by constructing a plant hormone and enzyme gene expression network.
The correlation analysis of endogenous hormone and enzyme gene expression in A. roxburghii leaves treated with different light intensities showed that the precursor of ethylene synthesis, ACC, was negatively correlated with the downstream FLS and CHS genes involved in anthocyanin synthesis and strongly negatively correlated with the F3′H gene. Many studies have shown that ethylene plays a negative regulatory role in anthocyanin synthesis. For example, Ni [37] found that ethylene has a significant inhibitory effect on the biosynthesis of Pyrus spp. anthocyanins, similar to the way ACC acted in this study, which was also why the Pyrus spp. flowers in this study were lighter colors. As early as 1971, Craker [38] studied the effect of ethylene treatment on anthocyanin synthesis in Sorghum bicolor during induction and found that ethylene can promote anthocyanin accumulation in the early lag phase while inhibiting anthocyanin accumulation in the late lag phase. In dark conditions, ethylene can inhibit the accumulation of anthocyanins in the kernel pericarp. When treated with the ethylene synthesis inhibitor (S) trans-2-amino-4-(2-aminoethoxy)-3-butenoic acid, it was found that the expression levels of anthocyanin synthesis-related genes such as CHS, ANS, and F3H were significantly up-regulated [39]. In addition, the regulation pattern of gibberellin on genes in the anthocyanin synthesis pathway is very diverse. Gibberellin A5 is negatively correlated with the upstream gene F3′H in the anthocyanin synthesis pathway and positively correlated with Phlorizin synthase, while gibberellin A7 is positively correlated with Phlorizin synthase, which may be related to the type and concentration of gibberellin. Wang [40] found that the anthocyanin content in Oryza sativa L. with a low nitrogen treatment was significantly higher than in the wild type, and exogenous gibberellin (GA3) treatment inhibited the accumulation of anthocyanin. Further research found that low-nitrogen treatments could inhibit the production of gibberellins (GA1, GA3, and GA4) and promote anthocyanin accumulation. Gibberellin 2-oxidase (GA2ox) plays an important role in the gibberellin metabolic pathway. Wang [41] found that OsGA2ox8 can indirectly regulate anthocyanin genes to participate in the anthocyanin synthesis regulation process. In summary, endogenous hormones can regulate the synthesis of anthocyanin metabolites by regulating the expression of key enzyme genes.
4.3. Endogenous Hormones Regulate Enzyme Genes by Activating Transcription Factors, Thereby Promoting the Synthesis of Anthocyanin Metabolites
In the actual anthocyanin synthesis process, transcription factors (TFs) also participate in the relevant regulation. TFs can regulate metabolism by activating or inhibiting the expression of enzyme genes [42], while plant hormones can not only regulate the expression of enzyme genes but also affect the accumulation of anthocyanins by regulating the expression of transcription factor genes [43]. Therefore, this study further constructed a regulatory “plant hormones, transcription factors, enzyme gene expression, and anthocyanin accumulation” network and explored the possible regulatory relationship between plant hormones and transcription factors, as well as between transcription factors and enzyme gene expression from the perspective of transcription factor regulation. The results show that 13 transcription factors that regulate anthocyanin metabolism-related enzymes and 7 enzymes have regulatory relationships in A. roxburghii leaves under different light treatments, of which 11 transcription factors have cis-elements responding to plant hormones.
The transcription factor ERF5 negatively regulated the F3′H-2 enzyme gene, while ERF105 positively regulated the F3′H-2 and FLS-1 genes. We speculated that ERF-type transcription factors in A. roxburghii leaves do not have a single mode of regulating anthocyanin glycosides. Research shows that hormones can regulate anthocyanin glycoside synthesis in plants through ERF. For example, ethylene accelerates anthocyanin accumulation by promoting the transcription of Md MYB1 and key genes for anthocyanin synthesis, while Md MYB1 induces the transcription of ethylene-responsive factor Md ERF3 to further enhance ethylene-mediated anthocyanin accumulation and M. pumila Mill. fruit coloring [44]. In the jasmonic acid-regulated anthocyanin synthesis pathway mediated by Md ERF1B, the interaction between the jasmonic acid signaling pathway inhibitor Md JAZ5/10 and the Md ERF1B protein significantly reduces the activation of the Md MYC2 promoter by Md ERF1B, inhibiting anthocyanin accumulation [45]. GATA transcription factors can respond to multiple hormone signaling molecules and light stimulation, regulating plant growth and development. In this study, GATA28 negatively regulated FLS-2, CHI, HCT-1, F3′5′H, and F3′H-2, while GATA16 and GATAG24 negatively regulated the FLS-1 gene. In the leaves of A. roxburghii treated with different light treatments, we found that GATA-type transcription factors negatively regulated the genes of enzymes related to anthocyanin synthesis. There are few studies on regulating anthocyanin glycosides with GATA transcription factors. However, Liu [46] analyzed the cis-acting elements of GATA transcription factors in Morus alba L. and found that GATAs may be involved in transcriptional regulation and plant hormone signaling transduction under biotic and abiotic stress. This study shows that the transcription factors involved in anthocyanin biosynthesis pathways in A. roxburghii may respond to stimulating plant hormones such as salicylic acid, gibberellins, abscisic acid, and methyl jasmonate, regulating the expression of key enzyme genes in their respective synthesis pathways and, thus, playing a role in the “plant hormones, transcription factors, and enzyme gene expression” regulatory network.
In general, the darker leaf color under 75% light transmittance in A. roxburghii leaves with different light treatments may be due to the stimulation of three key transcription factors, BHLH130, GATA28, and ERF066, by plant hormones such as ethylene. These hormones regulate the expression of four enzyme genes, FLS-2, CHS-4, F3′H-3, and DFR, thereby affecting the accumulation of metabolites such as delphinidin 3,3′-diglucoside 5-(6-caffeoyl)glucoside, malvidin 3-O-glucoside, pelargonidin 3-O-β-d-glucoside 5-O-(6-coumaroyl-β-d-glucoside), pelargonidin 3-O-(6-O-malonyl-β-d-glucoside), and cyanidin 3-O-rutinoside 5-O-β-d-glucoside, which change the leaf color.
5. Conclusions
In this study, we conducted a correlation analysis between metabolites, transcription factors, key genes, and endogenous hormones, indicating the potential regulatory role of hormones in anthocyanin metabolism. A 75% light transmittance value is most conducive to anthocyanin synthesis in A. roxburghii. Under the influence of light, hormone signaling activates downstream transcription factors, and these activated transcription factors further regulate the expression of relevant enzyme genes for anthocyanin glycoside metabolism, affecting the accumulation of anthocyanin metabolites and forming a mechanism by which different light intensities regulate the changes in A. roxburghii leaf color. This study provides a reference for further studies of the regulation of plant secondary metabolism accumulation by light environmental factors and new insights and data for the role of the molecular regulatory network of plant hormones in anthocyanin synthesis.
Supplementary Materials
The following supporting information can be downloaded at: https://www.mdpi.com/article/10.3390/genes15080989/s1, The electropherograms presenting the RNA bands in agarose gels (Figures S1–S9) and the RNA integrity number (Figure S10) were in the Supplementary Materials. Real-time quantitative PCR verification: the GenBank accession of the reference gene is JF825424. The amplification and melt curves are shown in the Supplementary Materials (Figures S11–S28).
Author Contributions
Conceptualization, Y.C. and J.Z.; methodology, J.C.; software, J.C. and J.Z.; validation, R.H. and W.L.; formal analysis, J.C.; investigation, T.Z. and J.Y.; resources, Y.C. and R.H.; data curation, X.L. and X.H.; writing—original draft preparation, J.C.; writing—review and editing, J.C.; visualization, W.L. and X.L; supervision, Y.C.; project administration, J.Z.; funding acquisition, Y.C. and T.Z. All authors have read and agreed to the published version of the manuscript.
Funding
This research was funded by the Natural Science Foundation of Fujian Province (Project name: 2021J01132) and the Science and Technology Project of Fujian Provincial Department of Housing and Construction (Three project numbers, Project name: (2022-K-198), (2022-K-199) and (2022-K-200)).
Institutional Review Board Statement
Not applicable.
Informed Consent Statement
Not applicable.
Data Availability Statement
The data have been registered in the NCBI Sequence Read Archive (SRA) database (https://trace.ncbi.nlm.nih.gov/Traces/sra/, accessed on 22 June 2024) under the GenBank accession numbers SRR29496896, SRR29496895, SRR29496894, SRR29496893, SRR29496892, SRR29496891, SRR29496890, SRR29496889, SRR29496888, SRR29496887, SRR29496886, and SRR29496885.
Acknowledgments
The authors thank the Editor and the anonymous reviewers for their insightful comments and suggestions on the manuscript.
Conflicts of Interest
The authors declare no conflicts of interest.
References
- Ye, S.Y.; Shao, Q.S.; Zhang, A.L. Anoectochilus roxburghii: A review of its phytochemistry, pharmacology, and clinical applications. J. Ethnopharmacol. 2017, 209, 184–202. [Google Scholar] [CrossRef]
- Antonella, S.; Davide, B.; Ersilia, B.; Domenico, T. Chemistry, Pharmacology and Health Benefits of Anthocyanins. Phytother. Res. 2016, 8, 1265–1286. [Google Scholar]
- Xu, L.F.; Gao, Z.B.; Li, L.; Guo, J. Impact of dielectric barrier discharge cold plasma on anthocyanin metabolism in blueberries: A targeted metabonomic and transcriptomic analysis. Postharvest Biol. Technol. 2024, 213, 112963. [Google Scholar] [CrossRef]
- Yan, Y.Y.; Liu, Q.; Yan, K.; Wang, X.Y.; Xu, P. Transcriptomic and metabolomic analyses reveal how girdling promotes leaf color expression in Acer rubrum L. BMC Plant Biol. 2022, 22, 498. [Google Scholar]
- Zhang, Y.Z.; Liu, X.; Ma, H.P.; Liu, X.H.; Huang, Y.; Lu, X.; Cheng, Y.W. R2R3-MYB transcription factor CjMYB114 interacts with CjbHLH1 to jointly regulate anthocyanins in Camellia japonica L. ‘Fendan’. Sci. Hortic. 2024, 328, 112897. [Google Scholar] [CrossRef]
- Zhang, H.; Wang, J.Y.; Tian, S.T.; Hao, W.H.; Du, L.J. Two B-Box Proteins, MaBBX20 and MaBBX51, Coordinate Light-Induced Anthocyanin Biosynthesis in Grape Hyacinth. Int. J. Mol. Sci. 2022, 23, 5678. [Google Scholar] [CrossRef]
- Wang, D.; Liu, G.L.; Yang, J.; Shi, G.F.; Niu, Z.Q.; Liu, H.J.; Xu, N.; Wang, L.; Wang, F.D. Integrated metabolomics and transcriptomics reveal molecular mechanisms of corolla coloration in Rhododendron dauricum L. Plant Physiol. Biochem. 2024, 207, 108438. [Google Scholar] [CrossRef]
- Laura, J. New insights into the regulation of anthocyanin biosynthesis in fruits. Trends Plant Sci. 2013, 18, 477–483. [Google Scholar]
- Wang, Y.; Yao, Y.; Cui, Y.M.; An, L.; Li, X.; Bai, Y.; Ding, B.; Yao, X.; Wu, K. Unveiling the mysteries of HvANS: A study on anthocyanin biosynthesis in qingke (Hordeum vulgare L. var. Nudum hook. f.) seeds. BMC Plant Biol. 2024, 1, 637. [Google Scholar] [CrossRef]
- Vinskienė, J.; Bendokas, V.; Stanys, V.; Sasnauskas, A.; Rugienius, R. The effect of osmotic stress, lighting spectrum and temperature on growth and gene expression related to anthocyanin biosynthetic pathway in wild strawberry (Fragaria vesca L.) in vitro. Folia Hortic. 2023, 2, 419–431. [Google Scholar] [CrossRef]
- Huang, L.; Lin, B.G.; Hao, P.F.; Yi, K.G.; Li, X.; Hua, S.J. Multi-Omics Analysis Reveals That Anthocyanin Degradation and Phytohormone Changes Regulate Red Color Fading in Rapeseed (Brassica napus L.) Petals. Int. J. Mol. Sci. 2024, 25, 2577. [Google Scholar] [CrossRef]
- Wang, L.J.; Zhao, J.L.; Yang, J.; Huang, J.; Chen, Q.F.; Deng, J. Bioinformatics analysis of COP1 gene in tartary buckwheat and its involvement in anthocyanin synthesis. Southwest China J. Agric. Sci. 2022, 35, 1977–1985. [Google Scholar]
- Nakatsuka, A.; Yamagishi, M.; Nakano, M.; Tasaki, K.; Kobayashi, N. Light-induced expression of basic helix-loop-helix genes involved in anthocyanin biosynthesis in flowers and leaves of Asiatic hybrid lily. Sci. Hortic. 2009, 1, 84–91. [Google Scholar] [CrossRef]
- Jiang, C.L.; Dai, J.X.; Han, H.L.; Wang, C.; Zhu, L.; Lu, C.Y.; Chen, H.P. Determination of thirteen acidic phytohormones and their analogues in tea (Camellia sinensis) leaves using ultra high performance liquid chromatography tandem mass spectrometry. J. Chromatogr. B 2020, 1149, 122144. [Google Scholar] [CrossRef]
- An, X.L.; Tan, T.Y.; Zhang, X.Y.; Guo, X.L.; Zhu, Y.Z.; Song, Z.J.; Wang, D.L. Effects of Light Intensity on Endogenous Hormones and Key Enzyme Activities of Anthocyanin Synthesis in Blueberry Leaves. Horticulturae 2023, 9, 618. [Google Scholar] [CrossRef]
- Xu, Y.L.; Liu, X.X.; Huang, Y.M.; Xia, Z.L.; Lian, Z.L.; Qian, L.J.; Qiu, Z.K. Ethylene Inhibits Anthocyanin Biosynthesis by Repressing the R2R3-MYB Regulator SlAN2-like in Tomato. Int. J. Mol. Sci. 2022, 14, 7648. [Google Scholar] [CrossRef]
- Weiss, D.; Van Der Luit, A.; Knegt, E.; Vermeer, E.; Mol, J.; Kooter, J.M. Identification of Endogenous Gibberellins in Petunia Flowers (Induction of Anthocyanin Biosynthetic Gene Expression and the Antagonistic Effect of Abscisic Acid). Plant Physiol. 1995, 107, 695–702. [Google Scholar] [CrossRef]
- Gao, T.M.; Lin, Z.; Yuta, S.; Takane, K.; Ai, S.; Hikaru, N. Effect of Grapevine Rootstocks on Anthocyanin Biosynthesis, Sugar Contents, and Endogenous Hormone Contents During the Berry Maturation of ‘Ruby Roman’. Hortic. J. 2022, 91, 476–488. [Google Scholar]
- Dunn, W.B.; Broadhurst, D.; Begley, P.; Zelena, E.; Francis-McIntyre, S.; Anderson, N.; Brown, M.; Knowles, J.D.; Halsall, A.; Haselden, J.N.; et al. Procedures for large-scale metabolic profiling of serum and plasma using gas chromatography and liquid chromatography coupled to mass spectrometry. Nat. Protoc. 2011, 6, 1060–1083. [Google Scholar] [CrossRef]
- Robasky, K.; Lewis, N.E.; Church, G.M. The role of replicates for error mitigation in next-generation sequencing. Nat. Rev. Genet. 2014, 15, 56–62. [Google Scholar] [CrossRef]
- Liu, M.Y.; Ma, Z.T.; Zheng, T.R.; Sun, W.J.; Zhang, Y.J.; Jin, W.Q.; Zhan, J.Y.; Cai, Y.T.; Tang, Y.J.; Wu, Q.; et al. Insights into the correlation between Physiological changes in and seed development of tartary buckwheat (Fagopyrum tataricum Gaertn.). BMC Genom. 2018, 19, 648. [Google Scholar] [CrossRef] [PubMed]
- Love, M.I.; Huber, W.; Anders, S. Moderated estimation of fold change and dispersion for RNA-seq data with DESeq2. Genome Biol. 2014, 15, 550. [Google Scholar] [CrossRef] [PubMed]
- Ji, X.L.; Ren, J.; Zhang, Y.X.; Lang, S.Y.; Wang, D.; Song, X.S. Integrated Analysis of the Metabolome and Transcriptome on Anthocyanin Biosynthesis in Four Developmental Stages of Cerasus humilis Peel Coloration. Int. J. Mol. Sci. 2021, 22, 11880. [Google Scholar] [CrossRef] [PubMed]
- Kang, C.; Liu, J.; Ji, R.; Chen, T.; Zhou, X.T.; Yang, J.; Tong, Y.R.; Jiang, C.; Zhou, J.H.; Zhao, Y.Y.; et al. Biogenic Synthesis and Spatial Distribution of Endogenous Phytohormones and Ginsenosides Provide Insights on Their Intrinsic Relevance in Panax ginseng. Front. Plant Sci. 2019, 9, 1951. [Google Scholar]
- Fu, C.C.; Han, C.; Wei, Y.X.; Liu, D.; Han, Y.C. Two NAC transcription factors regulated fruit softening through activating xyloglucan endotransglucosylase/hydrolase genes during kiwifruit ripening. Int. J. Biol. Macromol. 2024, 263 Pt 1, 130678. [Google Scholar] [CrossRef] [PubMed]
- Wu, L.L.; Wang, Y.J.; Guo, P.R.; Li, Z.; Li, J.A.; Tan, X.F. Metabonomic and transcriptomic analyses of Camellia oleifera flower buds treated with low-temperature stress during the flowering stage. Ind. Crops Prod. 2022, 189, 115874. [Google Scholar] [CrossRef]
- Livak, K.J.; Schmittgen, T.D. Analysis of relative gene expression data using real-time quantitative PCR and the 2−ΔΔCT Method. Methods 2001, 25, 402–408. [Google Scholar] [CrossRef] [PubMed]
- Han, C.J.; Wang, Q.; Zhang, H.B.; Wang, S.H.; Dong, H.Z. Light shading improves the yield and quality of seed in oil-seed peony (Paeonia ostii Feng Dan). J. Integr. Agric. 2017, 7, 1631–1640. [Google Scholar] [CrossRef]
- Gao, C.X.; Sun, Y.; Li, J.; Zhou, Z.; Deng, X.M.; Xue, Z.H. High Light Intensity Triggered Abscisic Acid Biosynthesis Mediates Anthocyanin Accumulation in Young Leaves of Tea Plant (Camellia sinensis). Antioxidants 2023, 2, 392. [Google Scholar] [CrossRef]
- Luan, A.P.; Zhang, W.; Yang, M.Z.; Zhong, Z.Q.; Wu, J.; He, Y.H.; He, J.H. Unveiling the molecular mechanism involving anthocyanins in pineapple peel discoloration during fruit maturation. Food Chem. 2023, 412, 135482. [Google Scholar] [CrossRef]
- Gao, X.G.; Hu, Y.P.; Xu, Z.B.; Peng, D.Q. Expression profiling of the phenylalanine ammonia-lyase (PAL) gene family in Ginkgo biloba L. Plant Signal. Behav. 2023, 18, 2271807. [Google Scholar] [CrossRef]
- Ahmad, F.; Anggita, V.S. Enhancement of saponin accumulation in adventitious root culture of Javanese ginseng (Talinum paniculatum Gaertn.) through methyl jasmonate and salicylic acid elicitation. Afr. J. Biotechnol. 2019, 6, 130–135. [Google Scholar] [CrossRef]
- Miah, M.S.; Farcuh, M. The Expression of Key Ethylene and Anthocyanin Biosynthetic Genes of ‘Honeycrisp’ Apples Subjected to the Combined Use of Reflective Groundcovers and Aminoethoxyvinylglycine in the Mid-Atlantic US. Plants 2024, 8, 1141. [Google Scholar] [CrossRef] [PubMed]
- Duan, Y.T.; Wang, P.N.; Zhang, C.B.; Lin, C.J. Research Progress in Plant Flavanone-3-hydroxylase Gene. Nat. Biotechnol. 2022, 38, 27–33. [Google Scholar]
- Zhang, Y.Q.; Feng, Y.Q.; Yang, S.W.; Qiao, H.L.; Wu, A.Y.; Yang, J.H.; Ma, Z.H. Identification of Flavanone 3-Hydroxylase Gene Family in Strawberry and Expression Analysis of Fruit at Different Coloring Stages. Int. J. Mol. Sci. 2023, 24, 16807. [Google Scholar] [CrossRef]
- Sun, P.; Yang, C.K.; Zhu, W.C.; Wu, J.Q.; Lin, X.R.; Wang, Y.; Zhu, J.X.; Chen, C.F.; Zhou, K.B.; Qian, M.J.; et al. Metabolome, Plant Hormone, and Transcriptome Analyses Reveal the Mechanism of Spatial Accumulation Pattern of Anthocyanins in Peach Flesh. Foods 2023, 12, 2297. [Google Scholar] [CrossRef]
- Ni, J.B.; Premathilake, A.T.; Gao, Y.H.; Yu, W.J.; Tao, R.Y.; Teng, Y.W.; Bai, S.L. Ethylene-activated PpERF105 induces the expression of the repressor-type R2R3-MYB gene PpMYB140 to inhibit anthocyanin biosynthesis in red pear fruit. Plant J. 2020, 105, 51–59. [Google Scholar] [CrossRef]
- Craker, L.E.; Standley, L.A.; Starbuck, M.J. Ethylene control of anthocyanin synthesis in Sorghum. Plant Physiol. 1971, 48, 349–352. [Google Scholar] [CrossRef]
- Kymar, D.; Sarmah, B.K.; Das, P.K. Ethylene mediates repression of anthocyanin accumulation in black rice pericarps in the absence of light. J. Plant Physiol. 2019, 236, 34–38. [Google Scholar] [CrossRef]
- Wang, Y.B.; Yao, Q.Q.; Zhang, Y.S. The role of gibberellins in regulation of nitrogen uptake and physiological traits in maize responding to nitrogen availability. Int. J. Mol. Sci. 2020, 21, 1824. [Google Scholar] [CrossRef]
- Wang, Y.X.; Du, F.P.; Wang, J. Molecular dissection of the gene OsGA2ox8 conferring osmotic stress tolerance in rice. Int. J. Mol. Sci. 2021, 22, 9107. [Google Scholar] [CrossRef] [PubMed]
- Mei, J.; Mu, R.R.; Niu, Q.Q.; Zhu, M.; Chen, R.X.; Cai, X.M.; Miao, M.; Yu, D.L.; Ke, L.P.; Sun, Y.Q. A MYB transcription factor GhTT2 of Gossypium hirsutum regulates proanthocyanidin accumulation and improves osmotic tolerance in Arabidopsis. Plant Cell Tissue Organ Cult. 2024, 2, 157. [Google Scholar] [CrossRef]
- Jiang, L.L.; Chen, J.H.; Qian, J.Y.; Xu, M.H.; Qing, H.S.; Cheng, H.F.; Fu, J.X.; Zhang, C. The R2R3-MYB transcription factor ZeMYB32 negatively regulates anthocyanin biosynthesis in Zinnia elegans. Plant Mol. Biol. 2024, 114, 48. [Google Scholar] [CrossRef] [PubMed]
- An, J.P.; Wang, X.F.; Li, Y.Y.; Song, L.Q.; Zhao, L.L.; You, C.X.; Hao, Y.J. EIN3-LIKE1, MYB1, and ETHYLENE RESPONSE FACTOR3 act in a regulatory loop that synergistically modulates ethylene biosynthesis and anthocyanin accumulation. Plant Physiol. 2018, 178, 808–823. [Google Scholar] [CrossRef] [PubMed]
- Wang, S.; Li, L.X.; Fang, Y.; Li, D.; Mao, Z.L.; Zhu, Z.H.; Chen, X.S.; Feng, S.Q. MdERF1B-MdMYC2 module integrates ethylene and jasmonic acid to regulate the biosynthesis of anthocyanin in apple. Hortic. J. 2022, 9, uhac142. [Google Scholar] [CrossRef]
- Liu, J.; Liu, G.; Zeng, Y.C.; Dai, J.; Wei, L.; Yao, Y.Q.; Tong, W.H.; Tang, Q.X.; Huang, G.Q. Genome-wide identification and analysis of mulberry (Morus notabilis) GATA gene family. Southwest China J. Agric. Sci. 2022, 35, 2724–2731. [Google Scholar]

Disclaimer/Publisher’s Note: The statements, opinions and data contained in all publications are solely those of the individual author(s) and contributor(s) and not of MDPI and/or the editor(s). MDPI and/or the editor(s) disclaim responsibility for any injury to people or property resulting from any ideas, methods, instructions or products referred to in the content. |
© 2024 by the authors. Licensee MDPI, Basel, Switzerland. This article is an open access article distributed under the terms and conditions of the Creative Commons Attribution (CC BY) license (https://creativecommons.org/licenses/by/4.0/).