

Comparison of Six Measures of Genetic Similarity of Interspecific Brassicaceae Hybrids F2 Generation and Their Parental Forms Estimated on the Basis of ISSR Markers


Abstract
1. Introduction
2. Materials and Methods
2.1. Plant Material
2.2. Molecular Analysis
2.3. Measures of Genetic Similarity
2.4. Statistical Analysis
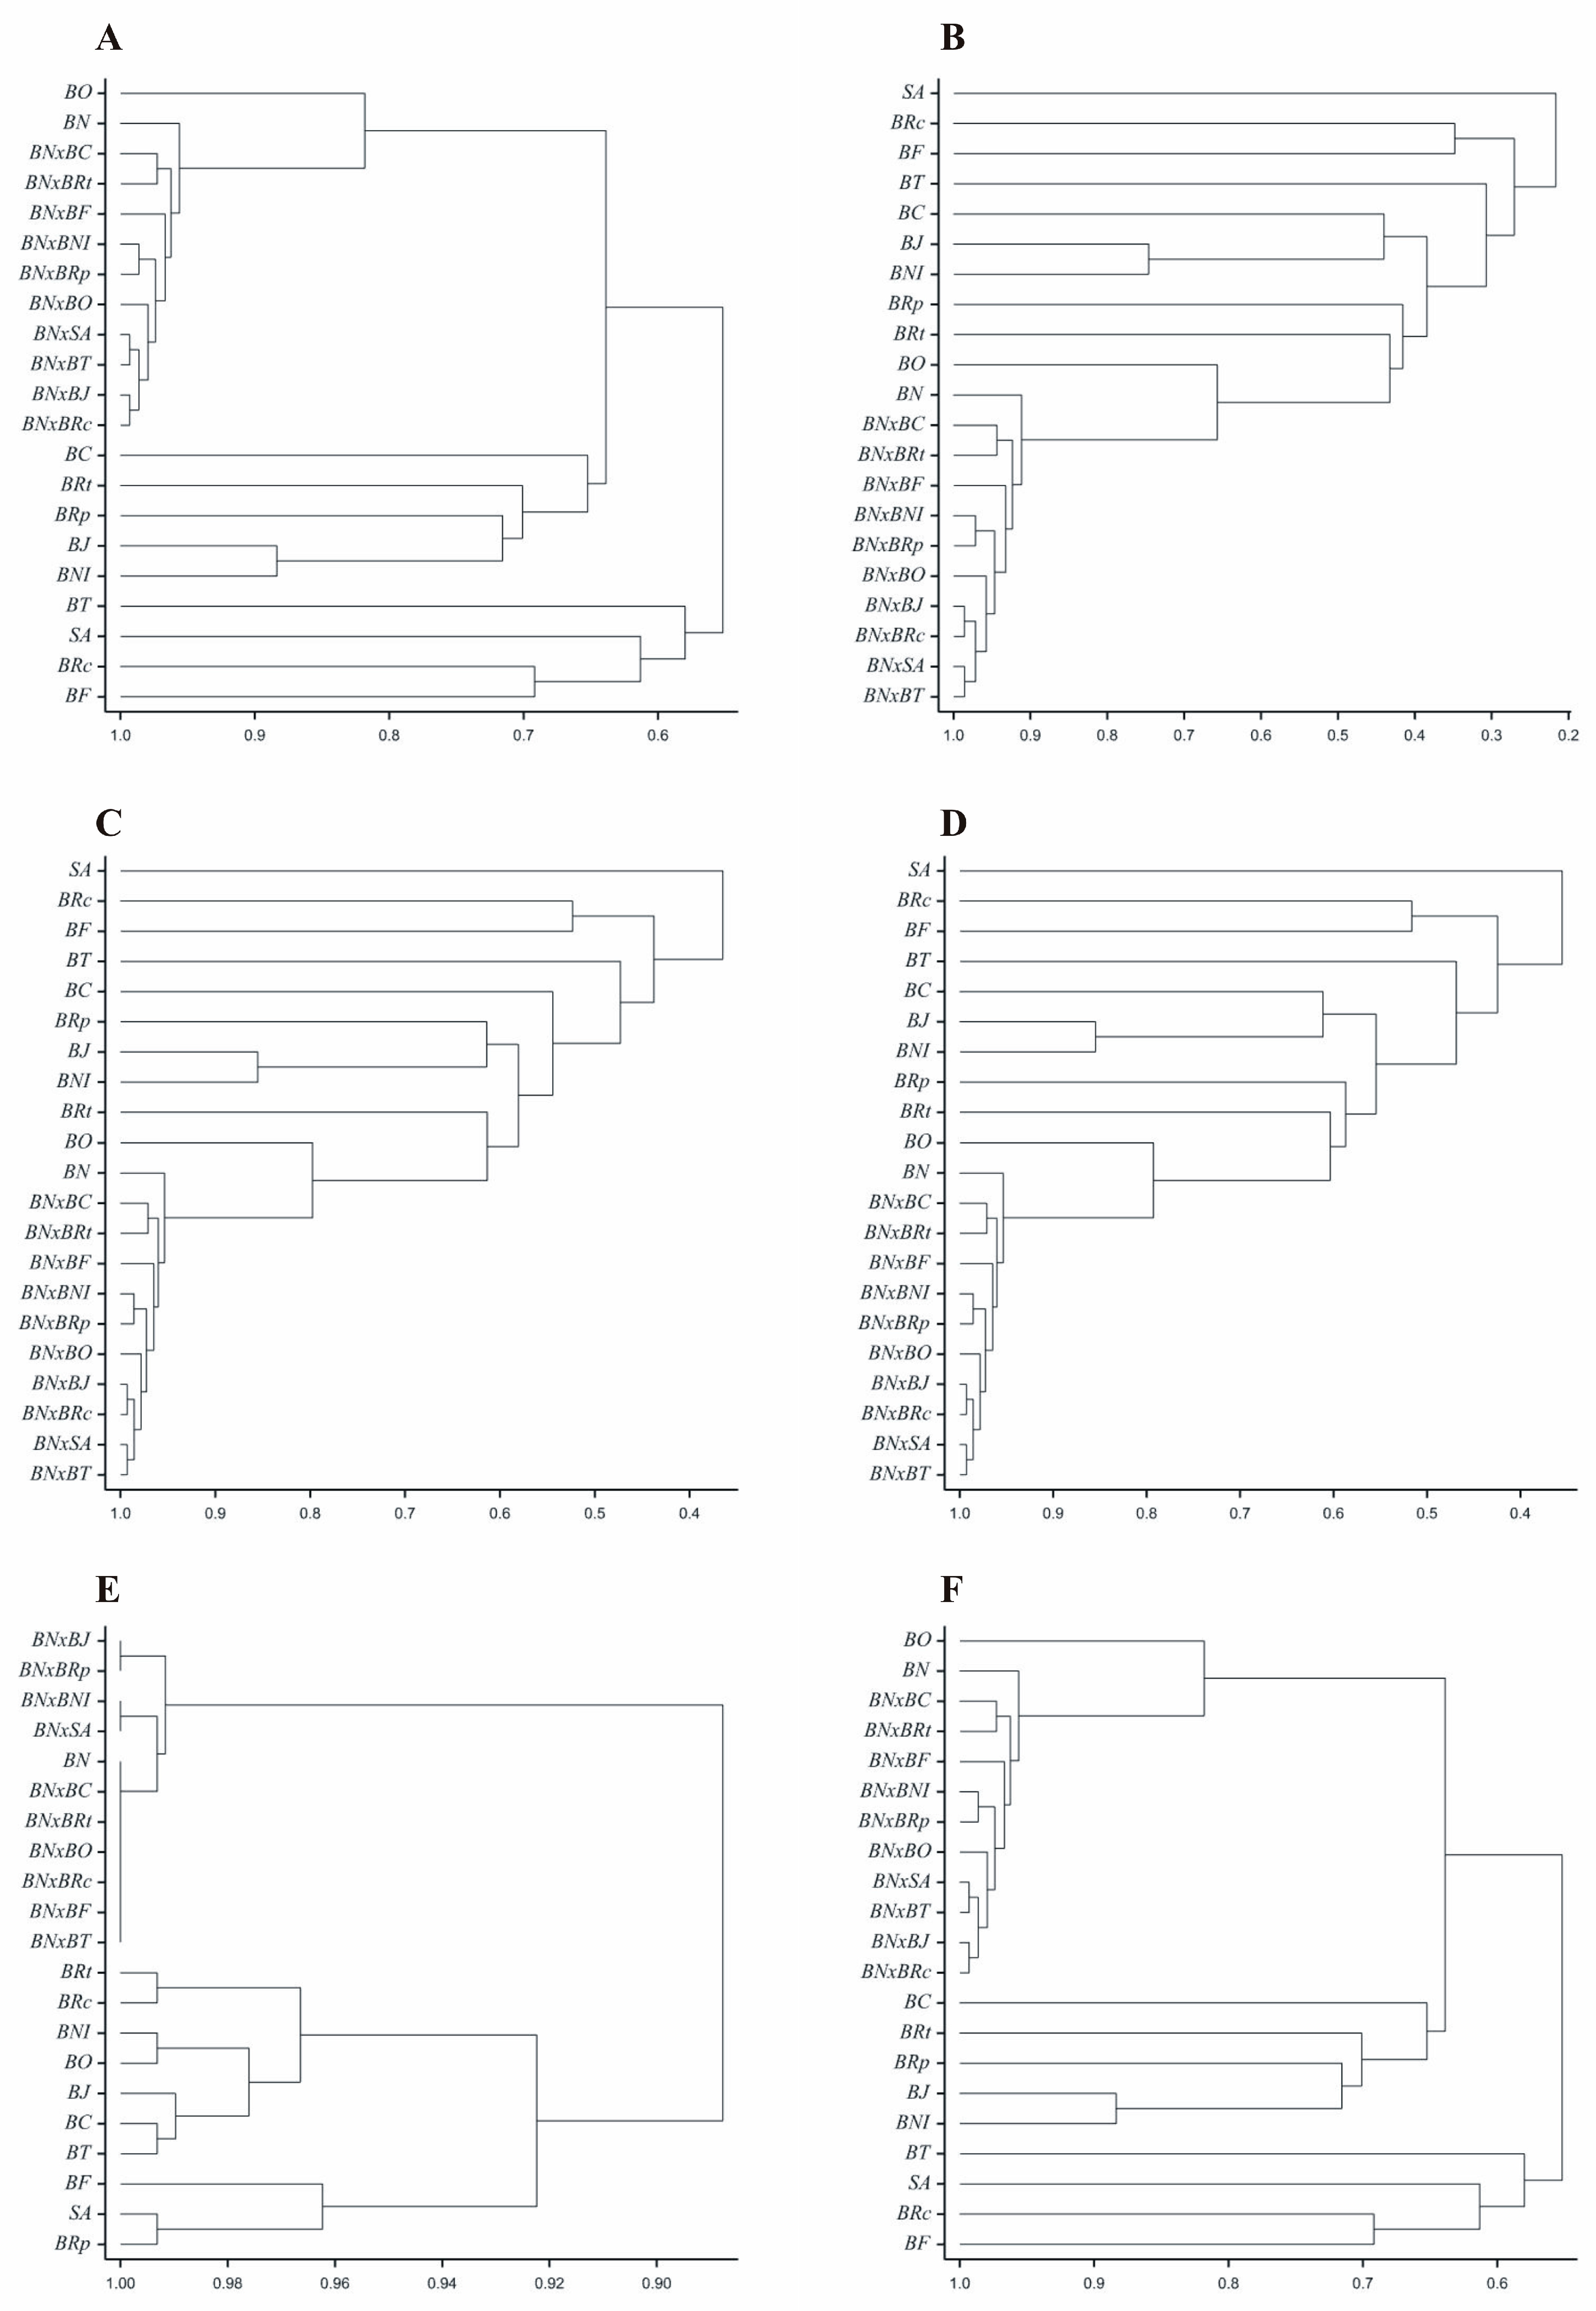
3. Results
4. Discussion
5. Conclusions
Author Contributions
Funding
Institutional Review Board Statement
Informed Consent Statement
Data Availability Statement
Conflicts of Interest
References
- Hoban, S.; Archer, F.I.; Bertola, L.D.; Bragg, J.G.; Breed, M.F.; Bruford, M.W.; Coleman, M.A.; Ekblom, R.; Funk, W.C.; Grueber, C.E.; et al. Global genetic diversity status and trends: Towards a suite of Essential Biodiversity Variables (EBVs) for genetic composition. Biol. Rev. 2022, 97, 1511–1538. [Google Scholar] [CrossRef]
- Salgotra, R.K.; Chauhan, B.S. Genetic Diversity, Conservation, and Utilization of Plant Genetic Resources. Genes 2023, 14, 174. [Google Scholar] [CrossRef] [PubMed]
- Zeng, C.; Rowden, A.A.; Clark, M.R.; Gardner, J.P.A. Species-specific genetic variation in response to deep-sea environmental variation amongst Vulnerable Marine Ecosystem indicator taxa. Sci. Rep. 2020, 10, 2844. [Google Scholar] [CrossRef]
- Singh, H.P.; Raigar, O.P.; Chahota, R.K. Estimation of genetic diversity and its exploitation in plant breeding. Bot. Rev. 2022, 88, 413–435. [Google Scholar] [CrossRef]
- Li, C.; Czyż, E.A.; Halitschke, R.; Baldwin, I.T.; Schaepman, M.E.; Schuman, M.C. Evaluating potential of leaf reflectance spectra to monitor plant genetic variation. Plant Methods 2023, 19, 108. [Google Scholar] [CrossRef]
- Hoban, S.; Bruford, M.W.; da Silva, J.M.; Funk, W.C.; Frankham, R.; Gill, M.J.; Grueber, C.E.; Heuertz, M.; Hunter, M.E.; Kershaw, F.; et al. Genetic diversity goals and targets have improved, but remain insufficient for clear implementation of the post-2020 global biodiversity framework. Conserv. Genet. 2023, 24, 181–191. [Google Scholar] [CrossRef]
- Akbarzai, D.K.; Singh, V.; Yashveer, S.; Nimbal, S.; Kumar, M.; Dalal, M.S.; Mor, V.S.; Devi, S. Evaluation of genetic diversity of wheat (Triticum aestivum) lines under terminal heat stress in the Hisar environment. Sci. Lett. 2023, 11, 59–66. [Google Scholar] [CrossRef]
- Napier, J.D.; Heckman, R.W.; Juenger, T.E. Gene-by-environment interactions in plants: Molecular mechanisms, environmental drivers, and adaptive plasticity. Plant Cell 2023, 35, 109–124. [Google Scholar] [CrossRef]
- Castaneda-Barba, S.; Top, E.M.; Stalder, T. Plasmids, a molecular cornerstone of antimicrobial resistance in the One Health era. Nat. Rev. Microbiol. 2024, 22, 18–32. [Google Scholar] [CrossRef]
- Ashapkin, V.V.; Kutueva, L.I.; Aleksandrushkina, N.I.; Vanyushin, B.F. Epigenetic Mechanisms of Plant Adaptation to Biotic and Abiotic Stresses. Int. J. Mol. Sci. 2020, 21, 7457. [Google Scholar] [CrossRef] [PubMed]
- Shaw, A.K. Causes and consequences of individual variation in animal movement. Mov. Ecol. 2020, 8, 12. [Google Scholar] [CrossRef] [PubMed]
- Moktadir, M.A.; Kumar, A.; Ali, S.M.; Paul, S.K.; Sultana, R.; Rezaei, J. Critical success factors for a circular economy: Implications for business strategy and the environment. Bus. Strategy Environ. 2020, 29, 3611–3635. [Google Scholar] [CrossRef]
- Garant, D. Natural and human-induced environmental changes and their effects on adaptive potential of wild animal populations. Evol. Appl. 2020, 13, 1117–1127. [Google Scholar] [CrossRef] [PubMed]
- Renzi, J.P.; Coyne, C.J.; Berger, J.; von Wettberg, E.; Nelson, M.; Ureta, S.; Hernández, F.; Smýkal, P.; Brus, J. How Could the Use of Crop Wild Relatives in Breeding Increase the Adaptation of Crops to Marginal Environments? Front. Plant Sci. 2022, 13, 886162. [Google Scholar] [CrossRef]
- Raboanatahiry, N.; Li, H.; Yu, L.; Li, M. Rapeseed (Brassica napus): Processing, Utilization, and Genetic Improvement. Agronomy 2021, 11, 1776. [Google Scholar] [CrossRef]
- Fokkema, R.W.; Korsten, P.; Schmoll, T.; Wilson, A.J. Social competition as a driver of phenotype–environment correlations: Implications for ecology and evolution. Biol. Rev. 2021, 96, 2561–2572. [Google Scholar] [CrossRef]
- De Kort, H.; Prunier, J.G.; Ducatez, S.; Honnay, O.; Baguette, M.; Stevens, V.M.; Blanchet, S. Life history, climate and biogeography interactively affect worldwide genetic diversity of plant and animal populations. Nat. Commun. 2021, 12, 516. [Google Scholar] [CrossRef]
- Bell, D.A.; Kovach, R.P.; Robinson, Z.L.; Whiteley, A.R.; Reed, T.E. The ecological causes and consequences of hard and soft selection. Ecol. Lett. 2021, 24, 1505–1521. [Google Scholar] [CrossRef]
- Cohen, I.R.; Marron, A. The evolution of universal adaptations of life is driven by universal properties of matter: Energy, entropy, and interaction. F1000Research 2020, 9, 626. [Google Scholar] [CrossRef]
- Wani, A.K.; Akhtar, N.; Sher, F.; Navarrete, A.A.; Américo-Pinheiro, J.H.P. Microbial adaptation to different environmental conditions: Molecular perspective of evolved genetic and cellular systems. Arch. Microbiol. 2022, 204, 144. [Google Scholar] [CrossRef]
- Nguyen, J.; Lara-Gutiérrez, J.; Stocker, R. Environmental fluctuations and their effects on microbial communities, populations and individuals. FEMS Microbiol. Rev. 2021, 45, fuaa068. [Google Scholar] [CrossRef]
- Swarup, S.; Cargill, E.J.; Crosby, K.; Flagel, L.; Kniskern, J.; Glenn, K.C. Genetic diversity is indispensable for plant breeding to improve crops. Crop Sci. 2021, 61, 839–852. [Google Scholar] [CrossRef]
- Bernardo, R. Reinventing quantitative genetics for plant breeding: Something old, something new, something borrowed, something BLUE. Heredity 2020, 125, 375–385. [Google Scholar] [CrossRef]
- Chen, P.-J.; Antonelli, M. Conceptual Models of Food Choice: Influential Factors Related to Foods, Individual Differences, and Society. Foods 2020, 9, 1898. [Google Scholar] [CrossRef] [PubMed]
- Hoffmann, A.A.; Miller, A.D.; Weeks, A.R. Genetic mixing for population management: From genetic rescue to provenancing. Evol. Appl. 2021, 14, 634–652. [Google Scholar] [CrossRef] [PubMed]
- Naciri, Y.; Linder, H.P. The genetics of evolutionary radiations. Biol. Rev. 2020, 95, 1055–1072. [Google Scholar] [CrossRef]
- Tyulebaev, S.D.; Kadysheva, M.D.; Kosilov, V.I.; Gabidulin, V.M. The state of polymorphism of genes affecting the meat quality in micropopulations of meat simmentals. IOP Conf. Ser. Earth Environ. Sci. 2021, 624, 012045. [Google Scholar] [CrossRef]
- Hu, J.; Chen, B.; Zhao, J.; Zhang, F.; Xie, T.; Xu, K.; Gao, G.; Yan, G.; Li, H.; Li, L.; et al. Genomic selection and genetic architecture of agronomic traits during modern rapeseed breeding. Nat. Genet. 2022, 54, 694–704. [Google Scholar] [CrossRef] [PubMed]
- Gritsenko, D.; Daurova, A.; Pozharskiy, A.; Nizamdinova, G.; Khusnitdinova, M.; Sapakhova, Z.; Daurov, D.; Zhapar, K.; Shamekova, M.; Kalendar, R.; et al. Investigation of mutation load and rate in androgenic mutant lines of rapeseed in early generations evaluated by high-density SNP genotyping. Helion 2023, 9, e14065. [Google Scholar] [CrossRef] [PubMed]
- Bocianowski, J.; Nowosad, K.; Bujak, H. Meta-Analysis of Influence of Diversity of Parental Forms on Heterosis and Specific Combining Ability of Their Hybrids. Appl. Sci. 2023, 13, 8704. [Google Scholar] [CrossRef]
- Tomkowiak, A.; Bocianowski, J.; Kwiatek, M.; Kowalczewski, P.Ł. Dependence of the heterosis effect on genetic distance, determined using various molecular markers. Open Life Sci. 2020, 15, 1–11. [Google Scholar] [CrossRef] [PubMed]
- Demirel, F.; Yıldırım, B.; Eren, B.; Demirel, S.; Türkoğlu, A.; Haliloğlu, K.; Nowosad, K.; Bujak, H.; Bocianowski, J. Revealing Genetic Diversity and Population Structure in Türkiye’s Wheat Germplasm Using iPBS-Retrotransposon Markers. Agronomy 2024, 14, 300. [Google Scholar] [CrossRef]
- Bocianowski, J.; Liersch, A. Multi-environmental evaluation of winter oilseed rape genotypic performance using mixed models. Euphytica 2021, 217, 80. [Google Scholar] [CrossRef]
- Pauls, S.U.; Nowak, C.; Bálint, M.; Pfenninger, M. The impact of global climate change on genetic diversity within populations and species. Mol. Ecol. 2013, 22, 925–946. [Google Scholar] [CrossRef] [PubMed]
- Bernatchez, L. On the maintenance of genetic variation and adaptation to environmental change: Considerations from population genomics in fishes. J. Fish. Biol. 2016, 89, 2519–2556. [Google Scholar] [CrossRef]
- Jablonszky, M.; Canal, D.; Hegyi, G.; Herényi, M.; Laczi, M.; Markó, G.; Nagy, G.; Rosivall, B.; Szöllősi, E.; Török, J.; et al. The estimation of additive genetic variance of body size in a wild passerine is sensitive to the method used to estimate relatedness among the individuals. Ecol. Evol. 2024, 14, e10981. [Google Scholar] [CrossRef]
- Ma, Z.; Li, L.; Zhang, Y.P. Defining Individual-Level Genetic Diversity and Similarity Profiles. Sci. Rep. 2020, 10, 5805. [Google Scholar] [CrossRef]
- Dubois, A.; Ohler, A.; Pyron, R.A. New concepts and methods for phylogenetic taxonomy and nomenclature in zoology, exemplified by a new ranked cladonomy of recent amphibians (Lissamphibia). Megataxa 2021, 5, 001–638. [Google Scholar] [CrossRef]
- Padial, J.M.; De la Riva, I. A paradigm shift in our view of species drives current trends in biological classification. Biol. Rev. 2021, 96, 731–751. [Google Scholar] [CrossRef]
- Kang, J.; Ismail, A.M.; Dehghan, S.; Rajaiya, J.; Allard, M.W.; Lim, H.C.; Dyer, D.W.; Chodosh, J.; Seto, D. Genomics-based re-examination of the taxonomy and phylogeny of human and simian Mastadenoviruses: An evolving whole genomes approach, revealing putative zoonosis, anthroponosis, and amphizoonosis. Cladistics 2020, 36, 358–373. [Google Scholar] [CrossRef]
- Alerstam, T.; Hedenström, A.; Åkesson, S. Long-distance migration: Evolution and determinants. Oikos 2003, 103, 247–260. [Google Scholar] [CrossRef]
- Gómez-Bahamón, V.; Márquez, R.E.; Jahn, A.E.; Miyaki, C.Y.; Tuero, D.T.; Laverde-R, O.; Restrepo, S.; Cadena, C.D. Speciation Associated with Shifts in Migratory Behavior in an Avian Radiation. Curr. Biol. 2020, 30, 1312–1321.E6. [Google Scholar] [CrossRef] [PubMed]
- Queller, D.C.; Goodnight, K.F. Estimating relatedness using genetic markers. Evolution 1989, 43, 258–275. [Google Scholar] [CrossRef]
- Waples, R.S.; Gaggiotti, O. INVITED REVIEW: What is a population? An empirical evaluation of some genetic methods for identifying the number of gene pools and their degree of connectivity. Mol. Ecol. 2006, 15, 1419–1439. [Google Scholar] [CrossRef]
- Heumos, L.; Schaar, A.C.; Lance, C.; Litinetskaya, A.; Drost, F.; Zappia, L.; Lücken, M.D.; Strobl, D.C.; Henao, J.; Curion, F.; et al. Best practices for single-cell analysis across modalities. Nat. Rev. Genet. 2023, 24, 550–572. [Google Scholar] [CrossRef]
- Makanjuola, B.O.; Maltecca, C.; Miglior, F.; Schenkel, F.S.; Baes, C.F. Effect of recent and ancient inbreeding on production and fertility traits in Canadian Holsteins. BMC Genom. 2020, 21, 605. [Google Scholar] [CrossRef]
- Clarke, M.; Thomas, G.H.; Freckleton, R.P. Trait Evolution in Adaptive Radiations: Modeling and Measuring Interspecific Competition on Phylogenies. Am. Nat. 2017, 189, 121–137. [Google Scholar] [CrossRef]
- Vickery, R.K., Jr.; Wullstein, B.M. Comparison of Six Approaches to the Classification of Mimulus Sect. Erythranthe (Scrophulariaceae). Syst. Bot. 1987, 12, 339–364. [Google Scholar] [CrossRef]
- Shor, O.; Yaniv-Rosenfeld, A.; Valevski, A.; Weizman, A.; Khrennikov, A.; Benninger, F. EEG-based spatio-temporal relation signatures for the diagnosis of depression and schizophrenia. Sci. Rep. 2023, 13, 776. [Google Scholar] [CrossRef]
- Szathmary, E.J.E.; Ossenberg, N.S.; Clabeaux, M.S.; Cook, D.C.; Crawford, M.H.; Dumond, D.E.; Hall, R.L.; Harper, A.B.; Hurlich, M.G.; Jamison, P.L.; et al. Are the Biological Differences Between North American Indians and Eskimos Truly Profound? Curr. Anthropol. 1978, 19, 673–701. [Google Scholar] [CrossRef]
- Kaalund, K.; Thoumi, A.; Bhavsar, N.A.; Labrador, A.; Cholera, R. Assessment of Population-Level Disadvantage Indices to Inform Equitable Health Policy. Milbank Q. 2022, 100, 1028–1075. [Google Scholar] [CrossRef] [PubMed]
- Tamura, K.; Nishioka, M.; Hayashi, M.; Zhang, Z.; Lian, C.; Hougetsu, T.; Harada, K. Development of microsatellite markers by ISSR-suppression-PCR method in Brassica rapa. Breed. Sci. 2005, 55, 247–252. [Google Scholar] [CrossRef]
- Havlíčková, L.; Jozová, E.; Rychlá, A.; Klíma, M.; Kučera, V.; Čurn, V. Genetic diversity assessment in winter oilseed rape (Brassica napus L.) collection using AFLP, ISSR and SSR markers. Czech J. Genet. Plant Breed. 2014, 50, 216–225. [Google Scholar] [CrossRef]
- Huangfu, C.; Song, X.; Qiang, S. ISSR variation within and among wild Brassica juncea populations: Implication for herbicide resistance evolution. Genet. Resour. Crop Evol. 2009, 56, 913–924. [Google Scholar] [CrossRef]
- Gower, J.C. A general coefficient of similarity and some of its properties. Biometrics 1971, 27, 857–871. [Google Scholar] [CrossRef]
- Jaccard, P. Nouvelles recherches sur la distribution florale. Bull. Soc. Vaud. Sci. Nat. 1908, 44, 223–270. [Google Scholar]
- Kulczyński, S. Die Pflanzenassoziationen der Pieninen. Bull. Int. L’Académie Pol. Sci. Lett. Cl. Sci. Math. Nat. Ser. B Supplément II 1927, 2, 57–203. [Google Scholar]
- Nei, M. Genetic distance between populations. Am. Nat. 1972, 106, 283–292. [Google Scholar] [CrossRef]
- Rogers, J.S. Measures of genetic similarity and genetic distance. Stud. Genet. Univ. Tex. Publ. 1972, 7213, 145–153. [Google Scholar]
- Sokal, R.R.; Michener, C.D. A statistical method for evaluating systematic relationships. Univ. Kans. Sci. Bull. 1958, 38, 1409–1438. [Google Scholar]
- VSN International. Genstat for Windows, 23rd ed.; VSN International: Hemel Hempstead, UK, 2023. [Google Scholar]
- Mohammadi, S.A.; Prasanna, B.M. Analysis of genetic diversity in crop plants-salient statistical tools and considerations. Crop Sci. 2003, 43, 1235–1248. [Google Scholar] [CrossRef]
- Nei, M.; Li, W. Mathematical model for studying genetic variation in terms of restriction endonucleases. Proc. Natl. Acad. Sci. USA 1979, 76, 5256–5273. [Google Scholar] [CrossRef] [PubMed]
- Liu, J.; Rana, K.; McKay, J.; Xiong, Z.; Yu, F.; Mei, J.; Qian, W. Investigating genetic relationship of Brassica juncea with B. nigra via virtual allopolyploidy and hexaploidy strategy. Mol. Breed. 2021, 41, 5. [Google Scholar] [CrossRef]
- Morillo-Coronado, Y.; Rojas-González, S.; Morillo-Coronado, A.; Castaneda-Cardona, C.; Mendoza-Romero, K.; Marín-Colorado, J. Genetic variability of wild palms Euterpe precatoria, Euterpe oleracea and Mauritia flexuosa with molecular markers ISSR. Rev. de Cienc. Agrícolas 2023, 40, e3212. [Google Scholar] [CrossRef]
- Framarzpour, A.; Abdoli-Nasab, M.; Rezvan Nezhad, E.; Baghizadeh, A. Evaluation of Genetic Diversity of Rapeseed (Brassica napus L.) Cultivars Using SRAP Markers. JAST 2021, 23, 447–456. Available online: http://jast.modares.ac.ir/article-23-32588-en.html (accessed on 21 August 2024).
- Kotwal, S.; Malode, S.N. Protein stability study with respect to mutation in Brassica juncea, Brassica rapa and Brassica napus. J. Oilseed Brassica 2023, 14, 129–134. [Google Scholar]
- Poveda, J.; Zabalgogeazcoa, I.; Soengas, P.; Rodríguez, V.M.; Cartea, M.E.; Abilleira, R.; Velasco, P. Brassica oleracea var. acephala (kale) improvement by biological activity of root endophytic fungi. Sci. Rep. 2020, 10, 20224. [Google Scholar] [CrossRef]
- Rana, N.; Sharma, A.; Rana, R.S.; Lata, H.; Bansuli; Thakur, A.; Singh, V.; Sood, A. Morphological and molecular diversity in mid-late and late maturity genotypes of cauliflower. PLoS ONE 2023, 18, e0290495. [Google Scholar] [CrossRef]
- Lombard, V.; Baril, C.P.; Dubreuil, P.; Blouet, F.; Zhang, D. Genetic Relationships and Fingerprinting of Rapeseed Cultivars by AFLP: Consequences for Varietal Registration. Crop Sci. 2000, 40, 1417–1425. [Google Scholar] [CrossRef]
- Godshalk, E.B.; Lee, M.; Lamkey, K.R. Relationship of restriction fragment length polymorphisms to single-cross hybrid performance of maize. Theor. Appl. Genet. 1990, 80, 273–280. [Google Scholar] [CrossRef]
- Benchimol, L.L.; de Souza, C.L., Jr.; Garcia, A.A.F.; Kono, P.M.S.; Mangolin, C.A.; Barbosa, A.M.M.; Coelho, A.S.G.; de Souza, A.P. Genetic diversity in tropical maize inbred lines: Heterotic group assignment and hybrid performance determined by RFLP markers. Plant Breed. 2000, 119, 491–496. [Google Scholar] [CrossRef]
- Jordan, D.R.; Tao, Y.; Godwin, I.D.; Henzell, R.G.; Cooper, M.; McIntyre, C.L. Prediction of hybrid performance in grain sorghum using RFLP markers. Theor. Appl. Genet. 2003, 106, 559–567. [Google Scholar] [CrossRef] [PubMed]
- Lamboy, W.F. The Accuracy of the Maximum Parsimony Method for Phylogeny Reconstruction with Morphological Characters. Syst. Bot. 1994, 19, 489–505. [Google Scholar] [CrossRef]
- Gauthier, P.; Gouesnard, B.; Dallard, J.; Redaelli, R.; Rebourg, C.; Charcosset, A.; Boyat, A. RFLP diversity and relationships among traditional European maize populations. Theor. Appl. Genet. 2002, 105, 91–99. [Google Scholar] [CrossRef]
- Lombard, V.; Tireau, B.; Blouet, F.; Zhang, D.; Baril, C.P. Usefulness of AFLP markers to estimate varietal homogeneity of rapeseed inbred line varieties in the context of plant registration and protection. Euphytica 2002, 125, 121–127. [Google Scholar] [CrossRef]
- Lee, M.; Godshalk, E.B.; Lamkey, K.R.; Woodman, W.W. Association of Restriction Fragment Length Polymorphisms among maize inbreds with agronomic performance of their crosses. Crop Sci. 1989, 29, 1067–1071. [Google Scholar] [CrossRef]
- Dudley, J.W.; Saghai Maroof, M.A.; Rufener, G.K. Molecular markers and grouping of parents in maize breeding programs. Crop Sci. 1991, 31, 718–723. [Google Scholar] [CrossRef]
- Bocianowski, J. Przegląd statystycznych sposobów estymacji zróżnicowania genetycznego. Postępy Nauk. Rol. 2006, 3, 69–79. [Google Scholar]
- Bocianowski, J.; Stępień, Ł. Porównanie pięciu miar zróżnicowania genetycznego polskich odmian pszenicy ocenianych na podstawie danych z analiz markerów mikrosatelitarnych. Biul. IHAR 2006, 242, 27–32. [Google Scholar]
- Duarte, J.M.; dos Santos, J.B.; Melo, L.C. Comparison of similarity coefficients based on RAPD markers in the common bean. Genet. Mol. Biol. 1999, 22, 427–432. [Google Scholar] [CrossRef]
- Liersch, A.; Bocianowski, J.; Kozak, M.; Bartkowiak-Broda, I. Comparison of isozyme, RAPD and AFLP markers in genetic similarity assessment of CMS ogura F1 hybrids of winter oilseed rape (Brassica napus L.) parental lines. Acta Biol. Cracov. Ser. Bot. 2013, 55, 49–57. [Google Scholar] [CrossRef]


| Maternal Form | Paternal Forms | Hybrids of F2 Generation |
|---|---|---|
| Brassica napus (BN) | Brassica carinata (BC) | B. napus × B. carinata (BN × BC) |
| Brassica rapa ssp. trilocularis (BRt) | B. napus × B. rapa ssp. trilocularis (BN × BRt) | |
| Brassica rapa ssp. chinensis (BRc) | B. napusx × B. rapa ssp. chinensis (BN × BRc) | |
| Brassica fruticulosa (BF) | B. napus × B. fruticulosa (BN × BF) | |
| Brassica rapa ssp. pekinensis (BRp) | B. napus × B. rapa ssp. pekinensis (BN × BRp) | |
| Brassica nigra (BNI) | B. napus × B. nigra (BN × BNI) | |
| Brassica juncea (BJ) | B. napus × B. juncea (BN × BJ) | |
| Sinapis alba (SA) | B. napus × S. alba (BN × SA) | |
| Brassica tournefortii (BT) | B. napus × B. rapa ssp. tournefortii (BN × BT) | |
| Brassica oleracea var. alboglabra (BO) | B. napus × B. oleracea var. alboglabra (BN × BO) |
| Reaction Profile | Primers | Parameters | Temperature | Number of Cycles | Source |
|---|---|---|---|---|---|
| 1 | mstg 1, mstg 4, mstg 12, mstg 13, mstg 38 | Initial denaturation | 94 °C 30 s | ×1 | [52] |
| Denaturation | 94 °C 30 s | ×40 | |||
| Primers annealing | 60 °C * 30 s | ||||
| Elongation | 72 °C 1 min | ||||
| Final elongation | 72 °C 5 min | ×1 | |||
| 2 | UBC812, UBC840, UBC845 | Initial denaturation | 95 °C 2 min | ×1 | [53] |
| Denaturation | 93 °C 20 s | ×40 | |||
| Primers annealing | 52 °C * 1 min | ||||
| Elongation | 72 °C 20 s | ||||
| Final elongation | 72 °C 6 min | ×1 | |||
| 3 | UBC891, ISSR-840, ISSR-856, ISSR-857, ISSR-887, ISSR-888, ISSR-889, ISSR-890, scm51, P1, P2, P4, P5 | Initial denaturation | 94 °C 5 min | ×1 | [54] |
| Denaturation | 94 °C 45 s | ×35 | |||
| Primers annealing | 50 °C * 45 s | ||||
| Elongation | 72 °C 90 s | ||||
| Final elongation | 72 °C 7 min | ×1 |
| ISSR Primer | Sequence 5′-3′ | Annealing Temperature [°C] |
|---|---|---|
| mstg 1 | (TA)3(TG)9 | 53.9 |
| mstg 4 | (TA)3(TG)10 | 60 |
| mstg 12 | (TG)7 | 54 |
| mstg 13 | (TG)7CG(TG)2 | 59.7 |
| mstg 38 | (TG)3TT(TG)5 | 53.9 |
| UBC835 | (AG)8YC | 51.5 |
| UBC843 | (CT)8RA | 48.1 |
| UBC889 | DBD(AC)7 | 51.5 |
| UBC891 | HVH(TG)7 | 51.5 |
| scm 51 | (AGG)5 | 52.8 |
| P1 | GAG(CAA)5 | 49.7 |
| P2 | CTG(GT)8 | 56.5 |
| P4 | (AG)8GTG | 52.8 |
| P5 | (GA)8ACC | 51.5 |
| ISSR-840 | (GA)8YT | 48.4 |
| ISSR-856 | (GA)8YA | 48.4 |
| ISSR-857 | (GA)8YG | 55.3 |
| ISSR-887 | DVD(TC)7 | 47.8 |
| ISSR-888 | BDB(CA)7 | 48.4 |
| ISSR-889 | DBD(AC)7 | 48.1 |
| ISSR-890 | VHV(GT)7 | 48.4 |
| Genetic Similarity Measure | Minimal Value | Mean Value | Maximum Value | Coefficient of Variability [in %] |
|---|---|---|---|---|
| Euclidean | 0.486 | 0.709 | 0.993 | 24.21 |
| Jaccard | 0.157 | 0.508 | 0.986 | 54.15 |
| Kulczyński | 0.275 | 0.640 | 0.993 | 34.46 |
| Nei | 0.272 | 0.633 | 0.993 | 35.43 |
| Rogers | 0.801 | 0.929 | 1.000 | 6.14 |
| Sokal and Michener | 0.486 | 0.709 | 0.993 | 24.21 |
| Genotype | BN | BC | BRt | BJ | BNI | BO | BRc | SA | BRp | BF | BT | BN × BC | BN × BRt | BN × BJ | BN × BNI | BN × BO | BN × BRc | BN × SA | BN × BRp | BN × BF | BN × BT |
|---|---|---|---|---|---|---|---|---|---|---|---|---|---|---|---|---|---|---|---|---|---|
| BN | 1.000 | 0.596 | 0.658 | 0.603 | 0.610 | 0.808 | 0.541 | 0.486 | 0.644 | 0.534 | 0.562 | 0.959 | 0.959 | 0.952 | 0.952 | 0.945 | 0.959 | 0.952 | 0.966 | 0.959 | 0.959 |
| BC | 0.359 | 1.000 | 0.582 | 0.692 | 0.699 | 0.610 | 0.658 | 0.548 | 0.637 | 0.637 | 0.500 | 0.637 | 0.637 | 0.603 | 0.603 | 0.596 | 0.596 | 0.603 | 0.616 | 0.610 | 0.610 |
| BRt | 0.419 | 0.282 | 1.000 | 0.685 | 0.706 | 0.644 | 0.555 | 0.555 | 0.712 | 0.589 | 0.521 | 0.671 | 0.671 | 0.678 | 0.678 | 0.671 | 0.685 | 0.692 | 0.664 | 0.658 | 0.685 |
| BJ | 0.370 | 0.430 | 0.410 | 1.000 | 0.884 | 0.616 | 0.623 | 0.486 | 0.712 | 0.630 | 0.589 | 0.616 | 0.616 | 0.637 | 0.623 | 0.644 | 0.630 | 0.623 | 0.623 | 0.616 | 0.630 |
| BNI | 0.387 | 0.450 | 0.449 | 0.746 | 1.000 | 0.610 | 0.658 | 0.521 | 0.719 | 0.623 | 0.582 | 0.610 | 0.623 | 0.630 | 0.603 | 0.610 | 0.623 | 0.616 | 0.616 | 0.610 | 0.623 |
| BO | 0.641 | 0.337 | 0.366 | 0.349 | 0.352 | 1.000 | 0.527 | 0.541 | 0.699 | 0.589 | 0.589 | 0.795 | 0.795 | 0.829 | 0.829 | 0.836 | 0.836 | 0.829 | 0.815 | 0.808 | 0.822 |
| BRc | 0.287 | 0.367 | 0.235 | 0.329 | 0.383 | 0.233 | 1.000 | 0.575 | 0.596 | 0.692 | 0.555 | 0.555 | 0.541 | 0.507 | 0.534 | 0.514 | 0.514 | 0.521 | 0.548 | 0.541 | 0.527 |
| SA | 0.211 | 0.214 | 0.207 | 0.157 | 0.205 | 0.221 | 0.225 | 1.000 | 0.569 | 0.651 | 0.527 | 0.500 | 0.500 | 0.493 | 0.507 | 0.500 | 0.500 | 0.507 | 0.493 | 0.514 | 0.500 |
| BRp | 0.381 | 0.321 | 0.409 | 0.425 | 0.446 | 0.413 | 0.253 | 0.192 | 1.000 | 0.671 | 0.658 | 0.658 | 0.671 | 0.678 | 0.678 | 0.685 | 0.685 | 0.692 | 0.664 | 0.658 | 0.685 |
| BF | 0.236 | 0.293 | 0.221 | 0.290 | 0.295 | 0.250 | 0.348 | 0.261 | 0.294 | 1.000 | 0.658 | 0.562 | 0.548 | 0.527 | 0.541 | 0.534 | 0.534 | 0.541 | 0.541 | 0.548 | 0.548 |
| BT | 0.319 | 0.207 | 0.214 | 0.302 | 0.307 | 0.310 | 0.244 | 0.188 | 0.342 | 0.315 | 1.000 | 0.548 | 0.562 | 0.555 | 0.582 | 0.575 | 0.562 | 0.569 | 0.569 | 0.562 | 0.562 |
| BN × BC | 0.917 | 0.405 | 0.435 | 0.385 | 0.387 | 0.620 | 0.301 | 0.223 | 0.398 | 0.264 | 0.305 | 1.000 | 0.973 | 0.952 | 0.966 | 0.945 | 0.959 | 0.966 | 0.980 | 0.959 | 0.973 |
| BN × BRt | 0.917 | 0.405 | 0.435 | 0.385 | 0.402 | 0.620 | 0.287 | 0.223 | 0.415 | 0.250 | 0.319 | 0.944 | 1.000 | 0.952 | 0.966 | 0.945 | 0.959 | 0.966 | 0.980 | 0.959 | 0.973 |
| BN × BJ | 0.904 | 0.370 | 0.447 | 0.411 | 0.413 | 0.675 | 0.258 | 0.221 | 0.427 | 0.233 | 0.316 | 0.904 | 0.904 | 1.000 | 0.973 | 0.980 | 0.993 | 0.986 | 0.959 | 0.966 | 0.980 |
| BN × BNI | 0.903 | 0.363 | 0.441 | 0.389 | 0.376 | 0.671 | 0.277 | 0.226 | 0.420 | 0.239 | 0.337 | 0.930 | 0.930 | 0.944 | 1.000 | 0.980 | 0.980 | 0.986 | 0.986 | 0.966 | 0.980 |
| BN × BO | 0.890 | 0.359 | 0.435 | 0.416 | 0.387 | 0.684 | 0.260 | 0.223 | 0.432 | 0.236 | 0.333 | 0.890 | 0.890 | 0.958 | 0.957 | 1.000 | 0.986 | 0.980 | 0.966 | 0.959 | 0.973 |
| BN × BRc | 0.917 | 0.359 | 0.452 | 0.400 | 0.402 | 0.684 | 0.260 | 0.223 | 0.432 | 0.236 | 0.319 | 0.917 | 0.917 | 0.986 | 0.957 | 0.971 | 1.000 | 0.993 | 0.966 | 0.973 | 0.986 |
| BN × SA | 0.903 | 0.363 | 0.458 | 0.389 | 0.391 | 0.671 | 0.263 | 0.226 | 0.438 | 0.239 | 0.323 | 0.930 | 0.930 | 0.971 | 0.971 | 0.957 | 0.986 | 1.000 | 0.973 | 0.966 | 0.993 |
| BN × BRp | 0.931 | 0.385 | 0.430 | 0.396 | 0.398 | 0.654 | 0.298 | 0.221 | 0.410 | 0.247 | 0.330 | 0.958 | 0.958 | 0.918 | 0.971 | 0.931 | 0.931 | 0.944 | 1.000 | 0.966 | 0.980 |
| BN × BF | 0.917 | 0.374 | 0.419 | 0.385 | 0.387 | 0.641 | 0.287 | 0.237 | 0.398 | 0.250 | 0.319 | 0.917 | 0.917 | 0.931 | 0.930 | 0.917 | 0.944 | 0.930 | 0.931 | 1.000 | 0.973 |
| BN × BT | 0.917 | 0.374 | 0.452 | 0.400 | 0.402 | 0.662 | 0.274 | 0.223 | 0.432 | 0.250 | 0.319 | 0.944 | 0.944 | 0.958 | 0.957 | 0.944 | 0.971 | 0.986 | 0.958 | 0.944 | 1.000 |
| Genotype | BN | BC | BRt | BJ | BNI | BO | BRc | SA | BRp | BF | BT | BN × BC | BN × BRt | BN × BJ | BN × BNI | BN × BO | BN × BRc | BN × SA | BN × BRp | BN × BF | BN × BT |
|---|---|---|---|---|---|---|---|---|---|---|---|---|---|---|---|---|---|---|---|---|---|
| BN | 1.000 | 0.534 | 0.601 | 0.545 | 0.561 | 0.786 | 0.455 | 0.362 | 0.572 | 0.408 | 0.490 | 0.957 | 0.957 | 0.950 | 0.949 | 0.942 | 0.957 | 0.949 | 0.964 | 0.957 | 0.957 |
| BC | 0.528 | 1.000 | 0.441 | 0.602 | 0.621 | 0.505 | 0.538 | 0.356 | 0.489 | 0.465 | 0.342 | 0.582 | 0.582 | 0.546 | 0.537 | 0.534 | 0.534 | 0.537 | 0.563 | 0.550 | 0.550 |
| BRt | 0.590 | 0.440 | 1.000 | 0.583 | 0.622 | 0.537 | 0.381 | 0.345 | 0.582 | 0.368 | 0.352 | 0.617 | 0.617 | 0.630 | 0.621 | 0.617 | 0.634 | 0.638 | 0.613 | 0.601 | 0.634 |
| BJ | 0.540 | 0.602 | 0.582 | 1.000 | 0.855 | 0.517 | 0.497 | 0.275 | 0.602 | 0.461 | 0.464 | 0.561 | 0.561 | 0.589 | 0.564 | 0.593 | 0.577 | 0.564 | 0.573 | 0.561 | 0.577 |
| BNI | 0.558 | 0.621 | 0.620 | 0.855 | 1.000 | 0.521 | 0.556 | 0.346 | 0.626 | 0.472 | 0.471 | 0.561 | 0.576 | 0.588 | 0.549 | 0.561 | 0.576 | 0.565 | 0.573 | 0.561 | 0.576 |
| BO | 0.781 | 0.504 | 0.536 | 0.517 | 0.521 | 1.000 | 0.380 | 0.368 | 0.593 | 0.413 | 0.474 | 0.770 | 0.770 | 0.812 | 0.807 | 0.818 | 0.818 | 0.807 | 0.797 | 0.786 | 0.802 |
| BRc | 0.446 | 0.537 | 0.381 | 0.495 | 0.554 | 0.378 | 1.000 | 0.369 | 0.405 | 0.524 | 0.393 | 0.472 | 0.455 | 0.419 | 0.441 | 0.422 | 0.422 | 0.424 | 0.469 | 0.455 | 0.438 |
| SA | 0.348 | 0.353 | 0.343 | 0.272 | 0.340 | 0.362 | 0.367 | 1.000 | 0.323 | 0.415 | 0.319 | 0.380 | 0.380 | 0.378 | 0.383 | 0.380 | 0.380 | 0.383 | 0.378 | 0.399 | 0.380 |
| BRp | 0.552 | 0.485 | 0.580 | 0.596 | 0.617 | 0.585 | 0.404 | 0.323 | 1.000 | 0.457 | 0.513 | 0.590 | 0.608 | 0.622 | 0.612 | 0.626 | 0.626 | 0.630 | 0.605 | 0.590 | 0.626 |
| BF | 0.382 | 0.454 | 0.362 | 0.449 | 0.455 | 0.400 | 0.516 | 0.414 | 0.455 | 1.000 | 0.490 | 0.447 | 0.428 | 0.406 | 0.411 | 0.408 | 0.408 | 0.411 | 0.425 | 0.428 | 0.428 |
| BT | 0.484 | 0.342 | 0.352 | 0.464 | 0.470 | 0.474 | 0.393 | 0.317 | 0.510 | 0.479 | 1.000 | 0.474 | 0.490 | 0.487 | 0.510 | 0.507 | 0.490 | 0.493 | 0.503 | 0.490 | 0.490 |
| BN × BC | 0.957 | 0.576 | 0.607 | 0.556 | 0.558 | 0.766 | 0.463 | 0.365 | 0.569 | 0.418 | 0.468 | 1.000 | 0.971 | 0.950 | 0.964 | 0.942 | 0.957 | 0.964 | 0.979 | 0.957 | 0.971 |
| BN × BRt | 0.957 | 0.576 | 0.607 | 0.556 | 0.574 | 0.766 | 0.446 | 0.365 | 0.586 | 0.400 | 0.484 | 0.971 | 1.000 | 0.950 | 0.964 | 0.942 | 0.957 | 0.964 | 0.979 | 0.957 | 0.971 |
| BN × BJ | 0.950 | 0.540 | 0.618 | 0.583 | 0.585 | 0.806 | 0.410 | 0.362 | 0.598 | 0.378 | 0.480 | 0.950 | 0.950 | 1.000 | 0.971 | 0.979 | 0.993 | 0.986 | 0.957 | 0.964 | 0.979 |
| BN × BNI | 0.949 | 0.532 | 0.612 | 0.560 | 0.547 | 0.803 | 0.433 | 0.368 | 0.591 | 0.385 | 0.504 | 0.964 | 0.964 | 0.971 | 1.000 | 0.978 | 0.978 | 0.985 | 0.986 | 0.964 | 0.978 |
| BN × BO | 0.942 | 0.528 | 0.607 | 0.587 | 0.558 | 0.813 | 0.413 | 0.365 | 0.603 | 0.382 | 0.500 | 0.942 | 0.942 | 0.978 | 0.978 | 1.000 | 0.986 | 0.978 | 0.964 | 0.957 | 0.971 |
| BN × BRc | 0.957 | 0.528 | 0.623 | 0.571 | 0.574 | 0.813 | 0.413 | 0.365 | 0.603 | 0.382 | 0.484 | 0.957 | 0.957 | 0.993 | 0.978 | 0.986 | 1.000 | 0.993 | 0.964 | 0.971 | 0.986 |
| BN × SA | 0.949 | 0.532 | 0.628 | 0.560 | 0.563 | 0.803 | 0.417 | 0.368 | 0.609 | 0.385 | 0.488 | 0.964 | 0.964 | 0.986 | 0.985 | 0.978 | 0.993 | 1.000 | 0.971 | 0.964 | 0.993 |
| BN × BRp | 0.964 | 0.556 | 0.602 | 0.567 | 0.569 | 0.791 | 0.459 | 0.362 | 0.581 | 0.396 | 0.496 | 0.978 | 0.978 | 0.957 | 0.986 | 0.964 | 0.964 | 0.971 | 1.000 | 0.964 | 0.979 |
| BN × BF | 0.957 | 0.544 | 0.590 | 0.556 | 0.558 | 0.781 | 0.446 | 0.383 | 0.569 | 0.400 | 0.484 | 0.957 | 0.957 | 0.964 | 0.964 | 0.957 | 0.971 | 0.964 | 0.964 | 1.000 | 0.971 |
| BN × BT | 0.957 | 0.544 | 0.623 | 0.571 | 0.574 | 0.797 | 0.430 | 0.365 | 0.603 | 0.400 | 0.484 | 0.971 | 0.971 | 0.978 | 0.978 | 0.971 | 0.986 | 0.993 | 0.978 | 0.971 | 1.000 |
| Genotype | BN | BC | BRt | BJ | BNI | BO | BRc | SA | BRp | BF | BT | BN × BC | BN × BRt | BN × BJ | BN × BNI | BN × BO | BN × BRc | BN × SA | BN × BRp | BN × BF | BN × BT |
|---|---|---|---|---|---|---|---|---|---|---|---|---|---|---|---|---|---|---|---|---|---|
| BN | 1.000 | 0.911 | 0.890 | 0.918 | 0.938 | 0.932 | 0.884 | 0.843 | 0.849 | 0.808 | 0.904 | 1.000 | 1.000 | 0.993 | 0.993 | 1.000 | 1.000 | 0.993 | 0.993 | 1.000 | 1.000 |
| BC | 0.596 | 1.000 | 0.980 | 0.993 | 0.973 | 0.980 | 0.973 | 0.932 | 0.938 | 0.897 | 0.993 | 0.911 | 0.911 | 0.904 | 0.918 | 0.911 | 0.911 | 0.918 | 0.904 | 0.911 | 0.911 |
| BRt | 0.658 | 0.582 | 1.000 | 0.973 | 0.952 | 0.959 | 0.993 | 0.952 | 0.959 | 0.918 | 0.986 | 0.890 | 0.890 | 0.884 | 0.897 | 0.890 | 0.890 | 0.897 | 0.884 | 0.890 | 0.890 |
| BJ | 0.603 | 0.692 | 0.685 | 1.000 | 0.980 | 0.986 | 0.966 | 0.925 | 0.932 | 0.890 | 0.986 | 0.918 | 0.918 | 0.911 | 0.925 | 0.918 | 0.918 | 0.925 | 0.911 | 0.918 | 0.918 |
| BNI | 0.610 | 0.699 | 0.706 | 0.884 | 1.000 | 0.993 | 0.945 | 0.904 | 0.911 | 0.870 | 0.966 | 0.938 | 0.938 | 0.932 | 0.945 | 0.938 | 0.938 | 0.945 | 0.932 | 0.938 | 0.938 |
| BO | 0.808 | 0.610 | 0.644 | 0.616 | 0.610 | 1.000 | 0.952 | 0.911 | 0.918 | 0.877 | 0.973 | 0.932 | 0.932 | 0.925 | 0.938 | 0.932 | 0.932 | 0.938 | 0.925 | 0.932 | 0.932 |
| BRc | 0.541 | 0.658 | 0.555 | 0.623 | 0.658 | 0.527 | 1.000 | 0.959 | 0.966 | 0.925 | 0.980 | 0.884 | 0.884 | 0.877 | 0.890 | 0.884 | 0.884 | 0.890 | 0.877 | 0.884 | 0.884 |
| SA | 0.486 | 0.548 | 0.555 | 0.486 | 0.521 | 0.541 | 0.575 | 1.000 | 0.993 | 0.966 | 0.938 | 0.843 | 0.843 | 0.836 | 0.849 | 0.843 | 0.843 | 0.849 | 0.836 | 0.843 | 0.843 |
| BRp | 0.644 | 0.637 | 0.712 | 0.712 | 0.719 | 0.699 | 0.596 | 0.569 | 1.000 | 0.959 | 0.945 | 0.849 | 0.849 | 0.843 | 0.856 | 0.849 | 0.849 | 0.856 | 0.843 | 0.849 | 0.849 |
| BF | 0.534 | 0.637 | 0.589 | 0.630 | 0.623 | 0.589 | 0.692 | 0.651 | 0.671 | 1.000 | 0.904 | 0.808 | 0.808 | 0.801 | 0.815 | 0.808 | 0.808 | 0.815 | 0.801 | 0.808 | 0.808 |
| BT | 0.562 | 0.500 | 0.521 | 0.589 | 0.582 | 0.589 | 0.555 | 0.527 | 0.658 | 0.658 | 1.000 | 0.904 | 0.904 | 0.897 | 0.911 | 0.904 | 0.904 | 0.911 | 0.897 | 0.904 | 0.904 |
| BN × BC | 0.959 | 0.637 | 0.671 | 0.616 | 0.610 | 0.795 | 0.555 | 0.500 | 0.658 | 0.562 | 0.548 | 1.000 | 1.000 | 0.993 | 0.993 | 1.000 | 1.000 | 0.993 | 0.993 | 1.000 | 1.000 |
| BN × BRt | 0.959 | 0.637 | 0.671 | 0.616 | 0.623 | 0.795 | 0.541 | 0.500 | 0.671 | 0.548 | 0.562 | 0.973 | 1.000 | 0.993 | 0.993 | 1.000 | 1.000 | 0.993 | 0.993 | 1.000 | 1.000 |
| BN × BJ | 0.952 | 0.603 | 0.678 | 0.637 | 0.630 | 0.829 | 0.507 | 0.493 | 0.678 | 0.527 | 0.555 | 0.952 | 0.952 | 1.000 | 0.986 | 0.993 | 0.993 | 0.986 | 1.000 | 0.993 | 0.993 |
| BN × BNI | 0.952 | 0.603 | 0.678 | 0.623 | 0.603 | 0.829 | 0.534 | 0.507 | 0.678 | 0.541 | 0.582 | 0.966 | 0.966 | 0.973 | 1.000 | 0.993 | 0.993 | 1.000 | 0.986 | 0.993 | 0.993 |
| BN × BO | 0.945 | 0.596 | 0.671 | 0.644 | 0.610 | 0.836 | 0.514 | 0.500 | 0.685 | 0.534 | 0.575 | 0.945 | 0.945 | 0.980 | 0.980 | 1.000 | 1.000 | 0.993 | 0.993 | 1.000 | 1.000 |
| BN × BRc | 0.959 | 0.596 | 0.685 | 0.630 | 0.623 | 0.836 | 0.514 | 0.500 | 0.685 | 0.534 | 0.562 | 0.959 | 0.959 | 0.993 | 0.980 | 0.986 | 1.000 | 0.993 | 0.993 | 1.000 | 1.000 |
| BN × SA | 0.952 | 0.603 | 0.692 | 0.623 | 0.616 | 0.829 | 0.521 | 0.507 | 0.692 | 0.541 | 0.569 | 0.966 | 0.966 | 0.986 | 0.986 | 0.980 | 0.993 | 1.000 | 0.986 | 0.993 | 0.993 |
| BN × BRp | 0.966 | 0.616 | 0.664 | 0.623 | 0.616 | 0.815 | 0.548 | 0.493 | 0.664 | 0.541 | 0.569 | 0.980 | 0.980 | 0.959 | 0.986 | 0.966 | 0.966 | 0.973 | 1.000 | 0.993 | 0.993 |
| BN × BF | 0.959 | 0.610 | 0.658 | 0.616 | 0.610 | 0.808 | 0.541 | 0.514 | 0.658 | 0.548 | 0.562 | 0.959 | 0.959 | 0.966 | 0.966 | 0.959 | 0.973 | 0.966 | 0.966 | 1.000 | 1.000 |
| BN × BT | 0.959 | 0.610 | 0.685 | 0.630 | 0.623 | 0.822 | 0.527 | 0.500 | 0.685 | 0.548 | 0.562 | 0.973 | 0.973 | 0.980 | 0.980 | 0.973 | 0.986 | 0.993 | 0.980 | 0.973 | 1.000 |
Disclaimer/Publisher’s Note: The statements, opinions and data contained in all publications are solely those of the individual author(s) and contributor(s) and not of MDPI and/or the editor(s). MDPI and/or the editor(s) disclaim responsibility for any injury to people or property resulting from any ideas, methods, instructions or products referred to in the content. |
© 2024 by the authors. Licensee MDPI, Basel, Switzerland. This article is an open access article distributed under the terms and conditions of the Creative Commons Attribution (CC BY) license (https://creativecommons.org/licenses/by/4.0/).
Share and Cite
Bocianowski, J.; Niemann, J.; Jagieniak, A.; Szwarc, J. Comparison of Six Measures of Genetic Similarity of Interspecific Brassicaceae Hybrids F2 Generation and Their Parental Forms Estimated on the Basis of ISSR Markers. Genes 2024, 15, 1114. https://doi.org/10.3390/genes15091114
Bocianowski J, Niemann J, Jagieniak A, Szwarc J. Comparison of Six Measures of Genetic Similarity of Interspecific Brassicaceae Hybrids F2 Generation and Their Parental Forms Estimated on the Basis of ISSR Markers. Genes. 2024; 15(9):1114. https://doi.org/10.3390/genes15091114
Chicago/Turabian StyleBocianowski, Jan, Janetta Niemann, Anna Jagieniak, and Justyna Szwarc. 2024. "Comparison of Six Measures of Genetic Similarity of Interspecific Brassicaceae Hybrids F2 Generation and Their Parental Forms Estimated on the Basis of ISSR Markers" Genes 15, no. 9: 1114. https://doi.org/10.3390/genes15091114
APA StyleBocianowski, J., Niemann, J., Jagieniak, A., & Szwarc, J. (2024). Comparison of Six Measures of Genetic Similarity of Interspecific Brassicaceae Hybrids F2 Generation and Their Parental Forms Estimated on the Basis of ISSR Markers. Genes, 15(9), 1114. https://doi.org/10.3390/genes15091114