Abstract
The problem of soil salinization has seriously hindered agricultural development. Cotton is a pioneering salinity-tolerant crop, so harvesting its key salinity-tolerant genes is important for improving crop salt tolerance. In this study, we analyzed changes in the transcriptome expression profiles of the salt-tolerant cultivar Lu Mian 28 (LM) and the salt-sensitive cultivar Zhong Mian Suo 12 (ZMS) after applying salt stress, and we constructed weighted gene co-expression networks (WGCNA). The results indicated that photosynthesis, amino acid biosynthesis, membrane lipid remodeling, autophagy, and ROS scavenging are key pathways in the salt stress response. Plant–pathogen interactions, plant hormone signal transduction, the mitogen-activated protein kinase (MAPK) signaling pathway, and carotenoid biosynthesis are the regulatory networks associated with these metabolic pathways that confer cotton salt tolerance. The gene-weighted co-expression network was used to screen four modules closely related to traits, identifying 114 transcription factors, including WRKYs, ERFs, NACs, bHLHs, bZIPs, and MYBs, and 11 hub genes. This study provides a reference for acquiring salt-tolerant cotton and abundant genetic resources for molecular breeding.
1. Introduction
Soil salinization is an escalating global concern, with detrimental effects on plant development that lead to reductions in crop productivity. It is estimated that 20% of irrigated land was affected by soil salinization a decade ago, and without intervention, saline soils could expand to more than 50% of the total global irrigated area by 2050 [1,2]. Apart from the natural soil enrichment process, intensified agricultural irrigation practices and the negative influence of climate change have exacerbated this issue [3]. In turn, the economic fallout from crop failures due to heightened soil salinity has provoked shifts in migration patterns among farmers in coastal agrarian regions like Bangladesh [4]. Consequently, there is a pressing need to enhance crop tolerance to saline–alkaline conditions to address this escalating crisis. Excessive salinity not only restricts a plant’s ability to absorb water and nutrients [5], but also triggers a cascade of stress responses, including responses to osmotic pressure, ionic imbalance, and oxidative stress [6].
As we usher in the post-genomic age, the swift progression of transcriptomics technology has revealed many correlations between genomes, phenotypes, tissue specifics, developmental phases, and environmental influences [7]. By leveraging transcriptomes’ temporal and spatial variability, this innovative technology can be used to identify genes that govern plant growth, development, and stress resilience, accelerating the process of crop variety enhancement [8]. Segura et al. studied the transcriptomic shifts at the stem apex of wild-type and male ethylene-insensitive cucumber mutants during the female flowering transition. A total of 1160 distinctive differential expression genes DEGs were identified in the wild type’s female blooming phase, 284 of which were influenced by the etr1b mutation, which impairs ethylene sensitivity. These genes belong to 34 distinct transcription factor families, including NAC, ERF, bHLH, bZIP, MYB, and C2H2/CH3, and have been shown to play roles in modulating female flowering, either in an ethylene-dependent or non-ethylene-dependent manner [9,10]. Aleen et al. studied drought resilience through a comparative transcriptomic analysis of drought-tolerant and -sensitive soybean root systems, finding that DEGs associated with water and growth hormone transportation, cellular membrane and wall functions, antioxidative activity, catalytic processes, secondary metabolism, signaling pathways, and transcriptional regulation are localized in a key QTL hotspot region on Chr.08 for drought response. Within this hotspot, eight single-nucleotide polymorphisms (SNPs) were identified as potential candidate genes governing drought tolerance [11]. Liu et al. identified twenty-two, nine, and six distinct salinity-sensitive genes within the phytohormone signaling, MAPK signaling, and abscisic acid (ABA) signaling cascades, respectively. Through single-cell RNA-seq analysis, they predicted a pivotal function for the AP2/ERF transcription factor family in cotton root-tip protoplasts subjected to salt stress [12,13]. In a separate study, a transcriptomic sequencing investigation of the salt-resistant cotton cultivar Tong Yan No. 1 revealed significant changes in metabolic pathways in reaction to salt stress; these pathways included glycerolipid metabolism, sesquiterpene and triterpene synthesis, flavonoid production, and phytohormone signaling. This study also validated the functionality of two candidate genes, Gh_D11G0978 and Gh_D10G0907, through the virus-induced gene silencing (VIGS) technique [14].
The research on salt tolerance in cotton at the transcriptomic level has predominantly centered on comparatively sequencing individual cultivars or singular temporal phases [14,15]. However, the dynamic regulatory mechanisms underlying salt stress defense across diverse cultivars remain largely unexplored. In this study, we contrasted the transcriptome profiles of various G. hirsutum genotypes under salt stress conditions, aiming to discern the shared and distinct defense reactions between salt-tolerant and -sensitive types. This research reveals the key regulatory pathways integral to cotton’s salt tolerance response and provides genetic information useful for molecular breeding.
2. Materials and Methods
2.1. Material Planting and Sample Preparation
Cotton seeds were delinted, washed, and soaked in distilled water for 24 h to promote seed germination, and the dried and broken seeds were removed. Nutrient soil was mixed with vermiculite in a 1:1 ratio, filled to 1/3 height in a 10 × 10 nutritive bowl, and compacted, and full seeds were inserted into the soil with tweezers whose tips faced downward. Five seeds were placed evenly in each bowl. Then, we covered the seeds with nutrient soil up to 3/4 of the height of the seedling bowl, poured 1 L of water into the tray, and wrapped the bowl tightly in a black plastic bag to moisturize the soil. We removed the plastic film when the seedlings emerged evenly, pulled out the weak seedlings, and left 3 cotton plants in each bowl. When the cotton plants reached the third-leaf stage at around three weeks of age, we delicately cleansed the roots, ensured their integrity, and placed them in a conical flask. The seedlings were immersed in Hoagland nutrient solution for two days. After two days, the Hoagland nutrient solution was extracted, and the experimental group was treated with 350 mM of NaCl. The control group was given an equal amount of distilled water [16,17]. The leaves were removed at 0 h, 2 h, 5 h, 12 h, 24 h, 48 h, and 72 h after treatment; wrapped in tin foil; and placed in freezing tubes. These were immediately placed in liquid nitrogen for preservation, with three replicates for each group. The leaves were then submitted to Qingdao Biomarker Biotechnology Co (Qingdao, China). for library construction and sequencing.
2.2. Library Construction and Sequencing
Total plant RNA was extracted using the RNA prep Pure Plant Kit (Tiangen, Beijing, China), and RNA concentration and purity were measured using a NanoDrop 2000 (Thermo, Wilmington, DE, USA). Sequencing libraries were generated using the Hieff NGS Ultima Dual-mode mRNA Library Prep Kit for Illumina (Yeasen, Shanghai, China) according to the instructions provided by the manufacturer. The library fragments were purified using AMPure XP magnetic beads (Beckman Coulter, Beverly, MA, USA). Then, 3 μL of USER Enzyme (NEB, Ipswich, MA, USB) was added, and the sample was incubated at 37 °C for 15 min. The reaction was performed at 95 °C for 5 min before conducting PCR analysis to purify the PCR products (AMPure XP system) and assess library quality using an Agilent Bioanalyzer 2100 system (Agilent, Santa clara, CA, USA). The libraries were sequenced using the Illumina NovaSeq. (Illumina, San Diego, CA, USA) platform to generate a 150 bp double-terminal sequence.
2.3. Sequencing Data Quality Control and Analysis
Clean data (clean reads) were obtained by removing reads containing adapters, reads containing ploy-N, and low-quality reads from the raw data. All the downstream analyses were based on clean data with high quality. These clean reads were then mapped to the reference genome sequence, TM-1 (https://www.cottongen.org/species/Gossypium_hirsutum/HAU-AD1_genome_v1.0_v1.1, accessed on 29 March 2023), and annotated based on the reference genome. Hisat2 tools software (Hisat2_v2.2.1) was used to map the reads with the reference genome [18]. The StringTie Reference Annotation Based Transcript (RABT) assembly method was used to construct and identify both known and novel transcripts from the Hisat2 alignment results [19]. Gene functions were annotated via Blastp using the following database: Nr (NCBI non-redundant protein sequences), KOG (Clusters of Orthologous Groups of proteins), KO (KEGG Ortholog database), and GO (Gene Ontology) [20,21,22,23]. Gene expression levels were estimated in terms of fragments per kilobase of transcript per million fragments mapped (FPKM) [24].
2.4. Differentially Expressed Gene Screening and Analysis
Differential expression analysis of cotton cultivars and treatments was performed using DESeq2 [25], and genes with an FDR < 0.05 and Fold Changes ≥ 2 were designated DEGs.
2.5. Weighted Gene Co-Expression Network Construction
The gene co-expression network was constructed using the “WGCNA” R package (https://cran.r-project.org/web/packages/WGCNA/index.html, accessed on 1 March 2024). The Pearson correlation coefficients between genes were calculated based on the expression of genes in different samples; the correlation coefficients were converted into a neighbor-joining matrix through a weighting function; and a soft threshold (β) was determined for the neighbor-joining function to make the gene expression matrix conform to the scale-free network. Gene modules were visualized using Cytoscape (Cytoscape_v3.9.1). The hub gene screening parameter values were set as follows: weight > 0.35 and degree > 5 [26].
2.6. qRT-PCR Validation
Based on the RNA-seq results, six DEGs were randomly selected to verify the accuracy of the sequencing results. Leaf RNA was taken from 3 replicate samples from 2 species under 7 conditions for qRT-PCR amplification after inverse transcription. Specific primers were designed according to DEG annotation using the NCBI’s primer-designing tool (https://www.ncbi.nlm.nih.gov/tools/primer-blast/, accessed on 14 May 2024). QRT-PCR amplification was performed using the Applied Biosystems 7500 Fast real-time fluorescence Quantitative PCR Instrument System (Thermo, Wilmington, DE, USA), and relative gene expression levels were analyzed using GraphPad Prism 9.5.0 [27].
3. Results
3.1. Transcriptome Sequencing and Assembly
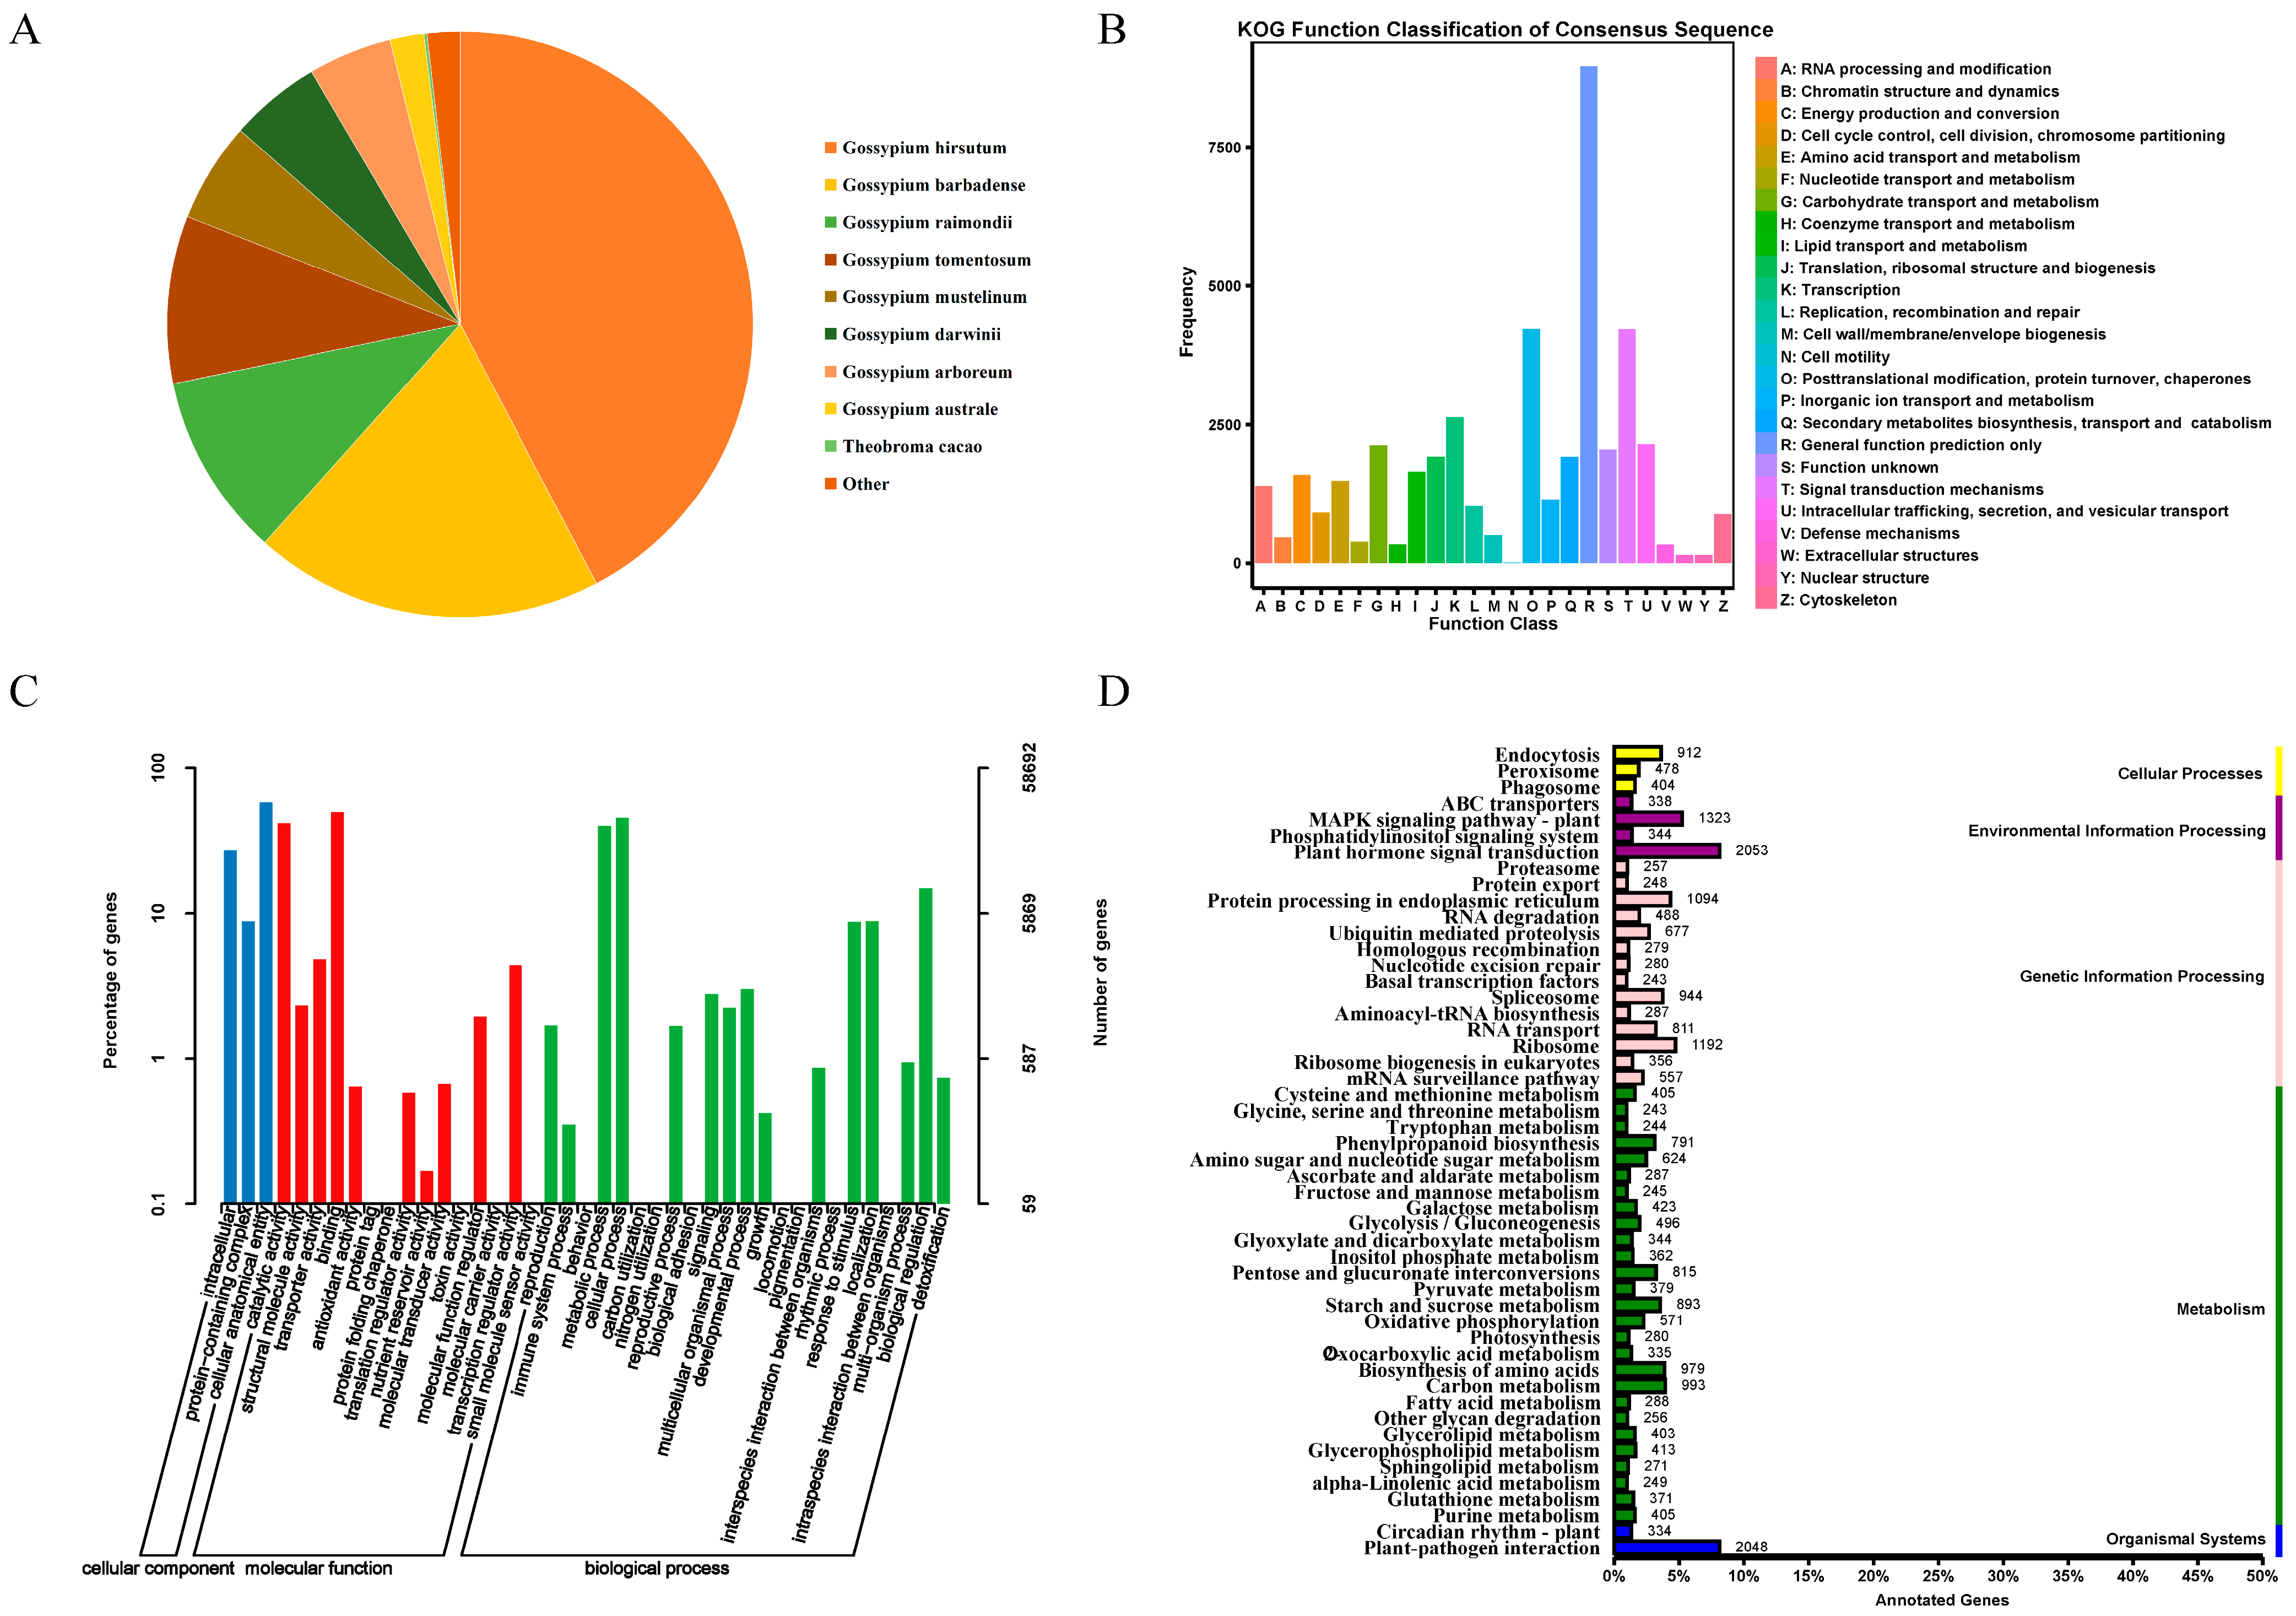
The total RNA quality of the samples was examined, and it was determined that the concentration and integrity of the 42 samples met the requirements for RNA-Seq sequencing cDNA library construction (Table S1). A total of 288.63 Gb of clean data were obtained from the sequencing library of the 42 samples. The clean data for each sample amounted to 5.76 Gb, with a GC content above 43.16% and a Q30 base percentage above 93.77%. The sequencing results met the experiment’s requirements and could be further analyzed (Table S2). The clean data for each sample were aligned to the reference genome, TM-1, and 90.49–97% of the clean reads for the 42 samples were aligned to this reference genome, of which the number of reads that aligned to a unique position accounted for 85.96–93.62% of the clean reads, and the number of reads aligned to multiple positions accounted for 3.15–4.53%. In total, 4.53% (Table S3) of the RNA-seq data were assembled to obtain 77,085 unigene sequences. The NCBI Nr annotation results revealed that 42.38% of the unigenes were most similar to G. hirsutum, while 19.34% of the unigenes were similar to Gossypium barbadens, reflecting the kinship between the two cotton genera (Figure 1A).
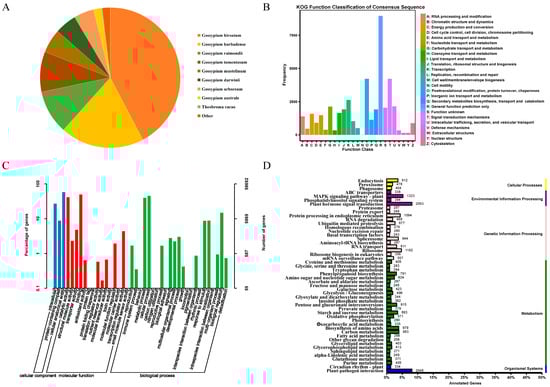
Figure 1.
Unigene annotations. (A): Distribution of homologous species based on Nr annotations. (B): Unigene KOG database comparison results. (C): Unigene GO annotation entries. (D): Unigene KEGG annotation category map.
To shed more light on the functional allocation of cotton genes, an in-depth comparison and classification of the assembled unigenes was conducted against the KOG database. This analysis revealed that 11.62% of these unigenes were grouped under general function prediction, and the next highest grouping was under post-translational protein modification. In total, 3.41% of the unigenes were linked to transcriptional processes, and 2.78% were involved in intracellular transport, secretion, and vesicular transport. Carbohydrate transport and metabolism accounted for 2.76%, and translation, ribosome structure, and biogenesis accounted for 2.50%. Secondary metabolite biosynthesis, transport, and catabolism constituted 2.49%, and 2.14% of the unigenes were tied to lipid transport and metabolism. In total, 2.07% of the unigenes were related to energy production and conversion; amino acid transport and metabolism; RNA processing and modification; inorganic ion transport and metabolism; replication, recombination, and repair; cell cycle control; cell division; and chromosome division. Cytoskeleton-related unigenes constituted less than 2%. Cell wall/membrane/envelope biogenesis, chromatin structure and dynamics, nucleotide transport and metabolism, auxin transport and metabolism, defense mechanisms, nuclear structure, extracellular structure, and cell-motility-related unigenes accounted for less than 1%. In addition, another 2.66% remained functionally unclassified (Figure 1B).
The GO annotation results showed that 58,692 Unigenes were assigned annotation entries, and cellular components were annotated to the most cellular anatomical entity entries (34,059 entries), accounting for 61.47%. The molecular functions of binding and catalytic activity were the most annotated, with 29,382 and 24,615 entries, respectively, accounting for 46.44% and 38.90% of all annotations. This was followed by transporter activity, with 2830 annotations (4.47%). The biological processes that had the most annotations were the cellular process and the metabolic process, with 26,883 and 23,627 annotations, respectively; in addition, biological regulation, response to stimulus, and localization had more than 5000 annotations (Figure 1C).
The KEGG annotation results showed that all the unigenes were annotated as cellular processes (1752), environmental information processing (3406), genetic information processing (7403), metabolism (12,167), and organic systems (2382). The second tier of signal transduction and environmental adaptation had the most annotations for phytohormone signaling and plant–pathogen interactions, with 2053 and 2048 annotations, respectively, followed by the MAPK signaling pathway in signal transduction (1323), ribosomes (1192), endoplasmic reticulum protein information processing in genetic information processing (1094), amino acid biosynthesis (979), carbon metabolism (993), and transcriptional shearing in genetic information processing (944). The remaining annotation entries had fewer than 900 unigenes (Figure 1D).
3.2. Differentially Expressed Gene Analysis
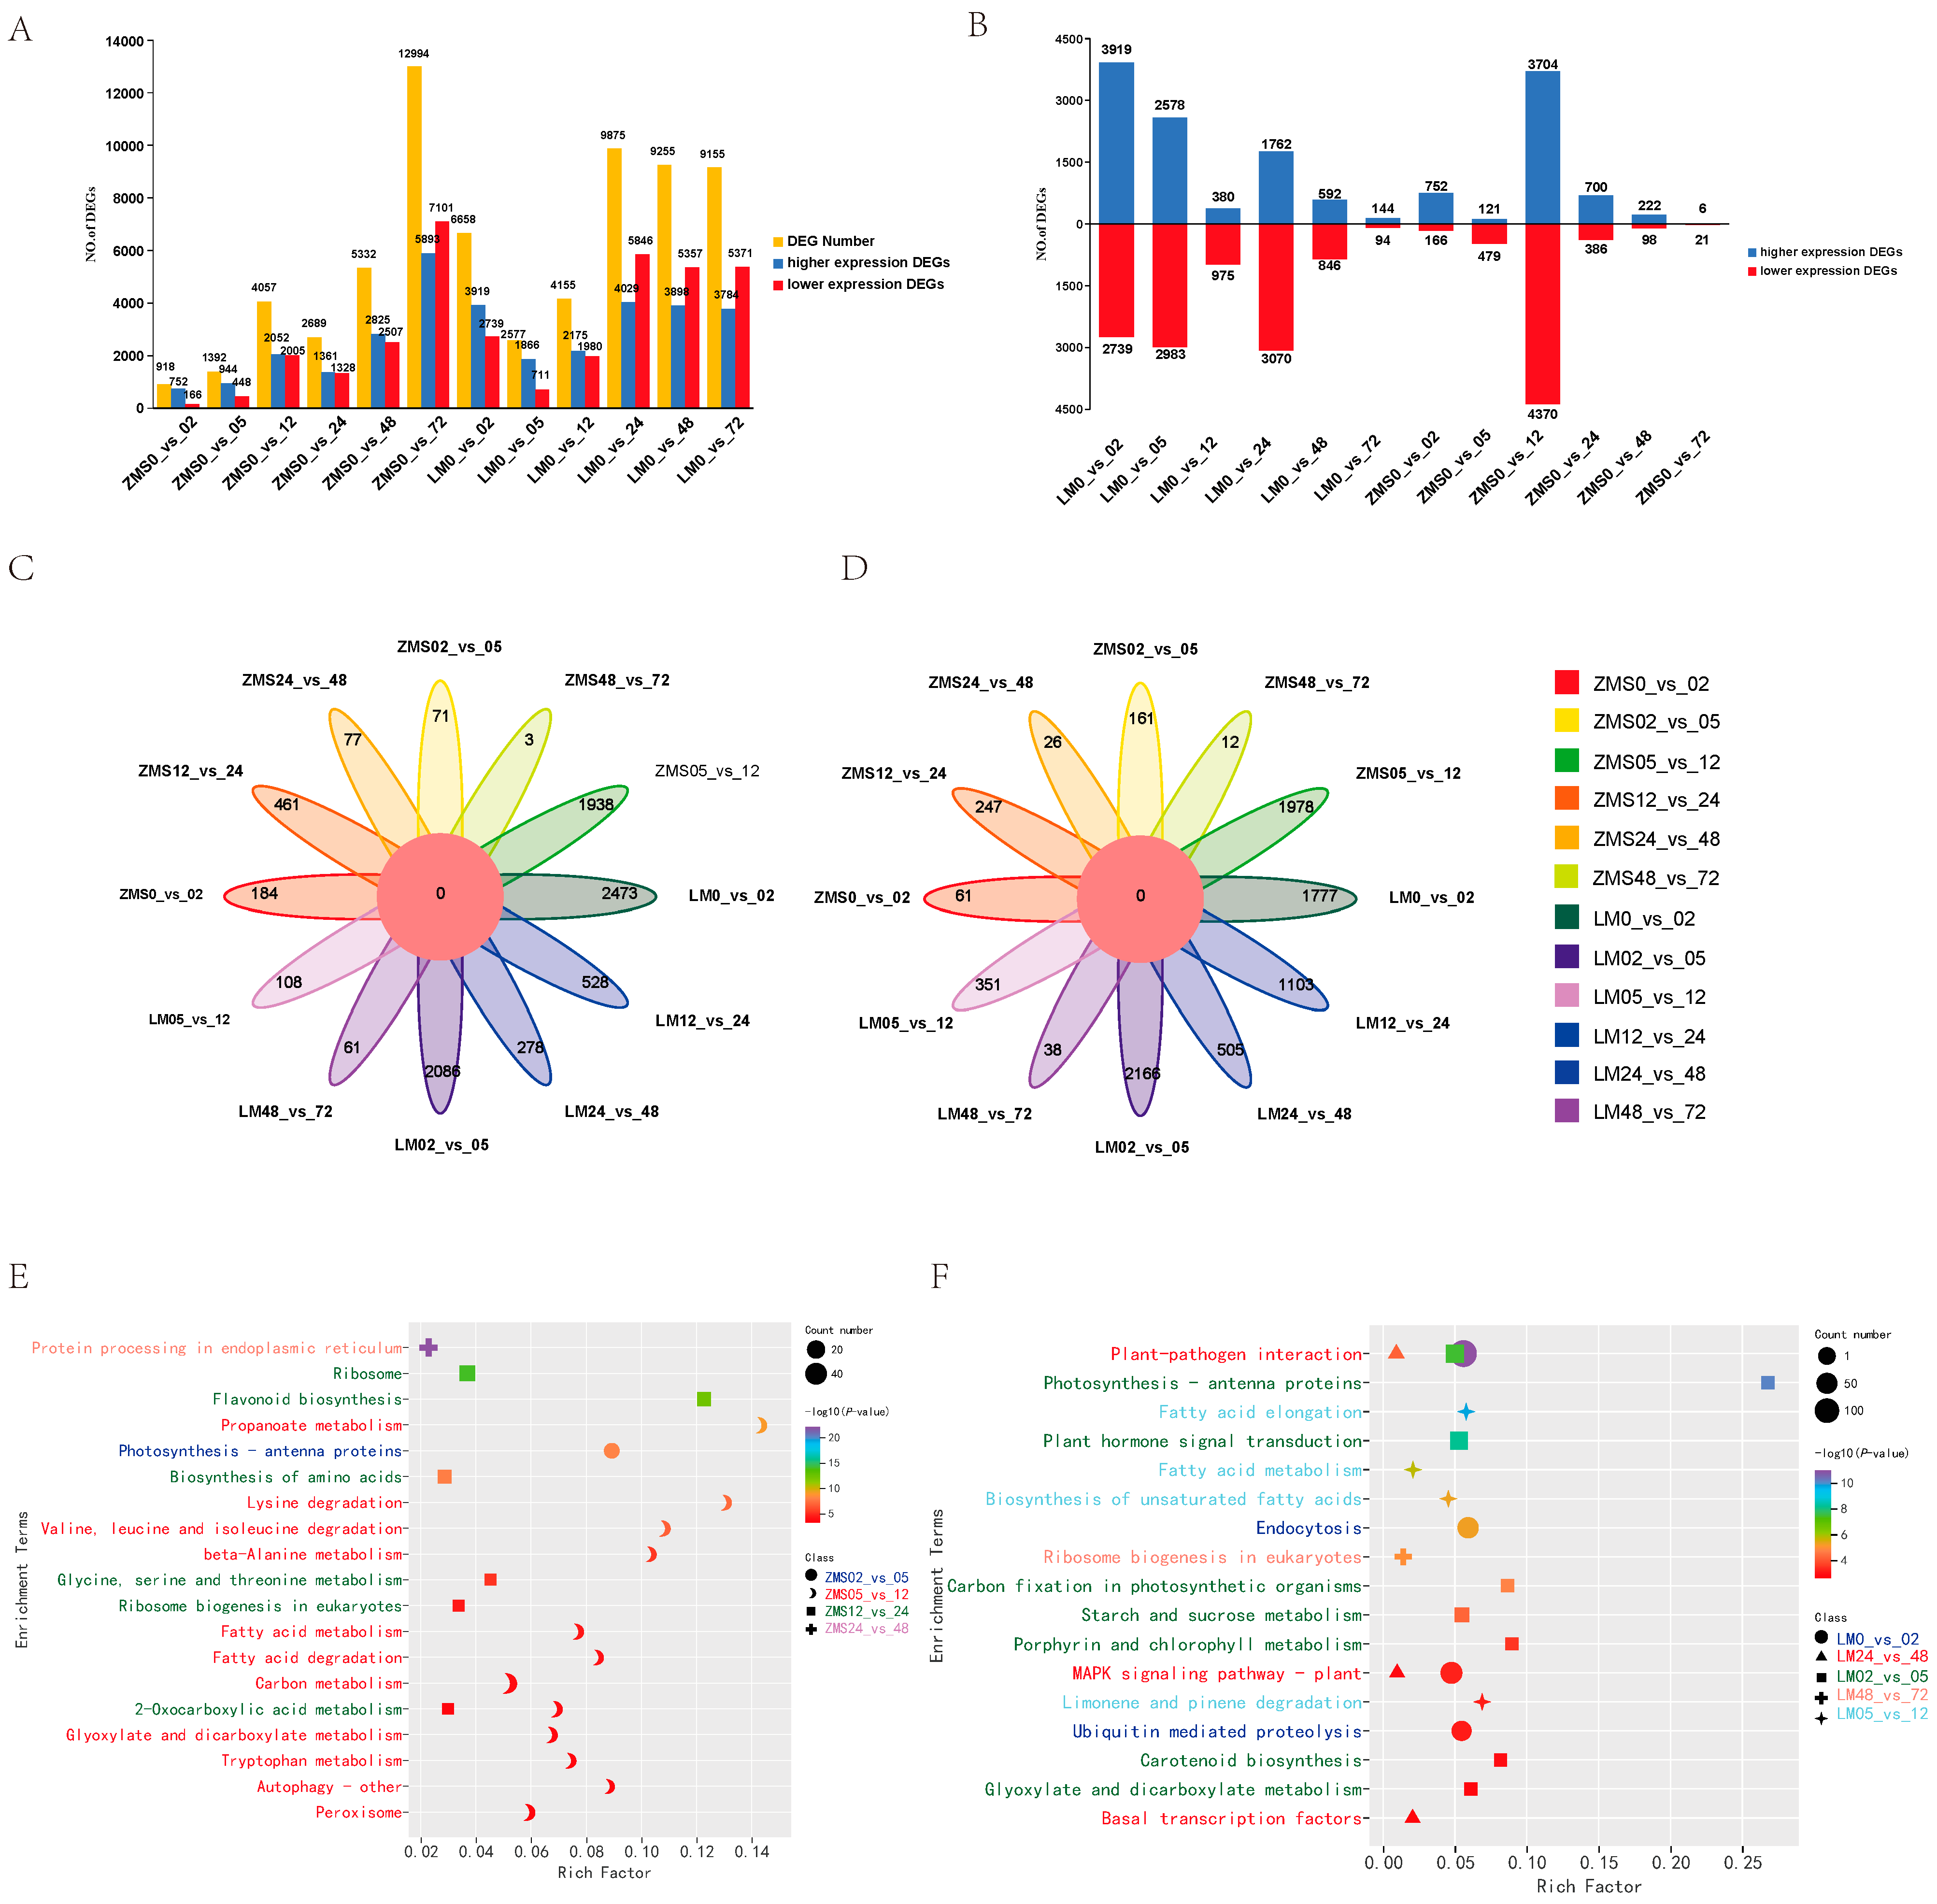
In order to clarify the responses of different salt-tolerant land cotton varieties to salt stress, DEGs were identified using FDR < 0.05 and Fold Changes ≥ 2. Both ZMS and LM produced a large number of DEGs after being subjected to salt stress, and the number of DEGs in ZMS continued to increase within 72 h, but gene mobilization was not strong in the pre-stress period. On the contrary, LM showed more active and rapid expression in the pre-salt-response period, which gradually leveled off after 24 h (Figure 2A). During the time intervals of 2 h, 5 h, 12 h, 24 h, 48 h, and 72 h, 3919, 2578, 380, 1762, 592, and 144 DEGs were found to be highly expressed in LM, and 752, 121, 3704, 700, 222, and 6 DEGs were found to be highly expressed in ZMS, suggesting that LM at 2 h, 5 h, and 24 h and ZMS at 12 h had specific response patterns (Figure 2B). The analysis of the DEGs among different comparison groups revealed that although there were commonalities at adjacent time points, most of the DEGs corresponded to the specific differential expression at that time point; moreover, the common parts were not screened in all the higher expression and lower expression DEG control groups (Figure 2C,D). Further GO enrichment analysis of these unique DEGs showed that overall (Figure S1), genes were mobilized more in biological processes and molecular functions than in cellular components after stress. Time intervals of 2 h, 5 h, 12 h, 24 h, 48 h, and 72 h LM were significantly enriched in DNA-binding transcription factor activity (GO:0003700), plasma membrane (GO:0005886), endoplasmic reticulum chaperone complex (GO:0034663), photosystem II (GO:0009523), negative regulation of DNA recombination Gene Ontology (GO:0045910), and water channel activity (GO:0015250). ZMS was most significantly enriched in the blue light signaling pathway (GO:0009785), photosystem II (GO:0009523), ribosome (GO:0005840), structural constituent of ribosome (GO:0003735), protein complex oligomerization (GO:0051259), and kinase activity (GO:0016301). This result demonstrates that LM responds more rapidly to salt stress. In the early stage, the defense mechanism was initiated by the activation of transcription factors to elicit downstream responses, while the plasma membrane structure was regulated, maintaining intracellular ion levels via ion channel control. In the later stage, LM accumulated organic matter through photosynthesis, and the activity of water channels was enhanced to minimize the cellular damage caused by osmotic stress. ZMS responded to salt stress in a simpler way by enhancing photosynthesis to resist environmental stress in the early stage and then focusing on protein synthesis in the later stage. This might be related to the maintenance of osmotic homeostasis. The specific regulatory mechanisms of LM and ZMS in response to salt stress led to a difference in their salt tolerance.
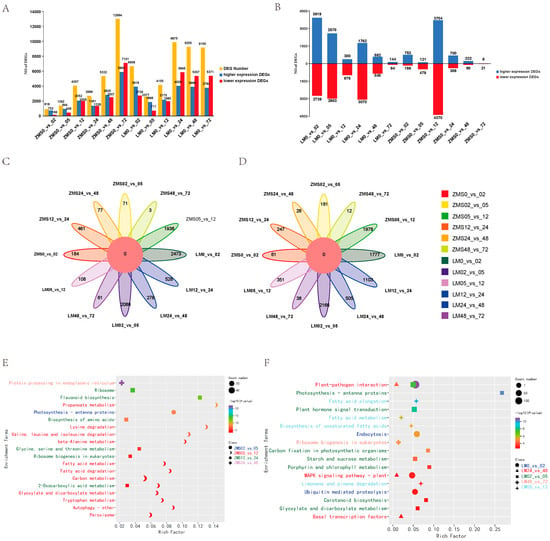
Figure 2.
Analysis of DEGs. (A): Number of DEGs between two cotton cultivars in the control and stress treatments. (B): Number of DEGs between adjacent sampling time points after the stress treatment. (C): Common and specific highly expressed DEGs in the 12 comparison groups. (D): Common and specific poorly expressed DEGs in the 12 comparison groups. (E): KEGG enrichment analysis of highly expressed DEGs in the ZMS comparison groups. (F): KEGG enrichment analysis of highly expressed DEGs in the LM comparison group.
In order to reveal the temporal pattern changes in response to salt stress in different genotypes of cotton, KEGG enrichment analysis was performed on specific DEGs in each control group, and the 20 most significant pathways were retained (Table S4). ZMS was significantly enriched in one pathway, twelve pathways, six pathways, and one pathway at 5 h, 12 h, 24 h, and 48 h, indicating that the response pattern was more complex at 12 h. The most significant enrichment was for protein processing in the endoplasmic reticulum at 48 h containing 25 DEGs; in addition, 12 h and 24 h involved a large number of DEGs related to amino acid anabolism and fatty acid metabolism, which may be related to cellular membrane damage and repair after salt stress (Figure 2E). The LM was significantly enriched in the metabolic pathways at 2 h, 5 h, 12 h, 48 h, and 72 h, indicating that although the number of LM DEGs leveled off after 24 h, it was regulated and maintained by different metabolic networks over time for the plants’ adaptation to the salt environment and engagement in normal life activities therein (Figure 2F).
There were numerous gene expression variations in the four comparison groups, i.e., ZMS05_vs._12, LM0_vs._02, LM02_vs._05, and LM12_vs._LM24, and selecting the overlapping part allowed us to reduce the number of redundant genes, which was conducive to the in-depth investigation of salt-tolerant genes. There were 295 genes common to the four groups, and these might be closely related to the salt tolerance response of cotton (Figure 3A). There were 239 genes in the LM comparison group that were shared at three time points but were not found in ZMS. These genes might be responsible for the formation of salt tolerance characteristics in LM. Upon comparing the highly and poorly expressed genes separately, it was found that only three genes were commonly highly expressed in the four groups (Figure 3B), and no common poorly expressed genes were found (Figure 3C). This suggests that LM and ZMS exhibit different response patterns in regard to salt stress.
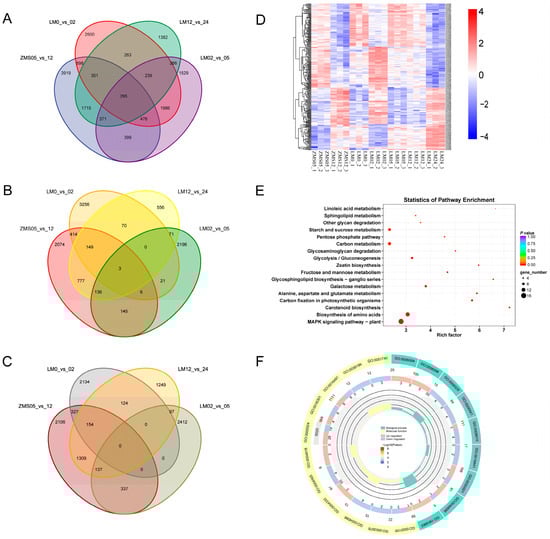
Figure 3.
Salt tolerance-related DEG analysis. (A): Comparison of the number of DEGs in the four comparison groups. (B): Comparison of the number of highly expressed DEGs in the four comparison groups. (C): Comparison of the number of poorly expressed DEGs in the four comparison groups. (D): Clustering heatmap of co-expressed DEGs based on FPKM. (E): KEGG enrichment analysis of co-expressed DEGs. (F): GO enrichment analysis of co-expressed DEGs.
Heat mapping was performed for 295 genes to clarify their trends (Figure 3D). Although these genes were common to both LM and ZMS, there was still a portion of genes with different response patterns in the two cultivars. Overall, the DEGs showed the same expression trend in LM05 and LM12, suggesting that the metabolic regulatory network associated with these genes may provide continuous feedback regarding salt stress during this period. Based on the results of GO and KEGG enrichment, these genes may be involved in various metabolic pathways such as MAPK signaling, amino acid biosynthesis, carotenoid biosynthesis, and carbon fixation in photosynthetic organisms through amino acid catabolism, oxidative phosphorylation, and phytohormone sensing, and may play a role in the resistance to salt stress (Figure 3E,F; Table S5).
3.3. WGCNA Analysis
In order to screen the genes associated with playing a key role in salt tolerance, strict screening conditions were set for the DEGs generated from samples within four time periods: Fold Change ≥ 5 and FDR < 0.01 for ZMS05_vs._12, LM0_vs._02, and LM02_vs._05, LM12_vs._LM24. Finally, 2742 genes were used as the background to construct a weighted gene co-expression network. The weight values were calculated using the WGCNA package. Here, when the soft threshold β = 17, the gene expression matrix conformed to the scale-free network (Figure S2).
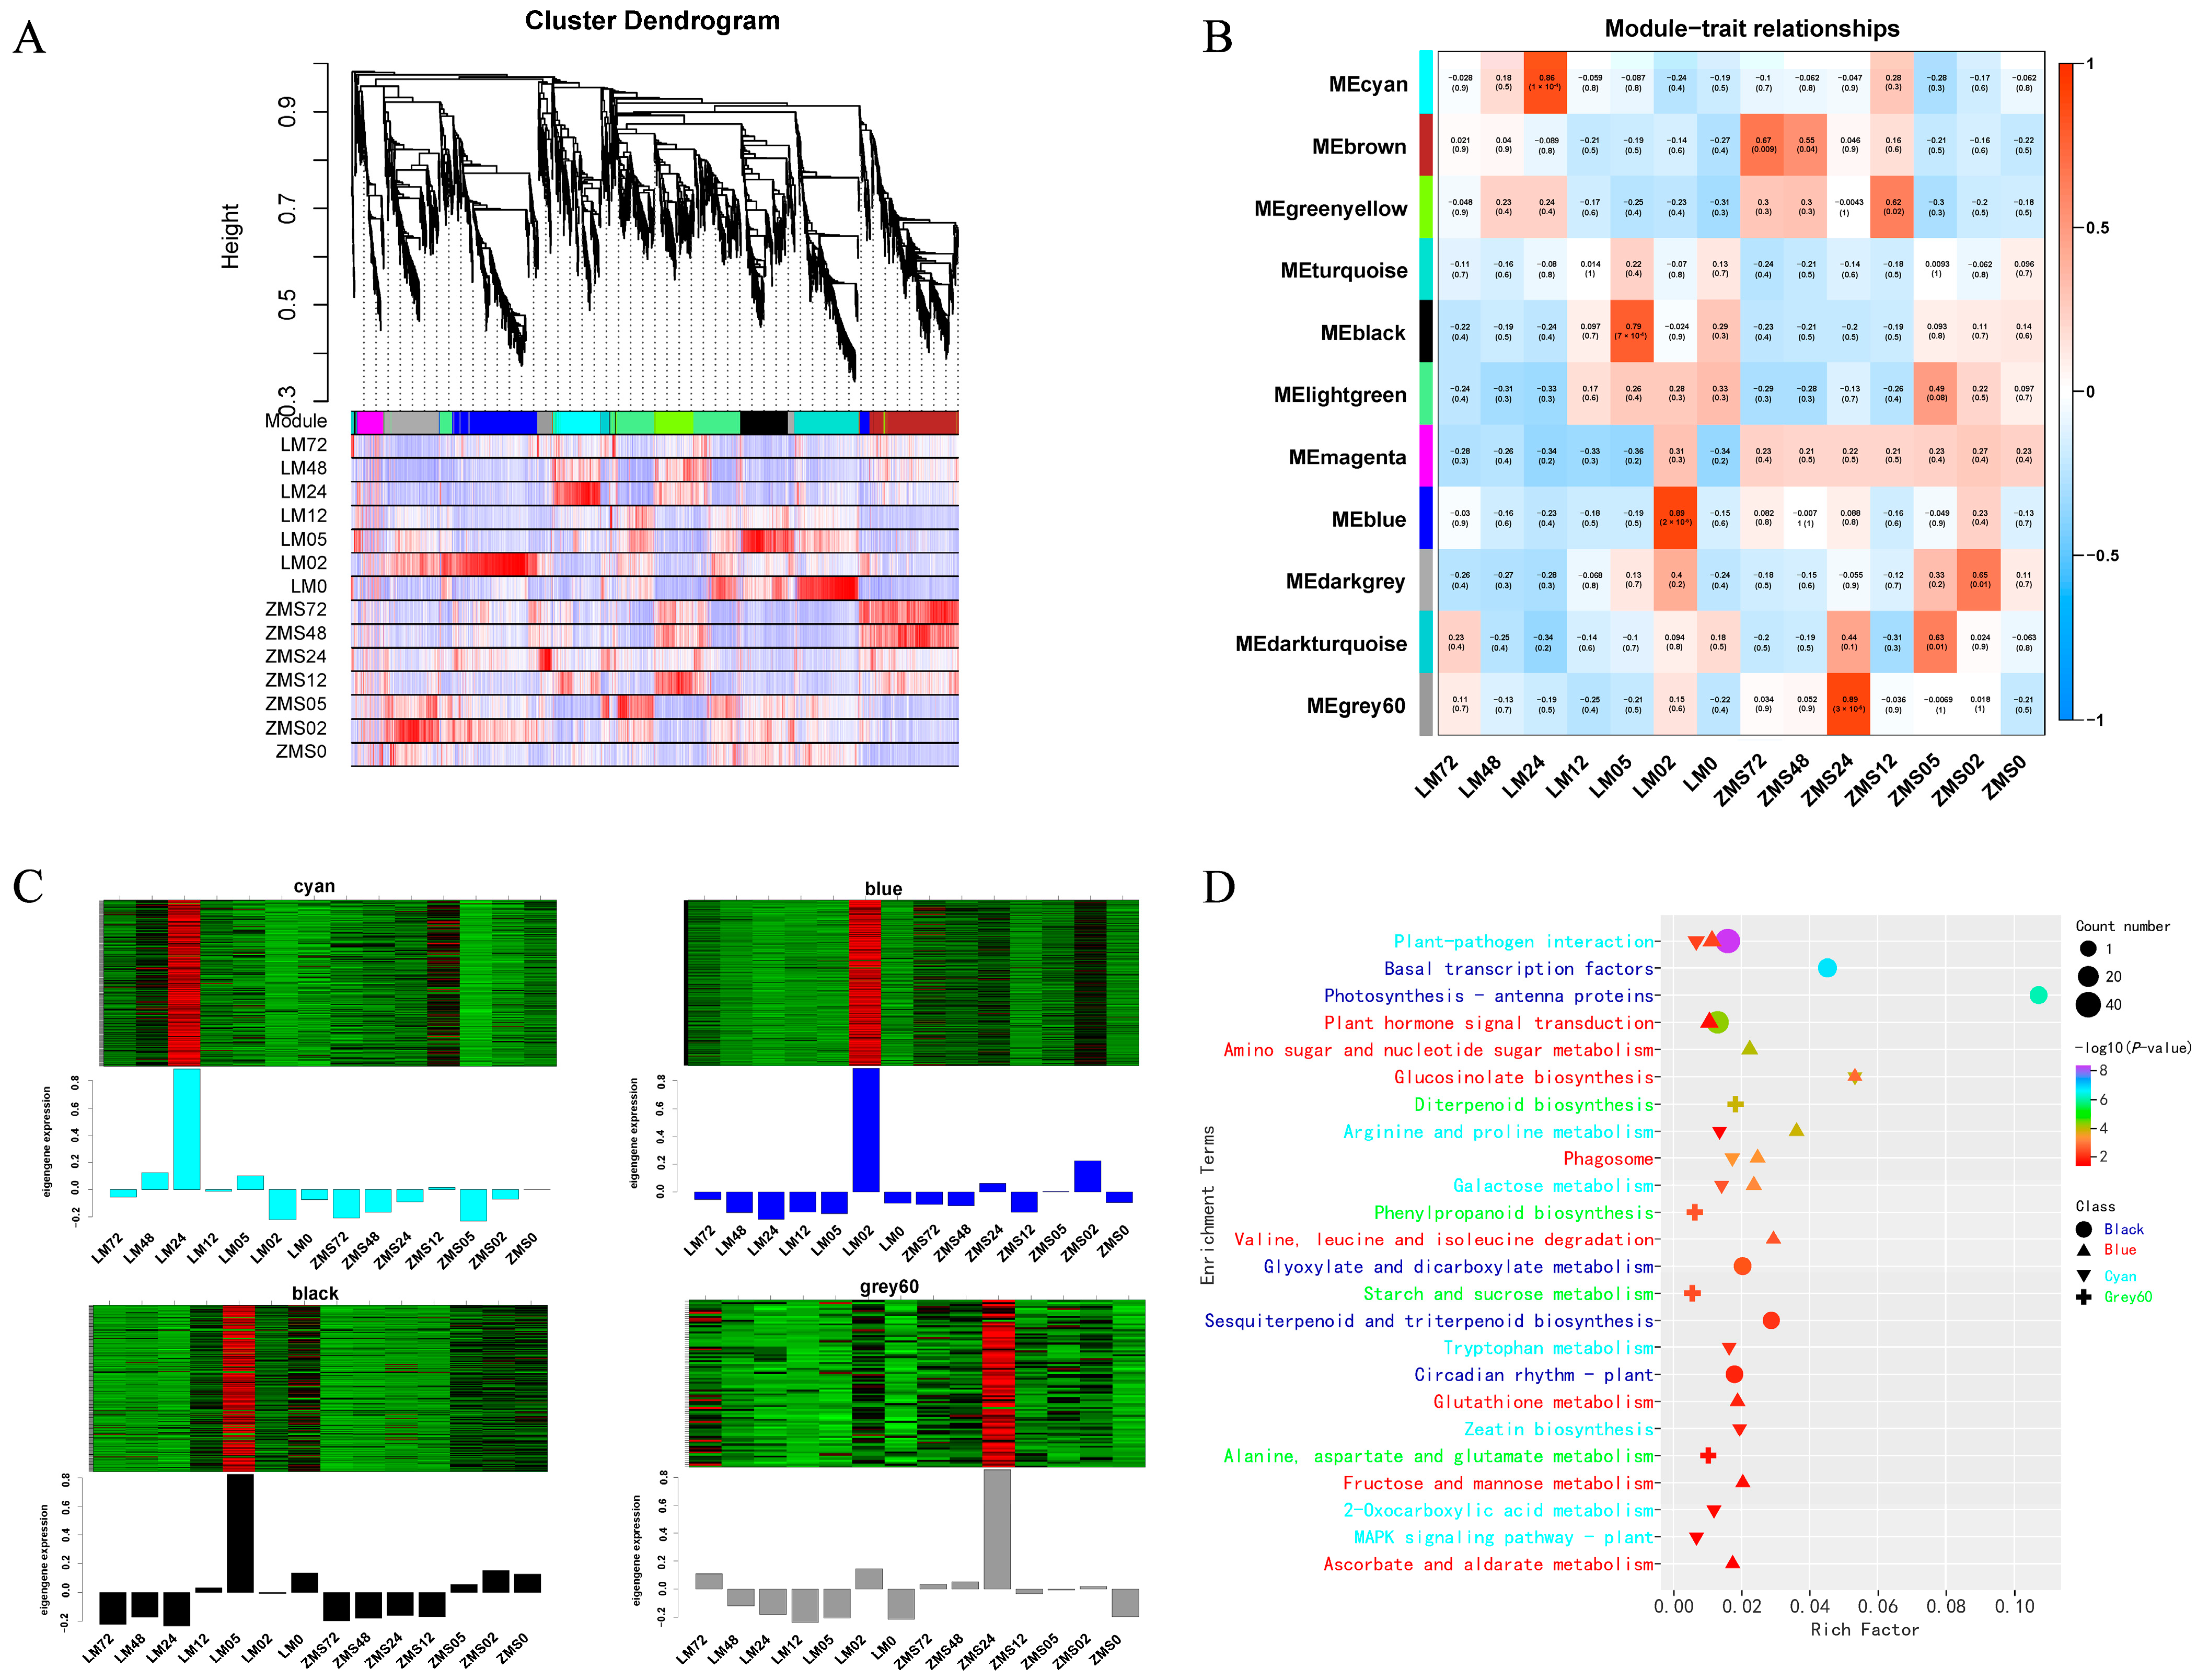
All genes were divided into eleven modules (Figure 4A), and the number of genes within the modules ranged from 47 to 448, with four modules significantly correlating with the traits noted here: the Cyan module correlated with LM24 (R2 = 0.86, p = 1 × 10⁻⁴), with 218 genes; the Black module correlated with LM05 (R2 = 0.79, p = 7 × 10⁻⁴), with 243 genes; the Blue module correlated with LM02 (R2 = 0.89, p = 2 × 10⁻⁵), with 443 genes; and the Grey60 module correlated with ZMS24 (R2 = 0.89, p = 3 × 10⁻⁵), with 67 genes (Figure 4B). The heatmap developed based on the log FPKM values reflected the unique expression patterns of the four specific modules corresponding to the time points (Figure 4C).
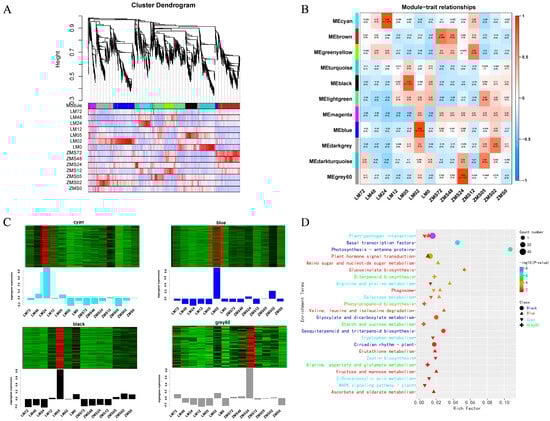
Figure 4.
Weighted gene co-expression network analysis. (A): Clustering and module delineation. (B): Module-and-trait correlation. (C): Heatmap of gene expression within the modules. (D): Analysis of KEGG enrichment of genes in modules.
KEGG enrichment analysis was performed on the genes in the modules. Only the pathways with a p value < 0.05 were retained for plotting (Figure 4D, Table S6). Plant–pathogen interaction pathways were co-enriched in the Black, Blue, and Cyan modules, suggesting their importance in the early and late stages of the salt stress response in LM. Plant hormone signal transduction, glucosinolate biosynthesis, arginine and proline metabolism, the phagosome, and galactose metabolism were co-enriched in two modules, confirming their critical roles in the salt stress response. In addition, the enrichment results for the ZMS-associated Grey60 module were completely different from those for the other three modules, showing only four pathways: diterpenoid biosynthesis; phenylpropanoid biosynthesis; starch and sucrose metabolism; and alanine, aspartate, and glutamate metabolism represented the response strategies of ZMS to salt stress. The expression pattern analysis of these modules can help to further reveal the regulatory mechanism of salt tolerance in cotton.
The transcription factor prediction of salt tolerance-related genes in the four modules resulted in a total of one hundred and fourteen TFs (Table S7), including twenty WRKYs, seventeen ERFs, sixteen NACs, thirteen bHLHs, seven bZIPs, and six MYBs (Figure S3). They play important regulatory roles in the salt stress response, as evidenced by their higher expression in the corresponding periods.
3.4. Module Visualization and Screening of Hub Genes
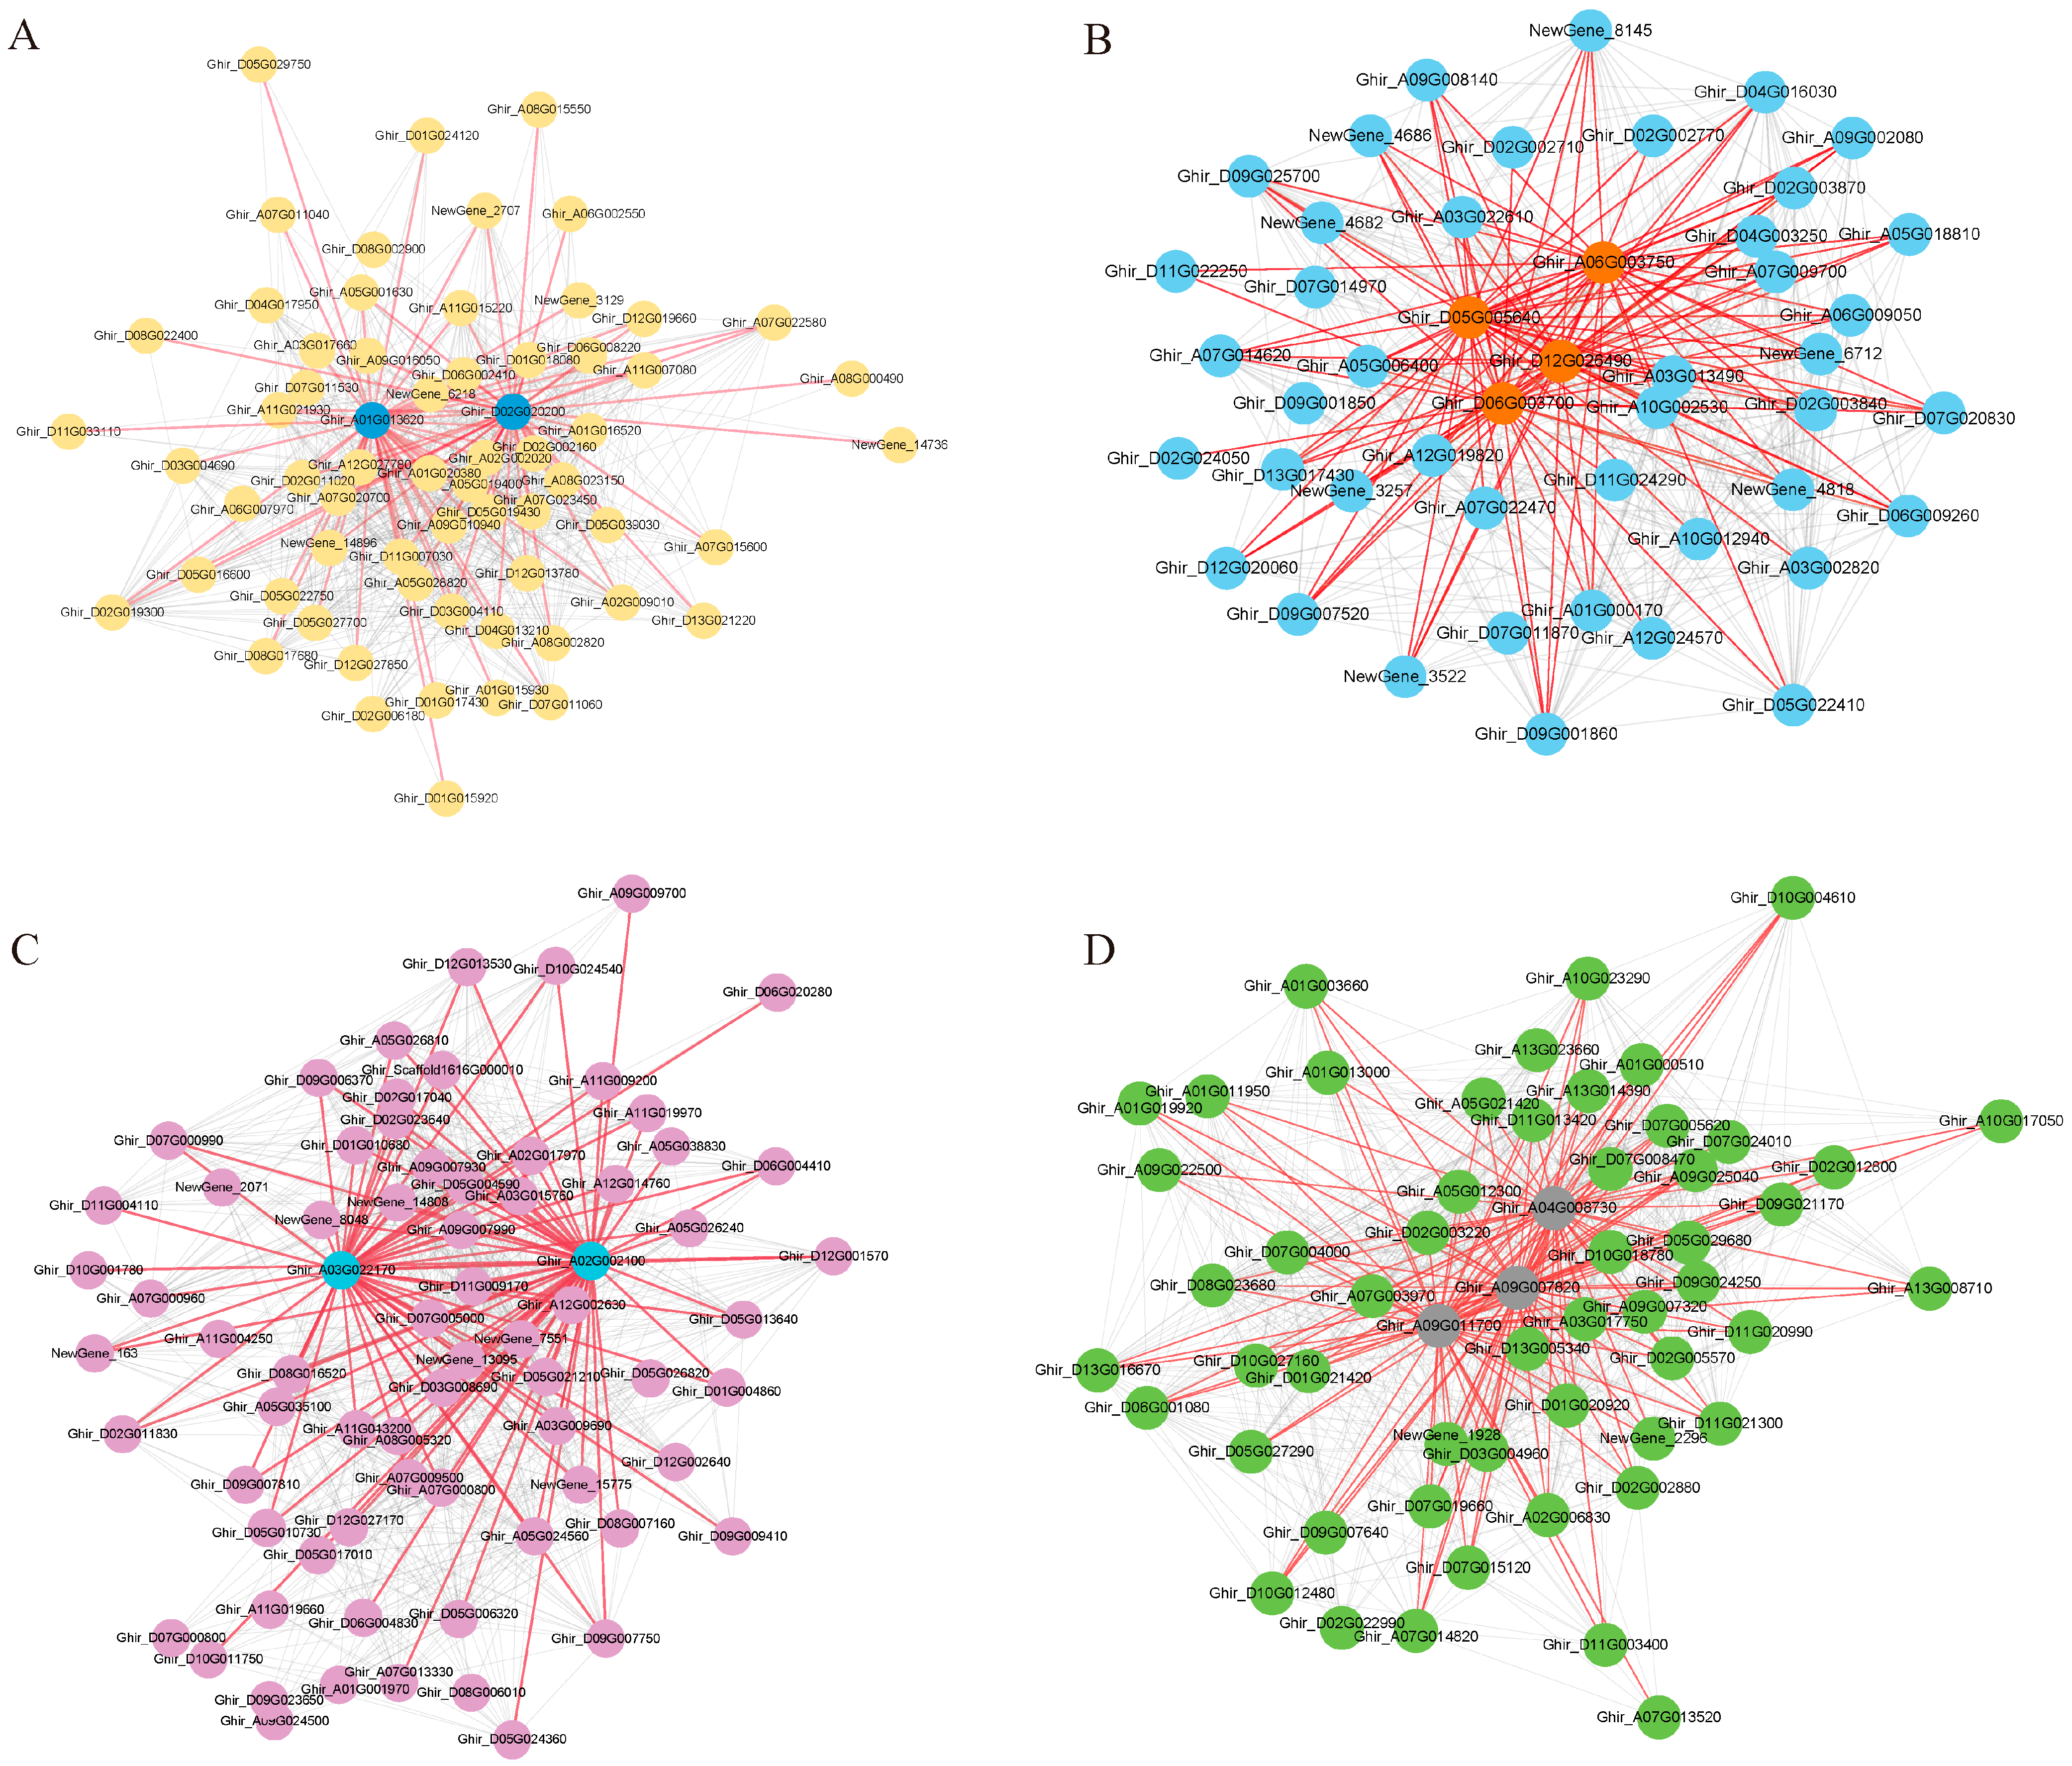
The mining of key genes in the co-expression modules allowed us to find important regulatory genes. Based on the weight values and connectivity of the genes in the modules, members of the four modules with KME values greater than 150 were visualized using Cytoscape. The hub gene screening parameter values were set as follows: weight > 0.35 and degree > 5. Eleven central genes were screened from the four salt tolerance-related modules (Figure 5, Table 1). Ghir_A01G013620 (COR2) and Ghir_D02G020200 (EXL5) were considered the major regulatory genes in the Black module. Ghir_D05G005640, Ghir_A06G003750, and Ghir_D06G003700 are related to MDIS1-interacting receptor-like kinase 2 (MIK2); these three genes, along with Ghir_D12G026490 (WRKY30), play key roles in the Blue module. Ghir_A03G022170 (ATJ11) and Ghir_A02G002100 (SBP2) occupy a pivotal position in the gene co-expression network of the Cyan module. Ghir_A04G008730 (ASL), Ghir_A09G007820 (SKIP27), and Ghir_A09G011700 (F6′H1) are the key genes in Grey60 module. Salt stress affected the synergistic expression of these genes, and their role in cotton salt tolerance needs to be further verified.
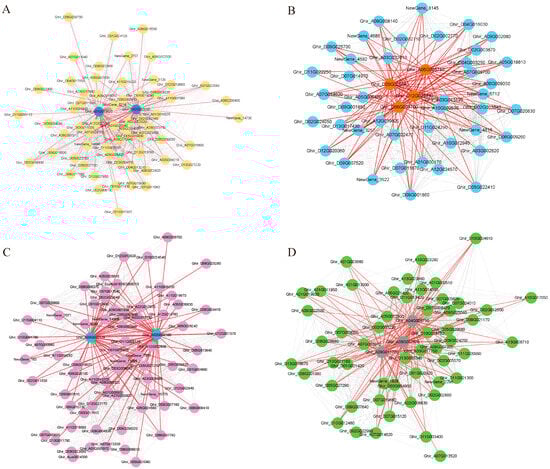
Figure 5.
Co-expression network map of genes within the salt tolerance-related module. (A): Black module, blue circles represent hubgene. (B): Blue module, orange circles represent hubgene. (C): Cyan module, blue circles represent hubgene. (D): Grey60 module, grey circles represent hubgene. Each node represents a gene and the lines denote the connections between genes.

Table 1.
Functional annotation of hub genes in the modules.
3.5. DEG Validation Using qRT-PCR
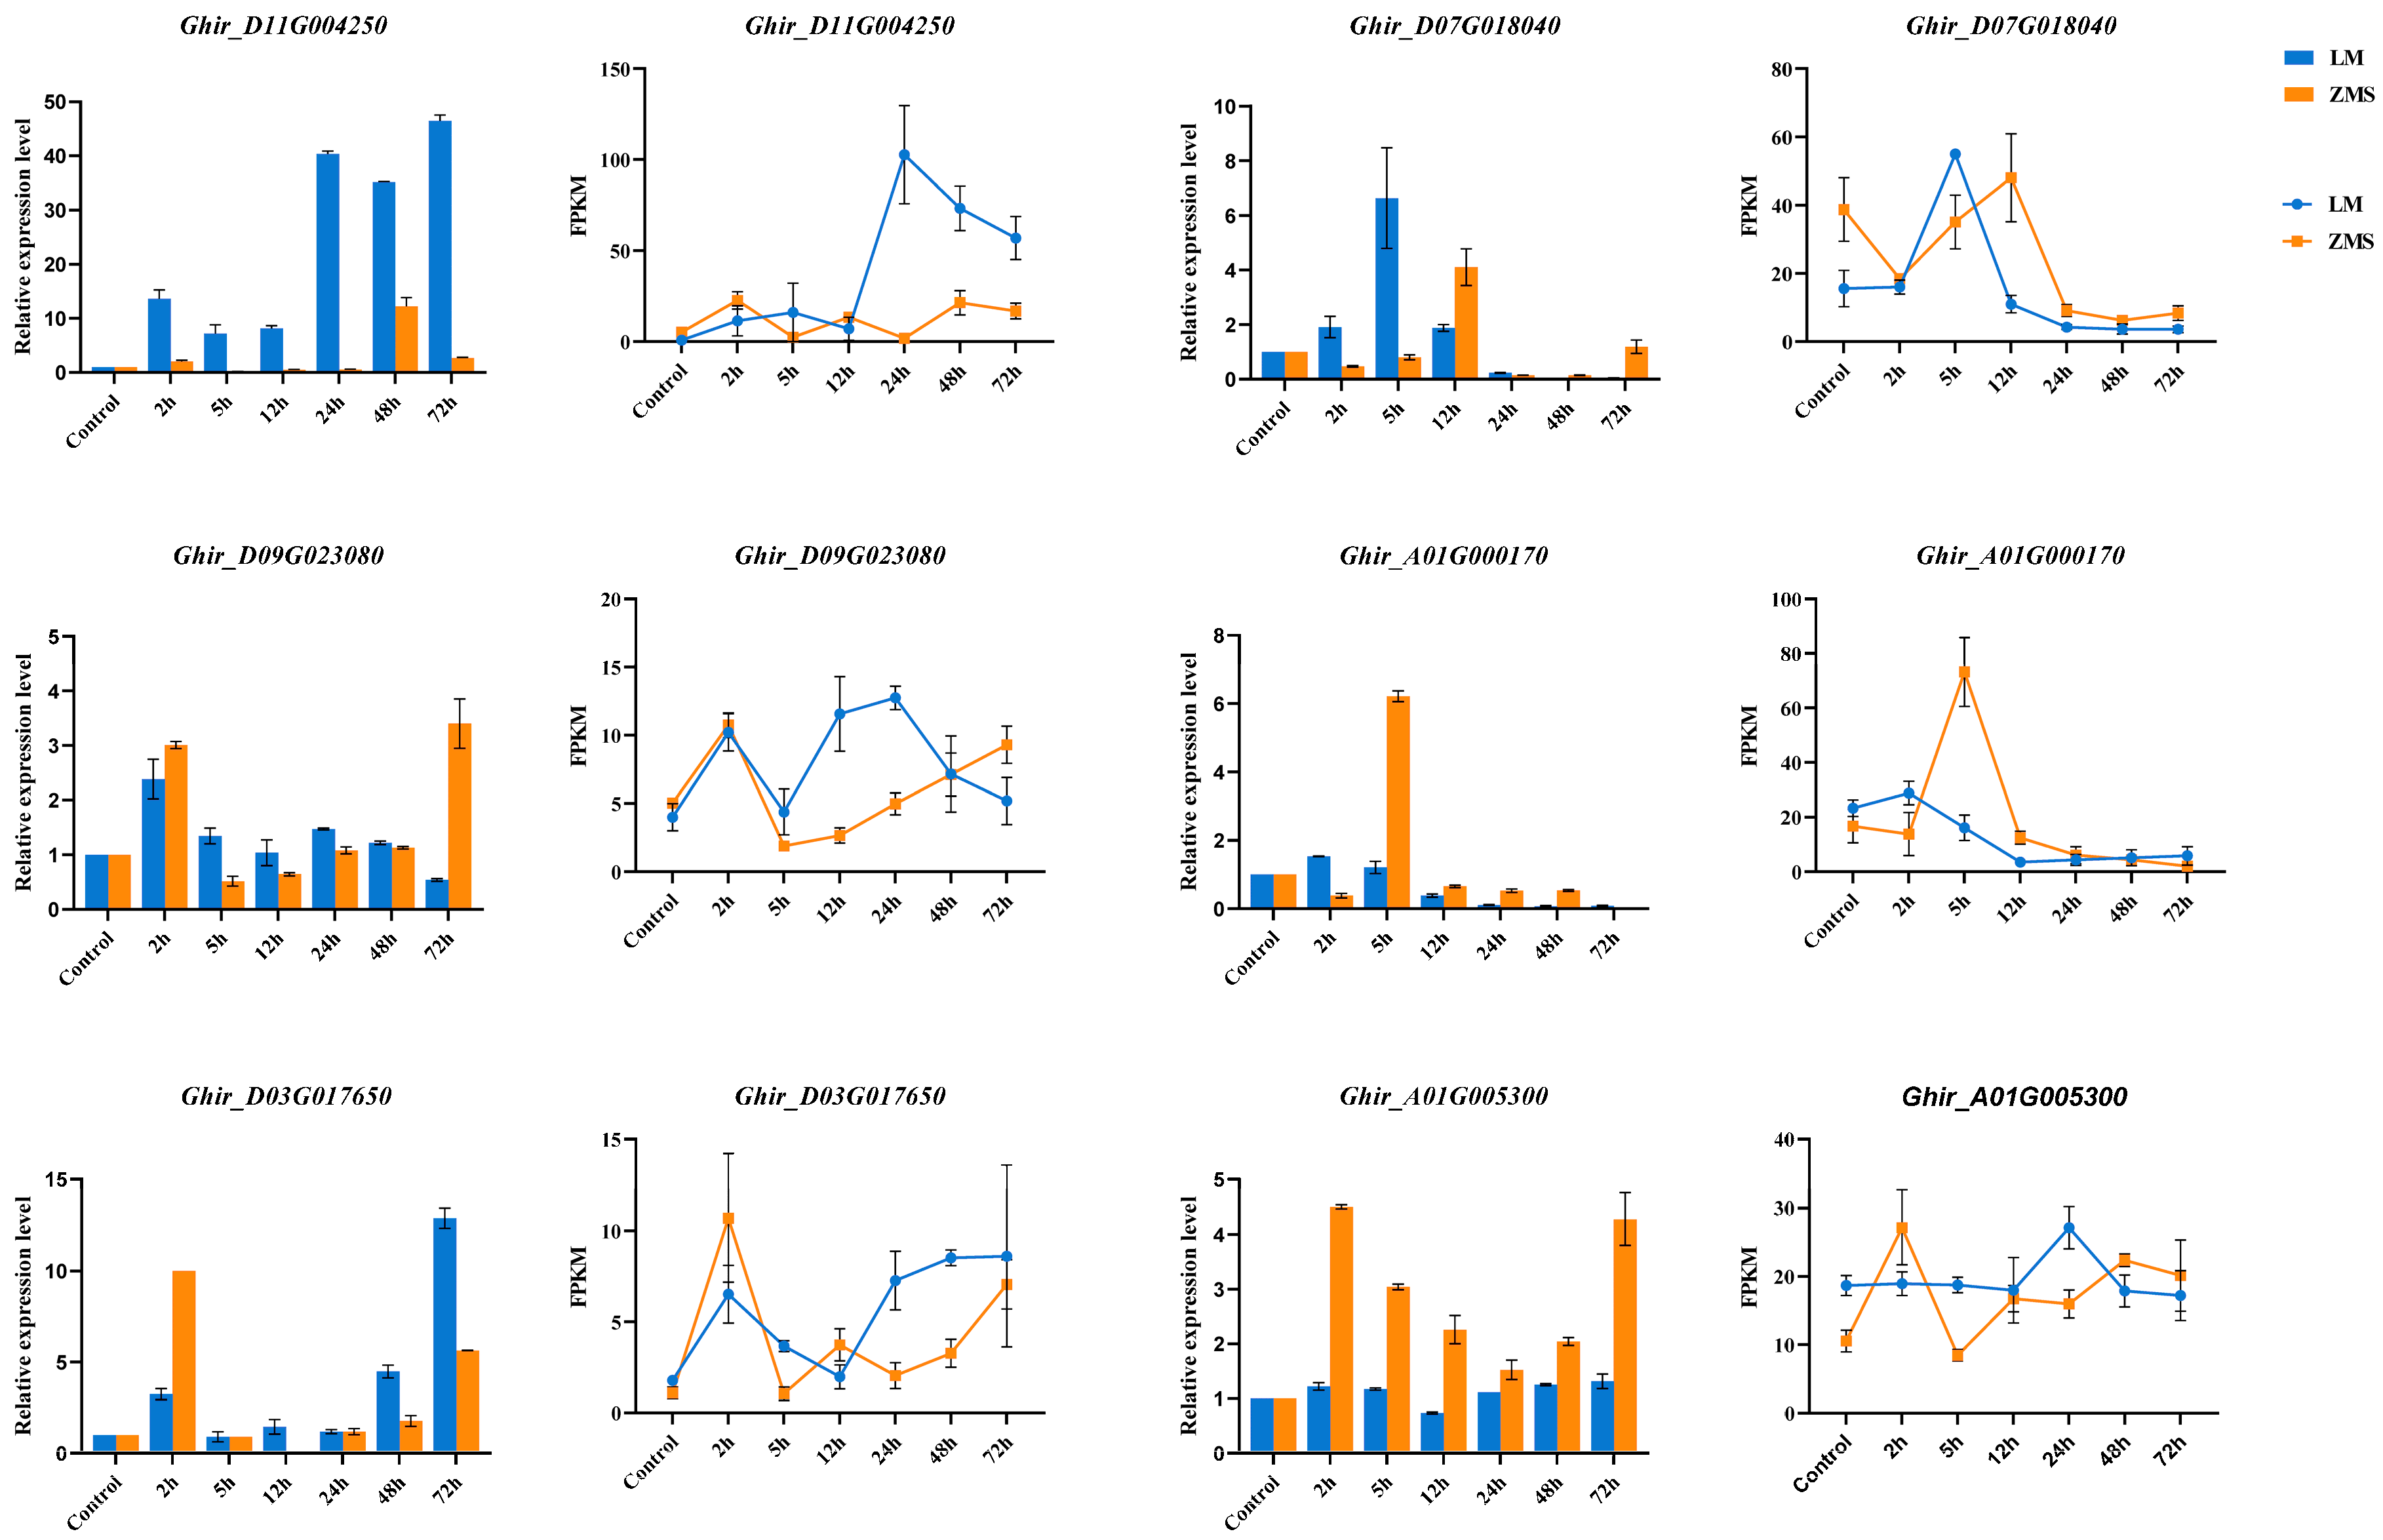
The reliability of the transcript expression profiles obtained via RNA-seq was verified using qRT-PCR. Six DEGs were randomly selected to design specific primers for amplification in 42 samples (Figure 6, Table S8). The QRT-PCR results showed that the expression levels of the selected genes changed significantly under salt stress, and Ghir_D11G004250 was consistently highly expressed in LM at multiple time points. According to the gene annotation results, Ghir_D11G004250 belongs to the bHLH transcription factor family, demonstrating the potential critical role of this gene in salt tolerance. Ghir_A01G000170 and Ghir_D07G018040 were annotated as NAC domain-containing protein 35 and Chlorophyll a-b binding protein 151, respectively, and these two genes were significantly highly expressed within 12 h of stress induction, suggesting a role in the prophylactic response. In addition, the expression patterns of Ghir_D09G023080, Ghir_D03G017650, and Ghir_A01G005300 revealed the association of ETR2, At4g16563, and HBDA with salt tolerance according to the gene annotation results. Overall, the qRT-PCR results were positively correlated with the gene change trends revealed via RNA-seq, which verified the reliability of the RNA-seq data.
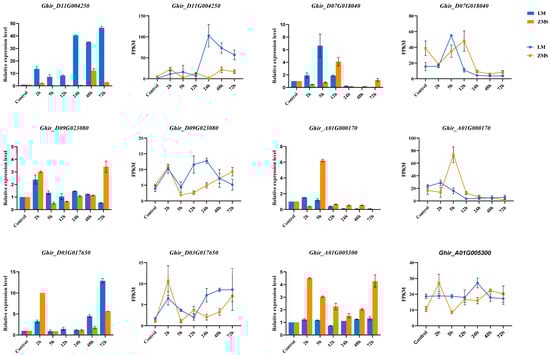
Figure 6.
qRT-PCR validation of DEGs. The histograms show the relative expression of the DEGs, the line graphs show the DEG transcriptome expression profiles.
4. Discussion
4.1. RNA-Seq Mining of Salt Tolerance Genes
Plants’ responses to adverse environmental conditions involve complex molecular mechanisms involving the synergistic action of many genes. These mechanisms precisely and specifically regulate cellular biological response processes in different tissues and response phases to maintain the homeostasis and ion balance of the internal environment to allow the acquirement of adaptive resistance. A comparative time point experimental design enables the systematic measurement of changes in the expression levels of most genes in space and time, a process that can decipher the dynamic and coordinated roles of genes in complex regulatory networks when plants respond to unfavorable conditions [28,29]. István Szádeczky-Kardoss performed comparative time point transcriptome sequencing on wild-type and TFIIS-1 mutant Arabidopsis thaliana specimens, demonstrating that TFIIS is dynamically regulated during heat stress and sustains transcription to support proteotoxic stress and cellular pathway (including photosynthesis) processes [30]. This finding has also been reported for cotton resistance to salt stress. Previous transcriptome analyses of non-transgenic and transgenic ScALDH21 cotton at 0 d, 2 d, and 5 d after salt stress showed that the ScALDH21 gene enhances cotton resistance to salt stress by stimulating the expression of genes related to stress responses, enhancing photosynthesis and improving carbohydrate metabolism [31]. In this study, ZMS and LM were used as salt-sensitive and salt-tolerant varieties, respectively. By sequencing the comparative time point transcriptomes of the salt-tolerant differential cotton cultivars, we aimed to find the common response pathways and specific regulatory pathways involved in salt stress and clarify the effects of each metabolic regulatory network on the salt tolerance characteristics. The transcriptome sequencing results showed that 288.63 Gb of clean data were obtained from 42 sequenced libraries. The amount of clean data for all the samples reached 5.76 Gb, with a GC content above 43.16% and a Q30 base percentage above 93.77%. At the same time, qRT-PCR was used to detect the gene expression profiles of the transcriptome, and the above results provide a strong basis for further analysis and mining using RNA-seq data.
4.2. Metabolic Networks Regulate Cotton’s Resistance to Salt Stress
Both LM and ZMS mobilized numerous differentially expressed genes to help them acclimatize to the high-salt environment within 72 h after salt stress treatment. The KEGG enrichment results indicated the variability of metabolic regulation patterns at different time stages. The up-regulated, differentially regulated genes at the initial stage of the LM stress response were mainly enriched in photosynthesis-related antenna proteins. It has been demonstrated that plants undergoing photosynthesis had elevated expression during salt stress [32], and ensuring the stability of the photosystem helps to enhance the tolerance of plants [33]. At 12 h, lysine degradation; valine, leucine, and isoleucine degradation; beta-alanine metabolism; glyoxylate and dicarboxylate metabolism; tryptophan metabolism; and autophagy, as well as the peroxisome, fatty acid metabolism, fatty acid degradation, and carbon metabolism, were significantly enriched, reflecting that at this point, the major modes of regulation in plants involve amino acid biosynthesis, membrane lipid remodeling, autophagy, and ROS scavenging. Multiple types of amino acid synthesis and accumulation are detected in most abiotic stresses [34,35,36]. It is widely recognized that the accumulation of some specific amino acids is associated with the enhancement of plant resistance [35,37], However, there is no consensus on the potential mechanism of action of these amino acids, which may act as precursors for the synthesis of other secondary metabolites or regulate osmotic homeostasis due to changes in amino acid content induced by protein turnover under adverse conditions [38]. According to existing studies, fatty acid degradation leads to a decrease in membrane fluidity [39,40], further limiting the uptake of Na+ and Cl− by relevant transport proteins to maintain osmotic homeostasis [41]. Additionally, reduced membrane fluidity reduces membrane sensitivity, helping to maintain integrity [42]. In this study, the fatty acid metabolic pathway changes were consistent with those observed in Mesembryanthemum crystallinum L., Spartina patens, and soybean under haline conditions [43,44,45], revealing an important regulatory mechanism of membrane homeostasis in salt stress. Many studies have shown that increased unsaturated fatty acid content contributes to stress tolerance [46]. It has been reported that this mechanism of action occurs due to the fact that unsaturated fatty acids alleviate salt-stress-induced PSII photoinhibition, safeguarding photosynthetic processes [47]. Autophagy is a conserved evolutionary cellular degradation process, playing a key role in plants’ stress responses [48]. Similar to the results reported for cucumber and poplar, the results for Arabidopsis suggested that salt stress induces the expression of autophagy genes to produce autophagosomes, which alleviate stress by accelerating the turnover of oxidized proteins in cells [48,49,50]. Peroxisomes are involved in ROS metabolism and regulate cellular redox levels, playing an important role in defense against oxidative stress [51]. The significant enrichment of peroxisome metabolism observed in the presented study was also found in regard to wheat, rice, and allotriploid Populus cathayana [52,53,54]. In addition to the similarity in regulation in ZMS, the regulatory mechanisms of LM with respect to salt stress include plant–pathogen interactions, plant hormone signal transduction, the MAPK signaling pathway, and carotenoid biosynthesis. Plant–pathogen interactions are activated through PAMP-triggered immunity (PTI) and effector-triggered immunity (ETI) [55]. The activation of PTI and ETII involves MAPK signaling [56], which is regulated by the major phytohormone abscisic acid (ABA) [57] and activates downstream responses through numerous TFs [58]. In salinity-treated oat, researchers also detected plant–pathogen interactions, plant hormone signal transduction, and MAPK signaling pathway activity [59], consistent with the results of the present study, revealing the integrated role of these signaling pathways in salt stress. In addition, the co-DEGs of LM and ZMS were mainly enriched in carbohydrate metabolism, a process that involves carbon allocation under stress [60]. C-labeled carbon partitioning showed that the aboveground parts of saline plants receive more carbon partitioning than belowground parts under salt stress to improve the defense system [61]. In perennial ryegrass, both salt-sensitive cultivars and salt-tolerant cultivars’ salt stress responses involved carbohydrate metabolism and carbon partitioning [62], consistent with the results of this study. The involvement of ABA in stress acclimation has been reported in most plants [63,64,65], and the biological functions of ABA are mainly manifested in the control of stomatal closure [66], the regulation of osmotic homeostasis [67], and crosstalk stress signaling [68], all of which play important roles. The accumulation of carotenoids as ABA synthesis precursors is also crucial in salt stress [69]. The overexpression of the carotenoid biosynthesis genes LcPDS, LcZDS, and LcCRTISO enhances salt tolerance in tobacco [63].
4.3. TFs Reveal Salt Tolerance Strategies in Cotton
We identified several TFs involved in the salt tolerance response, namely, WRKY, ERF, NAC, bHLH, bZIP, and MYB, which may play defense roles by regulating the expression of downstream genes. WRKY, as one of the largest families of TFs in plants, is involved in abiotic stress response processes through phytohormone signaling and ROS scavenging pathways [70,71]. WRKY TFs are involved in hormonal processes, mainly in the ABA signaling pathway. Additionally, the overexpression of AtWRKY25 and AtWRKY33 increased salt tolerance in Arabidopsis, while 31 and 208 potential downstream targets related to ABA were identified [72]. Other studies have shown that salt tolerance is enhanced under stress conditions by accumulating more endogenous ABA in transgenic lines [73,74,75,76,77]. The overexpression of IbWRKY2 and HbWRKY83 in Arabidopsis enhances salt tolerance through improving ROS scavenging [78,79]. ERF, an AP2/ERF superfamily protein, plays an important role in plant defense responses by targeting and regulating Na+/K+ transporter genes and antioxidant enzyme genes to maintain ionic and ROS homeostasis. The MdERF106 gene of Malus domestica promotes the downstream expression of MdSOS1, which, in turn, promotes Na+ efflux [80]. LcERF056 enhances salt tolerance in Lotus corniculatus by directly up-regulating the ROS-related genes LcLTP, LcPrx, and LcRP [81]. All the above evidence supports the notion of a regulatory strategy of ERFs in salt stress. The positive role of NAC under salt stress has been characterized in multiple crops [82,83,84]. The overexpression of CarNAC4 enhances the expression of the downstream stress-responsive genes RD29A, ERD10, COR15A, COR47, KIN1, and DREB2A to improve salt tolerance [84]. The up-regulated expression of bHLH under salt stress confers plant tolerance and plays a significant role in Na+/K+ ion transport, ROS scavenging, and osmoregulation [85,86,87]. A large body of evidence suggests that bZIP is involved in an ABA-dependent stress signaling pathway, activating downstream resistance-related genes by binding to the ABA response element ABRE, and that downstream genes regulate salt tolerance in terms of secondary metabolites, osmoregulation, and ROS scavenging [88,89,90]. The defense of MYB against salt stress in plants is mainly reflected in the induction of synthesis secondary metabolites, including anthocyanins, flavonoids, and lignans [91,92]. The accumulation of anthocyanins and flavonoids under stress promotes endogenous ROS scavenging and reduces oxidative damage [91,93,94,95]. Lignin is an important component of the cell wall, and lignin deposition contributes to the strengthening of the physical function of the cell wall and plays an important role in salt acclimatization [91,96]. The regulatory role of MYB in salt tolerance has been demonstrated in Arabidopsis, maize, and rice [97,98,99]. All six TFs mentioned above were identified in our study, providing a reference basis for analyzing the salt tolerance strategy of cotton.
4.4. Salt Stress Affects Hubgene Expression
We screened 11 genes for changes in expression under salt stress by analyzing the gene interaction network within salt tolerance-related modules. According to the results of previous studies, COR2 is a downstream-regulated gene of the WRKY transcription factor family, an enzyme that plays a key role in the biosynthesis of benzylisoquinoline alkaloids (BIAs) [100,101]. There is still a large gap in research on the involvement of BIAs in abiotic stresses, and we have compiled the possible roles of BIA from only a few reports. Li isolated ten alkaloid species, two of which, both BIAs, exhibited antioxidant activity that was closely related to ROS and free-radical-mediated oxidative stress [102]. Similar reports mention that BIA accumulation can effectively alleviate oxidative stress and improve plant salt resistance [103]. Based on this evidence, we hypothesized that COR2 plays a role in synthesizing BIAs to balance ROS levels. In addition, a little-known fact about the function of EXL5 is that it is significantly up-regulated after metal contamination in Arabidopsis, so it could serve as a biomarker for metal stress [104]. Differential expression of EXL5 was similarly detected under Fe stress [105]. Although there are no reports on EXL5 in relation to salt stress, based on the similarity of plant defense mechanisms under abiotic stresses [106], these findings may provide a reference for further studies on the mechanism of action of EXL5 in response to salt stress. MIK2 is a membrane receptor that senses extraplasmic environmental stresses and triggers immunity [107]. MIK2 mutants are defective in regard to both salt stress tolerance and cell wall integrity [108]. Another study showed that in NaCl-stress-induced Arabidopsis, MIK2-1 accumulated more dry weight than the wild type, and MIK2 expression enhanced biomass assimilation [109]. All of this evidence demonstrates that MIK2 is required for salt tolerance. WRKY30, belonging to the WRKY transcription factor superfamily, activates defense responses by binding to multiple stress genes. The overexpression of AtWRKY30 enhances salt tolerance in Arabidopsis [110]. The positive role of WRKY30 in salt stress was also characterized in Michx and grape [111,112]. ATJ11 is a molecular chaperone heat-shock protein (DnaJ/Hsp40). A study on GsJ11, the homologue of ATJ11 in soybean, showed that GsJ11 was highly induced in the presence of NaHCO3 within 3 h. The mutant line was less tolerant to NaHCO3 than the wild strain, and the stress-responsive genes in the overexpression strain had higher levels of transcription [113]. Another study characterized the regulatory capacity of ATJ11 in chloroplast redox through a global stress response triggered by an ATJ11 knockout mutant [114]. These reports provide a reference point for studying the role of ATJ11 in salt tolerance. SBP2, a selenium-binding protein, is involved in the process of selenium (Se) synthesis and accumulation. Under salt stress, Se accumulation can regulate the ROS pathway and osmotic metabolism and thus protect wheat from oxidative damage [115]. The same conclusion was reached in regard to soybean, to which Se conferred salt tolerance [116]. Argininosuccinate lyase (ASL) catalyzes the breakdown of argininosuccinate to arginine and plays an important role in arginine metabolism. The catalytic role of ASL allows plants to amass sufficient nitrogen reserves under stress conditions, and these reserves are further allocated to defense regulatory mechanisms and help to refine a plant’s energy conversion in unfavorable environments [117]. The F-box protein SKIP27 identified in this study was also shown to be induced by salt stress in another report [118], suggesting that this gene may play an important role in the salt tolerance response, and its function needs to be further verified. F6′H1 is an essential enzyme for coumarin biosynthesis [119]. Coumarin synthesis effectively improves iron uptake by plants in saline soils, helping to maintain normal life activities under salt stress [119]. The expression of GmF6′H1 in soybean is significantly salt-inducible, and the overexpression of GmF6′H1 in Arabidopsis enhanced salt tolerance [120]. In summary, the 11 genes screened via the gene interaction network in this study may function in the salt stress response, and their specific mechanism of action needs to be verified in future experiments.
5. Conclusions
In this study, RNA-seq analysis of cotton revealed certain commonalities and specificities in the salt stress response of cotton cultivars with different sensitivities. Photosynthesis, amino acid biosynthesis, membrane lipid remodeling, autophagy, and ROS scavenging are co-regulated pathways of both. Salt-tolerant cultivars have better performance in regard to metabolic pathways such as plant–pathogen interactions, plant hormone signal transduction, the MAPK signaling pathway, and carotenoid biosynthesis. Four salt tolerance-related modules were screened using WGCNA; they contained 114 TFs, of which WRKY, ERF, NAC, bHLH, bZIP, and MYB were important regulators in response to salt stress. Gene interaction network analysis identified 11 key genes: Ghir_A01G013620, Ghir_D02G020200, Ghir_D05G005640, Ghir_A06G003750, Ghir_D06G003700, Ghir_D12G026490, Ghir_A03G022170, Ghir_A02G002100, Ghir_A04G008730, and Ghir_A09G007820. They are hypothesized to function in the salt stress response.
Supplementary Materials
The following supporting information can be downloaded at: https://www.mdpi.com/article/10.3390/genes15091176/s1, Table S1: Assessment of the integrity and quality of RNA samples; Table S2: Statistical results regarding the sequencing data; Table S3: Comparison of sequencing data with reference sequences; Table S4: Analysis of specific DEGs’ KEGG enrichment in ZMS and LM; Table S5: KEGG enrichment in the co-DEGs of LM and ZMS; Table S6: Results for KEGG enrichment of modules significantly correlated with traits; Table S7: Transcription factors associated with salt tolerance; Table S8: Primers used in qRT-PCR; Figure S1: ZMS and LM unique DEGs GO enrichment analysis; Figure S2: Softpower plot; Figure S3: Transcription factors in the salt tolerance module.
Author Contributions
Writing—original draft preparation, B.P.; writing—review and editing, B.P.; methodology, J.L., Z.W. and S.S.; software, P.L.; validation, R.Z.; formal analysis, J.L. and R.Z.; project administration, W.G. and S.L.; funding acquisition, W.G. and S.L. All authors have read and agreed to the published version of the manuscript.
Funding
This research was funded through the Xinjiang Uygur Autonomous Region “Tianchi Talents” Introduction Program; the Autonomous Region Science and Technology Department; the Autonomous Region Innovation Environment and Innovation Conditions (Natural Science Fund)—Evaluation of Salinity Tolerance of Cotton Resources in Xinjiang and Genetic Study (grant number 2018Q016); and the 24-Year Modern Agricultural Industry Technology System of the Department of Agriculture (grant number 2224ZZQRCXM2).
Data Availability Statement
The relevant data are contained within this paper and its supporting files. The sequencing data generated in this study have been uploaded to the National Center for Biotechnology Information Database under BioProject PRJNA1134120.
Acknowledgments
The authors would like to thank all their colleagues for their fruitful discussions on this work.
Conflicts of Interest
The authors declare no conflicts of interest.
References
- Singh, A. Soil salinity: A global threat to sustainable development. Soil Use Manag. 2022, 38, 39–67. [Google Scholar] [CrossRef]
- Singh, A. Soil salinization management for sustainable development: A review. J. Environ. Manag. 2021, 277, 111383. [Google Scholar] [CrossRef] [PubMed]
- Rengasamy, P. World salinization with emphasis on Australia. J. Exp. Bot. 2006, 57, 1017–1023. [Google Scholar] [CrossRef]
- Chen, J.; Mueller, V. Coastal climate change, soil salinity and human migration in Bangladesh. Nat. Clim. Chang. 2018, 8, 981–985. [Google Scholar] [CrossRef]
- Gong, Z. Plant abiotic stress: New insights into the factors that activate and modulate plant responses. J. Integr. Plant Biol. 2021, 63, 429–430. [Google Scholar] [CrossRef] [PubMed]
- Zhao, S.; Zhang, Q.; Liu, M.; Zhou, H.; Ma, C.; Wang, P. Regulation of Plant Responses to Salt Stress. Int. J. Mol. Sci. 2021, 22, 4609. [Google Scholar] [CrossRef] [PubMed]
- Tyagi, P.; Singh, D.; Mathur, S.; Singh, A.; Ranjan, R. Upcoming progress of transcriptomics studies on plants: An overview. Front. Plant Sci. 2022, 15, 1030890. [Google Scholar] [CrossRef]
- Rastogi, S.; Shah, S.; Kumar, R.; Vashisth, D.; Akhtar, M.Q.; Kumar, A.; Dwivedi, U.N.; Shasany, A.K. Ocimum metabolomics in response to abiotic stresses: Cold, flood, drought and salinity. PLoS ONE 2019, 14, e0210903. [Google Scholar] [CrossRef] [PubMed]
- Segura, M.; García, A.; Benítez, Á.; Martínez, C.; Jamilena, M. Comparative RNA-Seq Analysis between Monoecious and Androecious Plants Reveals Regulatory Mechanisms Controlling Female Flowering in Cucurbita pepo. Int. J. Mol. Sci. 2023, 24, 17195. [Google Scholar] [CrossRef] [PubMed]
- Xu, M.; Li, X.; Xie, W.; Lin, C.; Wang, Q.; Tao, Z. ETHYLENE INSENSITIVE3/EIN3-LIKE1 modulate FLOWERING LOCUS C expression via histone demethylase interaction. Plant Physiol. 2023, 192, 2290–2300. [Google Scholar] [CrossRef] [PubMed]
- Aleem, M.; Raza, M.M.; Haider, M.S.; Atif, R.M.; Ali, Z.; Bhat, J.A.; Zhao, T. Comprehensive RNA-seq analysis revealed molecular pathways and genes associated with drought tolerance in wild soybean (Glycine soja Sieb. and Zucc.). Physiol. Plant. 2021, 172, 707–732. [Google Scholar] [CrossRef] [PubMed]
- Liu, Q.; Li, P.; Cheng, S.; Zhao, Z.; Liu, Y.; Wei, Y.; Lu, Q.; Han, J.; Cai, X.; Zhou, Z.; et al. Protoplast Dissociation and Transcriptome Analysis Provides Insights to Salt Stress Response in Cotton. Int. J. Mol. Sci. 2022, 23, 2845. [Google Scholar] [CrossRef] [PubMed]
- Zhu, J.K. Salt and drought stress signal transduction in plants. Annu. Rev. Plant Biol. 2002, 53, 247–273. [Google Scholar] [CrossRef] [PubMed]
- Sun, K.; Mehari, T.G.; Fang, H.; Han, J.; Huo, X.; Zhang, J.; Chen, Y.; Wang, D.; Zhuang, Z.; Ditta, A.; et al. Transcriptome, proteome and functional characterization reveals salt stress tolerance mechanisms in upland cotton (Gossypium hirsutum L.). Front. Plant Sci. 2023, 16, 1092616. [Google Scholar] [CrossRef]
- Wang, D.; Lu, X.; Chen, X.; Wang, S.; Wang, J.; Guo, L.; Yin, Z.; Chen, Q.; Ye, W. Temporal salt stress-induced transcriptome alterations and regulatory mechanisms revealed by PacBio long-reads RNA sequencing in Gossypium hirsutum. BMC Genom. 2020, 21, 838. [Google Scholar] [CrossRef] [PubMed]
- Yu, H.; Guo, Q.; Ji, W.; Wang, H.; Tao, J.; Xu, P.; Chen, X.; Ali, W.; Wu, X.; Shen, X.; et al. Transcriptome Expression Profiling Reveals the Molecular Response to Salt Stress in Gossypium anomalum Seedlings. Plants 2024, 13, 312. [Google Scholar] [CrossRef] [PubMed]
- Xu, P.; Guo, Q.; Meng, S.; Zhang, X.; Xu, Z.; Guo, W.; Shen, X. Genome-wide association analysis reveals genetic variations and candidate genes associated with salt tolerance related traits in Gossypium hirsutum. BMC Genom. 2021, 22, 26. [Google Scholar] [CrossRef]
- Kim, D.; Langmead, B.; Salzberg, S.L. HISAT: A fast spliced aligner with low memory requirements. Nat. Methods 2015, 12, 357–360. [Google Scholar] [CrossRef] [PubMed]
- Pertea, M.; Pertea, G.M.; Antonescu, C.M.; Chang, T.C.; Mendell, J.T.; Salzberg, S.L. StringTie enables improved reconstruction of a transcriptome from RNA-seq reads. Nat. Biotechnol. 2015, 33, 290–295. [Google Scholar] [CrossRef] [PubMed]
- Pruitt, K.D.; Tatusova, T.; Maglott, D.R. NCBI reference sequences (RefSeq): A curated non-redundant sequence database of genomes, transcripts and proteins. Nucleic Acids Res. 2007, 35, D61–D65. [Google Scholar] [CrossRef] [PubMed]
- Jensen, L.J.; Julien, P.; Kuhn, M.; Mering, C.; Muller, J.; Doerks, T.; Bork, P. eggNOG: Automated construction and annotation of orthologous groups of genes. Nucleic Acids Res. 2007, 36, D250–D254. [Google Scholar] [CrossRef]
- Kanehisa, M.; Goto, S.; Kawashima, S.; Okuno, Y.; Hattori, M. The KEGG resource for deciphering the genome. Nucleic Acids Res. 2004, 32, D277–D280. [Google Scholar] [CrossRef] [PubMed]
- Ashburner, M.; Ball, C.A.; Blake, J.A.; Botstein, D.; Butler, H.; Cherry, J.M.; Davis, A.P.; Dolinski, K.; Dwight, S.S.; Eppig, J.T.; et al. Gene ontology: Tool for the unification of biology. The Gene Ontology Consortium. Nat. Genet. 2000, 25, 25–29. [Google Scholar] [CrossRef] [PubMed]
- Trapnell, C.; Williams, B.A.; Pertea, G.; Mortazavi, A.; Kwan, G.; Baren, M.J.; Salzberg, S.L.; Wold, B.J.; Pachter, L. Transcript assembly and quantification by RNA-Seq reveals unannotated transcripts and isoform switching during cell differentiation. Nat. Biotechnol. 2010, 28, 511–515. [Google Scholar] [CrossRef] [PubMed]
- Love, M.I.; Huber, W.; Anders, S. Moderated estimation of fold change and dispersion for RNA-seq data with DESeq2. Genome Biol. 2014, 15, 550. [Google Scholar] [CrossRef]
- Wang, R.; Wang, Y.; Yao, W.; Ge, W.; Jiang, T.; Zhou, B. Transcriptome Sequencing and WGCNA Reveal Key Genes in Response to Leaf Blight in Poplar. Int. J. Mol. Sci. 2023, 24, 10047. [Google Scholar] [CrossRef] [PubMed]
- Swift, M.L. GraphPad Prism, Data Analysis, and Scientific Graphing. J. Chem. Inf. Comput. Sci. 1997, 37, 411–412. [Google Scholar] [CrossRef]
- Rao, A.; Barkley, D.; França, G.S.; Yanai, I. Exploring tissue architecture using spatial transcriptomics. Nature 2021, 596, 211–220. [Google Scholar] [CrossRef] [PubMed]
- Chen, T.Y.; You, L.; Hardillo, J.A.U.; Chien, M.P. Spatial Transcriptomic Technologies. Cells 2023, 12, 2042. [Google Scholar] [CrossRef] [PubMed]
- Szádeczky-Kardoss, I.; Szaker, H.M.; Verma, R.; Darkó, É.; Pettkó-Szandtner, A.; Silhavy, D.; Csorba, T. Elongation factor TFIIS is essential for heat stress adaptation in plants. Nucleic Acids Res. 2022, 50, 1927–1950. [Google Scholar] [CrossRef] [PubMed]
- Yang, H.; Yang, Q.; Zhang, D.; Wang, J.; Cao, T.; Bozorov, T.A.; Cheng, L.; Zhang, D. Transcriptome Reveals the Molecular Mechanism of the ScALDH21 Gene from the Desert Moss Syntrichia caninervis Conferring Resistance to Salt Stress in Cotton. Int. J. Mol. Sci. 2023, 24, 5822. [Google Scholar] [CrossRef] [PubMed]
- Gul, H.S.; Ulfat, M.; Zafar, Z.U.; Haider, W.; Ali, Z.; Manzoor, H.; Afzal, S.; Ashraf, M.; Athar, H.U. Photosynthesis and Salt Exclusion Are Key Physiological Processes Contributing to Salt Tolerance of Canola (Brassica napus L.): Evidence from Physiology and Transcriptome Analysis. Genes 2022, 14, 3. [Google Scholar] [CrossRef] [PubMed]
- Zahra, N.; Al Hinai, M.S.; Hafeez, M.B.; Rehman, A.; Wahid, A.; Siddique, K.H.M.; Farooq, M. Regulation of photosynthesis under salt stress and associated tolerance mechanisms. Plant Physiol. Biochem. 2022, 178, 55–69. [Google Scholar] [CrossRef] [PubMed]
- Chen, J.F.; Liu, Y.; Zhang, T.Y.; Zhou, Z.F.; Huang, J.Y.; Zhou, T.; Hua, Y.P. Integrated physiological and transcriptional dissection reveals the core genes involving nutrient transport and osmoregulatory substance biosynthesis in allohexaploid wheat seedlings under salt stress. BMC Plant Biol. 2022, 22, 502. [Google Scholar] [CrossRef] [PubMed]
- Bao, J.; Liu, Z.; Ding, Z.; Yisilam, G.; Wang, Q.; Tian, X. Metabolomic analysis reveals key metabolites and metabolic pathways in Suaeda salsa under salt and drought stress. Funct. Plant Biol. 2023, 50, 701–711. [Google Scholar] [CrossRef] [PubMed]
- Liu, Z.; Hua, Y.; Wang, S.; Liu, X.; Zou, L.; Chen, C.; Zhao, H.; Yan, Y. Analysis of the Prunellae Spica transcriptome under salt stress. Plant Physiol. Biochem. 2020, 156, 314–322. [Google Scholar] [CrossRef]
- Batista-Silva, W.; Heinemann, B.; Rugen, N.; Nunes-Nesi, A.; Araújo, W.L.; Braun, H.P.; Hildebrandt, T.M. The role of amino acid metabolism during abiotic stress release. Plant Cell Environ. 2019, 42, 1630–1644. [Google Scholar] [CrossRef] [PubMed]
- Hildebrandt, T.M. Synthesis versus degradation: Directions of amino acid metabolism during Arabidopsis abiotic stress response. Plant Mol. Biol. 2018, 98, 121–135. [Google Scholar] [CrossRef]
- Bohn, M.; Lüthje, S.; Sperling, P.; Heinz, E.; Dörffling, K. Plasma membrane lipid alterations induced by cold acclimation and abscisic acid treatment of winter wheat seedlings differing in frost resistance. J. Plant Physiol. 2007, 164, 146–156. [Google Scholar] [CrossRef]
- Lin, H.; Wu, L. Effects of salt stress on root plasma membrane characteristics of salt-tolerant and salt-sensitive buffalograss clones. Environ. Exp. Bot. 1996, 36, 239–254. [Google Scholar] [CrossRef]
- Wu, J.; Seliskar, D.M.; Gallagher, J.L. Stress tolerance in the marsh plant Spartina patens: Impact of NaCl on growth and root plasma membrane lipid composition. Physiol. Plant. 1998, 102, 307–317. [Google Scholar] [CrossRef]
- Guo, Q.; Liu, L.; Barkla, B.J. Membrane Lipid Remodeling in Response to Salinity. Int. J. Mol. Sci. 2019, 20, 4264. [Google Scholar] [CrossRef]
- Guo, Q.; Liu, L.; Rupasinghe, T.W.T.; Roessner, U.; Barkla, B.J. Salt stress alters membrane lipid content and lipid biosynthesis pathways in the plasma membrane and tonoplast. Plant Physiol. 2022, 189, 805–826. [Google Scholar] [CrossRef]
- Duarte, B.; Matos, A.R.; Marques, J.C.; Caçador, I. Leaf fatty acid remodeling in the salt-excreting halophytic grass Spartina patens along a salinity gradient. Plant Physiol. Biochem. 2018, 124, 112–116. [Google Scholar] [CrossRef]
- Rehman, H.M.; Chen, S.; Zhang, S.; Khalid, M.; Uzair, M.; Wilmarth, P.A.; Ahmad, S.; Lam, H.M. Membrane Proteomic Profiling of Soybean Leaf and Root Tissues Uncovers Salt-Stress-Responsive Membrane Proteins. Int. J. Mol. Sci. 2022, 23, 13270. [Google Scholar] [CrossRef]
- Khomutov, G.; Fry, I.V.; Huflejt, M.E.; Packer, L. Membrane lipid composition, fluidity, and surface charge changes in response to growth of the fresh water cyanobacterium Synechococcus 6311 under high salinity. Arch. Biochem. Biophys. 1990, 277, 263–267. [Google Scholar] [CrossRef] [PubMed]
- Liu, S.; Wang, W.; Li, M.; Wan, S.; Sui, N. Antioxidants and unsaturated fatty acids are involved in salt tolerance in peanut. Acta Physiol. Plant. 2017, 207, 39. [Google Scholar] [CrossRef]
- Zhang, Y.; Wang, Y.; Wen, W.; Shi, Z.; Gu, Q.; Ahammed, G.J.; Cao, K.; Jahan, S.M.; Shu, S.; Wang, J.; et al. Hydrogen peroxide mediates spermidine-induced autophagy to alleviate salt stress in cucumber. Autophagy 2021, 17, 2876–2890. [Google Scholar] [CrossRef] [PubMed]
- Su, W.; Bao, Y.; Lu, Y.; He, F.; Wang, S.; Wang, D.; Yu, X.; Yin, W.; Xia, X.; Liu, C. Poplar Autophagy Receptor NBR1 Enhances Salt Stress Tolerance by Regulating Selective Autophagy and Antioxidant System. Front. Plant Sci. 2021, 11, 568411. [Google Scholar] [CrossRef]
- Luo, L.; Zhang, P.; Zhu, R.; Fu, J.; Su, J.; Zheng, J.; Wang, Z.; Wang, D.; Gong, Q. Autophagy Is Rapidly Induced by Salt Stress and Is Required for Salt Tolerance in Arabidopsis. Front. Plant Sci. 2017, 8, 1459. [Google Scholar] [CrossRef]
- He, A.; Dean, J.M.; Lodhi, I.J. Peroxisomes as cellular adaptors to metabolic and environmental stress. Trends Cell Biol. 2021, 31, 656–670. [Google Scholar] [CrossRef] [PubMed]
- Qiao, H.; Jiao, B.; Wang, J.; Yang, Y.; Yang, F.; Geng, Z.; Zhao, G.; Liu, Y.; Dong, F.; Wang, Y.; et al. Comparative Analysis of miRNA Expression Profiles under Salt Stress in Wheat. Genes 2023, 14, 1586. [Google Scholar] [CrossRef] [PubMed]
- Cui, P.; Liu, H.; Islam, F.; Li, L.; Farooq, M.A.; Ruan, S.; Zhou, W. OsPEX11, a Peroxisomal Biogenesis Factor 11, Contributes to Salt Stress Tolerance in Oryza sativa. Front. Plant Sci. 2016, 15, 1357. [Google Scholar] [CrossRef]
- Qiu, T.; Du, K.; Jing, Y.; Zeng, Q.; Liu, Z.; Li, Y.; Ren, Y.; Yang, J.; Kang, X. Integrated transcriptome and miRNA sequencing approaches provide insights into salt tolerance in allotriploid Populus cathayana. Planta 2021, 254, 25. [Google Scholar] [CrossRef]
- Deslandes, L.; Rivas, S. Catch me if you can: Bacterial effectors and plant targets. Trends Plant Sci. 2012, 17, 644–655. [Google Scholar] [CrossRef] [PubMed]
- Wang, D.; Wei, L.; Liu, T.; Ma, J.; Huang, K.; Guo, H.; Huang, Y.; Zhang, L.; Zhao, J.; Tsuda, K.; et al. Suppression of ETI by PTI priming to balance plant growth and defense through an MPK3/MPK6-WRKYs-PP2Cs module. Mol. Plant 2023, 16, 903–918. [Google Scholar] [CrossRef] [PubMed]
- Danquah, A.; de Zelicourt, A.; Colcombet, J.; Hirt, H. The role of ABA and MAPK signaling pathways in plant abiotic stress responses. Biotechnol. Adv. 2014, 32, 40–52. [Google Scholar] [CrossRef]
- Zarattini, M.; Farjadm, M.; Launay, A.; Cannella, D.; Soulié, M.C.; Bernacchia, G.; Fagard, M. Every cloud has a silver lining: How abiotic stresses affect gene expression in plant-pathogen interactions. J. Exp. Bot. 2021, 72, 1020–1033. [Google Scholar] [CrossRef]
- Wu, B.; Munkhtuya, Y.; Li, J.; Hu, Y.; Zhang, Q.; Zhang, Z. Comparative Transcriptional Profiling and Physiological Responses of Two Contrasting Oat Genotypes under Salt Stress. Sci. Rep. 2018, 8, 16248. [Google Scholar] [CrossRef]
- Dong, S.; Beckles, D.M. Dynamic changes in the starch-sugar interconversion within plant source and sink tissues promote a better abiotic stress response. J. Plant Physiol. 2019, 234–235, 80–93. [Google Scholar] [CrossRef]
- Li, H.; Duijts, K.; Pasini, C.; van Santen, J.E.; Lamers, J.; de Zeeuw, T.; Verstappen, F.; Wang, N.; Zeeman, S.C.; Santelia, D.; et al. Effective root responses to salinity stress include maintained cell expansion and carbon allocation. New Phytol. 2023, 238, 1942–1956. [Google Scholar] [CrossRef]
- Hu, T.; Hu, L.; Zhang, X.; Zhang, P.; Zhao, Z.; Fu, J. Differential responses of CO2 assimilation.; carbohydrate allocation and gene expression to NaCl stress in perennial ryegrass with different salt tolerance. PLoS ONE 2013, 8, e66090. [Google Scholar] [CrossRef]
- Li, C.; Ji, J.; Wang, G.; Li, Z.; Wang, Y.; Fan, Y. Over-Expression of LcPDS, LcZDS, and LcCRTISO, Genes from Wolfberry for Carotenoid Biosynthesis, Enhanced Carotenoid Accumulation, and Salt Tolerance in Tobacco. Front. Plant Sci. 2020, 11, 119. [Google Scholar] [CrossRef] [PubMed]
- Ye, N.; Jia, L.; Zhang, J. ABA signal in rice under stress conditions. Rice 2012, 5, 1. [Google Scholar] [CrossRef]
- Benech Arnold, R.L.; Fenner, M.; Edwards, P.J. Changes in germinability, ABA content and ABA embryonic sensitivity in developing seeds of Sorghum bicolor (L.) Moench. induced by water stress during grain filling. New Phytol. 1991, 118, 339–347. [Google Scholar] [CrossRef] [PubMed]
- Cai, S.; Chen, G.; Wang, Y.; Huang, Y.; Marchant, D.B.; Wang, Y.; Yang, Q.; Dai, F.; Hills, A.; Franks, P.J.; et al. Evolutionary Conservation of ABA Signaling for Stomatal Closure. Plant Physiol. 2017, 174, 732–747. [Google Scholar] [CrossRef] [PubMed]
- Yoshida, T.; Mogami, J.; Yamaguchi-Shinozaki, K. ABA-dependent and ABA-independent signaling in response to osmotic stress in plants. Curr. Opin. Plant Biol. 2014, 21, 133–139. [Google Scholar] [CrossRef]
- Cao, F.Y.; Yoshioka, K.; Desveaux, D. The roles of ABA in plant–pathogen interactions. J. Plant Res. 2011, 124, 489–499. [Google Scholar] [CrossRef]
- Cutler, A.J.; Krochko, J.E. Formation and breakdown of ABA. Trends Plant Sci. 1999, 4, 472–478. [Google Scholar] [CrossRef]
- Jiang, J.; Ma, S.; Ye, N.; Jiang, M.; Cao, J.; Zhang, J. WRKY transcription factors in plant responses to stresses. J. Integr. Plant Biol. 2017, 59, 86–101. [Google Scholar] [CrossRef]
- Rushton, P.J.; Somssich, I.E.; Ringler, P.; Shen, Q.J. WRKY transcription factors. Trends Plant Sci. 2010, 15, 247–258. [Google Scholar] [CrossRef]
- Jiang, Y.; Deyholos, M.K. Functional characterization of Arabidopsis NaCl-inducible WRKY25 and WRKY33 transcription factors in abiotic stresses. Plant Mol. Biol. 2009, 69, 91–105. [Google Scholar] [CrossRef]
- Ma, Q.; Xia, Z.; Cai, Z.; Li, L.; Cheng, Y.; Liu, J.; Nian, H. GmWRKY16 Enhances Drought and Salt Tolerance Through an ABA-Mediated Pathway in Arabidopsis thaliana. Front. Plant Sci. 2019, 2, 1979. [Google Scholar] [CrossRef] [PubMed]
- Ding, Z.J.; Yan, J.Y.; Li, C.X.; Li, G.X.; Wu, Y.R.; Zheng, S.J. Transcription factor WRKY46 modulates the development of Arabidopsis lateral roots in osmotic/salt stress conditions via regulation of ABA signaling and auxin homeostasis. Plant J. 2015, 84, 56–69. [Google Scholar] [CrossRef] [PubMed]
- Yan, H.; Jia, H.; Chen, X.; Hao, L.; An, H.; Guo, X. The cotton WRKY transcription factor GhWRKY17 functions in drought and salt stress in transgenic Nicotiana benthamiana through ABA signaling and the modulation of reactive oxygen species production. Plant Cell Physiol. 2014, 55, 2060–2076. [Google Scholar] [CrossRef] [PubMed]
- Ullah, A.; Sun, H.; Hakim; Yang, X.; Zhang, X. A novel cotton WRKY gene, GhWRKY6-like, improves salt tolerance by activating the ABA signaling pathway and scavenging of reactive oxygen species. Physiol. Plant. 2018, 162, 439–454. [Google Scholar] [CrossRef]
- Shi, W.Y.; Du, Y.T.; Ma, J.; Min, D.H.; Jin, L.G.; Chen, J.; Chen, M.; Zhou, Y.B.; Ma, Y.Z.; Xu, Z.S.; et al. The WRKY Transcription Factor GmWRKY12 Confers Drought and Salt Tolerance in Soybean. Int. J. Mol. Sci. 2018, 19, 4087. [Google Scholar] [CrossRef] [PubMed]
- Zhu, H.; Zhou, Y.; Zhai, H.; He, S.; Zhao, N.; Liu, Q. A Novel Sweetpotato WRKY Transcription Factor, IbWRKY2, Positively Regulates Drought and Salt Tolerance in Transgenic Arabidopsis. Biomolecules 2020, 10, 506. [Google Scholar] [CrossRef]
- Kang, G.; Yan, D.; Chen, X.; Li, Y.; Yang, L.; Zeng, R. Molecular characterization and functional analysis of a novel WRKY transcription factor HbWRKY83 possibly involved in rubber production of Hevea brasiliensis. Plant Physiol. Biochem. 2020, 155, 483–493. [Google Scholar] [CrossRef]
- Yu, L.; Liu, W.; Guo, Z.; Li, Z.; Jiang, H.; Zou, Q.; Mao, Z.; Fang, H.; Zhang, Z.; Wang, N.; et al. Interaction between MdMYB63 and MdERF106 enhances salt tolerance in apple by mediating Na+/H+ transport. Plant Physiol. Biochem. 2020, 155, 464–471. [Google Scholar] [CrossRef]
- Wang, D.; Sun, Z.; Hu, X.; Xiong, J.; Hu, L.; Xu, Y.; Tang, Y.; Wu, Y. The key regulator LcERF056 enhances salt tolerance by modulating reactive oxygen species-related genes in Lotus corniculatus. BMC Plant Biol. 2021, 21, 605. [Google Scholar] [CrossRef] [PubMed]
- Wang, Z.; Zhang, Z.; Wang, P.; Qin, C.; He, L.; Kong, L.; Ren, W.; Liu, X.; Ma, W. Genome-wide identification of the NAC transcription factors family and regulation of metabolites under salt stress in Isatis indigotica. Int. J. Biol. Macromol. 2023, 240, 124436. [Google Scholar] [CrossRef] [PubMed]
- Rui, Z.; Pan, W.; Zhao, Q.; Hu, H.; Li, X.; Xing, L.; Jia, H.; She, K.; Nie, X. Genome-wide identification.; evolution and expression analysis of NAC gene family under salt stress in wild emmer wheat (Triticum dicoccoides L.). Int. J. Biol. 2023, 230, 123376. [Google Scholar] [CrossRef]
- Yu, X.; Liu, Y.; Wang, S.; Tao, Y.; Wang, Z.; Shu, Y.; Peng, H.; Mijiti, A.; Wang, Z.; Zhang, H.; et al. CarNAC4, a NAC-type chickpea transcription factor conferring enhanced drought and salt stress tolerances in Arabidopsis. Plant Cell Rep. 2016, 35, 613–627. [Google Scholar] [CrossRef]
- Waseem, M.; Rong, X.; Li, Z. Dissecting the Role of a Basic Helix-Loop-Helix Transcription Factor, SlbHLH22, Under Salt and Drought Stresses in Transgenic Solanum lycopersicum L. Front. Plant Sci. 2019, 10, 734. [Google Scholar] [CrossRef] [PubMed]
- Chen, Y.; Li, F.; Ma, Y.; Chong, K.; Xu, Y. Overexpression of OrbHLH001, a putative helix-loop-helix transcription factor causes increased expression of AKT1 and maintains ionic balance under salt stress in rice. J. Plant Physiol. 2013, 17, 93–100. [Google Scholar] [CrossRef]
- Verma, D.; Jalmi, S.K.; Bhagat, P.K.; Verma, N.; Sinha, A.K. A bHLH transcription factor, MYC2, imparts salt intolerance by regulating proline biosynthesis in Arabidopsis. FEBS J. 2020, 287, 2560–2576. [Google Scholar] [CrossRef]
- Han, H.; Wang, C.; Yang, X.; Wang, L.; Ye, J.; Xu, F.; Liao, Y.; Zhang, W. Role of bZIP transcription factors in the regulation of plant secondary metabolism. Planta 2023, 258, 13. [Google Scholar] [CrossRef]
- Liao, Y.; Zou, H.F.; Wei, W.; Hao, Y.J.; Tian, A.G.; Huang, J.; Liu, Y.F.; Zhang, J.S.; Chen, S.Y. Soybean GmbZIP44, GmbZIP62 and GmbZIP78 genes function as negative regulator of ABA signaling and confer salt and freezing tolerance in transgenic Arabidopsis. Planta 2008, 228, 225–240. [Google Scholar] [CrossRef]
- Wang, C.; Lu, G.; Hao, Y.; Guo, H.; Guo, Y.; Zhao, J.; Cheng, H. ABP9, a maize bZIP transcription factor, enhances tolerance to salt and drought in transgenic cotton. Planta 2017, 246, 453–469. [Google Scholar] [CrossRef]
- Kim, D.; Jeon, S.J.; Yanders, S.; Park, S.C.; Kim, H.S.; Kim, S. MYB3 plays an important role in lignin and anthocyanin biosynthesis under salt stress condition in Arabidopsis. Plant Cell Rep. 2022, 41, 1549–1560. [Google Scholar] [CrossRef]
- Pratyusha, D.S.; Sarada, D.V.L. MYB transcription factors-master regulators of phenylpropanoid biosynthesis and diverse developmental and stress responses. Plant Cell Rep. 2022, 41, 2245–2260. [Google Scholar] [CrossRef] [PubMed]
- Lee, Y.J.; Lee, W.J.; Le, Q.T.; Hong, S.W.; Lee, H. Growth Performance Can Be Increased Under High Nitrate and High Salt Stress Through Enhanced Nitrate Reductase Activity in Arabidopsis Anthocyanin Over-Producing Mutant Plants. Front. Plant Sci. 2021, 12, 644455. [Google Scholar] [CrossRef]
- Gao, Q.; Li, X.; Xiang, C.; Li, R.; Xie, H.; Liu, J.; Li, X.; Zhang, G.; Yang, S.; Liang, Y.; et al. EbbHLH80 Enhances Salt Responses by Up-Regulating Flavonoid Accumulation and Modulating ROS Levels. Int. J. Mol. Sci. 2023, 24, 11080. [Google Scholar] [CrossRef] [PubMed]
- Feng, S.; Yao, Y.T.; Wang, B.B.; Li, Y.M.; Li, L.; Bao, A.K. Flavonoids are involved in salt tolerance through ROS scavenging in the halophyte Atriplex canescens. Plant Cell Rep. 2023, 43, 5. [Google Scholar] [CrossRef]
- Chun, H.J.; Baek, D.; Cho, H.M.; Lee, S.H.; Jin, B.J.; Yun, D.J.; Hong, Y.S.; Kim, M.C. Lignin biosynthesis genes play critical roles in the adaptation of Arabidopsis plants to high-salt stress. Plant Signal. Behav. 2019, 14, 1625697. [Google Scholar] [CrossRef] [PubMed]
- Stracke, R.; Werber, M.; Weisshaar, B. The R2R3-MYB gene family in Arabidopsis thaliana. Curr. Opin. Plant Biol. 2001, 4, 447–456. [Google Scholar] [CrossRef] [PubMed]
- Cao, Y.; Li, K.; Li, Y.; Zhao, X.; Wang, L. MYB Transcription Factors as Regulators of Secondary Metabolism in Plants. Biology 2020, 9, 61. [Google Scholar] [CrossRef]
- Yu, Y.; Guo, D.D.; Min, D.H.; Cao, T.; Ning, L.; Jiang, Q.Y.; Sun, X.J.; Zhang, H.; Tang, W.S.; Gao, S.Q.; et al. Foxtail millet MYB-like transcription factor SiMYB16 confers salt tolerance in transgenic rice by regulating phenylpropane pathway. Plant Physiol. Biochem. 2023, 195, 310–321. [Google Scholar] [CrossRef]
- Jan, R.; Asaf, S.; Numan, M.; Lubna; Kim, K.M. Plant secondary metabolite biosynthesis and transcriptional regulation in response to biotic and abiotic stress conditions. Agronomy 2021, 11, 968. [Google Scholar] [CrossRef]
- Kato, N.; Dubouzet, E.; Kokabu, Y.; Yoshida, S.; Taniguchi, Y.; Dubouzet, J.G.; Sato, F. Identification of a WRKY protein as a transcriptional regulator of benzylisoquinoline alkaloid biosynthesis in Coptis japonica. Plant Cell Physiol. 2007, 48, 8–18. [Google Scholar] [CrossRef] [PubMed]
- Li, D.H.; Guo, J.; Bin, W.; Zhao, N.; Wang, K.B.; Li, J.Y.; Li, Z.L.; Hua, H.M. Two new benzylisoquinoline alkaloids from Thalictrum foliolosum and their antioxidant and in vitro antiproliferative properties. Arch. Pharm. Res. 2016, 39, 871–877. [Google Scholar] [CrossRef]
- Madani, H.; Hosseini, B.; Karimzadeh, G.; Rahimi, A. Enhanced thebaine and noscapine production and modulated gene expression of tyrosine/dopa decarboxylase and salutaridinol 7-O-acetyltransferase genes in induced autotetraploid seedlings of Papaver bracteatum Lindl. Acta Physiol. Plant. 2019, 41, 194. [Google Scholar] [CrossRef]
- Gómez-Sagasti, M.T.; Barrutia, O.; Ribas, G.; Garbisu, C.; Becerril, J.M. Early transcriptomic response of Arabidopsis thaliana to polymetallic contamination: Implications for the identification of potential biomarkers of metal exposure. Metallomics 2016, 8, 518–531. [Google Scholar] [CrossRef]
- Moran Lauter, A.N.; Peiffer, G.A.; Yin, T.; Whitham, S.A.; Cook, D.; Shoemaker, R.C.; Graham, M.A. Identification of candidate genes involved in early iron deficiency chlorosis signaling in soybean (Glycine max) roots and leaves. BMC Genom. 2014, 15, 702. [Google Scholar] [CrossRef] [PubMed]
- Pérez-Clemente, R.M.; Vives, V.; Zandalinas, S.I.; López-Climent, M.F.; Muñoz, V.; Gómez-Cadenas, A. Biotechnological approaches to study plant responses to stress. Biomed. Res. Int. 2013, 2013, 654120. [Google Scholar] [CrossRef]
- Hou, S.; Liu, D.; Huang, S.; Luo, D.; Liu, Z.; Xiang, Q.; Wang, P.; Mu, R.; Han, Z.; Chen, S.; et al. The Arabidopsis MIK2 receptor elicits immunity by sensing a conserved signature from phytocytokines and microbes. Nat. Commun. 2021, 12, 5494. [Google Scholar] [CrossRef] [PubMed]
- Rhodes, J. Characterisation of the Arabidopsis thaliana Leucine-Rich Repeat Receptor Kinase Subfamily XII in Immune Signalling. Ph.D. Dissertation, University of East Anglia, Norwich, UK, 2019. [Google Scholar]
- Van der Does, D.; Boutrot, F.; Engelsdorf, T.; Rhodes, J.; McKenna, J.F.; Vernhettes, S.; Koevoets, I.; Tintor, N.; Veerabagu, M.; Miedes, E.; et al. The Arabidopsis leucine-rich repeat receptor kinase MIK2/LRR-KISS connects cell wall integrity sensing.; root growth and response to abiotic and, biotic, stresses. PLoS Genet. 2017, 13, e1006832. [Google Scholar] [CrossRef]
- Scarpeci, T.E.; Zanor, M.I.; Mueller-Roeber, B.; Valle, E.M. Overexpression of AtWRKY30 enhances abiotic stress tolerance during early growth stages in Arabidopsis thaliana. Plant Mol. Biol. 2013, 83, 265–277. [Google Scholar] [CrossRef]
- Zhu, D.; Hou, L.; Xiao, P.; Guo, Y.; Deyholos, M.K.; Liu, X. VvWRKY30, a grape WRKY transcription factor, plays a positive regulatory role under salinity stress. Plant Sci. 2019, 280, 132–142. [Google Scholar] [CrossRef]
- Jiang, W.; Wu, J.; Zhang, Y.; Yin, L.; Lu, J. Isolation of a WRKY30 gene from Muscadinia rotundifolia (Michx) and validation of its function under biotic and abiotic stresses. Protoplasma 2015, 252, 1361–1374. [Google Scholar] [CrossRef] [PubMed]
- Song, X.; Duanmu, H.; Yu, Y.; Chen, C.; Sun, X.; Zhu, P.; Chan, R.; Duan, X.; Li, H.; Cao, L.; et al. GsJ11, identified by genome-wide analysis.; facilitates alkaline tolerance in transgenic plants. Plant Cell Tissue Organ. Cult. 2017, 129, 411–430. [Google Scholar] [CrossRef]
- Chen, K.M.; Holmström, M.; Raksajit, W.; Suorsa, M.; Piippo, M.; Aro, E.M. Small chloroplast-targeted DnaJ proteins are involved in optimization of photosynthetic reactions in Arabidopsis thaliana. BMC Plant Biol. 2010, 10, 43. [Google Scholar] [CrossRef] [PubMed]
- Elkelish, A.A.; Soliman, M.H.; Alhaithloul, H.A.; El-Esawi, M.A. Selenium protects wheat seedlings against salt stress-mediated oxidative damage by up-regulating antioxidants and osmolytes metabolism. Plant Physiol. Biochem. 2019, 137, 144–153. [Google Scholar] [CrossRef] [PubMed]
- Wang, Y.; Xu, C.; Wuriyanghan, H.; Lei, Z.; Tang, Y.; Zhang, H.; Zhao, X. Exogenous selenium endows salt-tolerant and salt-sensitive soybeans with salt tolerance through plant-microbial coactions. Agronomy 2023, 13, 2271. [Google Scholar] [CrossRef]
- Winter, G.; Todd, C.D.; Trovato, M.; Forlani, G.; Funck, D. Physiological implications of arginine metabolism in plants. Front. Plant Sci. 2015, 6, 534. [Google Scholar] [CrossRef]
- Wang, Y.; Liu, J.; Zhao, G.; Geng, Z.; Qi, H.; Dou, H.; Zhang, H. Dynamic transcriptome and co-expression network analysis of the cotton (Gossypium hirsutum) root response to salinity stress at the seedling stage. Acta Physiol. Plant. 2020, 42, 143. [Google Scholar] [CrossRef]
- Siwinska, J.; Siatkowska, K.; Olry, A.; Grosjean, J.; Hehn, A.; Bourgaud, F.; Meharg, A.A.; Carey, M.; Lojkowska, E.; Ihnatowicz, A. Scopoletin 8-hydroxylase: A novel enzyme involved in coumarin biosynthesis and iron-deficiency responses in Arabidopsis. J. Exp. Bot. 2018, 69, 1735–1748. [Google Scholar] [CrossRef]
- Duan, C.; Mao, T.; Sun, S.; Guo, X.; Guo, L.; Huang, L.; Wang, Z.; Zhang, Y.; Li, M.; Sheng, Y.; et al. Constitutive expression of GmF6′H1 from soybean improves salt tolerance in transgenic Arabidopsis. Plant Physiol. Biochem. 2019, 141, 446–455. [Google Scholar] [CrossRef]

Disclaimer/Publisher’s Note: The statements, opinions and data contained in all publications are solely those of the individual author(s) and contributor(s) and not of MDPI and/or the editor(s). MDPI and/or the editor(s) disclaim responsibility for any injury to people or property resulting from any ideas, methods, instructions or products referred to in the content. |
© 2024 by the authors. Licensee MDPI, Basel, Switzerland. This article is an open access article distributed under the terms and conditions of the Creative Commons Attribution (CC BY) license (https://creativecommons.org/licenses/by/4.0/).