Article

Genetic Editing of Tomato Golgi-Localized Nucleotide Sugar Transporter 1.1 Promotes Immunity Against Phytophthora infestans

1
College of Informatics, Huazhong Agricultural University, Wuhan 430070, China
2
Shenzhen Branch, Guangdong Laboratory of Lingnan Modern Agriculture, Key Laboratory of Synthetic Biology, Ministry of Agriculture and Rural Affairs, Agricultural Genomics Institute at Shenzhen, Chinese Academy of Agricultural Sciences, Shenzhen 518120, China
3
School of Life Sciences, Henan University, Kaifeng 475004, China
4
Shenzhen Research Institute of Henan University, Shenzhen 518000, China
5
Guangdong Key Laboratory for New Technology Research of Vegetables, Vegetable Research Institute, Guangdong Academy of Agricultural Sciences, Guangzhou 510640, China
*
Author to whom correspondence should be addressed.
These authors contributed equally to the work.
Genes 2025, 16(4), 470; https://doi.org/10.3390/genes16040470
Submission received: 6 March 2025 / Revised: 6 April 2025 / Accepted: 19 April 2025 / Published: 21 April 2025
(This article belongs to the Section Plant Genetics and Genomics)

Abstract

:
Background: Functional alleles of host plant susceptibility genes (S genes) can exacerbate the severity of diseases by enhancing pathogen compatibility. Genetic editing of the targeted host S genes has demonstrated remarkable efficacy in conferring broad-spectrum resistance across multiple crop species. We have previously identified a Golgi-localized Nucleotide Sugar Transporter 1 homolog (SlGONST1.1) in the host plant Solanum lycopersicum as a susceptibility gene towards late blight caused by Phytophthora infestans. Methods: In this study, we performed a detailed characterization of tissue-specific and P. infestans-inducible expression patterns of this gene, and the subcellular localization of its encoded protein product. Results: Similar to phenotypes of two reported Slgonst1.1 edited lines, two newly generated genetically edited lines of SlGONST1.1 demonstrated enhanced resistance against P. infestans without obvious growth and developmental abnormality. Phytohormonal quantifications and reactive oxygen species measurements showed that an Slgonst1.1 line had lower constitutive abscisic acid contents and depleted reactive oxygen species burst induced by pathogen-associated molecular pattern. Further comparative transcriptomic analyses revealed that the expression of defense-related genes is disproportionally up-regulated in the Slgonst1.1 line. Conclusions: In summary, our findings confirmed SlGONST1.1 as a functional host susceptibility gene towards late blight and shed light on the potential molecular mechanism underlying its function.

1. Introduction

Late blight (LB) caused by Phytophthora infestans de Bary is one of the most destructive diseases of tomato (Solanum lycopersicum) and potato (Solanum tuberosum) worldwide, causing up to 10 billion USD worth of yield loss and management cost annually [1]. The development of a genetically resistant crop cultivar has been recognized as an essential means for the sustainable management of LB [2].
Genetic resistance against LB has been primarily attributed to dominant Resistance (R) genes, which encode cytoplasmic immune receptors for pathogen-secreted effectors [2]. However, the rapid evolution of the pathogen populations in the field can quickly overcome the effective but strain-specific resistances conferred by these genes [3]. To the opposite of R genes, some host genes have been demonstrated to render the host plants more susceptible to diseases and, hence, are known as susceptibility genes [4]. These host susceptibility genes encode diverse protein products and are involved in different perspectives of host–pathogen interactions. For example, loss-of-function mutations in tomato DMR6-1, which encodes a salicylic acid (SA) deactivation enzyme, confers resistance against P. capsici and diverse phytopathogens [5]. Genetic editing of DMR6-1 ortholog in potato also results in enhanced resistance against LB [6]. Other demonstrated susceptibility genes in potato that promote LB include StSR4, StDND1, and StDMR1 [7,8,9]. Protein products of these genes are involved in calcium signaling (SR4), ionic transport (DND1), and phosphorrelay signaling (DMR1). Compared to R genes, however, functionally characterized susceptibility genes remain rare.
GOLGI LOCALIZED NUCLEOTIDE SUGAR TRANSPORTERs (GONSTs) are nucleotide sugar transporters that are critical for the glycosylation of membrane sphingolipids [10]. In Arabidopsis, AtGONST1 has been demonstrated to be a broad-spectrum susceptibility gene, as genetic knock-out of AtGONST1 can lead to constitutively heightened immunity but dwarfed growth [11,12]. The A. thaliana Columbia-0 genome contains five characterized GONST paralogs [13]. Among them, AtGONST1 and AtGONST2 show >50% similarity in their peptide sequences and have been shown to be functionally homologous [11,14,15]. Double knock-out of AtGONST1 and AtGONST2 could further elevate the constitutive levels of salicylic acid (SA) and reactive oxygen species (ROS) compared to Atgonst1 single mutant plants [15]. Three additional AtGONST paralogs were predicted based on sequence homology, two of which have been functionally characterized as substrate-specific GDP-sugar transporters [13,14,16].
In a recently published post-inoculation time-course transcriptomics study, we identified a P. infestans-inducible SlGONST1.1 homolog (Solyc11T001957.3, named SlGONST1.1) as a functional susceptibility gene that exacerbated LB [17]. In this study, we further characterized the molecular features of this gene and its protein product. Phenotypic characterization of two additional CRISPR–Cas9 edited lines targeting this gene (ATAGTAGCCAAGGCGGGGATAGG and CCAGCTATGACTTTAATGCGGGG) confirmed that knock-out of SlGONST1.1 could enhance LB resistance without causing obvious growth and developmental defect. Further examination of the Slgonst1.1 line revealed that this genetic perturbation led to reduced constitutive abscisic acid contents and elevated expression of defense-related genes, shedding light on the potential molecular mechanism underlying the immunity-suppressing function of SlGONST1.1.

2. Materials and Methods

2.1. Plant Materials and Growth Conditions

Solanum. lycopersicum cv. Micro-Tom (Lab strain) and CRISPR–Cas9 edited lines were used in this study. The growth conditions of plants and tomato transformation experiments are shown in references [17,18].

2.2. Plasmid Constructs

For the gene clone, the complete coding sequence of SlGONST1.1 was inserted into pCE2 TA/Blunt-Zero Vector (Vazyme, C601-01) (Supplementary Figure S1) to screen the positive clone and sequencing. The right single clone was used as a template to construct the pSUPER::SlGONST1.1-EGFP vector within SpeI and KpnI sites (Supplementary Figure S2). The PCR program was as follows: 95 °C for 3 min, followed by 38 cycles of 95 °C for 20 s, 55 °C for 20 s, and 72 °C for 70 s. For CRISPR, two sgRNAs sites (ATAGTAGCCAAGGCGGGGATAGG and CCAGCTATGACTTTAATGCGGGG) were chosen for editing and cloned into the pHSE401 plasmid containing the Cas9 coding sequence within the BsaI site (Supplementary Figure S3). The specific steps are shown in Reference [17]. Genomic DNA was extracted from tentative mutant lines, and wildtype was used as a template to amplify the DNA fragment. The PCR products were sequenced and compared by SnapGene v 4.3. Primers are listed in Supplementary Table S1.

2.3. Phylogenetic Analysis

Phylogenetic analysis was based on S. lycopersicum and A. thaliana GONST homologs. The phylogenetic tree was constructed using MEGA v10.4.2 software based on the Maximum Likelihood model. The numbers in branches indicate the bootstrap values from 1000 replicates.

2.4. Subcellular Localization

Agrobacterium tumefaciens strain GV3101 harboring the binary vector for over-expression vector pSUPER::SlGONST1.1-EGFP, empty vector pSUPER::EGFP, Golgi marker vector p35S::AtSYP61-mRFP, and plasma membrane marker p35S::PIP2-mRFP [19,20] were grown in LB medium with antibiotics at 28 °C overnight. Bacteria were re-suspended in an infiltration buffer containing 10 mM MES, 10 mM MgCl2, and 150 μM acetosyringone in OD600 of 0.5-1. The bacteria harboring pSUPER::SlGONST1.1-EGFP was mixed with p35S::AtSYP61-mRFP and p35S::PIP2-mRFP. The bacteria harboring the empty vector did the same. The mixed bacteria were kept in the dark for two to three hours. Tobacco with four to five true leaves was used for injecting. After 48–60 h, leaves were detached for fluorescence observation by using a Leica SP8 confocal microscope equipped with 514 nm and 488 nm laser.

2.5. Quantitative RT-PCR

A plant RNA extraction kit (Huayueyang, Beijing, China) was used to extract total RNA from fresh leaf tissues following the manufacturer’s recommendations. cDNA was synthesized by using a HiScript II 1st Strand cDNA synthesis kit (+gDNA wiper) (Vazyme). qPCR product was obtained by ChamQ SYBR qPCR Master Mix (High ROX Premixed) kit (Vazyme Biotech Co., Ltd., Nanjing, China). Three biological and three technical replicates and the 2-ΔΔCt method were used to evaluate all qPCR data (Bio-Rad Laboratories, Inc., Shanghai, China). The expression levels normalized to that of the housekeeping gene. All of the qPCR primers are listed in Supplementary Table S1.

2.6. P. infestans Infection Assays

Rye agar media plates were used to culture P. infestans strain T30-4 and 1306 (provided by Prof. Suomeng Dong from Nanjing Agricultural University). After 14–20 days, sporangia were collected in sterilized water, and their density was adjusted to 10,000 per mL for infecting; 10 μL of sporangia suspension was dropped on the underside of the leaves. The leaves were placed in a clean box, and a relative humidity of 90–100% was maintained. For 5–7 days, leaf infections were recorded, as well as the lesion diameter and lesion area [21].

2.7. Phytohormone Quantification

To analyze ABA, SA, IAA, JA, and JA-Ile in plant tissue, ten replicates of leaf samples were collected to test the phytohormones. Leaves for all time points were detached simultaneously and settled in moisturized Petri dishes for 6 h to minimize the impact of petiole cutting before the first inoculation. To avoid the impact of diurnal rhythms, samples were inoculated at different time points and collected simultaneously. Each biological replicate contained approximately 150 mg of leaves and was flash-frozen in liquid nitrogen. Before extraction, leaf samples were grinded to a fine powder before defrosting. Then, 1 mL of ethyl acetate, spiked with 20 ng of D6-ABA, D4-SA, D6-JA, and D5-JA-Ile as internal standards, was added. Supernatants were transferred to sterilized 2 mL microcentrifuge tubes after centrifugation at 10,000× g for 10 min at 4 °C; 500 μL ethyl acetate was added in each pellet and centrifuged instantaneously. Dryness in a vacuum concentrator (Eppendorf AG, Hamburg, Germany) was used to evaporate the supernatants; 500 μL of 70% methanol (v/v) was added to the residue and transiently centrifuged to clarify phases. Glass vials were used to collect the supernatants and then analyzed by HPLC-MS/MS (LCMS-8040, Shimadzu corporation, Tokyo, Japan).
An LC-20AD liquid chromatography system (Shimadzu corporation, Tokyo, Japan) was used to measure the characteristics of the metabolites, and 10 μL of each sample was injected into an ODS column (1.6 μm, 75 × 2 mm) (Shim-pack XR-ODS III, Shimadzu corporation, Tokyo, Japan) at a flow rate of 300 μL/min. Solvent A contained 0.05% formic acid and 5 mM ammonium formate, and solvent B only included methanol; they were used in a linear gradient at a mobile phase. The negative electrospray ionization mode was used to detect the parent ion with a specific mass-to-charge ratio and selected and fragmented to obtain its daughter ions. The corresponding compound’s chromatogram was generated from a specific daughter ion. The detailed steps of sample extraction and phytohormone measurements were carried out according to the description of reference [22].

2.8. ROS Measurements

A hole puncher was used to cut 0.125 cm2 leaf disks and incubated for 12 h in 96-well plates containing 200 μL water and kept in the dark in order to recover from wounding stress. The 200 μL solution containing luminol (20 μM), horseradish peroxidase (10 μg/mL) in sterile water, together with flg22 peptide (1 μM), was used to replace water as control. The luminescence was monitored continuously in 1 min intervals for 40 min with a Cytation5 (BioTek, Winooski, VT, USA) [23].

2.9. RNA-Seq Analysis

Clean reads were mapped to the S. lycopersicum ITAG4.1 genome by using the STAR software v2.4.0j [24]. Htseq v0.11.1 was applied to count the number of reads mapped to each gene. StringTie v1.3.3b software was used to calculate the FPKM (Fragments per kilobase per million) of each gene [25,26]. Differential expression genes (DEGs) between knock-out lines and wildtype were identified with the R package DESeq2 v1.22.2 (log2FoldChange > 1; FDR < 0.05; [27]). Gene ontology enrichment (GO) was obtained with the R packages GSEABase and GOstats.

2.10. Data Analysis

The data statistics in Figure 1, Figure 2, Figure 3, Figure 4 and Figure 5 were analyzed by One-Way ANOVA with Tukey‘s HSD (p < 0.05), and the data statistics in Figure 1, Figure 2, Figure 3, Figure 4 and Figure 5 were determined by Student’s t-test at ** p < 0.01 or * p < 0.05.

3. Results

3.1. Expansion and Molecular Divergence of SlGONSTs

Our previous time-course transcriptomics analyses of S. lycopersicum, S. tuberosum, and N. benthamiana revealed more than three thousand orthogroups that contained P. infestans-inducible homologs in the Solanum species only, one of which encoded homologs of AtGONSTs [17]. A more detailed phylogenetic analysis shows that both P. infestans-induced S. lycopersicum paralogs are orthologous to AtGONST1, whereas the third paralog is grouped with AtGONST2 (Figure 1a). Genetic editing of one of the AtGONST1 orthologs (Solyc11T001957.3, named SlGONST1.1) has been shown to promote tomato resistance against LB [17]. The length of the coding sequence of SlGONST1.1 is 1302 bp, and the number of its corresponding amino acids is 434 (Supplementary Tables S2 and S3). When transiently expressed in N. benthamiana leaves through co-infiltration, the protein product of this gene showed co-localization signals with both the Golgi apparatus marker and the plasma membrane marker proteins (Figure 1b). Constitutively, SlGONST1.1 showed relatively uniform expression across six different tissue types, except for a lower expression level in immature fruits (Figure 1c). In an extended time-course q-RT-PCR experiment, SlGONST1.1 showed transient induction by P. infestans zoospore inoculation at 8 h post-inoculation (hpi) and a second, stronger peak of induction at 72 hpi (Figure 1d).

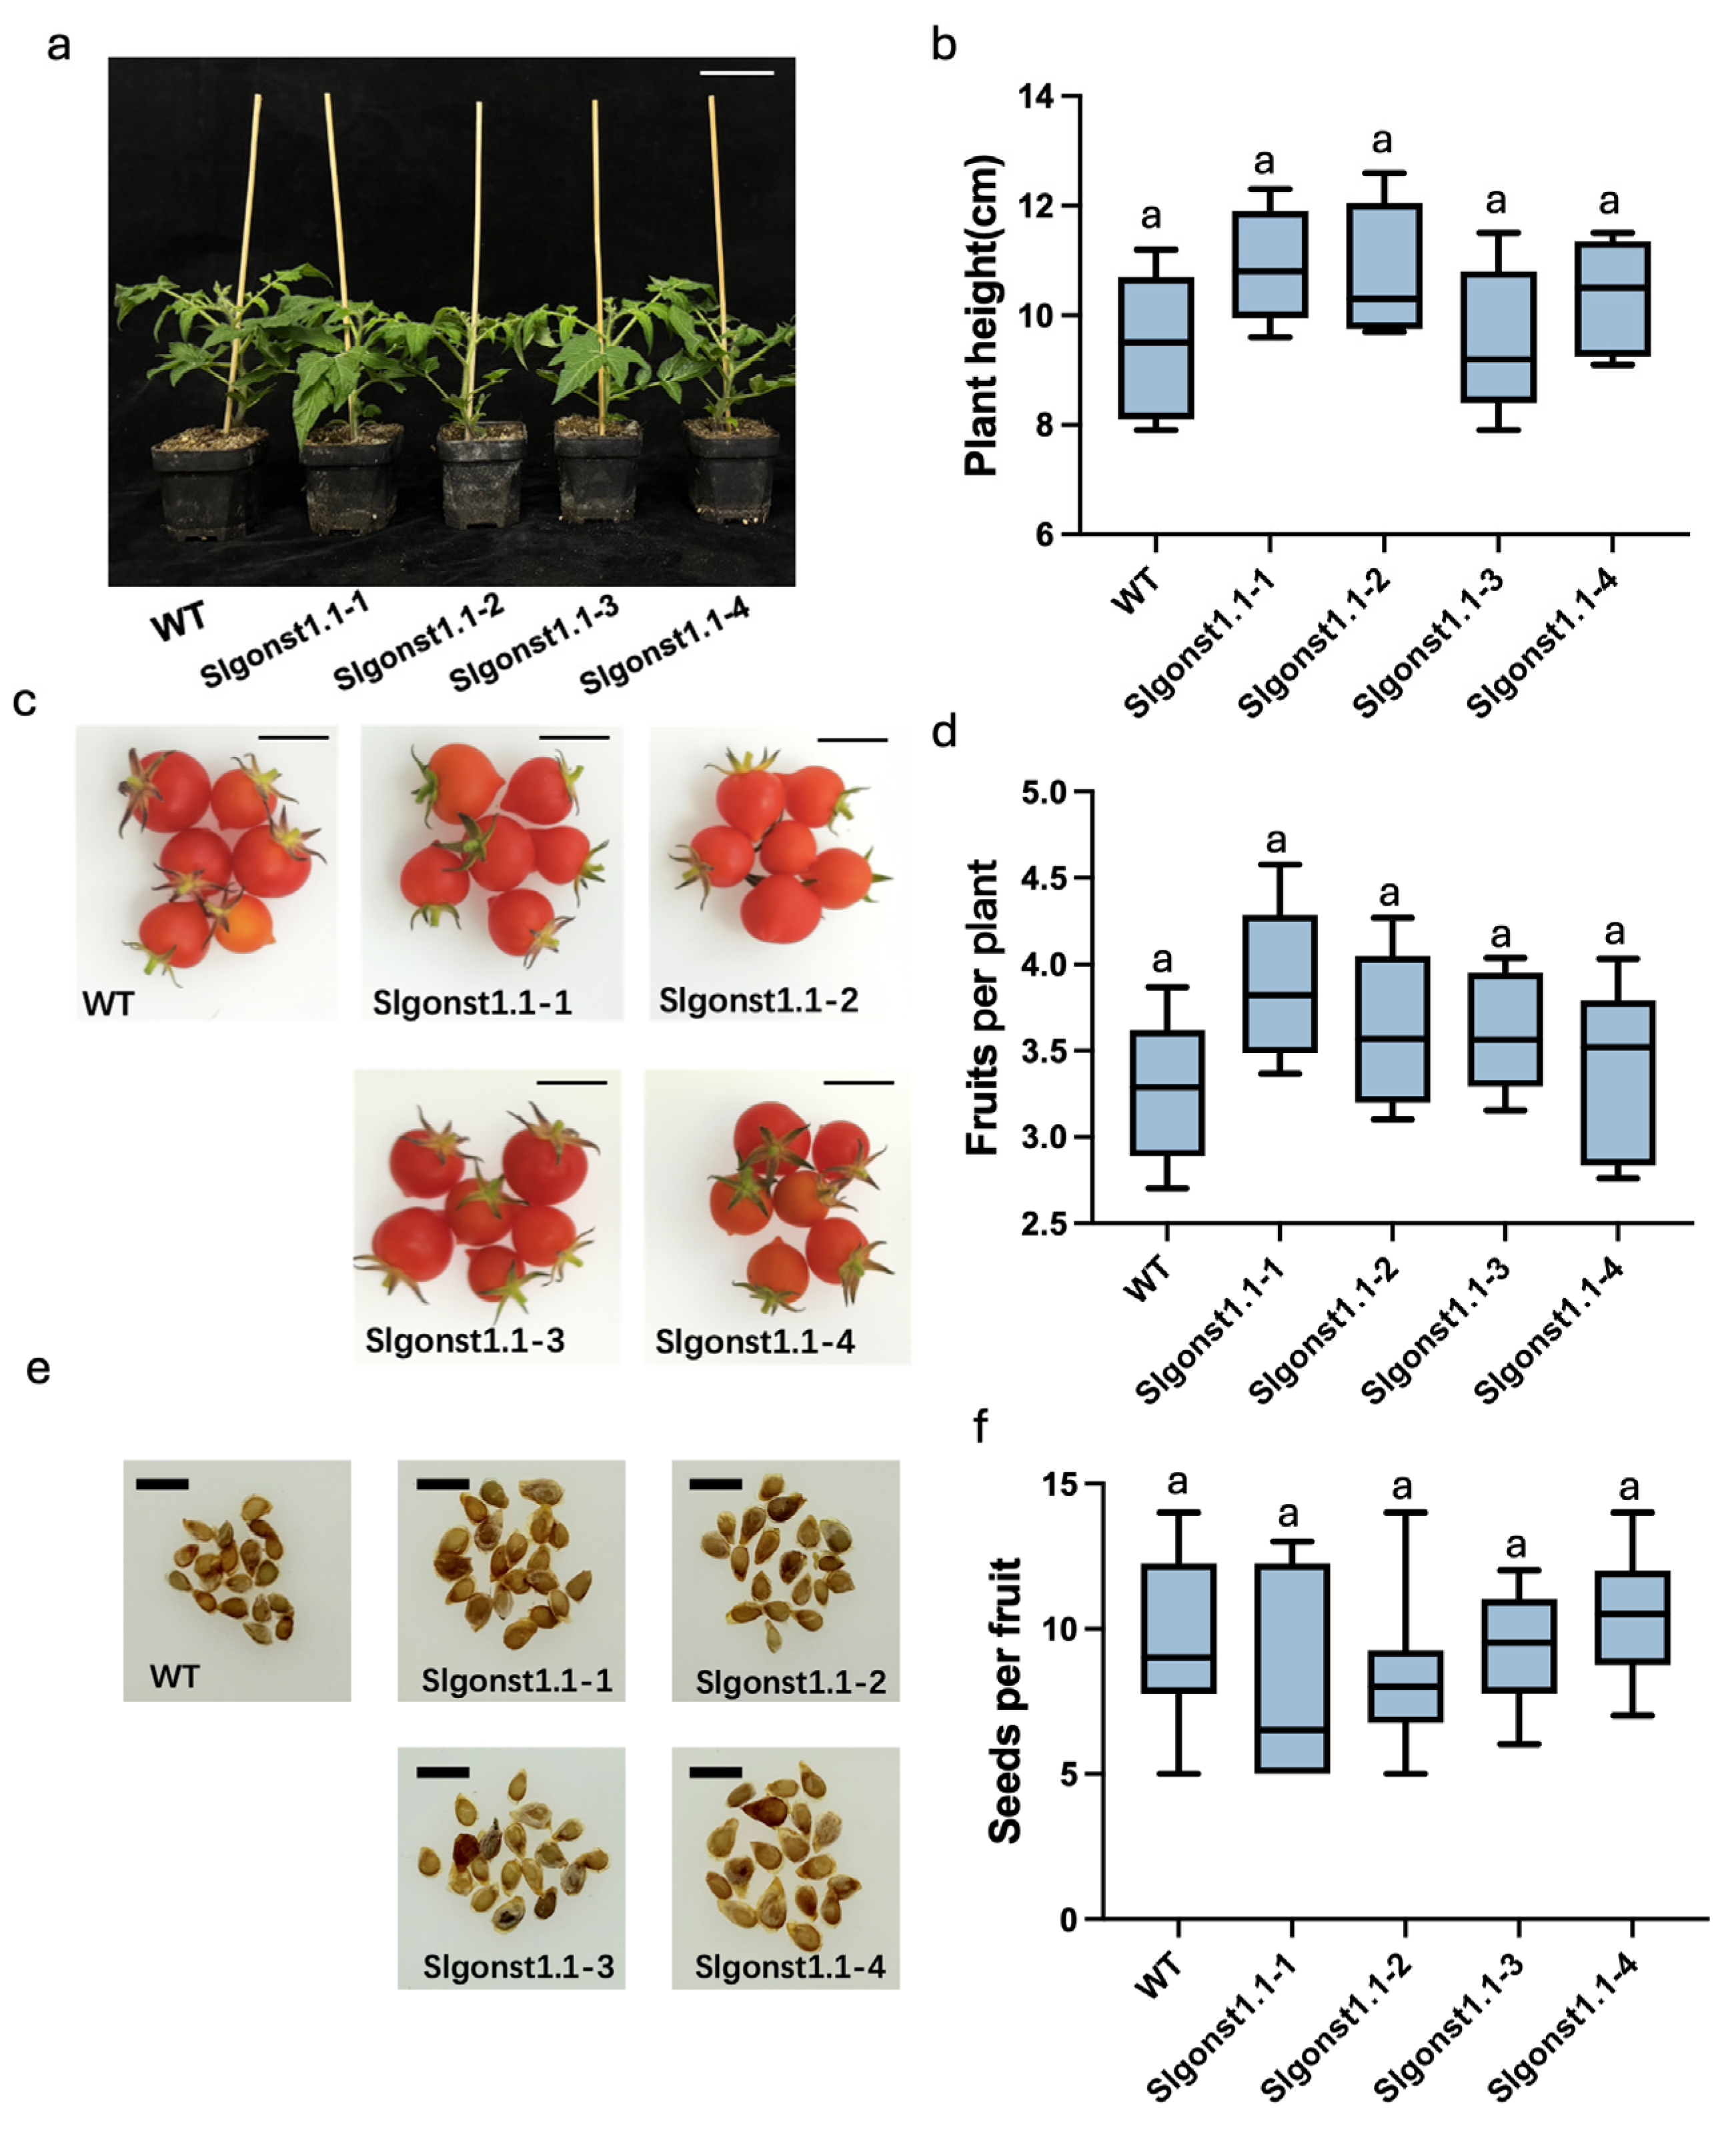
3.2. SlGONST1.1 Lowers S. lycopersicum Resistance Against Late Blight Without Affecting Plant Growth and Development

Two additional genetic edit lines targeting SlGONST1.1 (named Slgonst1.1-3 and Slgonst1.1-4) were generated with the CRISPR–Cas9 technology in the Micro-Tom genetic background, and both edited alleles entailed different frameshift deletions (Figure 2a). Compared with wildtype, Slgonst1.1-3 has 1bp insertion and 2 bp deletion in the first gRNA and 4bp deletion in the second gRNA. Slgonst1.1-4 has 1bp deletion in the first gRNA and 4bp deletion in the second gRNA. Consistent with our previous observations, all four independent SlGONST1.1 edited lines showed smaller lesion sizes and lower P. infestans biomasses compared to wildtype Micro-Tom plants, and there was no significant difference among these edited lines (Figure 2b–d). These results demonstrate that SlGONST1.1 indeed functions as a host susceptibility gene that facilitates P. infestans infection of S. lycopersicum leaflet tissues.
Further phenotypic characterization of these Slgonst1.1 mutant lines showed that knock-out of SlGONST1.1 did not affect the plant height at maturity in the Micro-Tom genetic background (Figure 3a,b) Similarly, the fruit set per plant and the seed production statistics did not show significant difference between the mutant lines and their wildtype progenitor (Figure 3c–f). These results indicate that SlGONST1.1 is not required for the normal growth and development of tomato plants, at least in this particular genetic background.

3.3. SlGONST1.1 Maintains Constitutive Abscisic Acid Levels and Suppresses PAMP-Induced ROS Burst

Since the Slgonst1.1 mutants stably exhibit enhanced LB resistance, we set out to examine the physiological mechanisms underlying this phenotype. In Arabidopsis, both AtGONST1 and AtGONST2 additively suppress constitutive contents of SA and ROS [11,15]. However, we found no significant difference in SA contents between the two independent mutant lines and the wildtype control (Figure 4a). Instead, constitutive contents of abscisic acid (ABA) were consistently lowered in both Slgonst1.1-1 and Slgonst1.1-3 compared to wildtype (Figure 4b). In the same LC-MS analyses, contents of jasmonic acid, jasmonyl-isoleucine, and indole-3-acetic acid were also quantified in the same plant extracts, and no difference among these three genotypes was observed for any of these phytohormones (Figure 4c–e). We also assessed the ROS dynamics of the leaf discs of the two mutants and the wildtype control in response to flagellin-22 (flg22), a classic pathogen-associated molecular pattern (PAMPs). In both Slgonst1.1-1 and Slgonst1.1-3, flg22 elicited stronger ROS bursts compared to wildtype, demonstrating that SlGONST1.1 is a suppressor of PAMP-induced ROS burst (Figure 4f,g). In summary, these results suggested that SlGONST1.1 may influence tomato resistance against LB by affecting constitutive ABA and PAMP-induced ROS metabolisms.

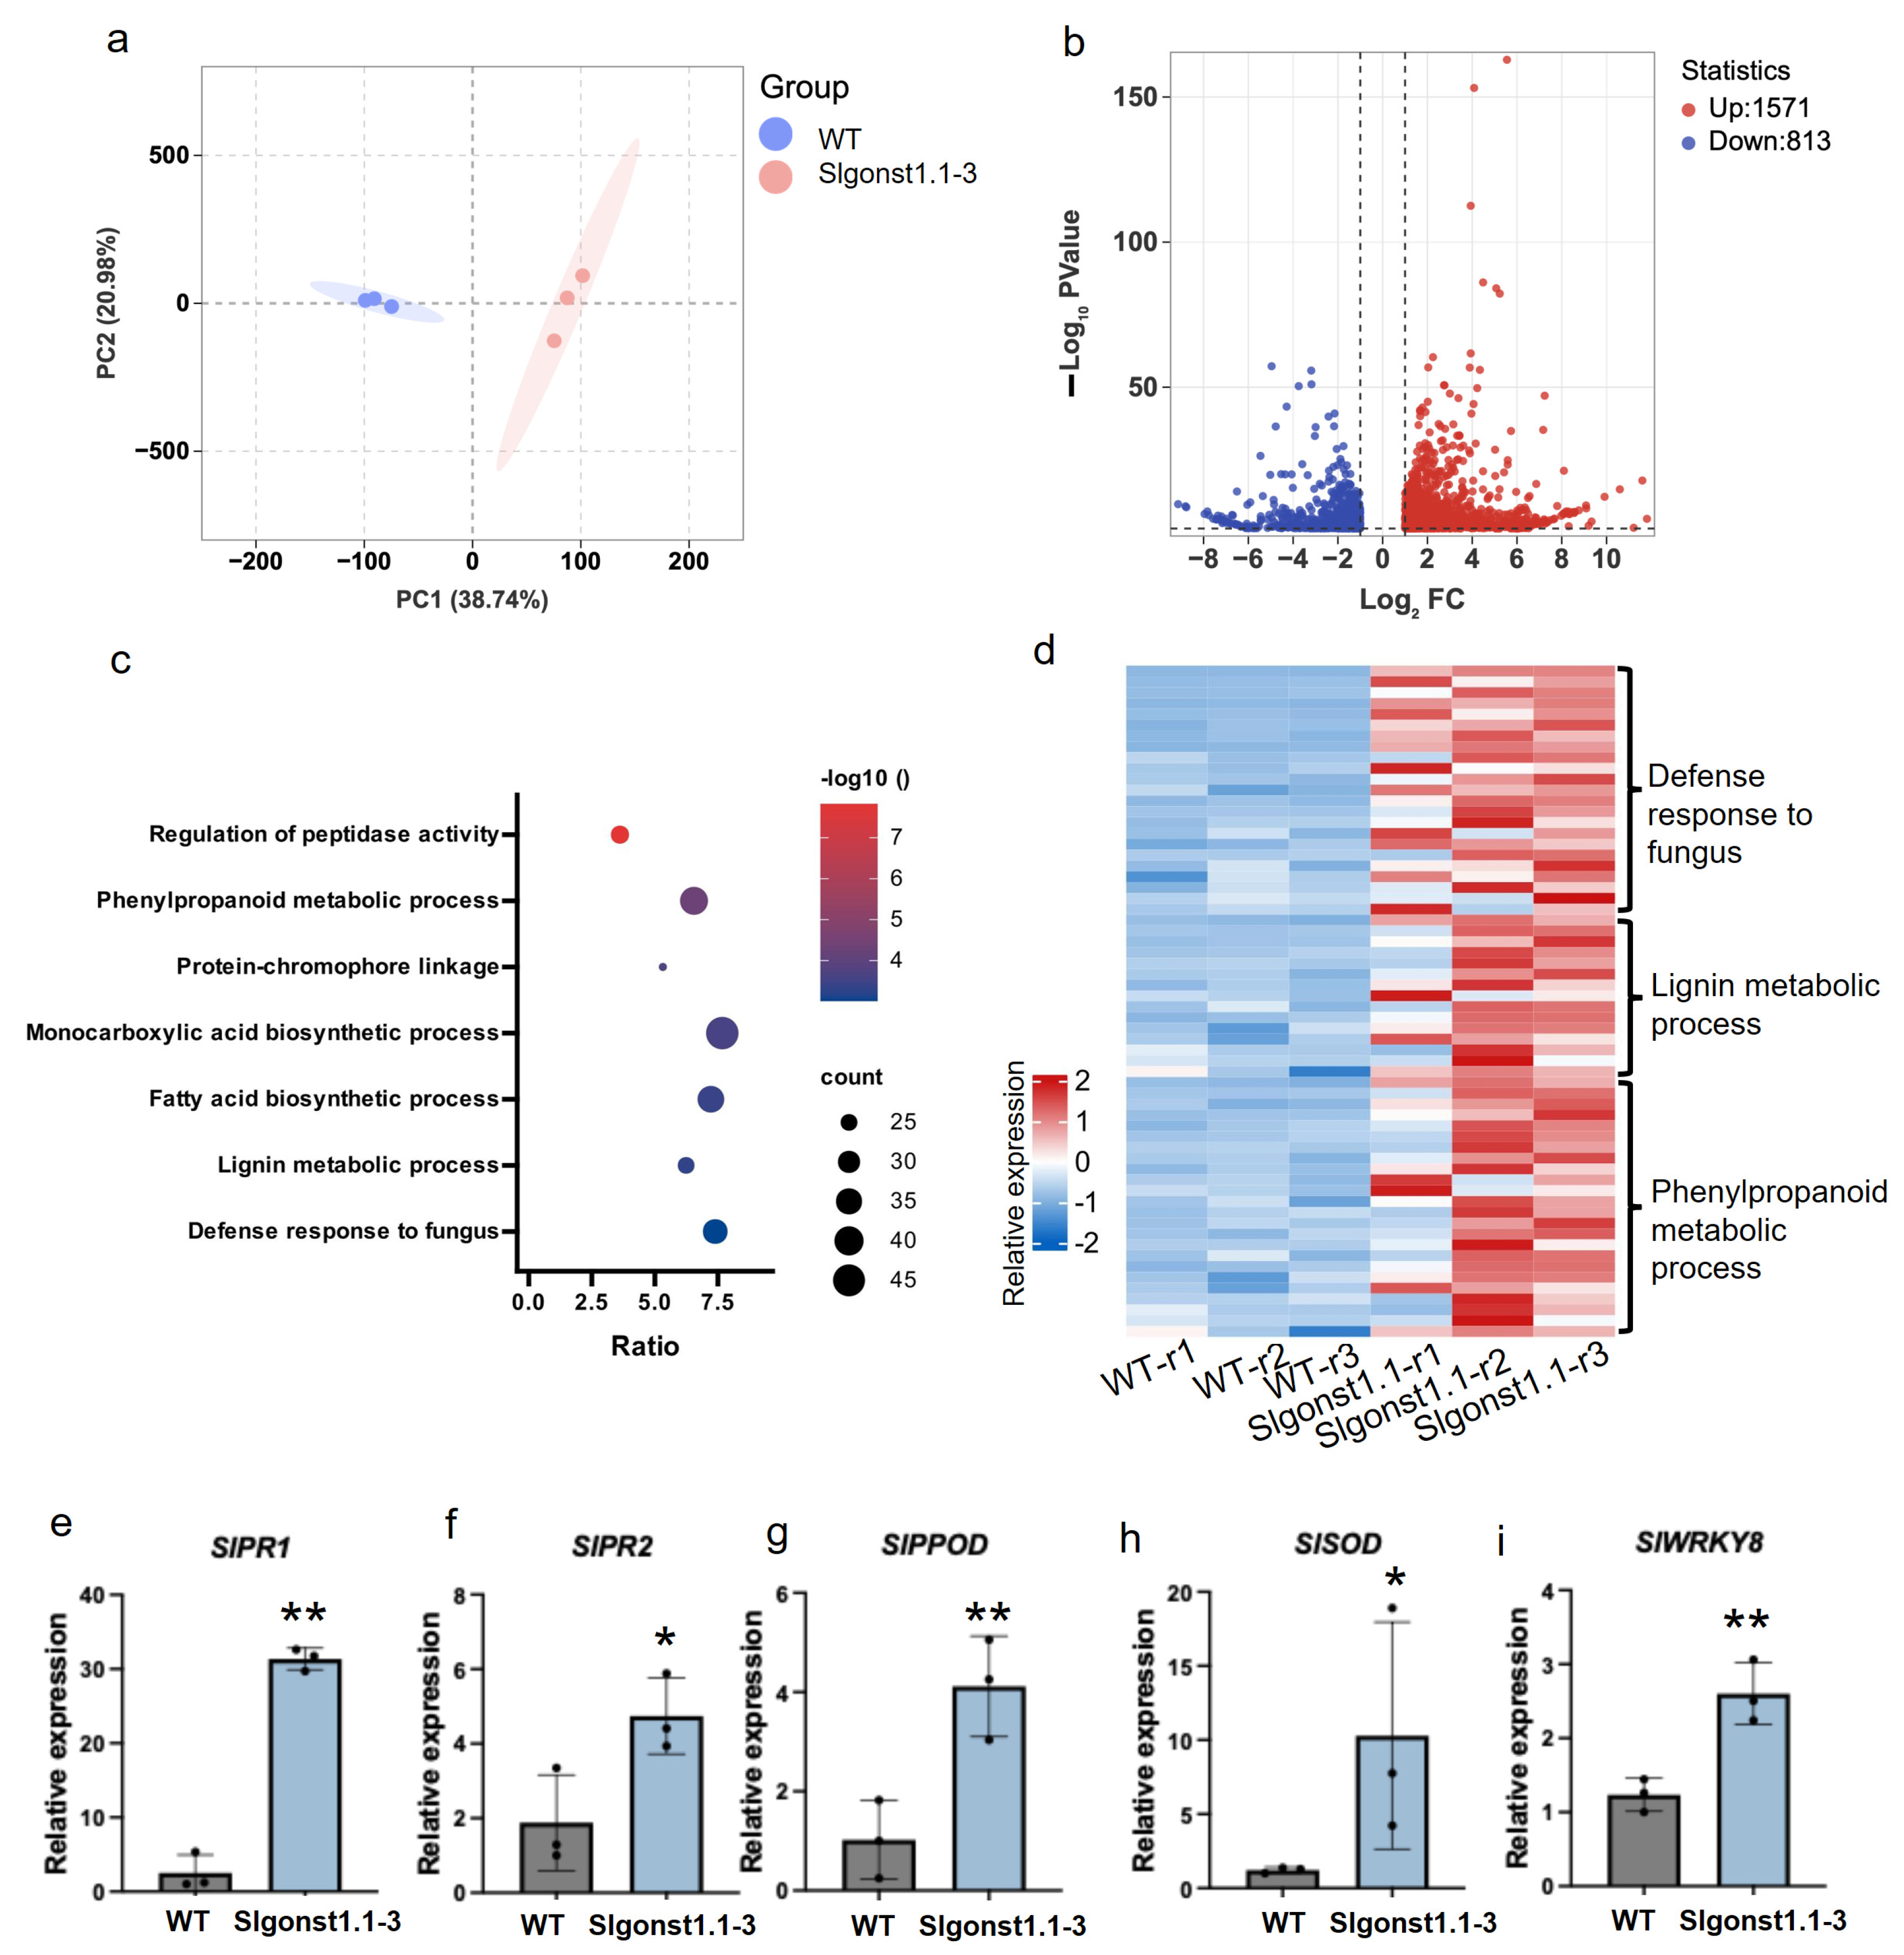
3.4. SlGONST1.1 Suppresses the Expression of Defense-Related Genes

To further investigate the influence of SlGONST1.1 suggested by the physiological characterization of the Slgonst1.1 mutants, we collected constitutive leaf transcriptomic data from the Slgonst1.1-3 and the wildtype Micro-Tom plants (Supplementary Dataset S1). The principal component analysis (PCA) result of the RNA-Seq datasets showed clear distinctions between these two genotypes, revealing that the genetic perturbation of SlGONST1.1 has an important impact on the overall gene expression profile in leaves (Figure 4a). More specifically, 1571 genes were found constitutively up-regulated in the Slgonst1.1-3 mutant, whereas 813 genes were expressed at a higher constitutive level in wildtype (Figure 4b). Functional enrichment analyses of the up-regulated genes in the Slgonst1.1-3 mutant revealed that a number of Gene Ontology (GO) terms typically associated with plant immunity, including defense response to fungus (GO: 0050832), regulation of peptidase activity (GO: 0052547), and phenylpropanoid metabolism (GO: 0009698), were over-represented among these genes (Figure 4c,d; Supplementary Table S1). These differential expression patterns were further confirmed with independent q-RT-PCR measurements of selected marker genes (Figure 4e). This comparative transcriptomic analysis revealed that SlGONST1.1 could have an overarching suppressive effect on the transcription of diverse defense-related genes, which may explain its function as a host susceptibility gene.

4. Discussion

Host susceptibility genes can promote plant diseases through diverse molecular mechanisms such as facilitation of pathogen invasion, suppression of plant immunity, and nutritional support for pathogen growth [4]. In Arabidopsis, Atgonst1 and Atgonst2 have been shown to have enhanced constitutive contents of SA and ROS, which provide a mechanistic explanation for the auto-immune phenotypes observed in these mutants [11,15]. S. lycopersicum has two orthologs of AtGONST1 (Figure 1a). We have shown that one of these orthologs, SlGONST1.1, exhibits P. infestans-induced transcription and can promote LB severity (Figure 1c and Figure 2) [17]. Unlike the reported Atgonst1 mutants, the Slgonst1.1 mutants did not show a significant difference in constitutive SA contents or ROS contents from the wildtype control (Figure 4). Instead, we observed lowered constitutive ABA levels and enhanced flg22-induced ROS bursts in the Slgonst1.1 mutants (Figure 4). Neither of these phenotypes has been reported for any of the published Atgonst mutants. Collectively, this physiological evidence indicates divergent regulation of plant immunity between SlGONST1 homologs and AtGONST1. Flagellin 22-induced ROS burst is a classic immune response marker, which has been previously adopted to illustrate the immunity-suppressing function of other genes involved in LB resistance [28,29]. It has also been reported that ABA accumulation can suppress plant immunity against LB [30,31]. Unfortunately, we do not find the other reported susceptibility genes, and ABA accumulation genes might interact with SlGONST1.1 through yeast to hybrid screening. These functional consistencies suggest that the susceptibility-promoting function of SlGONST1.1 may be mediated by positively regulating ABA accumulation while suppressing PAMP-induced ROS bursts.
Our comparative transcriptomic analysis of the wildtype and Slgonst1.1-3 leaflet tissues revealed a pervasive suppressive effect on the expression of plant defense-related genes (Figure 5). Since SlGONST1.1 is a Golgi- and membrane-localized transporter protein, it is unlikely that this protein can directly regulate gene transcription (Figure 1b). Rather, we postulate that the transcriptional regulatory effect of SlGONST1.1 may be mediated by a downstream signaling cascade, which needs to be further elucidated. Noticeably, ABA-responsive genes have not been found to be overrepresented among the DEGs. This inconsistency between physiological characterizations and transcriptomic changes in the Slgonst1.1 suggests that the influence of SlGONST1.1 is potentially more complex than ABA-elicited responses alone. On the other hand, the lack of enrichment in ROS-related genes among the DEGs is expected since the ROS contents were only different between wildtype and the Slgonst1.1-3 mutant upon flg22 elicitation, but not under the constitutive state.
At the molecular level, AtGONSTs are responsible for the transport of GDP-sugars, providing important substrates for the biosynthesis of glycosyl inositol phosphorylceramide (GIPC) sphingolipids [11,12]. In eudicots, membrane GIPCs could bind with necrosis and ethylene-inducing peptide 1-like (NLP) superfamily proteins, which are commonly produced as host-selective cytotoxins by phytopathogenic bacteria, fungi, and oomycetes [32]. The same study has further demonstrated that the characteristics of the sugar moieties on the GIPCs played critical roles in the host-selective molecular interactions between GIPCs and NLPs [32]. Hence, the conserved disease suppression phenotypes observed for Atgonsts and Slgonst1.1 mutants may be attributable to perturbations to membrane GIPC profiles. However, further in vitro experiments are required to elucidate whether the GDP-sugar-transporting function is conserved for SlGONST1.1 or not, and quantitative GIPC profiling of the Slgonst1.1 mutants is necessary to determine the influence of these loss-of-function alleles in planta. Furthermore, how this GIPC modification activity of the GONSTs contributes to the defense-related physiological and transcriptional alterations observed in the gonst mutants also requires more detailed molecular investigation.
Besides the resistance phenotypes, we observed no significant difference in plant height at the flowering stage, the number of fruits produced per plant, and the seed set per fruit among the mutant lines and their wildtype progenitor (Figure 3). However, we recognize that the Micro-Tom background used in this study is naturally dwarfed and may mask some potential growth and developmental defects associated with these genetic manipulations.
In summary, our results confirm that SlGONST1.1 is a host susceptibility gene towards LB and reveal that this function can be mediated by complex mechanisms that may involve ABA and ROS metabolism. These findings support that genetic editing of SlGONST1.1 could be a viable approach to promote LB resistance in cultivated tomatoes and that the physiological influences of GONSTs have likely diverged between tomatoes and the model plant A. thaliana.

Supplementary Materials

The following supporting information can be downloaded at https://www.mdpi.com/article/10.3390/genes16040470/s1, Supplementary Figure S1. The vector map information of pCE2-TA-Blunt-Zero_vector. Supplementary Figure S2. The vector map information of pSUPER-EGFP. Supplementary Figure S3. The vector map information of pHSE401. Supplementary Table S1. Primers used in this study. Supplementary Table S2. The coding sequence (CDs) of SlGONST1.1. Supplementary Table S3. The amino acid sequence of SlGONST1.1. Supplementary Dataset S1. FPKM matrix of the RNA-seq data.

Author Contributions

Conceptualization, S.Z. and Y.C.; methodology, Y.C.; validation, S.Z. and Y.C.; formal analysis, P.H. and Y.C.; investigation, P.H. and Y.C.; resources, Z.W. and Y.W.; data curation, P.H. and Y.C.; writing—original draft preparation, P.H. and Y.C.; writing—review and editing, S.Z., P.H. and Y.C.; supervision, Y.L., T.L. and X.Z.; project administration, S.Z.; funding acquisition, S.Z. All authors have read and agreed to the published version of the manuscript.

Funding

This work has been financially supported by the Key Research Area Plan of Guangdong (2021B0707010005 to S.Z.) and the National Key Research and Development Program of China (2022YFD1700200 to S.Z.).

Institutional Review Board Statement

Not applicable.

Informed Consent Statement

Not applicable.

Data Availability Statement

The cleaned reads of the RNA-seq dataset were deposited at the Sequence Read Archive (SRA) of the China National Center for Bioinformation under accession number PRJCA034969.

Acknowledgments

The authors would like to thank Jinfeng Qi for assistance with the phytohormone measurements and Suomeng Dong from Nanjing Agricultural University for providing P. infestans strain T30-4 and 1306.

Conflicts of Interest

The authors declare no conflict of interest.

References

  1. Kamoun, S.; Furzer, O.; Jones, J.D.G.; Judelson, H.S.; Ali, G.S.; Dalio, R.J.D.; Roy, S.G.; Schena, L.; Zambounis, A.; Panabières, F.; et al. The Top 10 oomycete pathogens in molecular plant pathology. Mol. Plant Pathol. 2015, 16, 413–434. [Google Scholar] [CrossRef] [PubMed]
  2. Dong, S.-M.; Zhou, S.-Q. Potato late blight caused by Phytophthora infestans: From molecular interactions to integrated management strategies. J. Integr. Agric. 2022, 21, 3456–3466. [Google Scholar] [CrossRef]
  3. Cooke, D.E.L.; Cano, L.M.; Raffaele, S.; Bain, R.A.; Cooke, L.R.; Etherington, G.J.; Deahl, K.L.; Farrer, R.A.; Gilroy, E.M.; Goss, E.M.; et al. Genome Analyses of an Aggressive and Invasive Lineage of the Irish Potato Famine Pathogen. PLoS Pathog. 2012, 8, e1002940. [Google Scholar] [CrossRef] [PubMed]
  4. Van Schie, C.C.N.; Takken, F.L.W. Susceptibility Genes 101: How to Be a Good Host. Annu. Rev. Phytopathol. 2014, 52, 551–581. [Google Scholar] [CrossRef]
  5. Thomazella, D.P.d.T.; Seong, K.; Mackelprang, R.; Dahlbeck, D.; Geng, Y.; Gill, U.S.; Qi, T.; Pham, J.; Giuseppe, P.; Lee, C.Y.; et al. Loss of function of a DMR6 ortholog in tomato confers broad-spectrum disease resistance. Proc. Natl. Acad. Sci. USA 2021, 118, e2026152118. [Google Scholar] [CrossRef]
  6. Kieu, N.P.; Lenman, M.; Wang, E.S.; Petersen, B.L.; Andreasson, E. Mutations introduced in susceptibility genes through CRISPR/Cas9 genome editing confer increased late blight resistance in potatoes. Sci. Rep. 2021, 11, 4487. [Google Scholar] [CrossRef]
  7. Sun, K.; Wolters, A.-M.A.; Vossen, J.H.; Rouwet, M.E.; Loonen, A.E.H.M.; Jacobsen, E.; Visser, R.G.F.; Bai, Y. Silencing of six susceptibility genes results in potato late blight resistance. Transgenic Res. 2016, 25, 731–742. [Google Scholar] [CrossRef]
  8. Sun, K.; Schipper, D.; Jacobsen, E.; Visser, R.G.F.; Govers, F.; Bouwmeester, K.; Bai, Y. Silencing susceptibility genes in potato hinders primary infection with Phytophthora infestans at different stages. Hortic. Res. 2022, 9, uhab058. [Google Scholar] [CrossRef] [PubMed]
  9. Moon, K.-B.; Park, S.-J.; Park, J.-S.; Lee, H.-J.; Shin, S.Y.; Lee, S.M.; Choi, G.J.; Kim, S.-G.; Cho, H.S.; Jeon, J.-H.; et al. Editing of StSR4 by Cas9-RNPs confers resistance to Phytophthora infestans in potato. Front. Plant Sci. 2022, 13, 997888. [Google Scholar] [CrossRef]
  10. Baldwin, T.C.; Handford, M.G.; Yuseff, M.-I.; Orellana, A.; Dupree, P. Identification and Characterization of GONST1, a Golgi-Localized GDP-Mannose Transporter in Arabidopsis. Plant Cell 2001, 13, 2283–2295. [Google Scholar] [CrossRef]
  11. Mortimer, J.C.; Yu, X.; Albrecht, S.; Sicilia, F.; Huichalaf, M.; Ampuero, D.; Michaelson, L.V.; Murphy, A.M.; Matsunaga, T.; Kurz, S.; et al. Abnormal Glycosphingolipid Mannosylation Triggers Salicylic Acid–Mediated Responses in Arabidopsis. Plant Cell 2013, 25, 1881–1894. [Google Scholar] [CrossRef]
  12. Fang, L.; Ishikawa, T.; Rennie, E.A.; Murawska, G.M.; Lao, J.; Yan, J.; Tsai, A.Y.-L.; Baidoo, E.E.K.; Xu, J.; Keasling, J.D.; et al. Loss of Inositol Phosphorylceramide Sphingolipid Mannosylation Induces Plant Immune Responses and Reduces Cellulose Content in Arabidopsis. Plant Cell 2016, 28, 2991–3004. [Google Scholar] [CrossRef]
  13. Handford, M.; Sicilia, F.; Brandizzi, F.; Chung, J.H.; Dupree, P. Arabidopsis thaliana expresses multiple Golgi-localised nucleotide-sugar transporters related to GONST1. Mol. Genet. Genom. MGG 2004, 272, 397–410. [Google Scholar] [CrossRef]
  14. Rautengarten, C.; Ebert, B.; Liu, L.; Stonebloom, S.; Smith-Moritz, A.M.; Pauly, M.; Orellana, A.; Vibe Scheller, H.; Heazlewood, J.L. The Arabidopsis Golgi-localized GDP-L-fucose transporter is required for plant development. Nat. Commun. 2016, 7, 12119. [Google Scholar] [CrossRef]
  15. Jing, B.; Ishikawa, T.; Soltis, N.; Inada, N.; Liang, Y.; Murawska, G.; Fang, L.; Andeberhan, F.; Pidatala, R.; Yu, X.; et al. The Arabidopsis thaliana nucleotide sugar transporter GONST2 is a functional homolog of GONST1. Plant Direct 2021, 5, e00309. [Google Scholar] [CrossRef]
  16. Sechet, J.; Htwe, S.; Urbanowicz, B.; Agyeman, A.; Feng, W.; Ishikawa, T.; Colomes, M.; Kumar, K.S.; Kawai-Yamada, M.; Dinneny, J.R.; et al. Suppression of Arabidopsis GGLT1 affects growth by reducing the L-galactose content and borate cross-linking of rhamnogalacturonan-II. Plant J. 2018, 96, 1036–1050. [Google Scholar] [CrossRef]
  17. Cai, Y.; Wang, Z.; Wan, W.; Qi, J.; Liu, X.-F.; Wang, Y.; Lyu, Y.; Li, T.; Dong, S.; Huang, S.; et al. Time-course dual RNA-seq analyses and gene identification during early stages of plant-Phytophthora infestans interactions. Plant Physiol. 2025, 197, kiaf112. [Google Scholar] [CrossRef]
  18. Van Eck, J.; Keen, P.; Tjahjadi, M. Agrobacterium tumefaciens-Mediated Transformation of Tomato. In Transgenic Plants: Methods and Protocols; Kumar, S., Barone, P., Smith, M., Eds.; Springer: New York, NY, USA, 2019; pp. 225–234. [Google Scholar]
  19. Sanderfoot, A.A.; Kovaleva, V.; Bassham, D.C.; Raikhel, N.V. Interactions between Syntaxins Identify at Least Five SNARE Complexes within the Golgi/Prevacuolar System of the Arabidopsis Cell. Mol. Biol. Cell 2001, 12, 3733–3743. [Google Scholar] [CrossRef]
  20. Li, X.; Wang, X.; Yang, Y.; Li, R.; He, Q.; Fang, X.; Luu, D.-T.; Maurel, C.; Lin, J. Single-Molecule Analysis of PIP2;1 Dynamics and Partitioning Reveals Multiple Modes of Arabidopsis Plasma Membrane Aquaporin Regulation. Plant Cell 2011, 23, 3780–3797. [Google Scholar] [CrossRef] [PubMed]
  21. Karki, H.; Halterman, D.A. Phytophthora infestans (Late blight) Infection Assay in a Detached Leaf of Potato. Bio Protoc. 2021, 11, e3926. [Google Scholar] [CrossRef] [PubMed]
  22. Bai, X.; Ke, J.; Huang, P.; Fatima, I.; Cheng, T.; Tang, M. Promotion of natural flowers by JcFT depends on JcLFY in the perennial woody species Jatropha curcas. Plant Sci. 2022, 318, 111236. [Google Scholar] [CrossRef]
  23. Smith, J.M.; Heese, A. Rapid bioassay to measure early reactive oxygen species production in Arabidopsis leave tissue in response to living Pseudomonas syringae. Plant Methods 2014, 10, 6. [Google Scholar] [CrossRef]
  24. Dobin, A.; Davis, C.A.; Schlesinger, F.; Drenkow, J.; Zaleski, C.; Jha, S.; Batut, P.; Chaisson, M.; Gingeras, T.R. STAR: Ultrafast universal RNA-seq aligner. Bioinformatics 2013, 29, 15–21. [Google Scholar] [CrossRef]
  25. Anders, S.; Pyl, P.T.; Huber, W. HTSeq—A Python framework to work with high-throughput sequencing data. Bioinformatics 2015, 31, 166–169. [Google Scholar] [CrossRef]
  26. Pertea, M.; Kim, D.; Pertea, G.M.; Leek, J.T.; Salzberg, S.L. Transcript-level expression analysis of RNA-seq experiments with HISAT, StringTie and Ballgown. Nat. Protoc. 2016, 11, 1650–1667. [Google Scholar] [CrossRef]
  27. Love, M.I.; Huber, W.; Anders, S. Moderated estimation of fold change and dispersion for RNA-seq data with DESeq2. Genome Biol. 2014, 15, 550. [Google Scholar] [CrossRef]
  28. Monjil, M.S.; Kato, H.; Ota, S.; Matsuda, K.; Suzuki, N.; Tenhiro, S.; Tatsumi, A.; Pring, S.; Miura, A.; Camagna, M.; et al. Two structurally different oomycete lipophilic microbe-associated molecular patterns induce distinctive plant immune responses. Plant Physiol. 2024, 196, 479–494. [Google Scholar] [CrossRef]
  29. Zahid, M.A.; Kieu, N.P.; Carlsen, F.M.; Lenman, M.; Konakalla, N.C.; Yang, H.; Jyakhwa, S.; Mravec, J.; Vetukuri, R.; Petersen, B.L.; et al. Enhanced stress resilience in potato by deletion of Parakletos. Nat. Commun. 2024, 15, 5224. [Google Scholar] [CrossRef]
  30. Liu, H.-F.; Xue, X.-J.; Yu, Y.; Xu, M.-M.; Lu, C.-C.; Meng, X.-L.; Zhang, B.-G.; Ding, X.-H.; Chu, Z.-H. Copper ions suppress abscisic acid biosynthesis to enhance defence against Phytophthora infestans in potato. Mol. Plant Pathol. 2020, 21, 636–651. [Google Scholar] [CrossRef]
  31. Guo, L.; Qi, Y.; Mu, Y.; Zhou, J.; Lu, W.; Tian, Z. Potato StLecRK-IV.1 negatively regulates late blight resistance by affecting the stability of a positive regulator StTET8. Hortic. Res. 2022, 9, uhac010. [Google Scholar] [CrossRef]
  32. Lenarčič, T.; Albert, I.; Böhm, H.; Hodnik, V.; Pirc, K.; Zavec, A.B.; Podobnik, M.; Pahovnik, D.; Žagar, E.; Pruitt, R.; et al. Eudicot plant-specific sphingolipids determine host selectivity of microbial NLP cytolysins. Science 2017, 358, 1431–1434. [Google Scholar] [CrossRef]
Figure 1. Expansion and molecular divergence of SlGONSTs. (a) Maximal likelihood phylogenetic relationship of S. lycopersicum and A. thaliana GONST homologs. Bootstrap support for each node is indicated in red. (b) Subcellular localization of SlGONST1.1. Coexpression of SlGONST1.1-EGFP/p35S::AtSYP61-mRFP (Golgi marker) and SlGONST1.1-EGFP/p35S::PIP2-mRFP (plasma membrane marker) in tobacco. The white arrow indicates the merged fluorescence of GFP fluorescence and mRFP fluorescence. Scale bars = 50 μM. Similar results were observed in at least three individual leaves. (c) The expression pattern of (c) SlGONST1.1 in different tissues and organs of six-week-old plants. The black dots in (c) represent a biological repetition. (d) The expression pattern of SlGONST1.1 after P. infestans zoospore inoculation at 0, 2, 8, 24, 36, 48, and 72 hpi (hour post inoculation). The blue dots in (d) represent the relative expression level of SlGONST1.1. The blue line is the trend line of relative expression level. Data in (c,d) are presented as mean ± sd (n = 3). Groups of significant differences were denoted by different letters (p < 0.05, one-way ANOVA followed by Tukey’s HSD). The lowercase letters in the (c,d) indicate whether there is a significant difference in the relative expression level of SlGONST1.1 in one-way ANOVA analysis.
Genes 16 00470 g001
Figure 2. SlGONST1.1 negatively affects plant resistance against P. infestans. (a) Schematic representations of the CRISPR–Cas9-edited alleles of SlGONST1.1. The arrows indicate the gene editing of the corresponding exons of SlGONST1.1. (b) Leaves of wildtype and Slgonst1.1 leaflets infected with P. infestans spore suspension under bright field (upper panels) or UV illumination (lower panels), respectively. Lesion areas outlined with white dotted lines. Scale bar = 6 mm. Photos taken at 6 days post-inoculation. (c) Lesion area of the wildtype and the Slgonst1.1 knock-out lines. Red, green, and blue dots represent three biological replicates, and each point represents a sample. The whiskers (top and bottom) comprise values within 1.5 times the interquartile range (IQR). Center line, median; box limits, upper and lower quartiles. (d) Biomass of P. infestans in wildtype and the knock-out lines. Data are presented as means ± SD (n = 4). Each point represents an independent biological replicates. Significant differences in (c,d) determined according to one-way ANOVA analysis followed by Tukey’s test (p < 0.05). The lowercase letters in the (c,d) indicate whether there are significant differences between different groups.
Genes 16 00470 g002
Figure 3. Slgonst1.1 mutants show similar growth stature and reproductive traits to wildtype progenitors. Representative photos (a) and plant height statistics (b) of six-week-old Micro-Tom and Slgonst1.1 mutant plants. Scale bar = 4.5 cm. Representative photos (c) and fruit set per plant statistics (d) of twelve-week-old Micro-Tom and Slgonst1.1 mutant plants. Scale bar = 1.25 cm. Representative photos (e) and seed set per fruit statistics (f) of twelve-week-old Micro-Tom and Slgonst1.1 mutant plants. Scale bar = 3 mm. Data in (b,d,f) are presented as means ± SD (n = 10). Lowercase letters indicate significant differences according to one-way ANOVA analysis followed by Tukey’s test (p < 0.05). The lowercase letters in (b,d,f) indicate whether there are significant differences between different groups.
Genes 16 00470 g003
Figure 4. Phytohormone contents and PAMP-induced ROS dynamics detection in Slgonst1.1 knock-out lines. Concentrations of (a) salicylic acid (SA), (b) abscisic acid (ABA), (c) jasmonic acid (JA), (d) jasmonyl isoleucine (JA-Ile), and (e) indole-3-acetic acid (IAA) in wildtype and Slgonst1.1 knock-out lines. Statistical significance was assessed by one-way ANOVA followed by Tukey’s HSD (n = 10, p < 0.05). (f) Time-course quantification of reactive oxygen species in leaf discs of different genotypes elicited with flg22 (n = 7; data presented as mean ± sd). Sterile water was taken as mock treatment control. (g) Areas under curve calculated for the ROS quantification experiment. Genotypes of statistically significant differences are denoted by different letters (one-way ANOVA; p < 0.05). Each point represents an independent biological replicates. The lowercase letters indicate whether there are significant differences between different groups.
Genes 16 00470 g004
Figure 5. Comparative transcriptomic analysis of Slgonst1.1-3 and its wildtype progenitor. (a) PCA of the transcriptomes of wildtype (WT) and Slgonst1.1 tomato seedling leaflets. The colored ovals indicate 60% confidence intervals. The two dashed lines represent that the variance of PC1 and PC2 is 0, indicating that the data has no variability. (b) Differentially expressed genes between WT and Slgonst1.1 leaflet depicted by a volcano plot. The horizontal dotted line represents p < 0.05. Two vertical dashed lines represent |Log2FC|≥1 (c) Top enriched GO term among the Slgonst1.1-upregulated DEGs. (d) Expression patterns of the Slgonst1.1-upregulated DEGs associated with the defense-related enriched GO terms. (ei) qRT-PCR analysis of marker genes representative of the defense-related DEGs. Data are presented as mean ± sd (n = 3). Asterisks indicate a significant difference between transgenic plants and WT as determined by Student’s t-test at ** p < 0.01 or * p < 0.05.
Genes 16 00470 g005
Disclaimer/Publisher’s Note: The statements, opinions and data contained in all publications are solely those of the individual author(s) and contributor(s) and not of MDPI and/or the editor(s). MDPI and/or the editor(s) disclaim responsibility for any injury to people or property resulting from any ideas, methods, instructions or products referred to in the content.

