Abstract
Background: Colubridae, known to be one of the most species-rich snake families, remains relatively understudied in termshe context of complete mitochondrial genome research. This study provide the first systematic characterization of the mitochondrial genomes of six colubrid species: Lycodon subcinctus, Lycodon rosozonatus, Lycodon fasciatus, Lycodon gongshan, Lycodon futsingensis, and Lycodon aulicus. Method: In this study, mitochondrial genomes were sequenced using Sanger sequencing. The raw data were subjected to quality- filtered withing using Fastp and subsequently assembled into complete mitochondrial genomes via SPAdes. Gene annotation was performed by Tblastn, Genewise (for CDS coding sequences), MiTFi (for transfer RNAs), and Rfam (for ribosomal RNAs). Sequence analyses were conducted with various tools, including MEGA, tRNAscan-SE, DnaSP, MISA, and REPuter. Finally, phylogenetic trees were reconstructed based on 13 protein-coding genes from 14 species. Results:The mitogenomes of these six species ranged from 17,143 to 17,298 bp in length and con-sisted of 13 protein-coding genes (PCGs), 22 transfer RNA genes (tRNAs), 2 ribosomal RNA genes (rRNAs), and 2 control regions. The nucleotide composition of the Colu-bridae mitogenomes was comparable with an A + T composition ranging from 52.1% to 58.8% except for the trnS1 and trnC. All the tRNAs could fold into a stable secondary structure. The Pi and Ka/Ks values suggested that atp8 was the fastest-evolving gene, while cox1 was the most conserved gene. Bayesian inference and maximum likelihood phylogenetic analyses yielded consistent results, with the six sequenced species clus-tering together with their congeneric species. These findings will provide valuable references for further research on the phylogeny of Colubridae.
1. Introduction
The Lycodon genus, which belongs to the Colubrinae family known for its high species diversity within the suborder Serpentes, is one of the most diversified genera of Asian colubrids [1]. Currently, there are 82 known species globally (Reptile Database; http://reptile-database.reptarium.cz, accessed on 22 April 2025) ranging from central Asia and eastern Iran to southern China, the Indo-Australian Archipelago, Japan, and the Philippines [2,3]. Of these 82 species, a small portion of them have been documented in China [4,5,6,7,8]. The primary characteristics of the genus Lycodon include smooth or ridged dorsal scales, vertically elongated pupils, an anteriorly curved and arched maxilla, double rows of subcaudal scales, and scales covering the middle section of the body [2,9]. The genus Dinodon was established by Dumeril in 1853, with D. cancellatum designated as the type species. Key features of this genus encompass vertically elongated elliptical pupils, double rows of subcaudal scales, and elongated, narrow labial scales. Although the morphological characteristics of Dinodon closely resemble those of Lycodon, phylogenetic analyses using multiple loci have revealed that Dinodon is nested within Lycodon. Consequently, the entire Dinodon group has been reclassified under Lycodon [3,10].
Early studies of the species relationships within genus Lycodon were based on morphology, but this approach inevitably led to disagreements [11]. A few studies have reconstructed phylogenetic relationships based on multiple genes (Cyt b, nad4, c-mos, Rag1) [3,12]. Recent studies using molecular data have provided some new insights into the phylogenetic relationships among genus Lycodon species. At present, the species relationships among genus Lycodon were established based on the mitochondrial Cyt b gene [13,14]. There are slight differences in the phylogenetic trees constructed by the two methods. Due to the lack of complete mitochondrial genome data of the genus Lycodon, the relationship among them is still not fully examined.
Mitochondria are organelles present in most eukaryotic cells, playing a critical role in energy production [15]. Animal mitochondrial DNA (mtDNA) exhibits maternal inheritance and possesses a double-stranded circular structure. Its structural simplicity, characterized by the absence of introns and the presence of multiple copies, along with the rarity of recombination events, makes it a vital tool for investigating the molecular systematic evolution and development of eukaryotes [16,17,18]. As an informative molecular marker, phylogenetic relationships based on mitochondrial genomes typically demonstrate greater resolution, reliability, and robustness compared to those of other molecular markers [19]. Consequently, in recent years, the rapid advancement of genome sequencing technology has led to an increasing number of scholars analyzing species’ evolutionary relationships by comparing mitochondrial genomes across different species [20,21].
In this study, we reported the complete mitochondrial organizations and characteristics of six species belonging to the family Colubridae (L. subcinctus, L. rosozonatus, L. fasciatus, L. gongshan, L. futsingensis, and L. aulicus). Then, we described and analyzed the basic features of the mitochondrial genome, nucleotide composition, codon usage bias, nucleotide diversity (Pi), ratios of nonsynonymous (Ka)/synonymous (Ks), simple sequence repeats, and dispersed repeats. In addition, based on 13 protein-coding genes, the phylogenetic trees of 14 species (including 12 Lycodon snakes and 2 outgroups) were reconstructed by Bayesian inference (BI) and maximum likelihood (ML) methods. We hope that our study can enable better comprehension of Lycodon biodiversity and expand genetic resources for future Lycodon comparisons.
2. Materials and Methods
2.1. Specimen Collection
The data pertaining to the specimens collected in the course of this study are presented in the Table 1, and the collected specimens were soaked in anhydrous ethanol.

Table 1.
Sample information.
2.2. Extraction, Sequencing, and Annotation of Mitochondrial DNA
Liver tissues from six samples were excised using sterilized anatomical instruments, preserved in absolute ethanol, and sent to Shanghai Biotechnology Bioengineering Co., Ltd. (Shanghai, China) for sequencing. Sanger sequencing was performed using an Applied Biosystems 3730xl Genetic Analyzer (Thermo Fisher Scientific, Waltham, MA, USA), and the original image data files obtained from sequencing were converted into sequencing sequences through base recognition analysis. The raw data were assessed for quality and filtered for adapters and low-quality sequences using Fastp, resulting in the final clean data. Following the acquisition of high-quality sequencing data, the genomes were assembled using SPAdes v3.15.5 [22] (https://github.com/ablab/spades, accessed on 25 April 2024), incorporating multiple K-mer values [23]. The final complete genome sequence was derived by integrating the splicing results from each K-mer value. For gene annotation, coding sequence (CDS) gene boundaries were determined using Tblastn and Genewise [24] along with the relevant reference database; MiTFi [25] was utilized for tRNA sequence annotation, and Cmsearch from the Rfam database was employed to identify coding rRNA. Ultimately, the complete annotation results and the sequences were submitted to the GenBank database.
2.3. Sequence Analyses
Nucleotide composition, codon usage, amino acid composition, and relative synonymous codon usage (RSCU) values were calculated by MEGA 7.0 software [26]. Nucleotide bias was calculated according to the following formulas: AT skew [AT]/[A + T] and GC skew [GC]/[G + C] [27]. The secondary structures of the 22 tRNA genes were predicted using tRNAscan-SE 1.21 [28]. DnaSP 5.1 [29] was used to calculate the non-synonymous substitution rate (ka), synonymous substitution rate (ks), the ratio of ka / ks, and nucleotide diversity (pi) for protein-coding genes. Nucleotide diversity (pi) was plotted using the R-ggplot2 package (v3.5.0) [30]. The MISA software (v2.0) [31] was used to find SSRs in the organelle genome, and REPuter (v3.0) [32] annotated organelle genome repeats.
2.4. Phylogenetic Analysis
Phylogenetic trees summarize the genetic relationships among species and delineate their direct evolutionary links [33]. We downloaded a total of 8 complete mitochondrial genomes of Colubridae species from the NCBI database and combined them with mitochondrial genomes of 6 additional species from our study, resulting in an initial dataset comprising 14 species.
This dataset was imported into Phylosuite v1.2.3 software [34] for the extraction of 13 protein-coding genes (PCGs). Subsequently, multiple sequence alignments of each PCG were performed using MAFFT v7.464 software [35]. However, since MAFFT v7.464 does not account for the structure of PCGs, it may introduce alignment errors; therefore, it was necessary to optimize the aligned PCG sequences using MACSE [36]. GBlocks v0.91b was then employed to prune the PCGs, removing sites with alignment errors or multiple substitutions to eliminate phylogenetic noise and retain phylogenetic signals [37]. Next, the concatenation function in Phylosuite v1.2.3 was utilized to combine the individual genes of each species into a multigene sequence, which provides more phylogenetic information. Finally, within Phylosuite v1.2.3, the Best Information Criterion (BIC) and the greedy search strategy implemented in PartitionFinder [38] were employed to select the optimal partitioning scheme and evolutionary model. Besides Partitionfinder, ModelFinder [39] also has the same function. For the maximum likelihood (ML) analysis, ModelFinder identified the General Time Reversible (GTR) substitution model with gamma-distributed rate heterogeneity (+G) and a proportion of invariant sites (+I) as the best-fit model based on BIC scores. Based on the results obtained from PartitionFinder and ModelFinder, the phylogenetic relationships among these 14 species were constructed using Bayesian inference (BI) and maximum likelihood (ML) methods, respectively. IQ-tree v2 software [40] was used to construct the maximum likelihood (ML) phylogenetic tree, and bootstrap support (BS) was assessed using 1000 ultrafast bootstrap replicates. The Bayesian inference (BI) phylogenetic tree was constructed using MrBayes v3.2.6 software [41]. The MCMC iterations were set to 10,000,000 generations, with a sampling frequency of 1000. Four MCMC chains were run, and a Burnin Fraction value of 0.25 was applied to discard the first 25% of the samples. The online website TVBOT (https://www.chiplot.online/tvbot.html) (accessed on 10 May 2024) was used to visualize the phylogenetic trees of BI and ML [42].
3. Results
3.1. The Mitochondrial Genome Structure and Characteristics
The mitogenomes of the six species of the genus Lycodon were typical circular molecules with lengths of 17,235 bp for L. subcinctus, 17,143 bp for L. rosozonatus, 17,261 bp for L. fasciatus, 17,175 bp for L. gongshan, 17,298 bp for L. futsingensis, and 17,262 bp for L. aulicus (Figure 1, Table 2). The six mitogenomes contained 37 genes: 13 protein-coding genes (PCGs), 2 ribosomal RNA genes (12S rRNA and 16S rRNA), 22 transfer RNA genes (tRNAs), and two control regions. The gene arrangement was identical among the six species. Among the 13 PCGs, there were seven NADH dehydrogenase subunits (nad1–nad6), three cytochrome genes (cox1–cox3), two atp synthase genes (atp6 and atp8), and one cytochrome b gene. Among them, the nad6 gene and eight tRNA genes were encoded on the heavy strand (H strand), while the remaining 28 genes were distributed on the light strand (L strand) (Figure 1). As with other snake mitogenomes, they all contained two control regions with lengths ranging from 1011 to 1158 bp. In this region, one was located between trnP and trnF, which involves the replication origin of the H chain and the double-stranded transcription origin; the other was located between trnI and trnL (Figure 1).
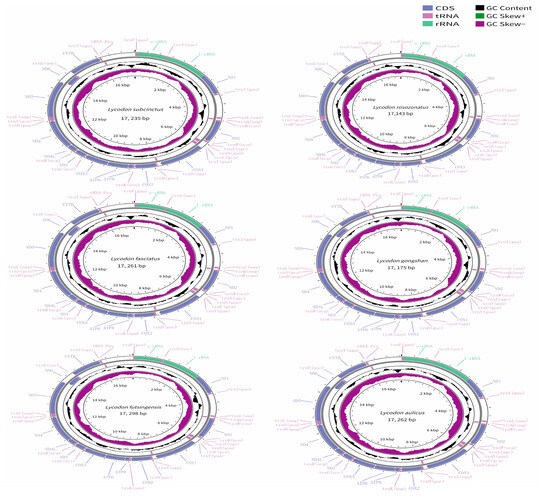
Figure 1.
Circular maps of the mitogenomes of L. subcinctus (a), L. rosozonatus (b), L. fasciatus (c), L. gongshan (d), L. futsingensis (e), and L. aulicus (f). Genes are shown in different color blocks. Color blocks being outside the circle indicates that the genes are located on the heavy strand (H-strand); color blocks being within the circle indicates that the genes are located on the light strand (L-strand).
Table 2.
Detailed information about gene content and composition of the six newly determined Lycodon mitochondrial genomes. The statistical results of the newly determined mitogenomes of L. subcinctus, L. rosozonatus, L. fasciatus, L. gongshan, L. futsingensis, and L. aulicus.
There were 6–9 intergenic spacers (IGS) in the complete mitochondrial genomes of the six species, with sizes ranging from 1 to 46 bp in length (Table 3). The longest IGS (46 bp) was identified between the cox1 and trnS2 genes in L. subcinctus, but it had the smallest number of IGS (6 bp). Four locations had same IGS across the six mitogenomes: trnL2-trnQ (1 bp-long IGS), trnQ-trnM (1 bp-long IGS) trnY-cox1 (1 bp-long IGS), nad6-trnE (9 bp-long IGS). We also identified five (L. subcinctus) to six overlaps distributed in six mitogenomes ranged from 1 to 10 bp (Table 3). The longest overlap region was located between atp8 and atp6 in the six species, which was 10 bp. Four locations had the same overlaps across the six mitogenomes: atp8-atp6 (10 bp-long overlaps), atp6-cox3 (1 bp-long overlaps), trnS1-trnL1 (3 bp-long overlaps) and nad4L-nad4 (1-bp long overlaps). Therefore, the main difference was between nad5-nad6 (5 or 9 bp) and trnF-rrnS (0, 2, or 3 bp).
Table 3.
The location, size, and number of intergenic spacers of the six newly sequenced mitogenomes.
3.2. Nucleotide Composition Analysis
The nucleotide compositions of the six newly sequenced mitogenomes were biased toward A and T, which was similar to that observed in other vertebrates (Table 4). Specifically, the compositions were as follows: L. subcinctus: A + T = 58.6%; L. rosozonatus: A + T = 59.4%; L. fasciatus: A + T = 58.5%; L. gongshan: A + T = 58.2%; L. futsingensis: A + T = 58.2%; and L. aulicus: A + T = 58.2%. According to the A + T skew formula, all six species exhibited inconspicuously positive values varying from 0.173 (L. subcinctus) to 0.150 (L. fasciatus and L. aulicus), while all GC skews were markedly negative, varying from −0.370 (L. gongshan) to −0.387 (L. subcinctus) (Table 4).
Table 4.
The location, size, and number of overlap regions of the six newly sequenced mitogenomes.
3.3. Protein-Coding Gene and Codon Preference Analysis
The entire lengths of the 13 PCGs of the six sequenced mitogenomes ranged from 10,695 to 10,704 bp (Table 2). Each of the PCG sequence exhibited a comparable size, with the nad5 gene being the longest (1770 bp or 1773 bp) and atp8 being the shortest (159 bp). In the six newly sequenced mitogenomes, nad6 was encoded on the L-strand, while other PCGs were on the H-strand (Figure 1). The total A + T content of the PCGs ranged from 58.2% (L. subcinctus) to 59.4% (L. futsingensis) (Table 5). Based on the comparative analysis, in the 13 PCGs of the six species, all genes except cox1 used the conventional ATN (where N represents T or G) as the start codon ATN (where N represents T or G). In the PCGs of L. subcinctus, L. gongshan, and L. aulicus, the genes atp8, atp6, nad4L, nad5, and nad6 used the termination codon TAA or AGG, while the remaining eight PCGs terminated with an incomplete termination codon (TA and T). In contrast, unlike these three species, the nad4 and nad6 genes of L. rosozonatus, L. fasciatus, and L. gongshan used the TAA and AGA as the termination codons, respectively (Table 2).
Table 5.
Base compositions of the complete genomes, PCGs, rRNAs, and tRNAs of the six newly sequenced mitogenomes.
The PCGs in the mitochondrial genomes of L. subcinctus, L. rosozonatus, L. fasciatus, L. gongshan, L. futsingensis, and L. aulicus were composed of 3652, 3643, 3649, 3649, 3648, and 3650 amino acids, respectively. The most frequently used amino acids in the PCGs of these six species was leucine (15.78–15.21%), isoleucine (13.95–15.12%), and threonine (12.67–11.76%), while the least frequently used amino acid was tryptophan (<1%) (Table 6). Codon usage bias analysis refers to the phenomenon of non-random usage of synonymous codons encoding the same amino acid in an organism. It was used to infer the evolutionary relationships between species based on the differences in codon usage preferences. The Relative Synonymous Codon Usage (RSCU) value can measure the frequency of codon usage. As shown in Figure 2, the three codons with the higher RSCU values in the mitochondrial genomes of the six species were CTA, CCA, and CGA, indicating that these three codons were the most frequently used in encoding the mitochondrial genome (Figure 2). The codon usage preferences were similar among the six species.
Table 6.
Codon number and RSCU in protein-coding genes (PCGs) of L. subcinctus, L. rosozonatus, L. fasciatus, L. gongshan, L. futsingensis, and L. aulicus.
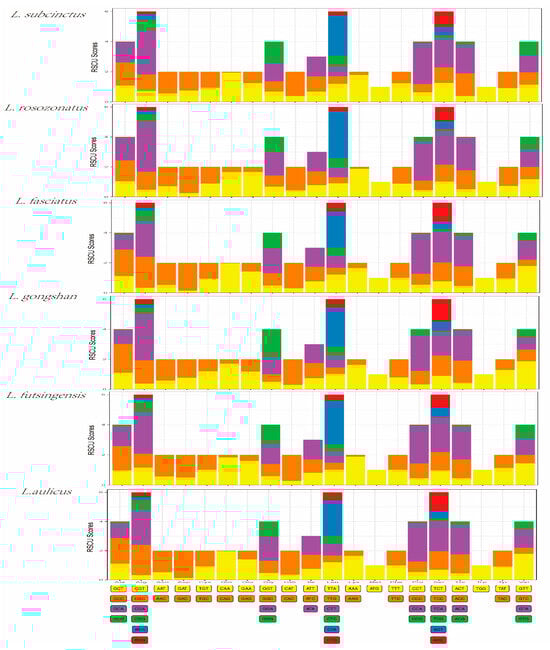
Figure 2.
Relative synonymous codon usage (RSCU) values in protein-coding genes (PCGs) of the six Lycodon species.
3.4. Nucleotide Diversity (Pi) and Nonsynonymous (Ka)/Synonymous (Ks) Mutation Rate Ratios
Pi values can be used to evaluate the genetic diversity level of population genomes, reflecting the major variant regions among genomes. In this study, the Pi values of the mitochondrial genomes of the six species were calculated (Figure 3). The results showed that atp8 and atp6 had higher Pi values (>0.16) than other coding genes. On the contrary, cox1 and cox3 showed lower nucleotide diversity values. The Ka/Ks ratio is used to assess the evolutionary rate of 13 PCGs in species (Figure 3). The results showed that the Ka/Ks ratios of all PCGs were less than 1, indicating that these genes were in a state of purification selection. In addition, the Ka/Ks ratio of the atp8 and nad6 gene were much higher than that of other genes and is subjected to the least selection pressure, suggesting it has a higher evolutionary rate. As with the result of nucleotide diversity analysis, the ka/ks value of cox1 and cox3 were smaller than other genes, suggesting that they were relatively conserved among the mitochondrial protein-coding genes due to their slower evolution rate and higher selection pressure.
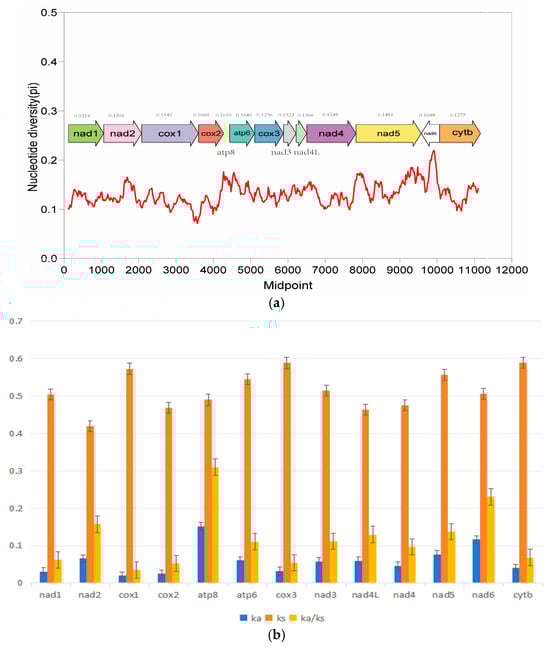
Figure 3.
Nucleotide diversity (a) and the Ka/Ks ratio (b) of PCGs in mitochondrial genomes of 14 species of Lycodon. The red line represent the trend of nucleotide diversity variation.
3.5. Analysis of Simple Sequence Repeats and Dispersed Repeats
In this study, simple sequence repeats (SSRs), which consist of 1–6 nucleotide units repeated in tandem multiple times, were analyzed in the six species (Figure S1). The results showed that both L. subcinctus and L. rosozonatus had 5 SSRs. However, the types of SSRs in L. subcinctus were divided into p2 (two nucleotide repeats) and p3 (three nucleotide repeats), while L. rosozonatus included p1 (single nucleotide repeat), p2, p3, and p4 (four nucleotide repeats), totaling four types. Additionally, three SSRs were found in each of the other four snake species. Apart from L. futsingensis, which had p1, p2, and p3 SSR types, the other three species all had types p2, p3, and p4.
Dispersed repeats are repetitive sequences that are scattered throughout the genome. They include four types: forward (F), reverse (R), complement (C), and palindromic (P). After using REPuter to annotate the repetitive sequences in the mitochondrial genomes, the results showed that the main type of dispersed repeats were F and P, and there were no R or C repeats. L. rosozonatus had the highest proportion of F-type repeats, while L. futsingensis had the lowest. In contrast, L. aulicus had the highest number of P-type repeats, with L. rosozonatus having the lowest (Figure S2).
3.6. Transfer and Ribosomal RNA Genes
The 22 tRNAs were detected in the six species, with lengths ranging from 57 (trnS) to 73 bp (trnL) and the entire length being between 902 (L. gongshan) and 910 bp (L. rosozonatus and L. futsingensis) (Table 2, Figure 1). Among of 22 tRNAs, eight tRNAs were located on the L-stand, and the other 14 were on the H-stand. The A + T contents of 22 tRNAs spanned from 58.1% (L. subcinctus, L. rosozonatus, L. fasciatus, L. gongshan, and L. aulicus) to 58.7% (L. futsingensis) with a high AT bias and all also exhibited a positive AT skew (0.171–0.185) and negative GC skew (0.138–0.168) (Table 5). The secondary structures of the 22 tRNAs in the six newly sequenced mitogenomes were generated and are presented in Figures S3–S8. All tRNAs could fold into a typical cloverleaf secondary structure, except for trnS1 (L-strand) and trnC (L-strand), which lacked a dihydrouracil (DHU) arm and T-arm, respectively. The trnS1 and trnC of L. subcinctus, L. gongshan, and L. futsingensis could not form a typical cloverleaf secondary structure, while the other three could only be trnS1.
The full size of two rRNAs genes in the six species ranged from 2385 (L. gongshan) to 2405 bp (L. rosozonatus), and both 12S rRNA and 16S rRNA were encoded on the H-stand. (Table 2, Figure 1) In addition, the nucleotide composition of 12S rRNA and 16S rRNA was calculated separately, and the A + T contents extended from 58.1% (L. subcinctus) to 59.2% (L. futsingensis) and all showed positive AT skew (0.315–0.340) and negative GC skew (0.208–0.227) (Table 5). The 12S rRNA genes were located between trnF and trnV, with sizes ranging from 926 (L. subcinctus, L. fasciatus, and L. aulicus) to 931 bp (L. rosozonatus). The 16S rRNA genes were located between trnV and nad1, with sizes ranging from 1466 (L. futsingensis) to 1474 bp (L. rosozonatus) (Table 2).
3.7. Phylogenetic Analysis
In this study, we conducted a phylogenetic analysis that included 12 species of Lycodon, as well as outgroup species from Ptyas. Phylogenetic analyses were performed based on the maximum likelihood (ML) and Bayesian inference (BI) methods. The maximum likelihood (ML) and Bayesian inference (BI) trees showed consistent topologies, and most nodes were strongly supported (Figure 4). The result showed that the phylogenetic tree contained two large branches: one consisted of two species of the genus Ptyas, and the other consisted of 12 species of the genus Lycodon. BI and ML trees showed strong support (BS = 100, PP = 1) for the monophyly of Lycodon, and the six complete mitogenomes covering one genera in this study have good clustering in phylogenetic trees. Within the clade including 12 species of Lycodon, five species of Lycodon (L. gongshan, L. aulicus, L. fasciatus, L. ruhstrati NC 046046, and L. ruhstrati KJ 179951) formed a strongly supported monophyletic group, in which L. aulicus and L. fasciatus were closely related, and L. gongshan was the sister of the other four species. Another seven species (L. subcinctus, L. futsingensis, L. semicarinatus, L. flavozonatus, L. rosozonatus, L. rufozonatus KJ 179950, and L. rufozonatus KF 148622) also formed a single clade, in which L. subcinctus was the sister of the other six species, L. futsingensis was the sister of the other fice species, and L. rosozonatus was the sister of L. rufozonatus KJ 179950 and L. rufozonatus KF 148622.
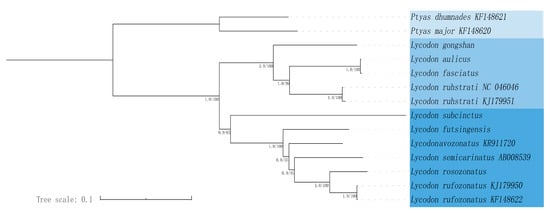
Figure 4.
Phylogenetic estimate of relationships within the 14 Lycodon species based on the 13 PCGs using Bayesian inference (BI) and maximum likelihood (ML) analyses.
4. Discussion
In this study, we sequenced and comparatively analyzed the complete mitogenomes of six species and found that the gene order, contents, and base composition were identical to those found in typical vertebrates [16,43]. The length of the mitogenomes of the six species ranged from 17,143 (L. rosozonatus) to 17,298 bp (L. futsingensis) (Figure 1). The typical metazoan mitochondrial genome size is considered to be 14–18 kb, and the lengths of the six mitochondrial genomes in this study were within this range [44]. In Alethinophidia, the mitochondrial genes of snakes hold two control regions (CR1, CR2), and their sequences are highly similar. In the species studied in this study, the length range of CR1 was 1019–1065 bp, and the length range of CR2 was 1011–1058 bp. The differences in the size of mtDNA are mainly caused by changes in the length of this region because that control region is the most susceptible to variation in length and sequence of vertebrate mtDNA.
The study showed that they exhibited a distinct high AT bias, which was highly similar to those of other Colubridae species [45,46,47]. AT preference is related to the geographical location and environmental temperature where the species lives [48]. In addition, the unbalanced use of the four bases can also lead to high A + T content [49]. The positive AT skew and negative GC skew was in alignment with the traits of most snake genomes and met the criteria for asymmetry in the mitochondrial gene composition of amniotes [50].
Among the 13 PCGs of all mitogenomes, only one gene (nad4) was located on the heavy strand, indicating that it had relative stability. Research has found that the vast majority genes use ATG as the initiator codon, which is regarded as the most common initiator codon in vertebrates [44]. Furthermore, the bulk of genes have incomplete stop codons, which has been repeatedly discovered in other animal mitogenomes [51,52,53]. Those incomplete stop codons can be converted into complete codons through post-transcriptional polyadenylation [54]. Codon usage patterns refer to the non-random selection phenomenon of synonymous codons (different codons encoding the same amino acid) during the translation process in organisms, where RSCU serves as a key metric to quantify this pattern by measuring the relative usage frequency of a specific codon within its synonymous codon family; moreover, codon usage pattern can judge the genetic relationship, and the closer the genetic relationship to a species, the more similar their RSCU values [55]. In this study, the RSCU values displayed a high degree of resemblance in codon preference among the six species, further proving their close genetic relationship.
The Ka/Ks analysis revealed that all 13 PCGs are under purifying selection (Ka/Ks < 1), consistent with their essential roles in mitochondrial function [56,57]. The Ka/Ks and Pi values of atp6 and atp8 were higher than those of other genes, indicating that mitochondrial ATPase subunits (atp6/atp8) often evolve rapidly due to their peripheral position in the electron transport chain complexes, which may tolerate more structural variations. cox1 and cox3 were the most conserved genes, likely because their catalytic roles in cytochrome c oxidase impose strict structural requirements. These patterns align with observations in Python snakes [58]. On the other hand, the high Ka/Ks ratio and Pi value of atp8 and atp6 also have been reported in other vertebrates [59].
Since mitochondrial tRNA genes are approximately the same size, they have a higher rate of evolution than nuclear tRNA genes do [60]. All genes except trnS1 and/or trnC could form a typical cloverleaf structure (Figure S3–S8). Since trnS1 lacked the dihydroxyuracil arm (D arm) and the trnC gene lacked the T-arm, they could not form a cloverleaf structure. The above phenomenon has also been found in other Colubridae species [61]. What is more, the lack of a D-arm or a T-arm in tRNA genes results in decreased peptide production, aminoacylation levels, and EF-Tu binding ability [62]. It is worth noting that a pseudogene trnP with a length of 53 bp was found between the mitochondrial gene trnl and the control region of L. futsingensis. Pseudogenes are non-functional or degenerated gene sequences, typically formed as inactive copies during evolution. The functional trnP gene is located next to CR1 (location in typical vertebrate mtDNA), while a pseudogene (trnP) may be present or absent near CR2. This phenomenon also exists in some snakes [63,64,65]. The other five species, considered primitive snakes, did not have the pseudogene trnP [66]. Different from the typical arrangement of tRNA genes in vertebrates, trnL in these six species had been moved from its original position between rrnL and nad1 to between CR2 and trnQ, which is common in Alethinophidia [64,67,68].
We further generated BI and ML trees with concatenated alignment of PCGs. In addition to the six newly sequenced species in this study, the other six Lycodon species in the phylogenetic tree were all species recorded on NCBI that have uploaded the complete mitochondrial genome sequence. Differently from previous studies, we used snakes’ mitochondrial whole-genome tree construction, while previous studies were mostly based on single-gene or multi-gene tree construction. In contrast, mitochondrial whole-gene tree construction has more biological evolution information and is more convincing than single-gene tree construction. The result indicated that the 12 species of genus Lycodon clustered in a monophyletic clade (Figure 4), which is consistent with the findings from previous phylogenetic studies [3]. L. aulicus, L. gongshan, L. faciatus, and L. rustrati were a monophyletic group, and L. aulicus and L. faciatus had the closest genetic relationship. According to other research results, L. gongshan, L. faciatus, and L. rustrati are still in the same monophyletic group, but L. aulicus is not in the same monophyletic group with them [3,14,69]. Similarly, the evolutionary positions of L. aulicus in previous studies were also different. This difference may be due to the different datasets used to construct the phylogenetic tree: previous studies built trees based on partial genomes, while ours were based on whole genomes. Consistently with other studies, L. subcinctus, L. futstingensis, L. rosozonatus, and the other four species were all on the same clade, and L. subcinctus was the sister of their five clade lines [3,14,69]. However, something different was that we found that L. futstingensis was the sister of the clade of five other species (L. semicarinatus, L. flavozonatus, L. rosozonatus, and L. rufozonatus), but other studies have shown that it and L. semicarinatus or L. flavozonatus were sisters of each other [3,70]. In summary, these differences remind us of the need to work hard to obtain more molecular data to determine phylogenetic relationships. There are 82 species in the genus Lycodon, but six species have been studied so far, and we have contributed to adding six species. However, it is far from the 82 species, so research on other undiscovered species is necessary in the future.
5. Conclusions
The mitogenomes of six Lycodon species (L. subcinctus, L. rosozonatus, L. fasciatus, L. gongshan, L. futsingensis, and L. aulicus) were newly sequenced and analyzed in this study. Structure and evolutionary analyses of the mitogenomes of Lycodon were conducted. The results showed that these six mitogenomes of the genus had similar structural characteristics and were biased toward A/T. In addition, the analysis showed that atp8 and atp6 evolved quickly, while cox1 and cox3 were relatively conserved genes, and the pseudogene trnP was found in L. futsingensis. Phylogenetic analysis indicated that the six species clustered together, but there are some differences in their genetic relationships compared with those from other studies. Therefore, it is necessary to improve the complete mitochondrial genome sample of the genus Lycodon and reconstruct a more comprehensive phylogenetic tree.
Supplementary Materials
The following supporting information can be downloaded at: https://www.mdpi.com/article/10.3390/genes16050493/s1, Figure S1: The type and count of simple sequence repeats (SSRs) of L. subcinctus, L. rosozonatus, L. fasciatus, L. gongshan, L. futsingensis, and L. aulicus; Figure S2: The length and count of dispersed repeats of L. subcinctus, L. rosozonatus, L. fasciatus, L. gongshan, L. futsingensis, and L. aulicus.; Figure S3: Putative secondary structures of tRNAs from the L. subcinctus; Figure S4: Putative secondary structures of tRNAs from the L. rosozonatus; Figure S5: Putative secondary structures of tRNAs from the L. fasciatus; Figure S6: Putative secondary structures of tRNAs from the L. gongshan; Figure S7: Putative secondary structures of tRNAs from the L. futsingensis; Figure S8: Putative secondary structures of tRNAs from the L. aulicus.
Author Contributions
Conceptualization, F.Z.; methodology, F.Z., A.L., and K.S.; software, F.Z., A.L., and K.S.; validation, F.Z. and A.L.; formal analysis, F.Z and A.L.; investigation, F.Z. and K.S.; resources, F.Z.; data curation, A.L and K.S.; writing—original draft preparation, A.L. and F.Z.; writing—review and editing, F.Z and A.L.; visualization, F.Z.; supervision, F.Z.; project administration, F.Z.; funding acquisition, F.Z. All authors have read and agreed to the published version of the manuscript.
Funding
The research design and data collection were financially supported by Natural Science Research Project for Higher Education Institutions of Guizhou Provincial Department of Education (Youth Talent Growth Project) ([2024]51), and new seedling plans from Guizhou Normal University ([2021]B03).
Institutional Review Board Statement
Not applicable.
Informed Consent Statement
Not applicable.
Data Availability Statement
The mitogenome was deposited at NCBI with the accession number PRJNA1232943.
Acknowledgments
We sincerely thank Shanghai Sangon Biotech Co., Ltd. for providing the sequencing platform and Ping Wang and colleagues at Yibin University for their assistance in sample collection.
Conflicts of Interest
The authors declare no conflicts of interest.
References
- Pyron, R.A.; Burbrink, F.T.; Colli, G.R.; De Oca, A.N.M.; Vitt, L.J.; Kuczynski, C.A.; Wiens, J.J. The phylogeny of advanced snakes (Colubroidea), with discovery of a new subfamily and comparison of support methods for likelihood trees. Mol. Phylogenetics Evol. 2011, 58, 329–342. [Google Scholar] [CrossRef] [PubMed]
- Lanza, B. A new specics of Lycodon from the Philippines, with a key to the genus (Reptilia Serpentes Colubridae). Trop. Zool. 1999, 12, 89–104. [Google Scholar] [CrossRef][Green Version]
- Guo, P.; Zhang, L.; Liu, Q.; Li, C.; Pyron, R.A.; Jiang, K.; Burbrink, F.T. Lycodon and Dinodon: One genus or two? Evidence from molecular phylogenetics and morphological comparisons. Mol. Phylogenetics Evol. 2013, 68, 144–149. [Google Scholar] [CrossRef] [PubMed]
- Che, J.; Jiang, K.; Yan, F.; Zhang, Y. Amphibians and Reptiles in Tibet—Diversity and Evolution; Science Press: Beijing, China, 2020. [Google Scholar]
- Guo, P.; Che, J. Snakes in Qinghai-Xizang Plateau; Science Press: Beijing, China, 2024; p. 229. [Google Scholar]
- Li, P.; Zhao, E.; Dong, B. Amphibians and Reptiles of Tibet; Science Press: Beijing, China, 2010. [Google Scholar]
- Wang, K.; Ren, J.; Chen, H.; Lyu, Z.; Guo, X.; Jiang, K.; Chen, J.; Li, J.; Guo, P.; Wang, Y. The updated checklists of amphibians and reptiles of China. Biodivers. Sci. 2020, 28, 189. [Google Scholar]
- Zhenyu, L.; Jian, L.; Qilang, W.; Baocheng, Y.; Liang, Z. Lycodon fasciatus: A Snake New Record to Guangdong Province, China. Chin. J. Zool. 2012, 47, 116–118. [Google Scholar]
- Zhao, E.-M. Fauna Sinica. Reptilia Vol. III. Squamata. Serpentes; Science Press: Beijing, China, 1998. [Google Scholar]
- Siler, C.D.; Oliveros, C.H.; Santanen, A.; Brown, R.M. Multilocus phylogeny reveals unexpected diversification patterns in Asian wolf snakes (genus Lycodon). Zool. Scr. 2013, 42, 262–277. [Google Scholar] [CrossRef]
- Vogel, G.; David, P.; Pauwels, O.S.G.; Sumontha, M.; Norval, G.; Hendrix, R.; Vu, N.T.; Ziegler, T. A revision of Lycodon ruhstrati (Fischer 1886) auctorum (Squamata Colubridae), with the description of a new species from Thailand and a new subspecies from the Asian mainland. Zool. Scr. 2009, 22, 131–182. [Google Scholar]
- Lei, J.; Sun, X.; Jiang, K.; Vogel, G.; Booth, D.T. Multilocus Phylogeny of Lycodon and the Taxonomic Revision of Oligodon multizonatum. Asian Herpetol. Res. 2014, 5, 26–37. [Google Scholar]
- Wang, J.; Qi, S.; Lyu, Z.-T.; Zeng, Z.-C.; Wang, Y.-Y. A new species of the genus Lycodon (Serpentes, Colubridae) from Guangxi, China. ZooKeys 2020, 954, 85. [Google Scholar] [CrossRef]
- Zhang, T.; Ding, L.; Wang, X.; Burbrink, F.T.; Huang, S.; Jiang, Z.; Cui, Z.; Su, Z.; He, B.; Huang, R.; et al. Confirmation of Distribution of Twin-spotted Wolf Snake, Lycodon jara (Shaw, 1802) (Serpentes, Colubridae) in China, with Detailed Morphological Description. Asian Herpetol. Res. 2024, 15, 225–231. [Google Scholar] [CrossRef]
- Hebert, S.L.; Lanza, I.R.; Nair, K.S. Mitochondrial DNA alterations and reduced mitochondrial function in aging. Mech. Ageing development 2011, 131, 451–462. [Google Scholar] [CrossRef]
- Boore, J.L. Animal mitochondrial genomes. Nucleic Acids Res. 1999, 27, 1767–1780. [Google Scholar] [CrossRef] [PubMed]
- Wang, X.; Pei, J.; Bao, P.; Cao, M.; Guo, X. Mitogenomic diversity and phylogeny analysis of yak (Bos grunniens). BMC Genom. 2021, 22, 325. [Google Scholar] [CrossRef] [PubMed]
- Shen, H.; Braband, A.; Scholtz, G. Mitogenomic analysis of decapod crustacean phylogeny corroborates traditional views on their relationships. Mol. Phylogenetics Evol. 2013, 66, 776–789. [Google Scholar] [CrossRef] [PubMed]
- Madsen, O.; Scally, M.; Douady, C.J.; Kao, D.J.; DeBry, R.W.; Adkins, R.; Amrine, H.M.; Stanhope, M.J.; de Jong, W.W.; Springer, M.S. Parallel adaptive radiations in two major clades of placental mammals. Nature 2001, 409, 610–614. [Google Scholar] [CrossRef] [PubMed]
- Arnason, U.; Gullberg, A.; Janke, A. Phylogenetic analyses of mitochondrial DNA suggest a sister group relationship between Xenarthra (Edentata) and Ferungulates. Mol. Biol. Evol. 1997, 14, 762–768. [Google Scholar] [CrossRef]
- Hua, Y.; Xu, Y.; Zhang, W.; Li, B. Complete mitochondrial genome reveals the phylogenetic relationship of sable Martes zibellina linkouensis. Mitochondrial DNA Part A 2015, 28, 263–264. [Google Scholar] [CrossRef]
- Bankevich, A.; Nurk, S.; Antipov, D.; Gurevich, A.A.; Dvorkin, M.; Kulikov, A.S.; Lesin, V.M.; Nikolenko, S.I.; Pham, S.; Prjibelski, A.D. SPAdes: A new genome assembly algorithm and its applications to single-cell sequencing. J. Comput. Biol. 2012, 19, 455–477. [Google Scholar] [CrossRef]
- Romanenkov, K.V. A new method of evaluating genome assemblies based on kmers frequencies. Mosc. Conf. Comput. Mol. Biol. 2017, 1–24. [Google Scholar] [CrossRef]
- Birney, E. GeneWise and Genomewise. Genome Res. 2004, 14, 988. [Google Scholar] [CrossRef]
- Meng, G.; Li, Y.; Yang, C.; Liu, S. MitoZ: A toolkit for animal mitochondrial genome assembly, annotation and visualization. Nucleic Acids Res. 2019, 47, e63. [Google Scholar] [CrossRef]
- Sudhir, K.; Glen, S.; Koichiro, T. MEGA7: Molecular Evolutionary Genetics Analysis Version 7.0 for Bigger Datasets. Mol. Biol. Evol. 2016, 33, 1870. [Google Scholar]
- Perna, N.T.; Kocher, T.D. Patterns of nucleotide composition at fourfold degenerate sites of animal mitochondrial genomes. J. Mol. Evol. 1995, 41, 353–358. [Google Scholar] [CrossRef] [PubMed]
- Lowe, T.M.; Chan, P.P. tRNAscan-SE On-line: Integrating search and context for analysis of transfer RNA genes. Nucleic Acids Res. 2016, 44, W54–W57. [Google Scholar] [CrossRef]
- Librado, P.; Rozas, J. DnaSP v5: A software for comprehensive analysis of DNA polymorphism data. Bioinformatics 2009, 25, 1451–1452. [Google Scholar] [CrossRef] [PubMed]
- Wickham, H. Ggplot2: Elegant Graphics for Data Analysis; Springer: Berlin/Heidelberg, Germany, 2009. [Google Scholar]
- Beier, S.; Thiel, T.; Münch, T.; Scholz, U.; Mascher, M. MISA-web: A web server for microsatellite prediction. Bioinformatics 2017, 33, 2583–2585. [Google Scholar] [CrossRef] [PubMed]
- Kurtz, S.; Schleiermacher, C. REPuter: Fast computation of maximal repeats in complete genomes. Bioinformatics 1999, 15, 426–427. [Google Scholar] [CrossRef]
- Robinson, D.F.; Foulds, L.R. Comparison of phylogenetic trees. Math. Biosci. 1981, 53, 131–147. [Google Scholar] [CrossRef]
- Zhang, D.; Gao, F.; Li, W.X.; Jakovli, I.; Zou, H.; Zhang, J. PhyloSuite: An integrated and scalable desktop platform for streamlined molecular sequence data management and evolutionary phylogenetics studies. Mol. Ecol. Resour. 2018, 20, 348–355. [Google Scholar] [CrossRef]
- Nakamura, T.; Yamada, K.D.; Tomii, K.; Katoh, K. Parallelization of MAFFT for large-scale multiple sequence alignments. Bioinformatics 2018, 34, 2490–2492. [Google Scholar] [CrossRef]
- Ranwez, V.; Douzery, E.J.; Cambon, C.; Chantret, N.; Delsuc, F. MACSE v2: Toolkit for the Alignment of Coding Sequences Accounting for Frameshifts and Stop Codons. Mol. Biol. Evol. 2018, 35, 2582–2584. [Google Scholar] [CrossRef] [PubMed]
- Castresana, J. Selection of Conserved Blocks from Multiple Alignments for Their Use in Phylogenetic Analysis. Mol. Biol. Evol. 2000, 17, 540–552. [Google Scholar] [CrossRef]
- Lanfear, R.; Frandsen, P.B.; Wright, A.M.; Senfeld, T.; Calcott, B. PartitionFinder 2: New Methods for Selecting Partitioned Models of Evolution for Molecular and Morphological Phylogenetic Analyses. Mol. Biol. Evol. 2017, 34, 772–773. [Google Scholar] [CrossRef] [PubMed]
- Kalyaanamoorthy, S.; Minh, B.Q.; Wong, T.K.F.; Haeseler, A.V.; Jermiin, L.S. ModelFinder: Fast Model Selection for Accurate Phylogenetic Estimates. Nat. Methods 2017, 14, 587–589. [Google Scholar] [CrossRef] [PubMed]
- Quang, M.B.; Schmidt, H.A.; Olga, C.; Dominik, S.; Woodhams, M.D.; Arndt, V.H.; Robert, L. IQ-TREE 2: New Models and Efficient Methods for Phylogenetic Inference in the Genomic Era. Mol. Biol. Evol. 2020, 5, 1530–1534. [Google Scholar]
- Huelsenbeck, J.P. MrBayes 3.2: Efficient Bayesian Phylogenetic Inference and Model Choice Across a Large Model Space. Syst. Biol. 2012, 61, 539–542. [Google Scholar]
- Xie, J.; Chen, Y.; Cai, G.; Cai, R.; Hu, Z.; Wang, H. Tree Visualization By One Table (tvBOT): A web application for visualizing, modifying and annotating phylogenetic trees. Nucleic Acids Res. 2023, 51, W587–W592. [Google Scholar] [CrossRef]
- Sorenson, M.D.; Ast, J.C.; Dimcheff, D.E.; Yuri, T.; Mindell, D.P. Primers for a PCR-based approach to mitochondrial genome sequencing in birds and other vertebrates. Mol. Phylogenetics Evol. 1999, 12, 105–114. [Google Scholar] [CrossRef]
- Wolstenholme, D.R. Animal Mitochondrial DNA: Structure and Evolution. Int. Rev. Cytol. 1992, 141, 173–216. [Google Scholar]
- He, M.; Feng, J.; Zhao, E. The complete mitochondrial genome of the Sichuan hot-spring keel-back (Thermophis zhaoermii; Serpentes: Colubridae) and a mitogenomic phylogeny of the snakes. Mitochondrial DNA 2010, 21, 8–18. [Google Scholar] [CrossRef]
- Sun, H.; Li, E.; Sun, L.; Yan, P.; Xue, H.; Zhang, F.; Wu, X. The complete mitochondrial genome of the greater green snake Cyclophiops major (Reptilia, Serpentes, Colubridae). Mitochondrial DNA Part B 2017, 2, 309–310. [Google Scholar] [CrossRef]
- Wang, Y.; Liu, P.; Li, H.; Shao, C. The complete mitochondrial genome of Opisthotropis latouchii (Squamata: Colubridae). Mitochondrial DNA Part B 2019, 4, 1437–1438. [Google Scholar] [CrossRef]
- Weber, C.C.; Hurst, L.D. Intronic AT Skew is a Defendable Proxy for Germline Transcription but does not Predict Crossing-Over or Protein Evolution Rates in Drosophila melanogaster. J. Mol. Evol. 2010, 71, 415. [Google Scholar] [CrossRef] [PubMed][Green Version]
- Chris, S.; Francesco, F.; Andrew, B.; Bernie, C.; Hong, L.; Paul, F. Evolution, Weighting, and Phylogenetic Utility of Mitochondrial Gene Sequences and a Compilation of Conserved Polymerase Chain Reaction Primers. Ann. Entomol. Soc. Am. 1994, 6, 651–701. [Google Scholar]
- Quinn, T.W.; Wilson, A.C. Sequence evolution in and around the mitochondrial control region in birds. J. Mol. Evol. 1993, 37, 417–425. [Google Scholar] [CrossRef] [PubMed]
- Ki, J.S.; Hwang, D.S.; Park, T.J.; Han, S.H.; Lee, J.S. A comparative analysis of the complete mitochondrial genome of the Eurasian otter Lutra lutra (Carnivora; Mustelidae). Mol. Biol. Rep. 2010, 37, 1943–1955. [Google Scholar] [CrossRef]
- Ojala, D.; Montoya, J.; Attardi, G. tRNA punctuation model of RNA processing in human mitochondria. Nature 1981, 290, 470–474. [Google Scholar] [CrossRef]
- Tang, Y.-Y.; Tang, B.-P.; Xin, Z.-Z.; Li, Y.-T.; Zha, X.-H.; Zhang, D.-Z.; Sun, Y.; Liu, Q.-N.; Ma, Y.-F. Characterization of the complete mitochondrial genome of Helice latimera and its phylogenetic implications in Brachyura. Genomics 2020, 112, 5180–5187. [Google Scholar] [CrossRef]
- Alexander, D.; Frank, J.; Marwa, A.A.; Bernhart, S.H.; Franziska, R.; Stadler, P.F.; Martin, M.; Matthias, B. Improved annotation of protein-coding genes boundaries in metazoan mitochondrial genomes. Nucleic Acids Res. 2019, 20, 10543–10552. [Google Scholar]
- Bu, Y.; Wu, X.; Sun, N.; Man, Y.; Jing, Y. Codon usage bias predicts the functional MYB10 gene in Populus. J. Plant Physiol. 2021, 265, 153491. [Google Scholar] [CrossRef]
- Hurst, L.D. The Ka/Ks ratio: Diagnosing the form of sequence evolution. Trends Genet. 2002, 18, 486. [Google Scholar] [CrossRef] [PubMed]
- Meiklejohn, C.D.; Montooth, K.L.; Rand, D.M. Positive and negative selection on the mitochondrial genome. Trends Genet. 2007, 23, 259–263. [Google Scholar] [CrossRef] [PubMed]
- Dubey, B.; Meganathan, P.R.; Haque, I. Complete mitochondrial genome sequence from an endangered Indian snake, Python molurus molurus (Serpentes, Pythonidae). Mol. Biol. Rep. 2012, 39, 7403–7412. [Google Scholar] [CrossRef]
- Sun, C.H.; Liu, H.Y.; Lu, C.H. Five new mitogenomes of Phylloscopus (Passeriformes, Phylloscopidae): Sequence, structure, and phylogenetic analyses. Int. J. Biol. Macromol. 2020, 146, 638–647. [Google Scholar] [CrossRef]
- Saccone, C.; Giorgi, C.D.; Gissi, C.; Pesole, G.; Reyes, A. Evolutionary genomics in Metazoa: The mitochondrial DNA as a model system. Gene 1999, 238, 195–209. [Google Scholar] [CrossRef] [PubMed]
- Li, E. Phylogenetic Relationships of Serpentes Based on Mitochondrial Genomes. Ph.D. Thesis, Anhui Normal University, Wuhu, China, 2015. [Google Scholar]
- Watanabe, Y.I.; Suematsu, T.; Ohtsuki, T. Losing the stem-loop structure from metazoan mitochondrial tRNAs and co-evolution of interacting factors. Front. Genet. 2014, 5, 109. [Google Scholar] [CrossRef]
- Kumazawa, Y.; Ota, H.; Nishida, M.; Ozawa, T. The complete nucleotide sequence of a snake (Dinodon semicarinatus) mitochondrial genome with two identical control regions. Genetics 1998, 150, 313. [Google Scholar] [CrossRef]
- Dong, S.; Kumazawa, Y. Complete Mitochondrial DNA Sequences of Six Snakes: Phylogenetic Relationships and Molecular Evolution of Genomic Features. J. Mol. Evol. 2005, 61, 12–22. [Google Scholar] [CrossRef]
- Jiang, Z.J.; Castoe, T.A.; Austin, C.C.; Burbrink, F.T.; Herron, M.D.; Mcguire, J.A.; Parkinson, C.L.; Pollock, D.D. Comparative mitochondrial genomics of snakes: Extraordinary substitution rate dynamics and functionality of the duplicate control region. BMC Evol. Biol. 2007, 7, 123. [Google Scholar] [CrossRef]
- Wang, G.; He, S.; Huang, S.; He, M.; Zhao, E. The complete mitochondrial DNA sequence and the phylogenetic position of Achalinus meiguensis (Reptilia: Squamata). Sci. Bull. 2009, 54, 1713–1724. [Google Scholar] [CrossRef]
- Yan, J.; Li, H.; Zhou, K. Evolution of the mitochondrial genome in snakes: Gene rearrangements and phylogenetic relationships. BMC Genom. 2008, 9, 569. [Google Scholar] [CrossRef] [PubMed]
- Chen, N.; Zhao, S. New progress in snake mitochondrial gene rearrangement. Mitochondrial DNA 2009, 20, 69–71. [Google Scholar] [CrossRef] [PubMed]
- Liu, S.; Hou, M.; Cai, B.; Li, S.; Zhang, Z.; Yu, R.; Rao, D.; Zhang, L. Taxonomic status of Lycodon subcinctus sensu lato in China (Serpentes, Colubridae). Herpetozoa 2023, 36, 307–316. [Google Scholar] [CrossRef]
- Janssen, H.Y.; Pham, C.T.; Ngo, H.T.; Le, M.D.; Ziegler, T. A new species of Lycodon Boie, 1826 (Serpentes, Colubridae) from northern Vietnam. ZooKeys 2019, 875, 1–29. [Google Scholar] [CrossRef]


Disclaimer/Publisher’s Note: The statements, opinions and data contained in all publications are solely those of the individual author(s) and contributor(s) and not of MDPI and/or the editor(s). MDPI and/or the editor(s) disclaim responsibility for any injury to people or property resulting from any ideas, methods, instructions or products referred to in the content. |
© 2025 by the authors. Licensee MDPI, Basel, Switzerland. This article is an open access article distributed under the terms and conditions of the Creative Commons Attribution (CC BY) license (https://creativecommons.org/licenses/by/4.0/).