Article

Preliminary Dual-Satellite Observations of Atmospheric Gravity Waves in Airglow

1
Department of Atmospheric and Planetary Sciences, Hampton University, Hampton, VA 23668, USA
2
Space and Upper Atmospheric Sciences Group, National Institute of Polar Research, Tachikawa, Tokyo 190-8518, Japan
3
Space Weather and Environment Informatics Laboratory, National Institute of Communications and Information Technology, Koganei, Tokyo 184-8795, Japan
4
National Institute of Aeronautics and Space (LAPAN) of Indonesia, Bandung 40173, Indonesia
5
Division of Space Physics, University of Science and Technology in China, Hefei 230026, China
6
Department of Information and Communication Engineering, The University of Electro-Communications, Tokyo 182-0021, Japan
7
Graduate School of Science, Planetary Plasma and Atmospheric Research Center, Tohoku University, Sendai 980-8578, Japan
8
Graduate School of Science, Division of Earth and Planetary Sciences, Department of Geophysics, Kyoto University, Kyoto 606-8502, Japan
9
Department of Atmospheric Science, Cooperative Institute for Research in the Atmosphere, Colorado State University, Fort Collins, CO 80521, USA
10
Cooperative Institute for Meteorological Satellite Studies, University of Wisconsin Madison, Madison, WI 53706, USA
*
Author to whom correspondence should be addressed.
Atmosphere 2019, 10(11), 650; https://doi.org/10.3390/atmos10110650
Submission received: 25 August 2019 / Revised: 10 October 2019 / Accepted: 25 October 2019 / Published: 28 October 2019

Abstract

:
Atmospheric gravity waves (AGWs) are among the important energy and momentum transfer mechanisms from the troposphere to the middle and upper atmosphere. Despite their understood importance in governing the structure and dynamics of these regions, mesospheric AGWs remain poorly measured globally, and largely unconstrained in numerical models. Since late 2011, the Suomi National Polar-orbiting Partnership (NPP) Visible/Infrared Imaging Radiometer Suite (VIIRS) day–night band (DNB) has observed global AGWs near the mesopause by virtue of its sensitivity to weak emissions of the OH* Meinel bands. The wave features, detectable at 0.75 km spatial resolution across its 3000 km imagery swath, are often confused by the upwelling emission of city lights and clouds reflecting downwelling nightglow. The Ionosphere, Mesosphere, upper Atmosphere and Plasmasphere (IMAP)/ Visible and near-Infrared Spectral Imager (VISI) O2 band, an independent measure of the AGW structures in nightglow based on the International Space Station (ISS) during 2012–2015, contains much less noise from the lower atmosphere. However, VISI offers much coarser resolution of 14–16 km and a narrower swath width of 600 km. Here, we present preliminary results of comparisons between VIIRS/DNB and VISI observations of AGWs, focusing on several concentric AGW events excited by the thunderstorms over Eastern Asia in August 2013. The comparisons point toward suggested improvements for future spaceborne airglow sensor designs targeting AGWs.

1. Introduction

Atmospheric gravity waves (AGWs) arise from disturbances in which gravity and buoyancy act as the restoring forces on air parcels displaced from their level of hydrostatic equilibrium [1,2,3]. AGWs are among the most important energy transfer mechanisms from the troposphere into the stratosphere, mesosphere, and thermosphere. Through their transport of energy and momentum upward, AGWs play a governing role in the structure and circulation of the middle and upper atmosphere [3,4,5,6,7].
The motivation for a better understanding of AGWs is well founded. Turbulence from AGW breaking influences the vertical distribution of composition in the thermosphere (such as atomic oxygen abundance) in a way that is highly relevant to thermospheric neutral density and ionospheric electron density [8,9]. AGWs with small amplitudes and long wavelengths, or secondary waves from AGW breaking, can reach the thermosphere and directly influence the thermosphere and ionosphere e.g., [10,11,12,13]. Since AGWs are mostly transient, ephemeral and episodic, their global temporal and spatial characteristics are poorly understood—especially above the stratopause, where global AGW observations from state-of-art remote sensing technology are rare. Here, new and unprecedented satellite-measurements of atmospheric airglow may begin to fill our current gaps in coverage and understanding.
Airglow emissions are caused by chemiluminescent processes occurring in the upper atmosphere e.g., [14,15,16], predominately from excited hydroxyl (OH*), molecular oxygen (O2), sodium (Na) and atomic oxygen (OI). This signal has been widely utilized to observe AGWs in the Earth’s mesopause region by way of ground-based cameras/imagers or even the naked eye since 1970s and 1980s e.g., [17,18,19,20,21,22,23,24,25]. Over recent decades, numerous studies of AGWs have used ground airglow imagers. Statistical climatology of airglow AGW parameters (e.g., horizontal wavelengths, periods, propagation directions and velocities, momentum flux) at selected locations has been reported e.g., [26,27,28,29,30,31,32,33,34]. Airglow imagers have been utilized to study the relation between AGWs in the mesopause and their terrestrial sources, such as thunderstorms [35,36,37,38,39,40], orography [41], and even hurricanes and typhoons [42].
On one hand, ground airglow imagers or cameras can provide the high spatial (sub-km) and temporal (seconds to minutes) resolution measurements of airglow AGWs. On the other, ground imagers have limited spatial coverage (~500 km × 500 km) unless a wide network of ground imagers is established [40]. Regardless of ground network size, the observations are subject to weather conditions (i.e., cloud obscuration at local to synoptic scales). Owing to logistical challenges of deployment, airglow imager observations over the expansive oceanic basins are non-existent, or at best, very rare. Space-borne airglow AGW sensors can fill these gaps.
In this paper, we conduct a preliminary comparison of AGW observations by two space-borne airglow sensors offering varied capability to observe airglow AGWs as a way to understand their joint performance and gain insight on future space-borne sensor designs. This is a preliminary study because a systematic comparison between the AGWs in two sensors is not presented in this paper. Because coordinated observations of AGWs were not originally planned, these two sensors were on very different orbits with different viewing conditions. Therefore, there were not many simultaneous AGW observations by both sensors. Section 2 introduces the two space-borne sensors considered in this study: (i) the day–night band (DNB) on the Visible/Infrared Imaging Radiometer Suite (VIIRS) carried on the Suomi National Polar-orbiting Partnership (Suomi NPP) satellite, and (ii) the Visible and near-Infrared Spectral Imager (VISI) on the Ionosphere, Mesosphere, upper Atmosphere and Plasmasphere (IMAP) carried on the International Space Station (ISS). Section 3 presents examples and basic analysis of simultaneous airglow AGW observations using the two satellite sensors. Section 4 discuses implications of these findings, and concludes the paper.

2. Instrumentation

Space-borne airglow AGW observations recently became available with modern high-resolution high-sensitivity sensor techniques. The nadir-viewing VIIRS/DNB on Suomi NPP, operated by the National Oceanic and Atmospheric Administration (NOAA), was launched on 28 October 2011. Suomi NPP flies in the 834 km altitude sun-synchronous polar orbit with local equator crossing times of 01:30 p.m. and 01:30 a.m. A second DNB now flies on the Joint Polar Satellite System-1 (JPSS-1), flying in the same orbital plane as Suomi NPP but ½-orbit (~50 min) ahead. The DNB radiometer was designed for detection of very faint nocturnal signals, e.g., lunar reflectance of clouds and the surface, with a 505–890 nm band pass [43]. Its imagery has a nearly constant spatial resolution of ~0.75 km across a 3000 km swath width, and provides global coverage, (e.g., NASA WorldView https://worldview.earthdata.nasa.gov/). Miller et al. [44] demonstrate that DNB is also able to detect the weak emissions, both reflected downwelling and direct upwelling, of OH* Meinel band airglow emissions (OH(8-3) at 730 nm, OH(4,0) at 753 nmOH(9-4) at 776 nm, OH(5-1) at 792 nm) originating from ~85 km on moonless nights (spanning about half of each ~29 day lunar cycle). Other airglow emissions (O2(0-0) at 762 nm, O2(0-1) at 867.7 nm, OI at 557.7 nm, Na at 589 nm) are weaker relative to the OH* Meinel band airglow. This airglow sensing capability has been utilized to study AGWs around the world [45], including thunderstorm and tropical cyclone generated AGWs [12,46,47,48,49] and mesospheric bores [50,51].
While the DNB’s capability to detect AGWs was unplanned, the IMAP/VISI was designed specifically for that purpose. VISI flew on board the Japanese module of the ISS at ~408 km to study airglow structures [52] between October 2012 to September 2015 at the latitude range of 54° S–54° N. VISI is an imaging spectrograph operating two Field of View (FOV) pointing 45° forward and 45° backward to nadir. The spectrometer consists of objective lens, collimator optics and CCD sensor. The spectral resolution of VISI is ~1 nm/pixel. In nominal operation mode, VISI observes three nightglow emissions, OH* Meinel (8-3) (730 nm), O2 (0-0) atmospheric (762 nm) and O(1D) (630 nm) [52]. The VISI OH* channel was contaminated with background city lights and reflected moonlight from clouds, similar to DNB. Since these signals are largely absorbed by O2 in the lower atmosphere, only the O2 emission at ~95 km has been used to study global AGWs including mesospheric bores so far [53,54,55,56,57]. VISI data have a horizontal resolution of 14–16 km and a 600 km swath width for the O2 emission. Thus, in comparison to the wide swath of VIIRS/DNB, VISI offered relatively narrow spatial coverage. Table 1 compares the specifications of VISI and VIIRS/DNB.
This study comprises of an initial effort to co-locate and compare AGW observations from these two spaceborne airglow sensors. The principal objective of this comparison is to understand the nuances of each measurement in terms of AGW sensitivity and characterization, providing context to the capabilities and limitations of the current sensors while helping to inform decisions on the design of future observing systems.

3. AGW Observations

VISI and VIIRS/DNB operations overlapped between September 2012 and August 2015. On several nights during August 2013, the two sensors captured simultaneous (in close space/time proximity) observations of concentric AGWs in Eastern Asia. AGWs in the O2 emission at ~95 km detected by VISI are ~10 km higher than the OH* Meinel band signal detected by DNB at ~85 km. The OH* channel in VISI is not suitable for AGW studies due to low signal to noise level and noisy background. Xu et al. [40] show that a large number of thunderstorms occurring throughout Northern China during portions of August 2013 excited many concentric AGWs that propagated into the stratosphere and mesopause region. “Overshooting” of the tropopause by these thunderstorms is suggested to be the mechanism of these AGW excitations [38,58]. Xu et al. [40] report these AGWs on the nights of 9 August and 13 August 2013 using a ground OH imager network, VIIRS/DNB and Atmospheric Infrared Sounder (AIRS) observations.
Figure 1a,b shows the VIIRS/DNB concentric AGWs over Northern China at ~17:37 UTC on 9 August 2013. Xu et al. [40] found that the horizontal wavelength of these small-scale AGWs is ~20 km and ~100 km for the large-scale AGWs. Because of the contamination of city lights, only airglow AGWs over clouds and the ocean are discernible in VIIRS/DNB despite its wide swath width. The bright stripes also present atop some of the clouds are due to lightning flashes [43,59].
AGW horizontal wavelengths were derived for this case by measuring the distances between several adjacent bright bands (wave crests) and dividing by the number of bands considered. For example, the averaged horizontal wavelength between points A and B is ~30 km and between C and D is ~22 km, as illustrated by Figure 1b. Because the nadir viewing satellite images from VIIRS/DNB and VISI lack both temporal and vertical resolution, AGW vertical wavelengths and periods cannot be derived.
It should be noted that the horizontal dark band in Figure 1a is not an AGW feature, but an artifact of the stray light correction. Stray light is a term describing direct sunlight that enters the optical assembly and contaminates the DNB Earth-scene imagery. The contamination near the day/night terminator, and so the associate imagery artifact migrates north/south with the seasons. A post-processing correction predicts this space/time-varying stray light signal and subtracts it. The lookup tables are computed monthly. However, the migration of the stray light zone is continuous. As such, there are times near the end of a month, before the new table is applied, where there is a slight mismatch between the assumed and actual location of the stray light zone. For August 2013, the stray light zone is retreating to the north, but the correction assumes (incorrectly) that it is positioned slightly further south. The mismatch results in an overcorrection on the southern fringe, producing imagery that is too dark there. In addition to stray light artifacts, there are detector striping patterns in the VIIRS/DNB imagery, arising from slight differences in detector response which appear prominent when considering these airglow signals, which reside close to the sensor’s noise floor.
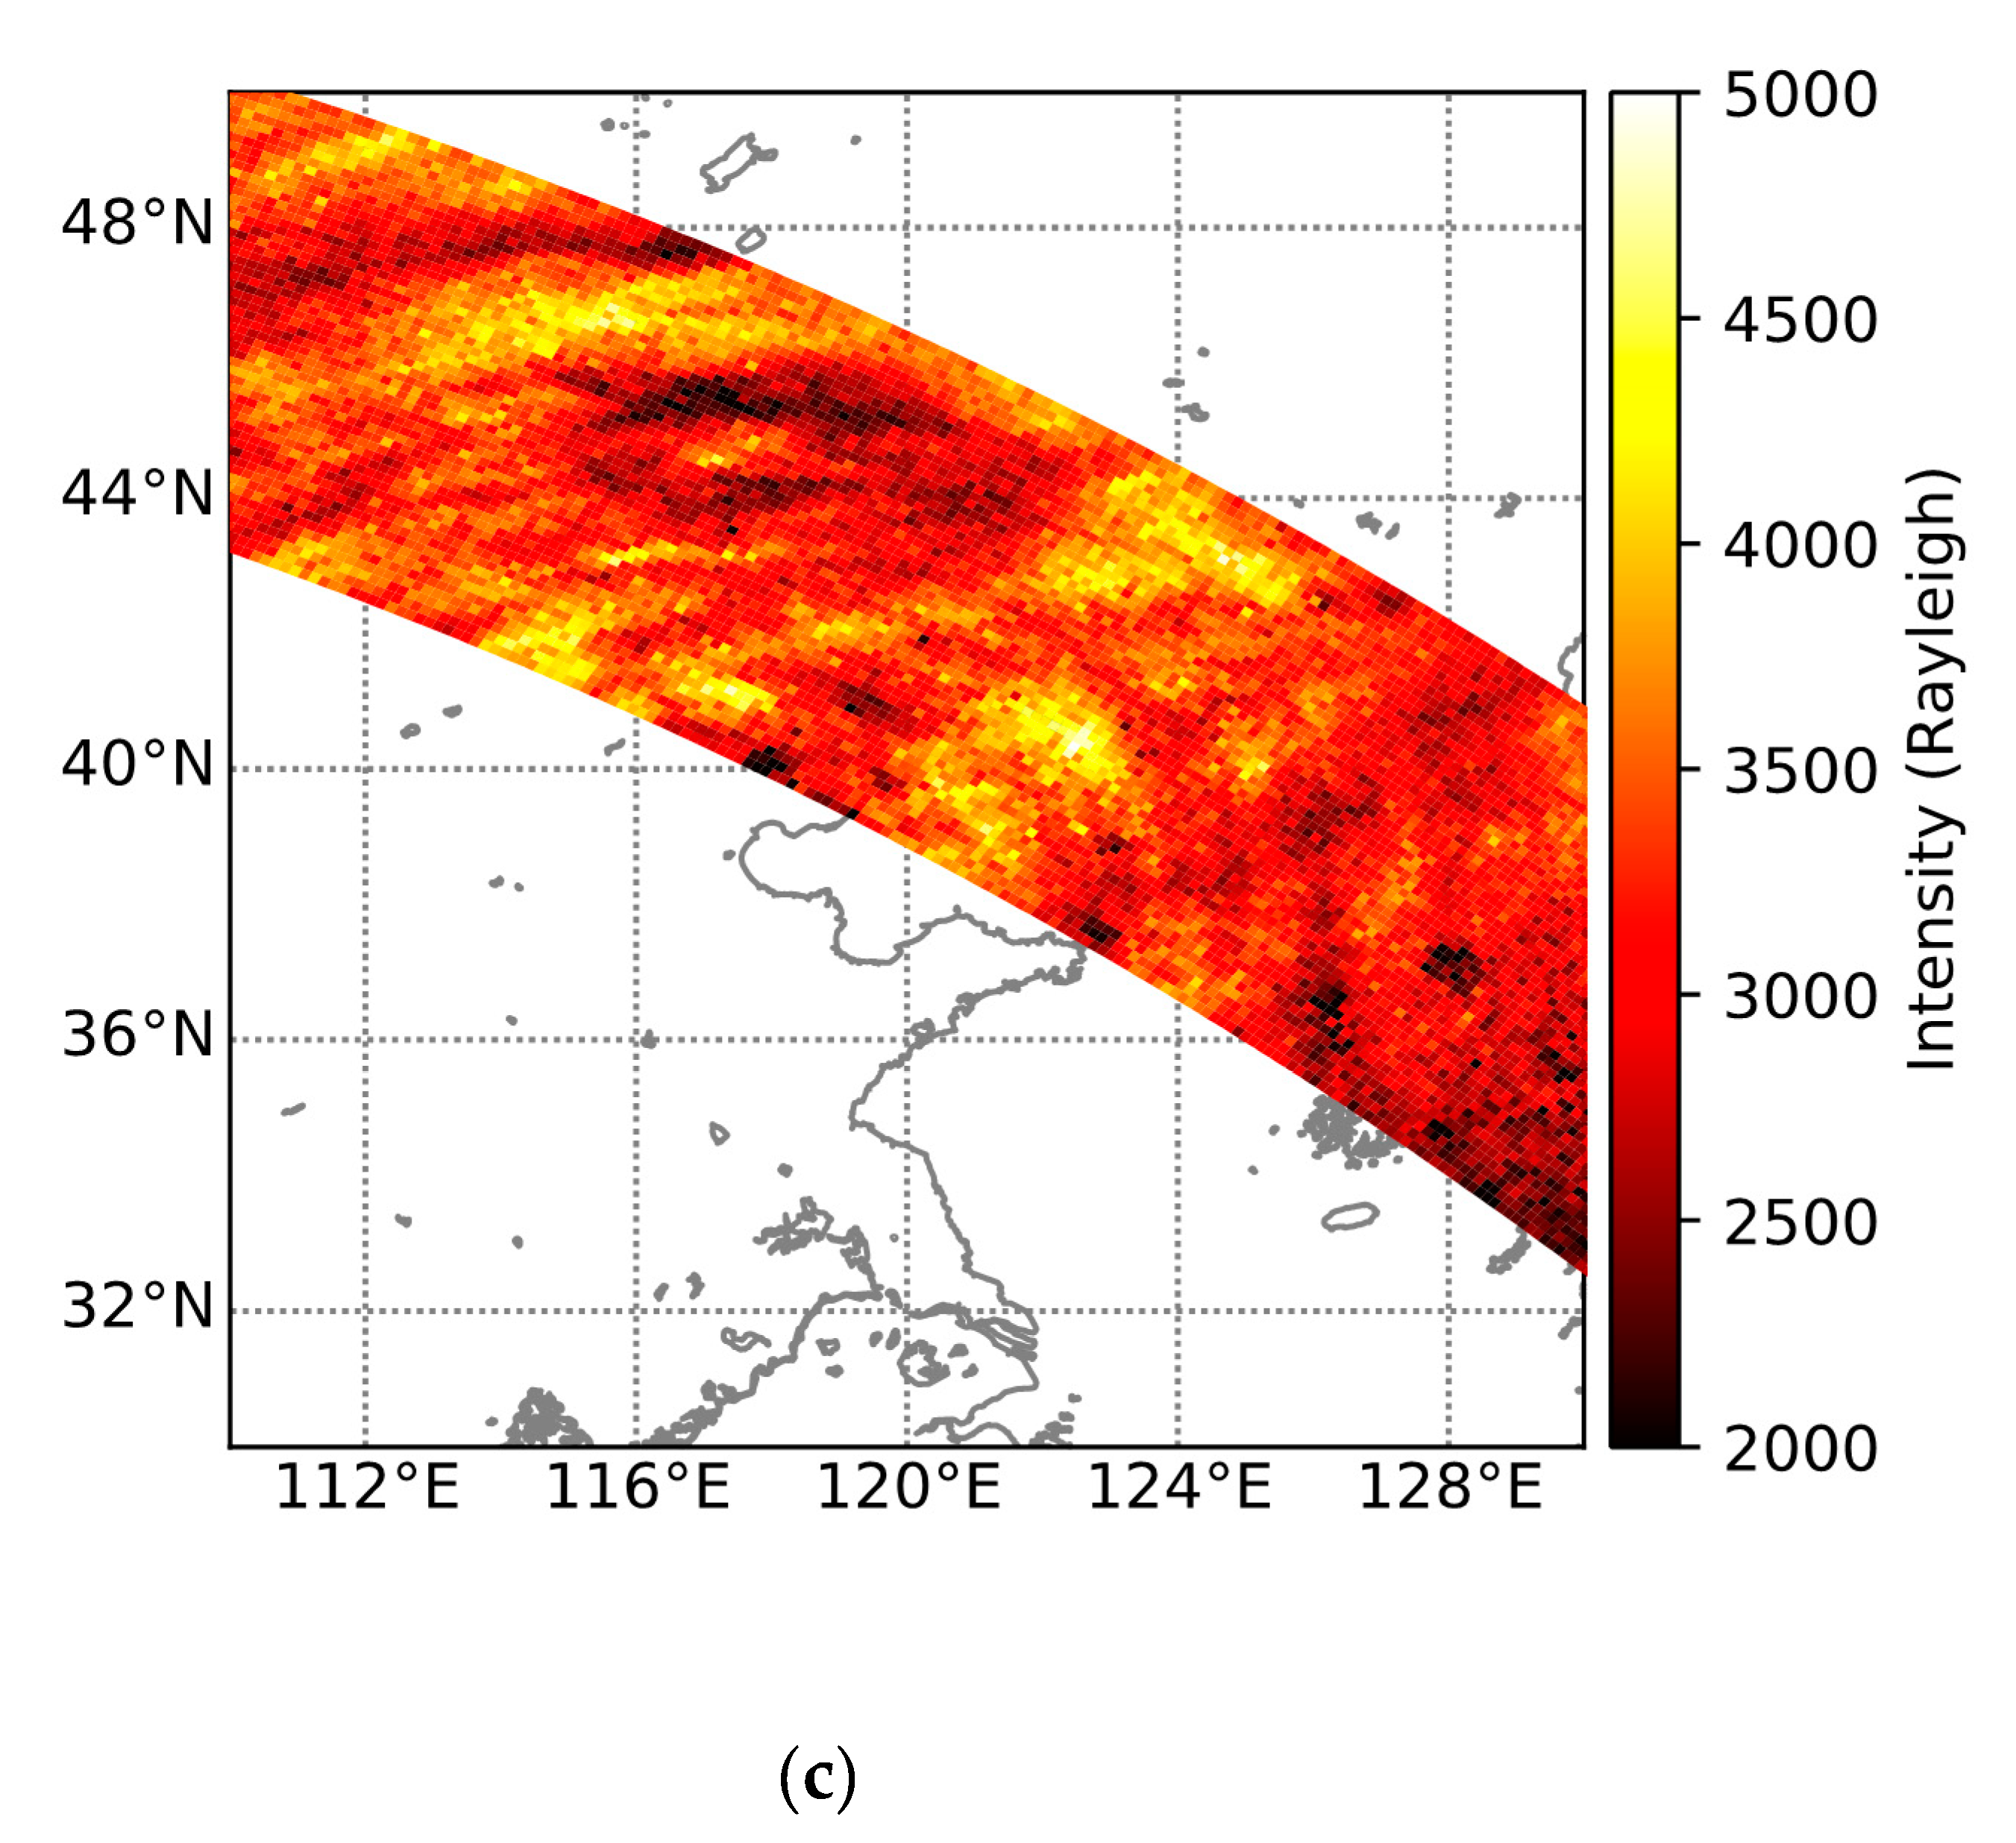
Figure 1c displays the corresponding VISI concentric AGWs for this same case, as observed in the O2 emission within the sensor’s forward view at ~1825 UTC; about one hour after the DNB observation shown in Figure 1. The backward VISI view (not shown) contains a similar AGW pattern. These AGWs were likely excited by the same storm system in China, as Xu et al. [40] suggested. Because of its coarser resolution, only coarser-scale AGWs (>50 km horizontal wavelength) can be seen. Here, the average wavelength, computed via the same procedure as in Figure 1b, was ~52 km. In contrast to the VIIRS/DNB, VISI AGW images appear cleaner, with little city light contamination, owing to the masking effect of strong tropospheric O2 absorption which suppresses upwelling light emissions from the surface.
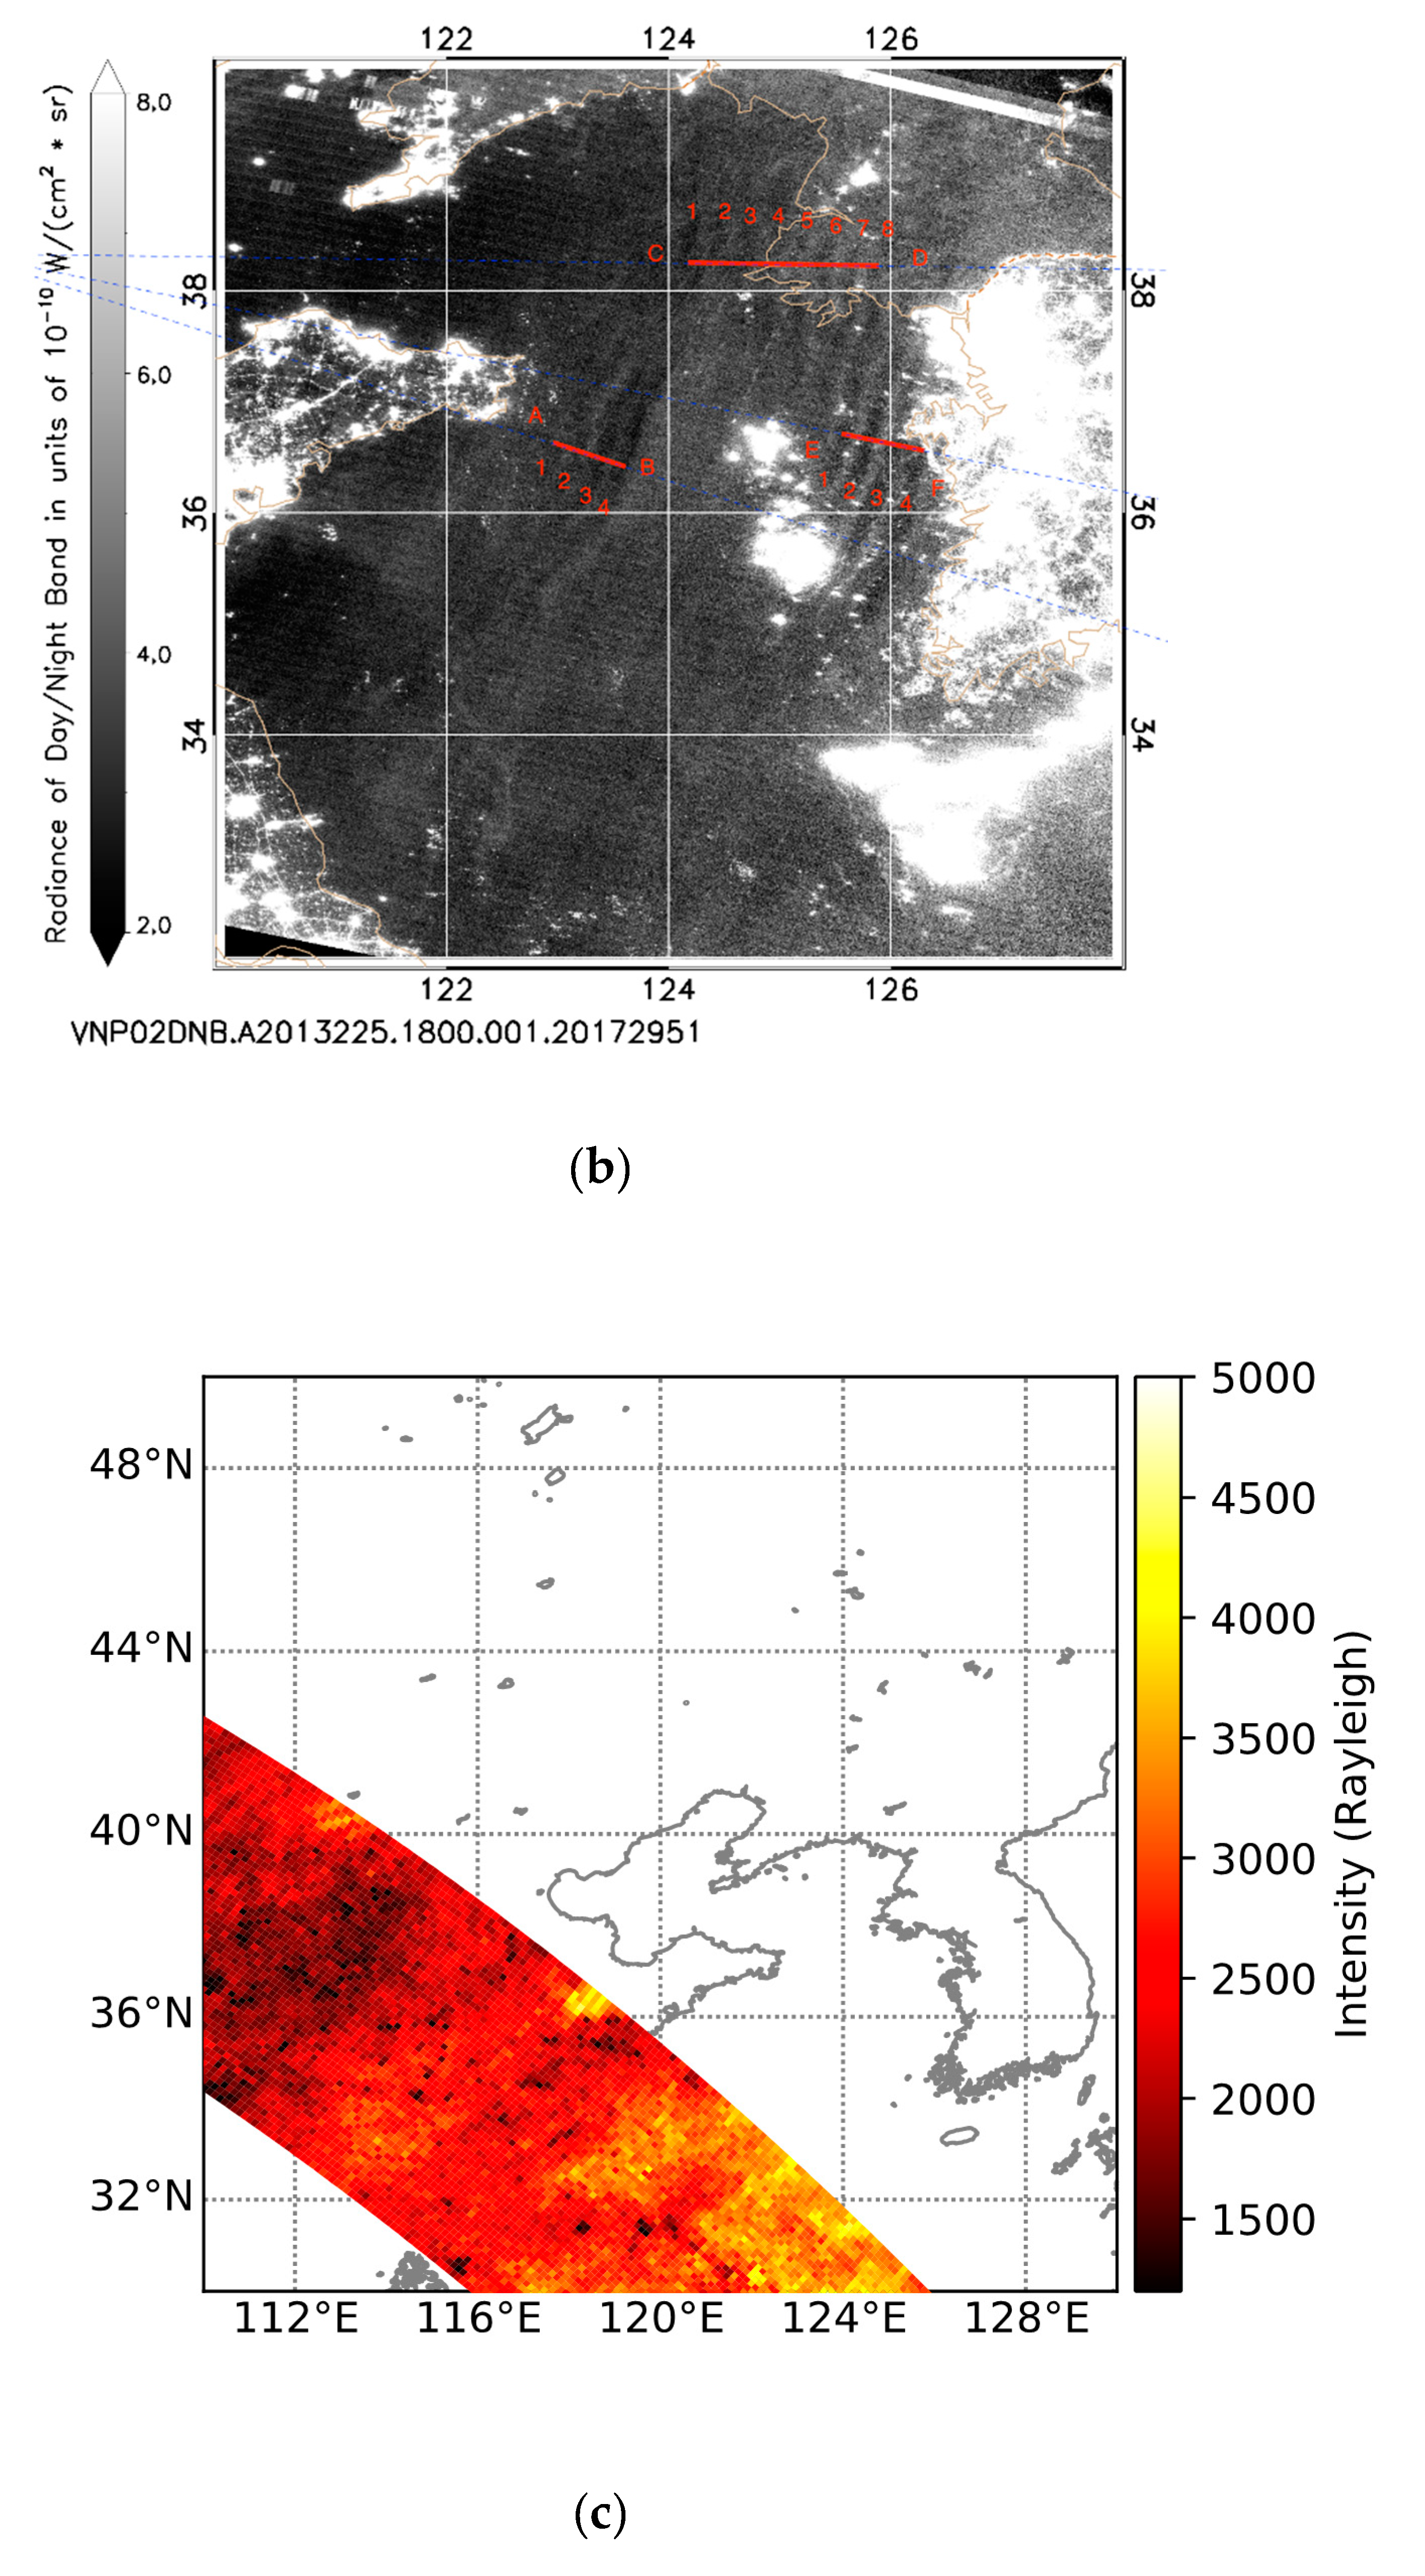
On the previous night (8 August 2013), similar concentric AGWs were observed in both VISI (1737 UTC) and DNB/VIIRS (17:56 UTC) imagery. Here, the VIIRS/DNB observed fine-scale AGWs of ~20 km wavelength over central China in Figure 2b. Coarse-scale concentric AGWs having wavelengths of 30–40 km are seen in the nearly simultaneous VISI O2 emission over a large area (1000 km × 1000 km) to the east of Northern China (Figure 2c). The concentric structures of the VISI-detected AGWs are not as pristine as those observed on August 9—implying superposition of multiple AGW structures.
Figure 3, Figure 4 and Figure 5 display additional examples of airglow concentric AGWs seen by both VIIRS/DNB and VISI on the nights of 12–14 August 2013. The capabilities of VIIRS/DNB and VISI observations of AGWs are well demonstrated. Although the observational times of VIIRS/DNB and VISI were often several hours apart, both sensors were able to observe the concentric AGWs because the convective sources were sustained over several hours [39].
Whereas the temporal mismatches (longer than minutes) between VISI and VIIRS/DNB preclude detailed one-on-one comparisons of the wave structures, bulk properties of wave structures are still possible. Table 2 gives the average measured horizontal wavelengths from VIIRS/DNB and VISI. Wave periods, horizontal velocities, vertical wavelengths and amplitudes cannot be measured due to the space/time mismatches and coarse temporal sampling limitations. A sensor on a geostationary orbit with fine enough spatial resolution can characterize wave periods and velocities. A temperature mapper such as the incoming Atmospheric Waves Experiment (AWE) can directly measure the wave amplitude in temperature. Multiple narrow band channels including Na, O2 and [O] with strong background suppression can potentially determine the vertical wavelengths based on the phase shift through different airglow layers.
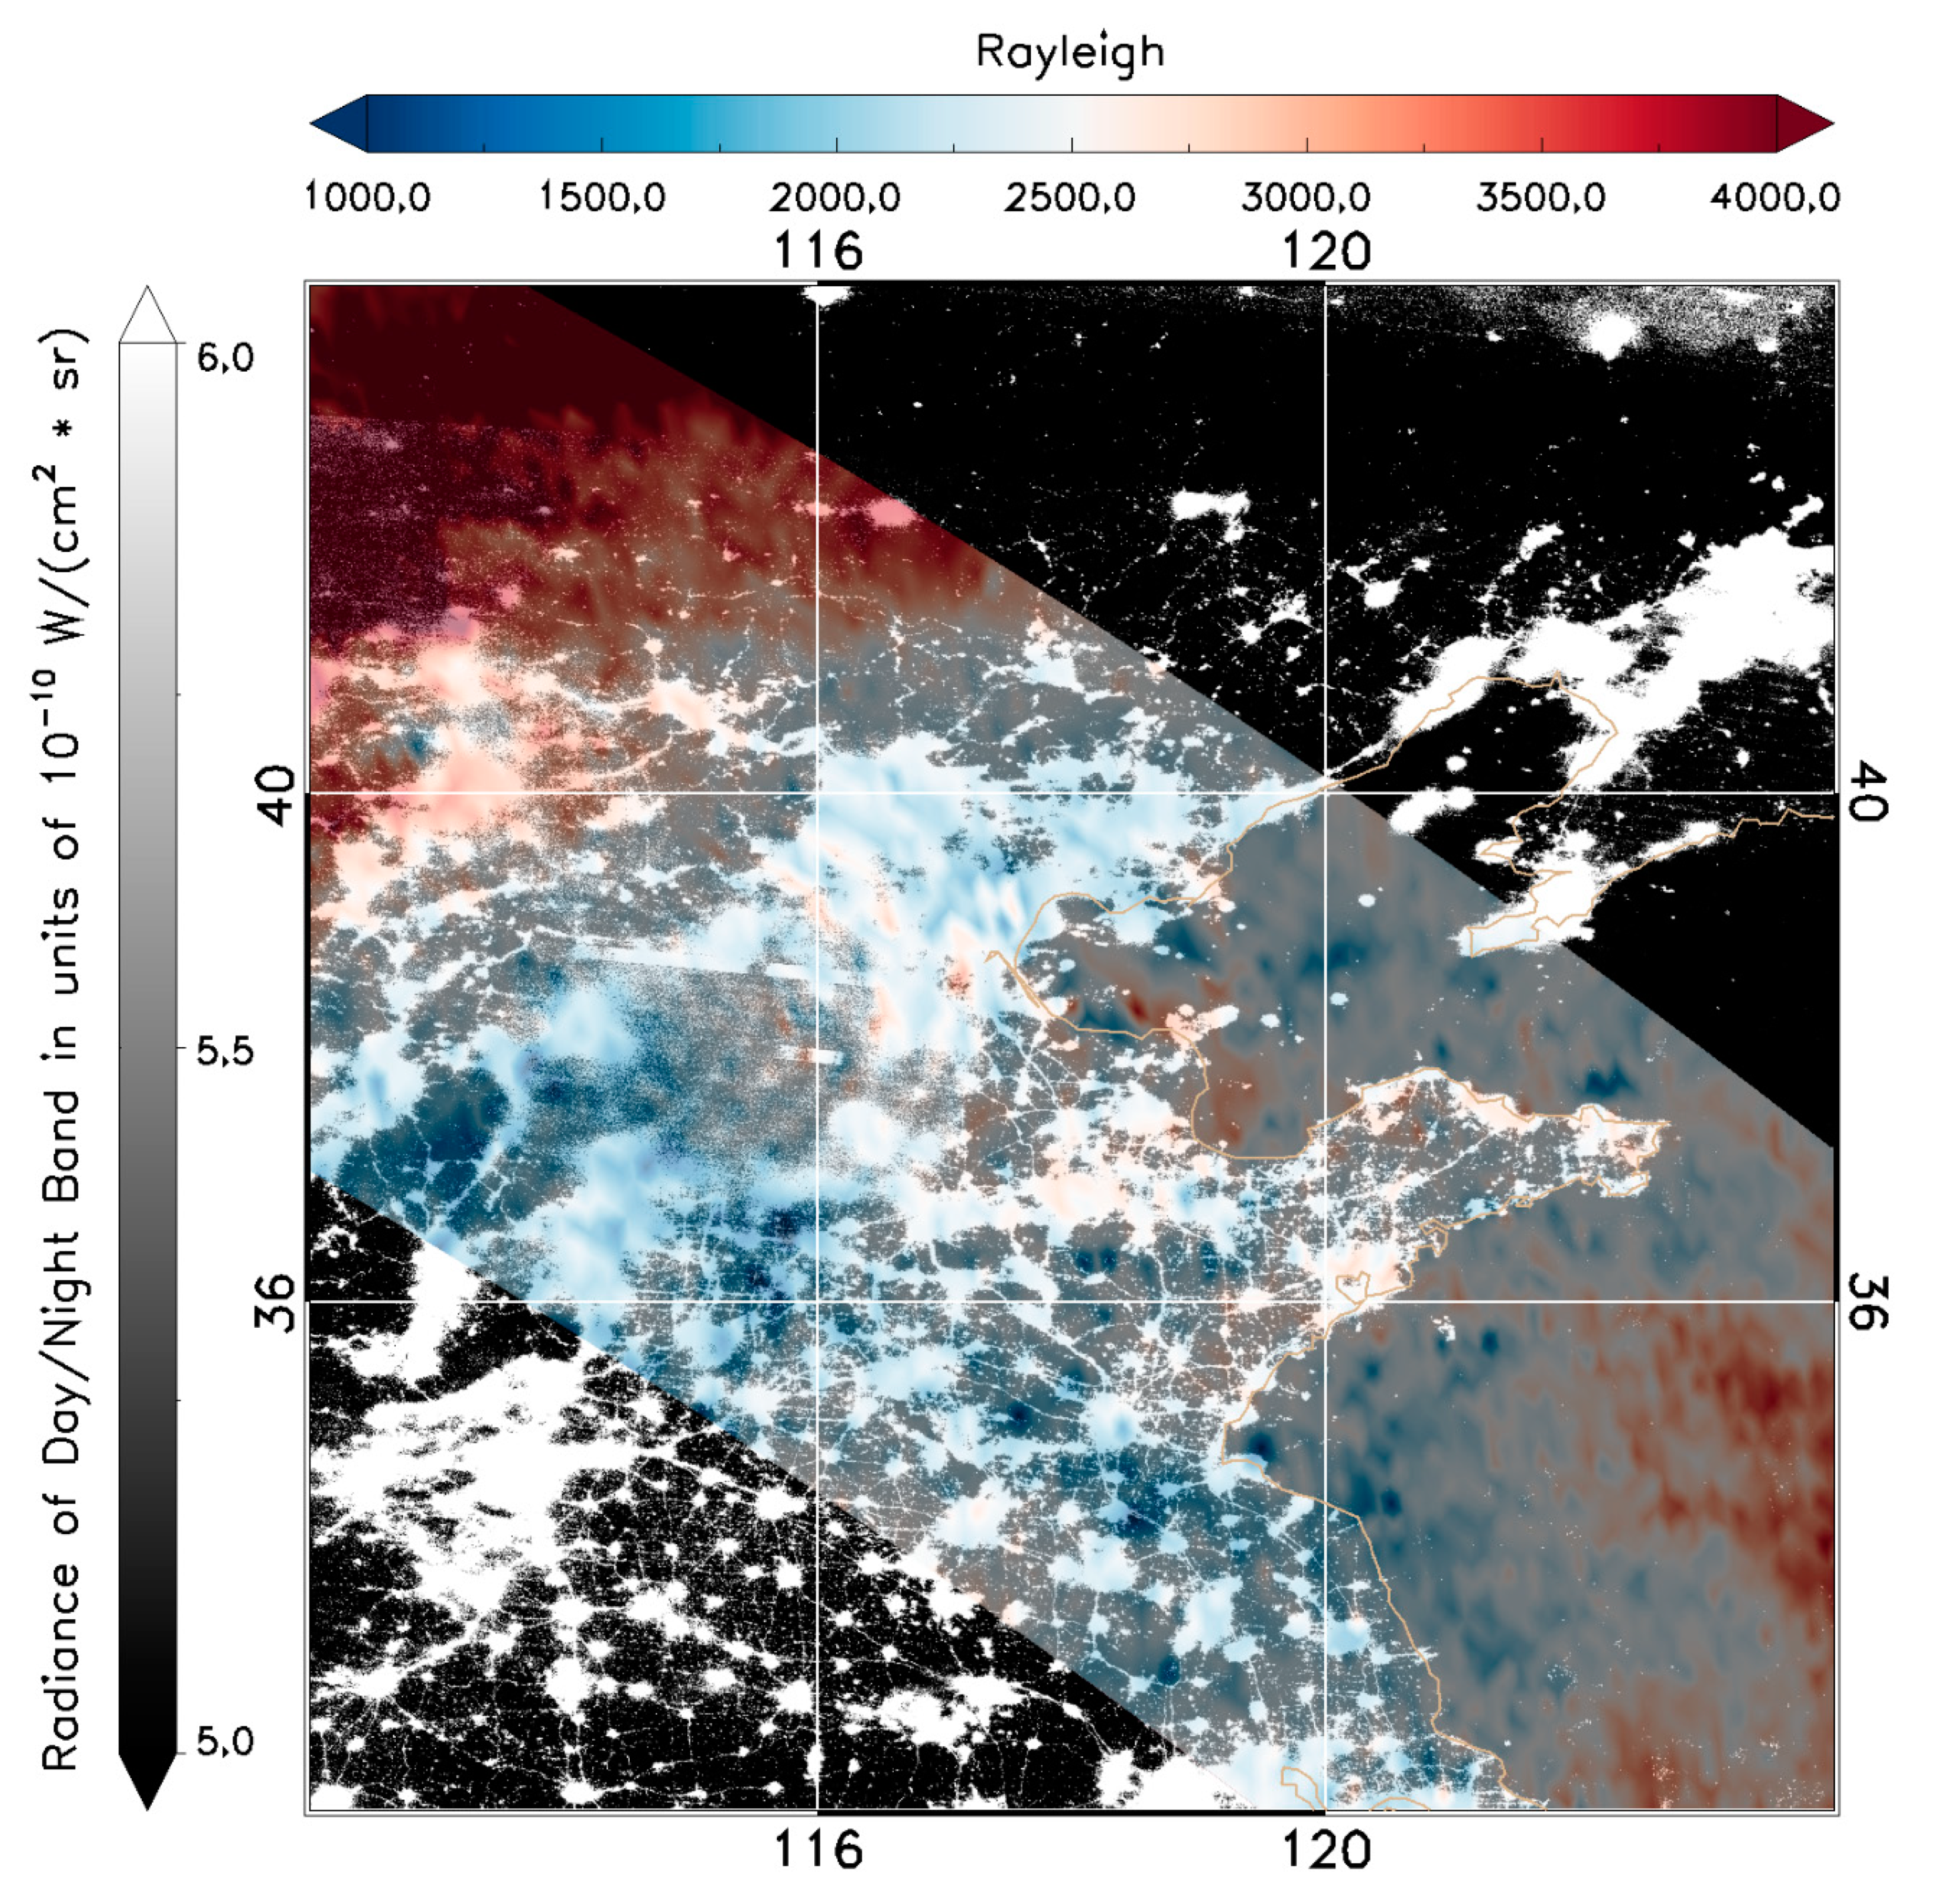
Figure 6 provides a direct comparison between VIIRS/DNB (black and white) and VISI (color) observations of AGWs on 14 August 2013. Although about displaced in time by ~1.5 h, the fine-scale AGW features (~21 km) discerned from VIIRS/DNB imagery in the inner circle align well with the coarser-scale (~53 km) VISI-detected AGWs in the outer rings. This observation is qualitatively consistent with the AGW dispersion relation, which states that horizontal wavelengths should increase with increasing radius from the source (here, defined as the distance between the convective source and the wave front) [38]. Assuming the wave center is near the coordinate of the convection (114 W, 39 N), the radii for the VIIRS and IMAP AGWs are approximately 100–150 km and 200–250 km, respectively. This difference in wavelengths is qualitatively consistent with Figure 5 of [38]. From Figure 6, we can also see that the IMAP/VISI field of view is much narrower than VIIRS.
Some general features gleaned from the comparisons between VIIRS/DNB and VISI AGW observations share commonalities: (1) the DNB can observe fine-scale AGWs with <20 km wavelength, while VISI can only observe coarser-scale AGWs (>50 km wavelength); (2) Because of surface light contamination in populated areas such as Northern China, VIIRS/DNB AGWs are only discernible over relatively laminar backgrounds such as clouds or the ocean. In contrast, the VISI O2 channel is much less contaminated by surface light conditions, thus offering higher quality AGW observations within its FOV over many developed land regions; (3) the spatial coverage of VISI and VIIRS/DNB are often displaced for a given scene, thus complementing each other in terms of AGW observations; (4) AGWs in the OH emission from DNB were ~10 km lower than those in the O2 emission from VISI, suggesting that all of these AGWs (>10 km vertical wavelengths) penetrated from 85 km to 95 km height without significant breaking, damping, or ducting.
The VIIRS/DNB’s high sensitivity to weak nocturnal light and ability to image at very high spatial resolution requires a broadband visible spectrum coverage. Restricting its bandpass to a narrow region about 762 nm (and thereby enabling more effective filtering of surface light contamination like VISI) would come at the trade of either lower sensitivity or coarser spatial resolution. Despite its superior surface light filtering, the next generation of VISI must improve its swath width and spatial resolution if it is to observe more AGWs across a wider area and at shorter wavelengths like the VIIRS/DNB. Because of its relatively narrow swath width of 600 km compared to the 3000 km wide VIIRS/DNB, the observational coverage of VISI does not provide imagery overlaps for consecutive passes. A swath width of least 2500 km would be required to avoid coverage gaps on the ISS platform.

4. Discussions and Conclusion

The objective of this paper was to provide a preliminary comparison between airglow-based AGW observations from two space-borne sensors of very different designs and capabilities, the VIIRS/DNB and the IMAP/VISI. Numerous concentric AGWs excited by thunderstorms over China in August 2013 provided an opportunity to conduct this first head-to-head comparison.
Whereas both the VIIRS/DNB and VISI demonstrate useful capabilities in terms of airglow AGW characterization, there are important differences between the two. The VISI O2 762 nm channel is free from the contaminative effects of city lights, while it is very difficult for the VIIRS/DNB to collect useful AGW observations over populated areas unless there are clouds that effectively block the upwelling city light emissions. Owing to the VIIRS/DNB’s higher spatial resolution and wider swath width, both small- and large-wavelength AGWs can be observed simultaneously. VISI can only observe AGWs with horizontal wavelengths longer than ~50 km due to its coarser resolution. In terms of temporal resolution, at the time of this writing both Suomi NPP and the more recently launched NOAA-20 (18 November 2017) satellite carry the DNB as part of a long-term operational program, ensuring that these observations will be available in a sustained way for years to come.
This work aims to inform planners on the design of future space-borne sensors to study AGWs detectable in airglow emissions. Wide field of view, fine horizontal resolution, sensitivity to narrow-band airglow emission lines, and minimized stray light contamination are highly desired properties. Among all nightglow emissions in the mesopause region (OH, OI, O2, Na), the O2 band at 762 nm is ideal for AGW studies as the strong absorption of O2 in the lower atmosphere filters out the contaminative background signals from most city lights and moonlight/airglow reflecting clouds. This filtering reduces ambiguity in identifying AGW features in airglow over most surface types, including population centers. The auroral oval in the polar region remains an outstanding challenge, as aurorae are bright with a broad spectrum and reside above the O2 absorption region. Here, additional information such as a narrowband multispectral low-light imager could help to distinguish aurora from airglow, and modulate processing in these regions accordingly.
The NOAA JPSS constellation and its VIIRS/DNB sensors will continue operations into the late 2030s. Another Japanese VISI-like observation with a wider FOV is now in the planning stages for deployment on ISS, while Near-Infrared Airglow Camera (NIRAC) by Aerospace Corporation is now flying on ISS. The idea of conducting simultaneous nadir overpasses, such that issues related to AGW evolution and parallax displacement are minimized, would be better for future head-to-head comparisons.

5. Declarations

Availability of Data and Material

The VIIRS Sensor Data Record data are distributed by the CIMSS Atmospheric Product and Evaluation and Test Elements (PEATE) and NOAA Comprehensive Large Array—data Stewardship System (CLASS). The ISS/IMAP data can be requested to the IMAP team. Any inquiries regarding IMAP/VISI data should be sent to Akinori Saito of Kyoto University ([email protected]) and Takeshi Sakanoi of Tohoku University ([email protected]). The ISS-IMAP/VISI data will be available on Data ARchives and Transmission System (DARTS) of ISAS/JAXA (https://urldefense.proofpoint.com/v2/url?u=https-3A__www.darts.isas.jaxa.jp_stp_imap_data.html&d=DwIFaQ&c=ZiMMLwcK1Y0gJjbWwMP8EkDRBmripxV4M6aASFu8qIg&r=gUIdXkch-OiKby9hoVw3MAJ0oPD__R7MyPiy3Lzo89M&m=qfK7RnR_cFepstC0tzOObNW78mLoN-iWVF-4B5B7AX8&s=jqSYcl-5I3wbBkI9r3BS9fDO64xXUhbHiNJ5HaW_nc4&e=).

Author Contributions

J.Y. and S.P. designed the study and wrote the manuscript with revisions from S.D.M. S.X. analyzed the DNB images. Y.H. analyzed the VISI data. S.D.M. and W.S. helped analyzing the DNB data. T.S. and A.S. managed and provided the VISI data. T.N. and P.R. helped with the gravity wave discussions.

Funding

This work was supported by the National Science Foundation AGS-1834222, AGS-1651394 and the NOAA JPSS Program Office.

Acknowledgments

JY acknowledges the JSPS short-term Fellowship and the host of National Institute of Polar Research. JY also thanks the discussions with Joan Alexander. We thank the NOAA Joint Polar Satellite System Cal/Val and Risk Reduction Program. We thank all the members of the ISS-IMAP mission. JY and PR were supported by NSF grant AGS-1651394. JY was supported by NSF AGS-1834222 and NASA 80NSSC19K0836.

Conflicts of Interest

The authors declare no conflict of interest.

References

  1. Holton, J.R. An Introduction to Dynamic Meteorology, 3rd ed.; Academic Press: San Diego, CA, USA, 1992; p. 511. [Google Scholar]
  2. Nappo, C. An Introduction to Atmospheric Gravity Waves; Academic Press: Cambridge, MA, USA, 2002. [Google Scholar]
  3. Fritts, D.C.; Alexander, M.J. Gravity wave dynamics and effects in the middle atmosphere. Rev. Geophys. 2003, 41, 1. [Google Scholar] [CrossRef]
  4. Lindzen, R.S. Turbulence and stress owing to gravity wave and tidal breakdown. J. Geophys. Res. 1981, 86, 9707–9714. [Google Scholar] [CrossRef] [Green Version]
  5. Holton, J.R. The Role of Gravity Wave Induced Drag and Diffusion in the Momentum Budget of the Mesosphere. J. Atmos. Sci. 1982, 39, 791–799. [Google Scholar] [CrossRef] [Green Version]
  6. Holton, J.R. The influence of gravity wave breaking on the general circulation of the middle atmosphere. J. Atmos. Sci. 1983, 40, 2497–2507. [Google Scholar] [CrossRef]
  7. Qian, L.; Burns, A.; Yue, J. Evidence of the lower thermospheric winter-to-summer circulation from SABER CO2 observation. Geophys. Res. Lett. 2017, 44, 10,100–10,107. [Google Scholar] [CrossRef]
  8. Qian, L.; Solomon, S.C.; Kane, T.J. Seasonal variation of thermospheric density and composition. J. Geophys. Res. 2009, 114, A01312. [Google Scholar] [CrossRef]
  9. Qian, L.; Burns, A.G.; Solomon, S.C.; Wang, W. Annual/semiannual variation of the ionosphere. Geophys. Res. Lett. 2013, 40, 1928–1933. [Google Scholar] [CrossRef]
  10. Hines, C.O. Internal gravity waves at ionospheric heights. Can. J. Phys. 1960, 38, 1441–1481. [Google Scholar] [CrossRef]
  11. Vadas, S.L.; Liu, H. The Generation of Large-Scale Gravity Waves and Neutral Winds in the Thermosphere From the Dissipation of Convectively-Generated Gravity Waves. J. Geophys. Res. 2009, 114, A10310. [Google Scholar] [CrossRef]
  12. Azeem, I.; Yue, J.; Hoffmann, L.; Miller, S.D.; Straka, W.C., III; Crowley, G. Multi-sensor profiling of a concentric gravity wave event propagating from the troposphere to the ionosphere. Geophys. Res. Lett. 2015, 24, 7874–7880. [Google Scholar] [CrossRef]
  13. Vadas, S.L.; Becker, E. Numerical modeling of the Excitation, propagation, and dissipation of primary and secondary gravity waves during wintertime at McMurdo Station in the Antarctic. J. Geophys. Res. Atmos. 2018, 123, 9326–9369. [Google Scholar] [CrossRef]
  14. Meinel, A.B. OH emission bands in the spectrum of the night sky. Astrophys. J. 1950, 111, 555. [Google Scholar] [CrossRef]
  15. Chamberlain, J.W. Physics of the Aurora and Airglow; Academic Press: New York, NY, USA, 1961; p. 704. [Google Scholar]
  16. Ingham, M.F. The light of the night sky and the interplanetary medium. Rep. Prog. Phys. 1971, 34, 875–912. [Google Scholar] [CrossRef]
  17. Peterson, A.W. Airglow events visible to the naked eye. Appl. Opt. 1979, 18, 3390. [Google Scholar] [CrossRef] [PubMed]
  18. Peterson, A.W.; Kieffaber, L.M. Infrared photography of OH airglow structures. Nature 1973, 244, 92. [Google Scholar] [CrossRef]
  19. Krassovsky, V.I.; Kuzmin, K.I.; Piterskaya, N.A.; Semenov, A.I.; Shagaev, M.V.; Shefov, N.N.; Torloshelidze, T.I. Results of some airglow observations of internal gravitational waves. Planet. Space Sci. 1975, 23, 896. [Google Scholar] [CrossRef]
  20. Krassovsky, V.I.; Shagaev, V. On the nature of internal gravity waves observed from hydroxyl emission. Planet. Space Sci. 1977, 25, 200. [Google Scholar] [CrossRef]
  21. Freund, J.T.; Jacka, F. Structure in the 557.7 nm (OI) airglow. J. Atmos. Terr. Phys. 1979, 41, 25. [Google Scholar] [CrossRef]
  22. Armstrong, E.B. The association of visible airglow features with a gravity wave. J. Atmos. Terr. Phys. 1982, 44, 325. [Google Scholar] [CrossRef]
  23. Gavrilov, N.M.; Shved, G.M. Study of internal gravity waves in the lower thermosphere form observations of the nocturnal sky airglow [OI] 5577 A in Ashhabbad. Ann. Geophys. 1982, 38, 789. [Google Scholar]
  24. Hapgood, M.A.; Taylor, M.J. Analysis of airglow image data. Ann. Geophys. 1982, 38, 805. [Google Scholar]
  25. Taylor, M.J.; Hapgood, M.A.; Rothwell, P. Observations of gravity wave propagation in the OI (557.7 nm), Na (589.2 nm) and the near infra-red OH nightglow emissions. Planet Space Sci. 1987, 35, 413. [Google Scholar] [CrossRef]
  26. Wu, Q.; Killeen, T.L. Seasonal dependence of mesospheric gravity waves (<100 km) at Peach Mountain Observatory, Michigan. Geophys. Res. Lett. 1996, 23, 2211–2214. [Google Scholar] [CrossRef]
  27. Nakamura, T.; Higashikawa, A.; Tsuda, T.; Matsushita, Y. Seasonal variations of gravity wave structures in OH airglow with a CCD imager at Shigaraki. Earth Planets Space 1999, 51, 897–906. [Google Scholar] [CrossRef] [Green Version]
  28. Hecht, J.H.; Walterscheid, R.L.; Hickey, M.P.; Franke, S.J. Climatology and modeling of quasi-monochromatic atmospheric gravity waves observed over Urbana, Illinois. J. Geophys. Res. 2001, 106, 5181–5195. [Google Scholar] [CrossRef]
  29. Ejiri, M.K.; Shiokawa, K.; Ogawa, T.; Igarashi, K.; Nakamura, T.; Tsuda, T. Statistical study of short-period gravity waves in OH and OI nightglow images at two separated sites. J. Geophys. Res. 2003, 108, 4679. [Google Scholar] [CrossRef]
  30. Suzuki, S.; Shiokawa, K.; Hosokawa, K.; Nakamura, K.; Hocking, W.K. Statistical characteristics of polar cap mesospheric gravity waves observed by an all-sky airglow imager at Resolute Bay. Can. J. Geophys. Res. 2009, 114, A01311. [Google Scholar] [CrossRef]
  31. Nielsen, K.; Taylor, M.J.; Hibbins, R.E.; Jarvis, M.J. Climatology of short-period mesospheric gravity waves over Halley, Antarctica (76° S, 27° W). J. Atmos. Sol. Terr. Phys. 2009, 71, 991–1000. [Google Scholar] [CrossRef]
  32. Yue, J.; Nakamura, T.; She, C.-Y.; Weber, M.; Lyons, W.; Li, T. Seasonal and local time variability of ripples from airglow imager observations in US and Japan. Ann. Geophys. 2010, 28, 1401–1408. [Google Scholar] [CrossRef] [Green Version]
  33. Narayanan, V.L.; Gurubaran, S. Statistical characteristics of high frequency gravity waves observed by OH airglow imaging from Tirunelveli (8.7° N). J. Atmos. Sol. Terr. Phys. 2013, 92, 43–50. [Google Scholar] [CrossRef]
  34. Li, Q.; Xu, J.; Liu, X.; Yuan, W.; Chen, J. Characteristics of mesospheric gravity waves over the southeastern Tibetan Plateau region. J. Geophys. Res. Space Phys. 2016, 121, 9204–9221. [Google Scholar] [CrossRef]
  35. Taylor, M.J.; Hapgood, M.A. Identification of a thunderstorm as a source of short period gravity waves in the upper atmospheric night-glow emissions. Planet. Space Sci. 1988, 36, 975–985. [Google Scholar] [CrossRef]
  36. Sentman, D.D.; Wescott, E.M.; Picard, R.H.; Winick, J.R.; Nielsen, H.C.S.; Dewan, E.M.; Moudry, D.R.; Sabbas, F.T.S.; Heavner, M.J.; Morrill, J. Simultaneous observations of mesospheric gravity waves and sprites generated by a midwesterm thunderstorm. J. Atmos. Terr. Phys. 2003, 65, 537–550. [Google Scholar] [CrossRef]
  37. Suzuki, S.; Shiokawa, K.; Otsuka, Y.; Ogawa, T.; Nakamura, K.; Nakamura, T. A concentric gravity wave structure in the mesospheric airglow images. J. Geophys. Res. 2007, 112, D02102. [Google Scholar] [CrossRef]
  38. Yue, J.; Vadas, S.L.; She, C.-Y.; Nakamura, T.; Reising, S.C.; Liu, H.-L.; Stamus, P.; Krueger, D.A.; Lyons, W.; Li, T. Concentric gravity waves in the mesosphere generated by deep convective plumes in the lower atmosphere near Fort Collins, Colorado. J. Geophys. Res. 2009, 114, D06104. [Google Scholar] [CrossRef]
  39. Vadas, S.; Yue, J.; Nakamura, T. Mesospheric concentric gravity waves generated by multiple convection storms over the North America Great Plain. J. Geophys. Res. Atmos. 2012, 117, D07113. [Google Scholar] [CrossRef]
  40. Xu, J.; Li, Q.; Yue, J.; Hoffmann, L.; Straka, W.C., III; Wang, C.; Liu, M.; Yuan, W.; Han, S.; Miller, S.D.; et al. Concentric gravity waves over northern China observed by an airglow imager network and satellites. J. Geophys. Res. Atmos. 2015, 120, 11058–11078. [Google Scholar] [CrossRef]
  41. Smith, S.; Baumgardner, J.; Mendillo, M. Evidence of mesospheric gravity–waves generated by orographic forcing in the troposphere. Geophys. Res. Lett. 2009, 36, 8. [Google Scholar] [CrossRef]
  42. Suzuki, S.; Vadas, S.L.; Shiokawa, K.; Otsuka, Y.; Kawamura, S.; Murayama, Y. Typhoon-induced concentric airglow structures in the mesopause region. Geophys. Res. Lett. 2013, 40, 5983–5987. [Google Scholar] [CrossRef]
  43. Miller, S.D.; Straka, W., III; Mills, S.P.; Elvidge, C.D.; Lee, T.F.; Solbrig, J.; Walther, A.; Heidinger, A.K.; Weiss, S.C. Illuminating the capabilities of the Suomi NPP VIIRS Day/Night Band. Remote Sens. 2013, 5, 6717–6766. [Google Scholar] [CrossRef]
  44. Miller, S.D.; Mills, S.P.; Elvidge, C.D.; Lindsey, D.T.; Lee, T.F.; Hawkins, J.D. Suomi satellite brings to light a unique frontier of nighttime environmental sensing capabilities. Proc. Nat. Acad. Sci. USA 2012, 109, 15706–15711. [Google Scholar] [CrossRef] [PubMed] [Green Version]
  45. Miller, S.D.; Straka, W.C.; Yue, J.; Smith, S.M.; Alexander, M.J.; Hoffmann, L.; Setvak, M.; Partain, P.T. Upper atmospheric gravity wave details revealed in nightglow satellite imagery. Proc. Nat. Acad. Sci. USA 2015, 112, E6728–E6735. [Google Scholar] [CrossRef] [PubMed] [Green Version]
  46. Yue, J.; Miller, S.; Hoffmann, L.; Straka, W.C., III. Stratospheric and mesospheric concentric gravity waves over tropical cyclone Mahasen: Joint AIRS and VIIRS satellite observations. J. Atmos. Solar Terra. Phys. 2014, 119, 83–90. [Google Scholar] [CrossRef]
  47. Lai, C.; Yue, J.; Xu, J.; Straka, W.; Miller, S., III; Liu, X. Suomi NPP VIIRS/DNB imagery of nightglow gravity waves from various sources over China. Adv. Space Res. 2017, 59, 1951–1961. [Google Scholar] [CrossRef]
  48. Miller, S.D.; Straka, W., III; Yue, J.; Seaman, C.; Xu, S.; Elvidge, C.; Hoffmann, L.; Azeem, I. The Dark Side of Hurricane Matthew—Unique Perspectives from the Day/Night Band. Bull. Am. Meteorol. Soc. 2018, 99, 2561–2574. [Google Scholar] [CrossRef]
  49. Xu, S.; Yue, J.; Xue, X.; Vadas, S.; Miller, S.; Azeem, I.; Straka, W.; Hoffmann, L.; Zhang, S. Dynamical coupling between Hurricane Matthew and the Middle to Upper Atmosphere via gravity waves. J. Geophys. Res. Space 2019, 124. [Google Scholar] [CrossRef]
  50. Su, Y.; Yue, J.; Liu, X.; Miller, S.D.; Straka, W.C.; Smith, S.; Guo, D.; Guo, S. Mesospheric bore observations using Suomi NPP VIIRS DNB during 2013–2017. Remote Sens. 2018, 10, 1935. [Google Scholar] [CrossRef]
  51. Li, Q.; Xu, J.; Yue, J.; Liu, X.; Yuan, W. Evolution of a mesospheric bore in a duct observed by ground-based double-layer imagers and satellite observations over the Tibetan Plateau Region. J. Geophys. Res. Space 2019, 124, 1377–1388. [Google Scholar] [CrossRef]
  52. Sakanoi, T.; Akiya, Y.; Yamazaki, A.; Otsuka, Y.; Saito, A.; Yoshikawa, I. Imaging observation of the Earth’s mesosphere, thermosphere and ionosphere by VISI of ISS-IMAP on the international space station. IEEJ Trans. Fundam. Mat. 2011, 131, 983–988. [Google Scholar] [CrossRef]
  53. Akiya, Y.; Saito, A.; Sakanoi, T.; Hozumi, Y.; Yamazaki, A.; Otsuka, Y.; Nishioka, M.; Tsugawa, T. First spaceborne observation of the entire concentric airglow structure caused by tropospheric disturbance. Geophys. Res. Lett. 2014, 41, 6943–6948. [Google Scholar] [CrossRef] [Green Version]
  54. Perwitasari, S.; Sakanoi, T.; Yamazaki, A.; Otsuka, Y.; Hozumi, Y.; Akiya, Y.; Saito, A.; Shiokawa, K.; Kawamura, S. Coordinated airglow observations between IMAP/VISI and a ground-based all-sky imager on concentric gravity wave in the mesopause. J. Geophys. Res. Space Phys. 2015, 120, 9706–9721. [Google Scholar] [CrossRef]
  55. Perwitasari, S.; Sakanoi, T.; Nakamura, T.; Ejiri, M.K.; Tsutsumi, M.; Tomikawa, Y.; Otsuka, Y.; Yamazaki, A.; Saito, A. Three years of concentric gravity wave variability in the mesopause as observed by IMAP/VISI. Geophys. Res. Lett. 2016, 43, 11–528. [Google Scholar] [CrossRef]
  56. Hozumi, Y.; Saito, A.; Sakanoi, T.; Yamazaki, A.; Hosokawa, K. Mesospheric bores at southern midlatitudes observed by ISS-IMAP/VISI: A first report of an undulating wave front. Atmos. Chem. Phys. 2018, 18, 16399–16407. [Google Scholar] [CrossRef]
  57. Hozumi, Y.; Saito, A.; Sakanoi, T.; Yamazaki, A.; Hosokawa, K.; Nakamura, T. Geographical and seasonal variability of mesospheric bores observed from the International Space Station. J. Geophys. Res. Space Phys. 2019, 124, 3775–3785. [Google Scholar] [CrossRef]
  58. Alexander, M.J.; Holton, J.R.; Durran, D.R. The gravity wave response above deep convection in a squall line simulation. J. Atmos. Sci. 1995, 52, 2212–2226. [Google Scholar] [CrossRef]
  59. Bankert, R.L.; Solbrig, J.E.; Lee, T.F.; Miller, S.D. Automated lightning flash detection in nighttime visible satellite data. Weather Forecast. 2011, 26, 399–408. [Google Scholar] [CrossRef]
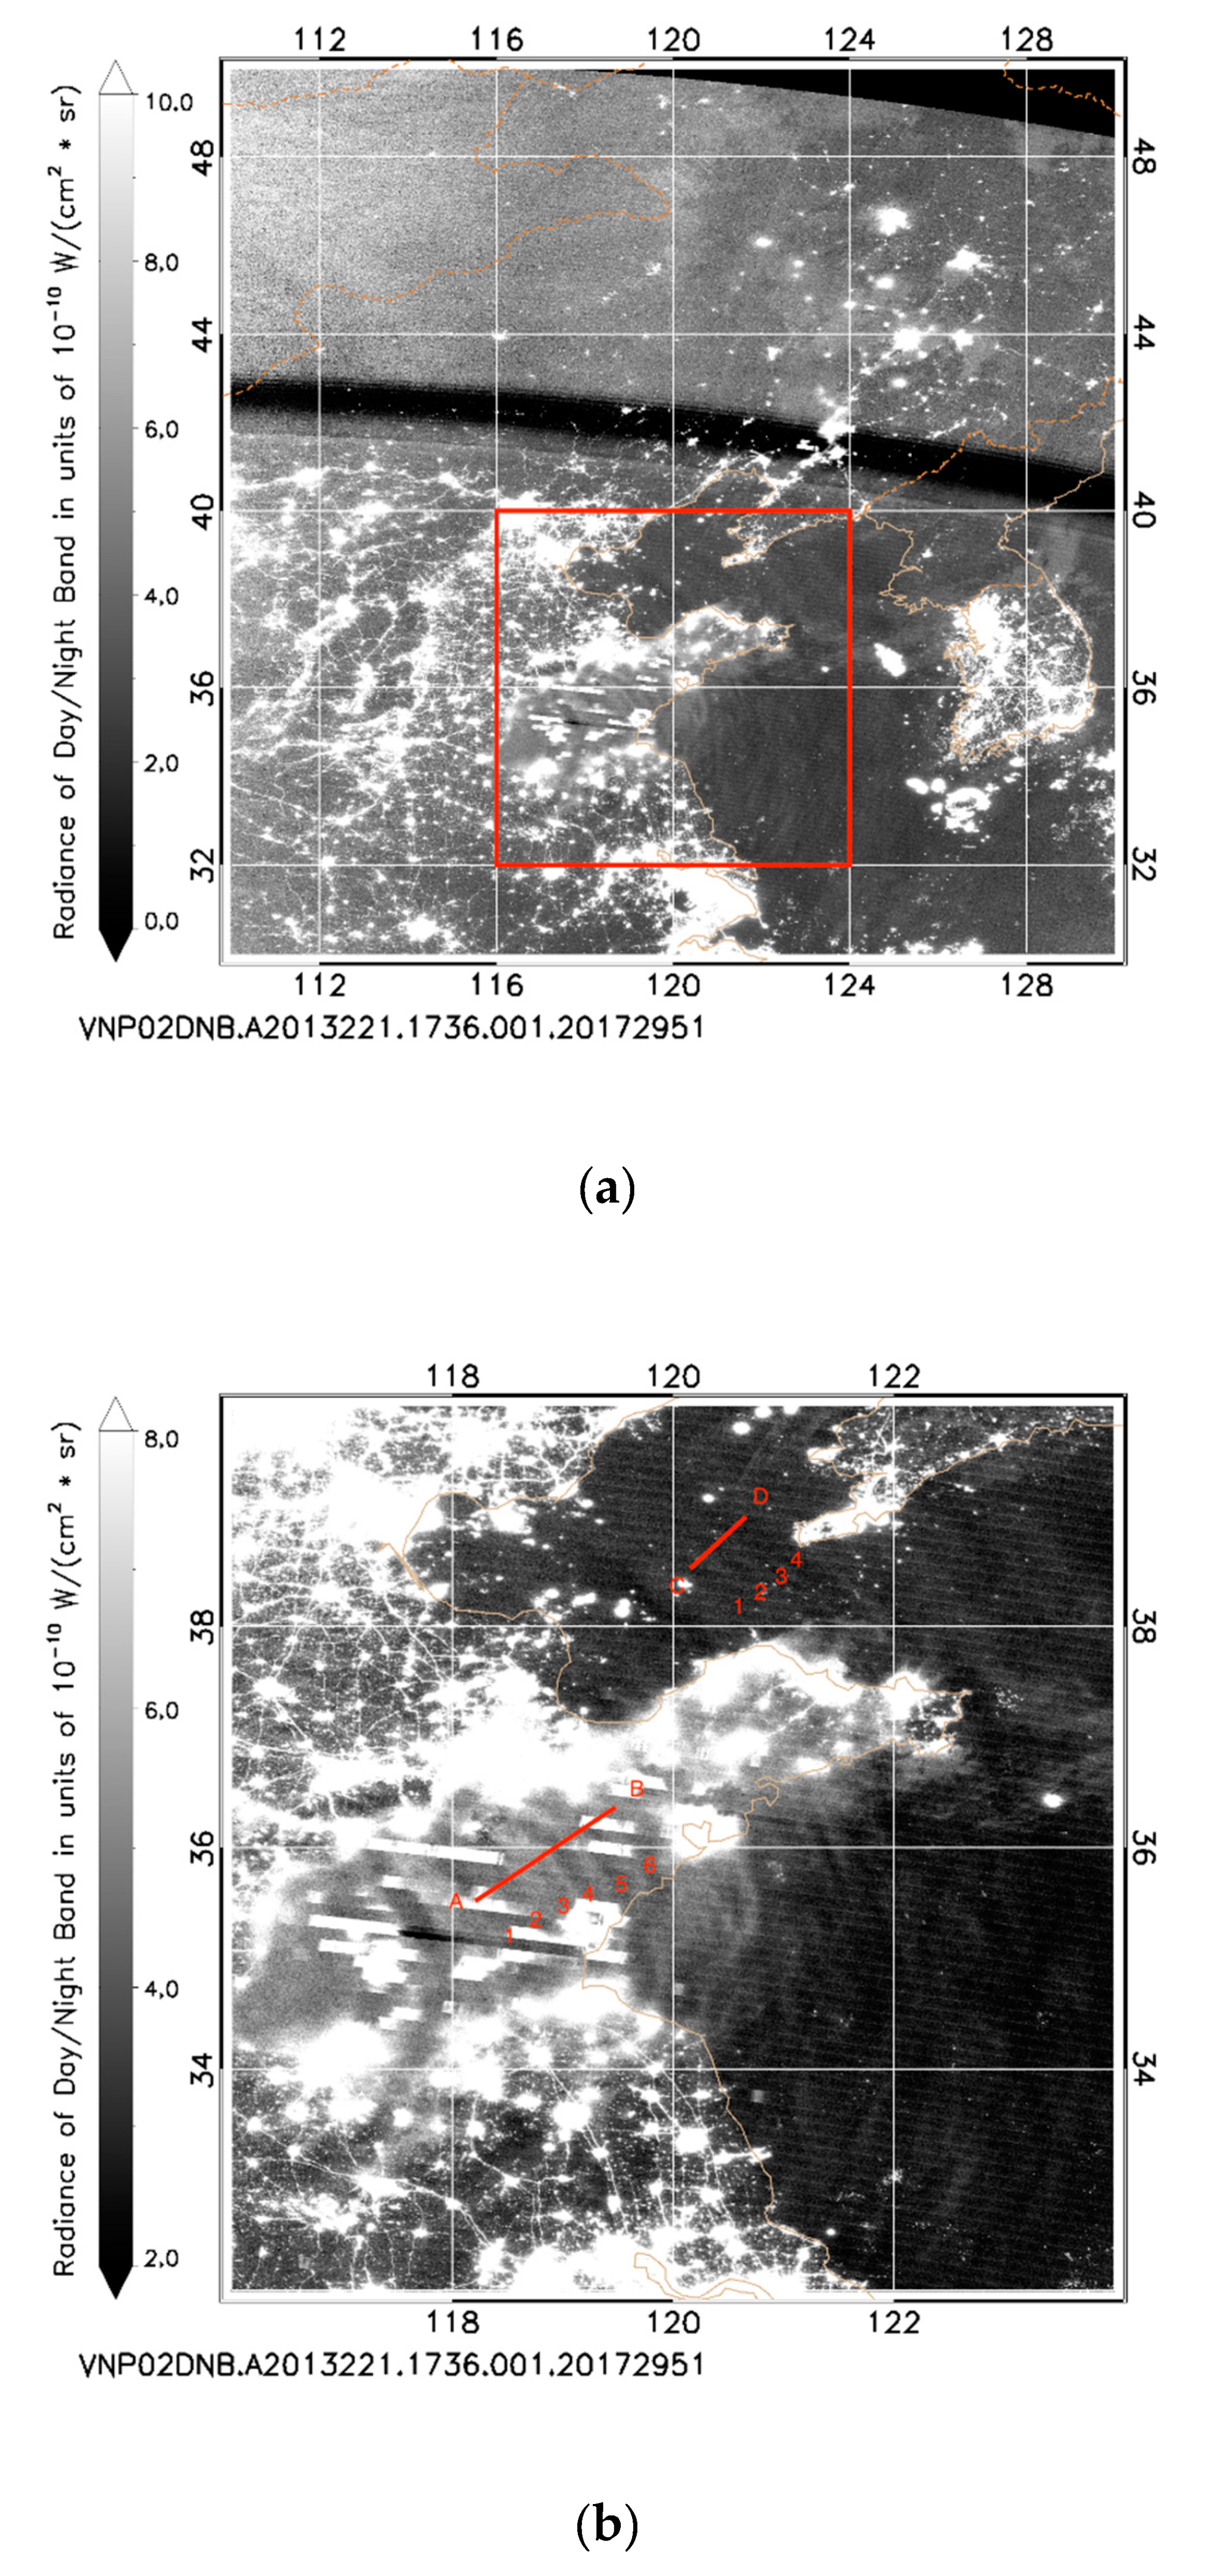
Figure 1. (a) The DNB image around 17:37 UTC on 9 August 2013 and (b) the enlarged atmospheric gravitaty wave (AGW) image over ShanDong Peninsula, China. (c) VISI AGWs in the O2 762 nm emission (forward view) around 18:25 UTC on 9 August 2013 over China. The map sizes of 1a and 1c are identical. The red box in 1a indicates the geographic range of 1b.
Atmosphere 10 00650 g001aAtmosphere 10 00650 g001b
Figure 2. Similar to Figure 1, collected by VIIRS/DNB at ~17:56 UTC, and by VISI at ~17:37 UTC on 8 August 2013.
Atmosphere 10 00650 g002aAtmosphere 10 00650 g002b
Figure 3. Similar to Figure 1, collected by VIIRS/DNB at ~19:19 UTC, and collected by VISI at ~15:56 UT on 12 August 2013.
Atmosphere 10 00650 g003aAtmosphere 10 00650 g003b
Figure 4. Similar to Figure 1, collected by VIIRS/DNB at ~18:06 UT, and by VISI at ~18:14 UT on 13 August 2013. Faint AGWs are at the upper left corner of the orbit in (c).
Atmosphere 10 00650 g004aAtmosphere 10 00650 g004b
Figure 5. Similar to Figure 1, collected by VIIRS/DNB at ~14:17 UT, and by VISI at ~15:54 UT on 14 August 2013.
Atmosphere 10 00650 g005aAtmosphere 10 00650 g005b
Figure 6. Overlapped IMAP (colored) and VIIRS (black and white) images on 14 August 2013.
Atmosphere 10 00650 g006
Table 1. Specifications of Visible and near-Infrared Spectral Imager (VISI) and the Visible/Infrared Imaging Radiometer Suite (VIIRS) day–night band (DNB).
TechniqueDatesSpectrumHorizontal ResolutionSwath WidthLatitude Range
VISIImaging spectrograph9/2012–8/2015630–762 nm14–16 km600 km54° S–54° N
VIIRS/DNBRadiometer11/2011–present505–890 nm0.75 km3000 km90° S–90° N
Table 2. Horizontal wavelengths of concentric AGWs in August 2013 over Eastern Asia.
8 August 20139 August 201312 August 201313 August 201314 August 2013
VISI40 km52 km68 km47 km53 km
DNB20 km22–30 km33 km22 km21 km