Article

Application of the Passive Sampler Developed for Atmospheric Mercury and Its Limitation

1
Department of Environmental Science, Kangwon National University, Chuncheon, Gangwon-do 24341, Korea
2
Urban Forests Research Center, Forest Conservation Department, National Institute for Forest Science, Seoul 02455, Korea
3
Chemicals Research Division, National Institute of Environmental Research, Incheon 22689, Korea
*
Author to whom correspondence should be addressed.
Atmosphere 2019, 10(11), 678; https://doi.org/10.3390/atmos10110678
Submission received: 14 October 2019 / Revised: 29 October 2019 / Accepted: 31 October 2019 / Published: 5 November 2019
(This article belongs to the Special Issue Atmospheric Mercury in Asia)

Abstract

:
In this study, a passive sampler for gaseous elemental mercury (GEM) was developed and applied to field monitoring. Three Radiello® diffusive bodies with gold-coated beads as Hg adsorbent were installed in an acrylic external shield. Hg uptake mass linearly increased as the deployment time increased until 8 weeks with an average gaseous Hg concentration of 2 ng m−3. The average of the experimental sampling rate (SR) was 0.083 m3 day−1 and showed a good correlation with theoretical SRs, indicating that a major adsorption mechanism was molecular diffusion. Nonetheless, the experimental SR was approximately 33% lower than the modeled SR, which could be associated with inefficient uptake of GEM in the sampler or uncertainty in constraining model parameters. It was shown that the experimental SR was statistically affected by temperature and wind speed but the calibration equation for the SR by meteorological variables should be obtained with a wider range of variables in further investigation. When the uptake rates were compared to the active Hg measurements, the correlation was not significant because the passive sampler was not sufficiently adept at detecting a small difference in the GEM concentration of from 1.8 to 2.0 ng m−3. However, the results for spatial Hg concentrations measured near cement plants in Korea suggest a possible application in field monitoring. Future research is needed to fully employ the developed passive sampler in quantitative assessment of Hg concentrations.

1. Introduction

Mercury (Hg) is the only metal that can exist as a gaseous phase in environmental compartments, resulting in dynamic circulation between compartments after emission. Because Hg pollution is a global problem, the Minamata Convention on Mercury, a multilateral environmental agreement, was entered into force in 2017 to address specific human activities contributing to widespread mercury pollution and aid in reducing global Hg pollution. The Convention includes provisions for technical assistance, information exchange, public awareness, and research and monitoring as well as for phasing-out Hg use in products. As the ninth greatest Hg-emitting country in the world, South Korea is obligated to monitor Hg levels in the environment.
Atmospheric Hg mostly exists in three major inorganic forms: gaseous elemental mercury (GEM), gaseous oxidized mercury (GOM), and particulate bound mercury (PBM). GEM, whose atmospheric residence time is approximately 0.5 to 1 yr [1], typically contributes greater than 90% of the total Hg in ambient air and can also be considered as a transboundary pollutant transporting over a long-range. However, though the concentrations of GOM and PBM are much lower than GEM, their effect on dry and wet deposition is significant because of high solubility, high deposition velocity, and high mass transfer coefficient [2]. In the atmosphere, Hg species can be interconverted through various reactions, which have been introduced in detail in two recent articles [3,4].
In Korea, Hg research studies have been extensively performed especially in the area of biomonitoring and anthropogenic emissions; however, the history of atmospheric Hg measurement is relatively short. In the national Hg monitoring network operated since 2012, total gaseous mercury (TGM), the sum of GEM and GOM, has been measured at 12 monitoring sites using an automatic cold vapor atomic fluorescence spectrometer (Tekran 2537, Tekran Inc., Toronto, ON, Canada). An active sampler such as a Tekran 2537 instrument is expensive and requires electricity, a carrier gas, and stringent management; therefore, it is practically difficult to install and operate in remote areas such as in coastal and mountainous areas. However, it is necessary to measure GEM concentration at remote background sites and high-elevation sites to identify the effect of long-range transport particularly in Korea because of its proximity to China, the largest contributor to the global Hg budget [5,6]. This requires the development of a passive sampler that is inexpensive, easily deployed, and does not need electricity.
Because a passive sampler is able to identify concentrations at a fine spatial resolution, it has been widely used for certain pollutants including persistent organic pollutants and carbon dioxide [7]; however, nearly all Hg research studies have relied on an active sampler until recently. Many previous studies using an Hg passive sampler did not provide satisfactory results [7], and only a few groups suggested the reliable data [8,9,10,11,12]. For an Hg passive sampler, a diffusive body including radial [10,13], axial [8], box [14], and two-bowl [15] types has been tested. As an adsorbent for Hg collection, gold [16], silver [17], and impregnated activated carbon [8,10] have been used. Because gold is very stable even at high temperature it can be re-used and obtain a very low blank value. Sulfur-impregnated activated carbon was used for an Hg passive sampler by the research group at Peking University [8] and the University of Toronto [10]. Sulfur and the halogen elements significantly shorten the lifetime of the catalyst in the analytical instrument [18,19], whereas the addition of powdered Na2CO3 substantially increases the catalyst’s life [20]. Most previous studies found that the uptake rate by a Hg passive sampler was affected by meteorological factors including temperature and wind speed [8,21]; however, how they affected was different for each study. This study was initiated to develop and to apply a passive sampler for GEM, and the limitations of the passive sampler were identified.

2. Experiments

2.1. Theory

A passive sampler uses a diffusion mechanism to collect gaseous pollutants, as shown in Fick’s Law (Equation (1)). The mass transported (J, unit = mass·time−1·length−2) is proportional to a diffusion coefficient (D, unit = length2·time−1) and a concentration gradient over a distance (dC/dx, unit = mass·length−3·length−1).
J =   D d C d x = k d C =   D L d C
The flux can also be presented as the product of a concentration gradient, dC and a mass transfer coefficient, k (unit = length·time−1) in Equation (1). L, a diffusion layer length (unit = length), is often theoretically or empirically estimated. In a passive sampler, the adsorption amount of contaminants through laminar diffusion linearly increases during the early stage, then changes to a curve, and finally no longer changes when an equilibrium status is reached [9,22,23,24]. To accurately calculate the concentration using a passive sampler, it should be applied to the initial section where the adsorption amount linearly increases.
Using a passive sampler, Hg concentration is calculated as in Equation (2).
Conc .   ( ng m 3 ) =   sorbed   mass   ( ng ) deployment   time   ( day ) × sampling   rate   ( m 3 day 1 )
When developing a passive sampler, it is critical to provide an accurate sampling rate (SR). Theoretically, SR is estimated by the product of k (shown in Equation (1)) and the area at which diffusion occurs; therefore, it is strongly dependent on the characteristics of the pollutant and the design of the sampler. In practical application, not only laminar diffusion but also turbulence affect the adsorption; therefore, an experimental SR is generally suggested using the concentration measured by an active sampler as shown in Equation (3).
SR   ( m 3 day 1 ) =   sorbed   mass   ( ng ) deployment   time   ( day ) × conc .   by   active   sampler   ( ng m 3 )  

2.2. Sampling and Analysis

2.2.1. Design of Sampler

A passive sampler consists of an adsorbent, diffusive body, and external shield. In this study, Radiello® (Sigma-Aldrich, Seoul, Korea) having a 25 μm pore size was used as a diffusive body and has also been used in other studies [10,13,17]. The Radiello® was re-used after being cleaned by ultrapure water. A cylindrical external shield was manufactured with an opaque acrylic body and three Radiello® diffusive bodies were connected to the top of the inside of the external shield through threaded nuts (Figure 1, Figure S1). Inside the Radiello® diffusive body, the adsorbent was placed in a stainless steel container (300 mesh) and both ends were sealed with glass wool. The amount of adsorbent in an adsorbent container was 0.95 ± 0.05 g. To protect the sampler from rain, wind, dust, and small insects, the bottom of the external shield was covered by stainless steel (300 mesh). In this study, gold-coated borosilicate glass beads (Brooks Rand Instruments, Seattle, WA, USA) and I-impregnated activated carbon (Ohio Lumex Co., Cleveland, OH, USA) were initially tested for the adsorbents of the Hg passive sampler; however, I-impregnated activated carbon was soon excluded because the catalyst of the analytical instrument was quickly damaged. The size of old beads varied, but their diameter appeared to be about 1 mm. Before the sampling, gold-coated beads and stainless steel containers were heated at 550 °C to exclude any residual Hg.

2.2.2. Sampling

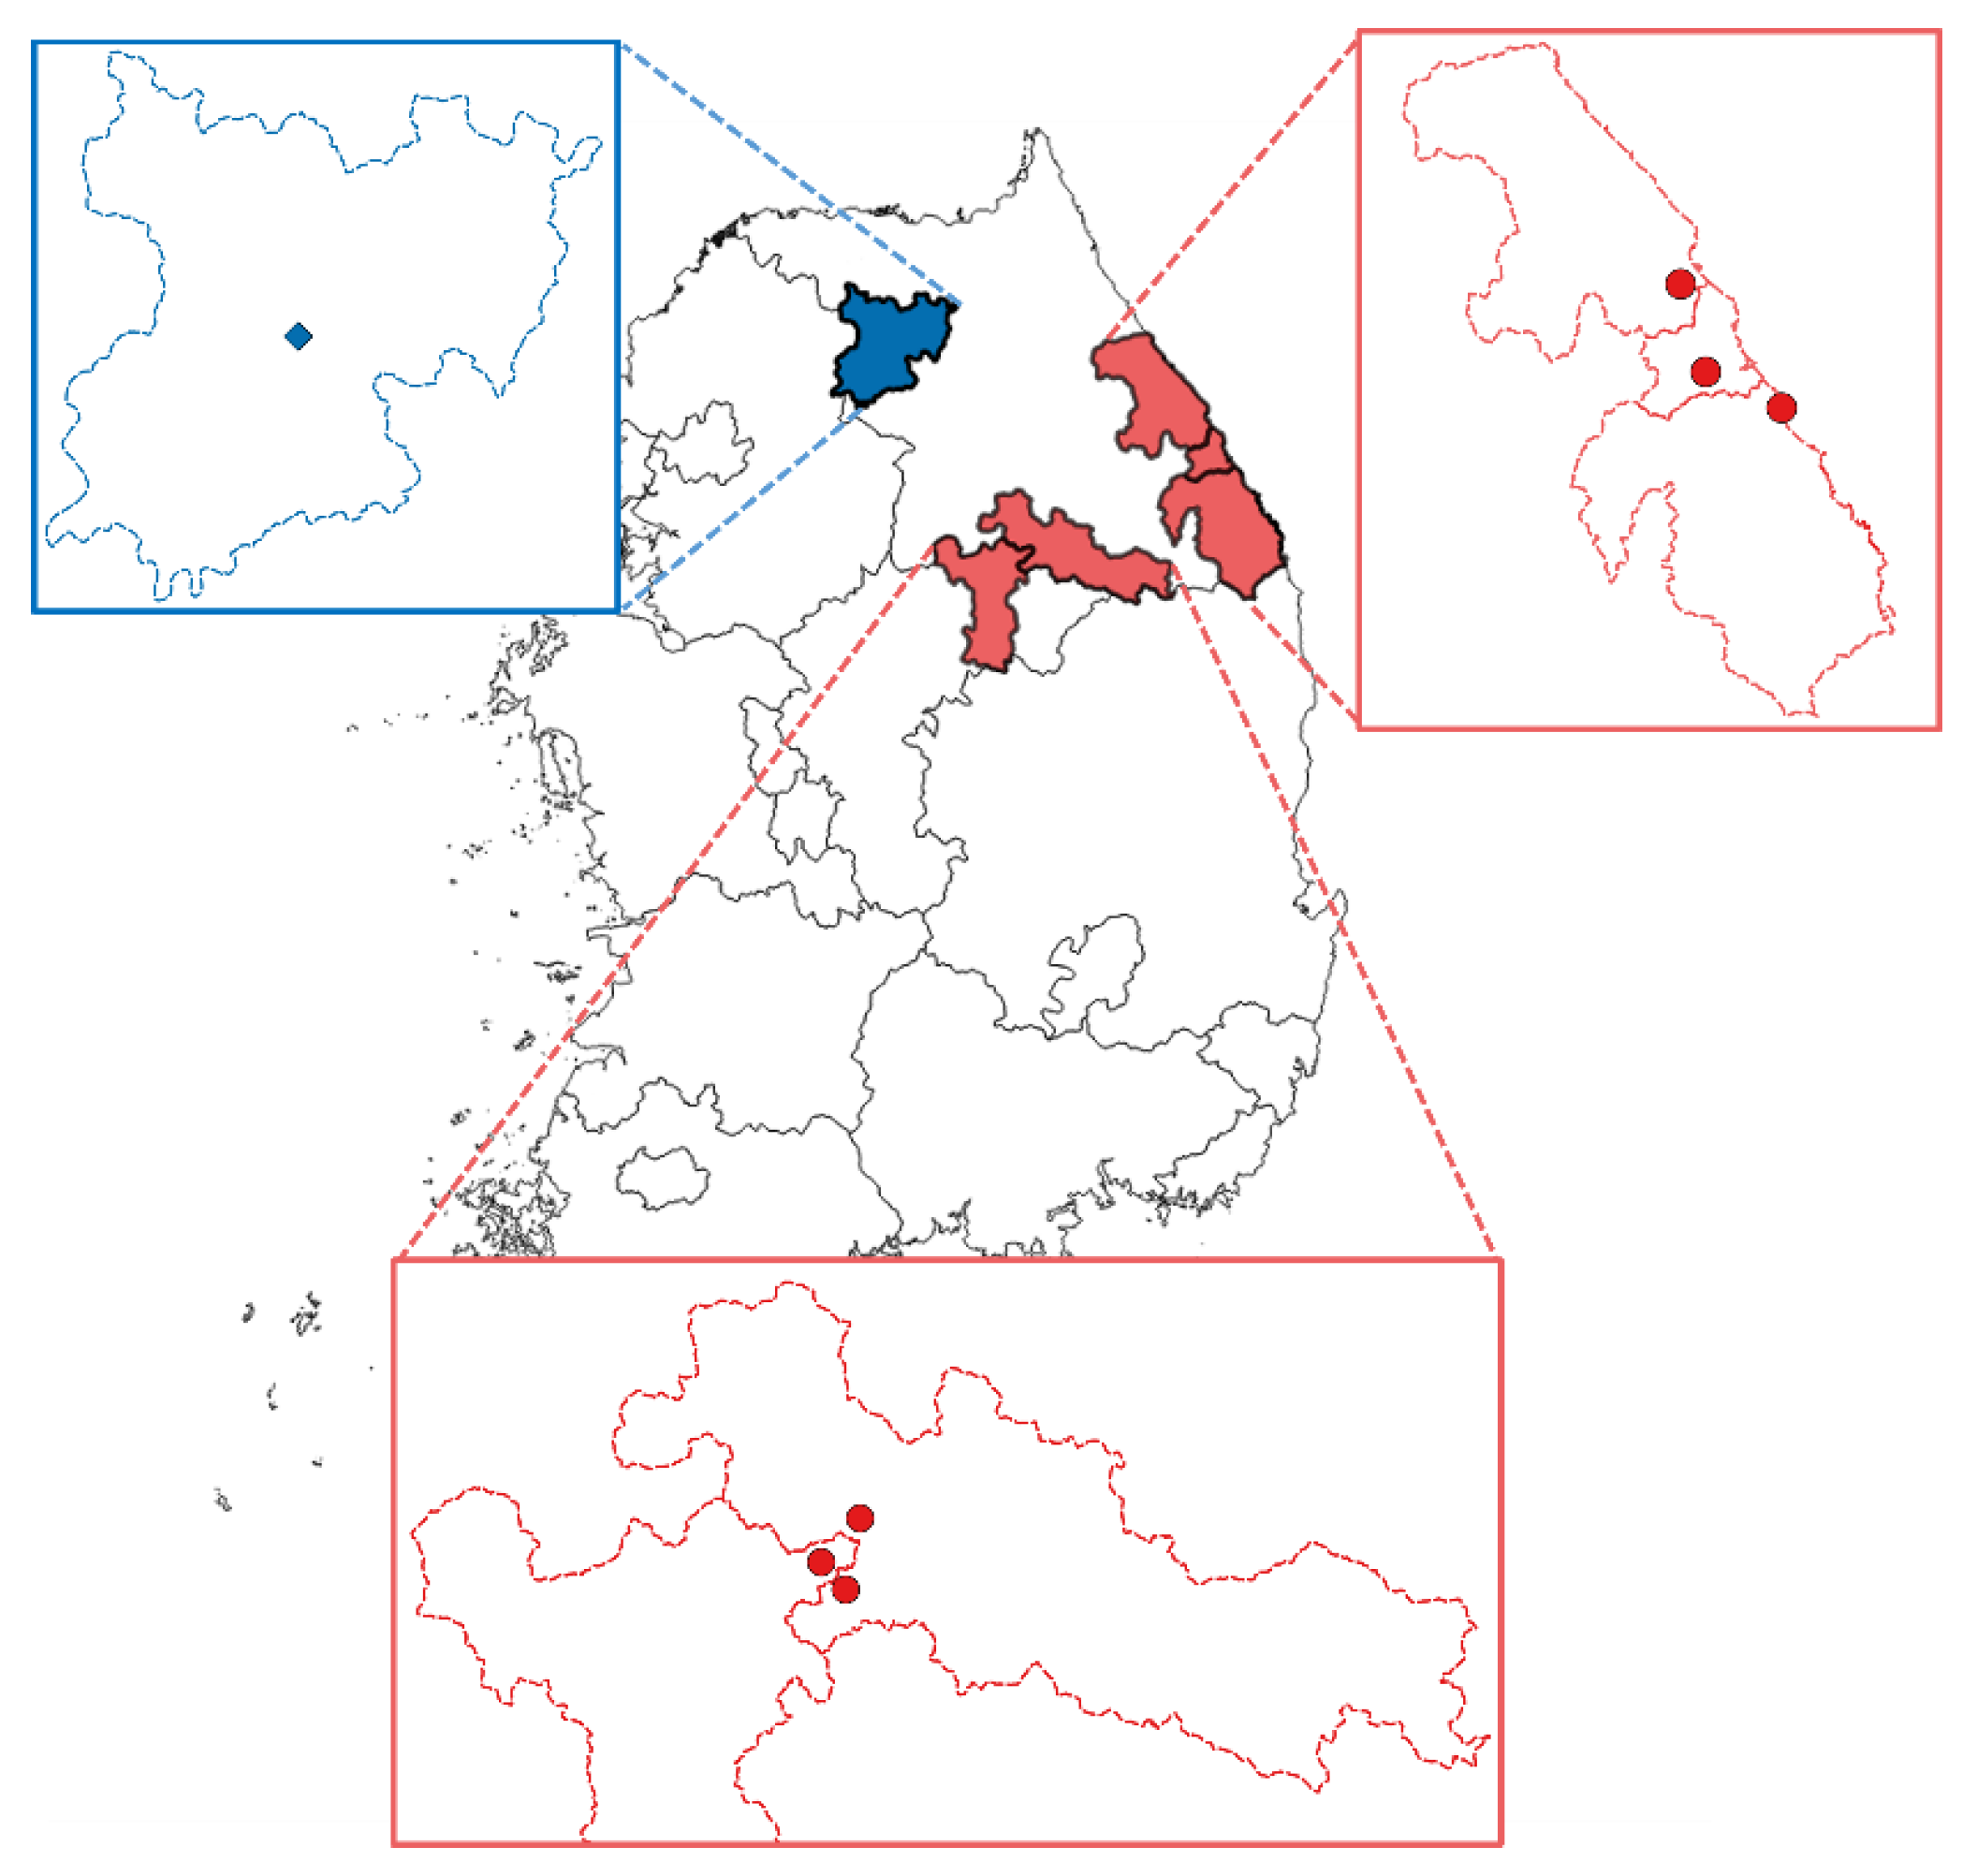
For an evaluation purpose, the passive samplers were deployed on the four-story building of the Kangwon National University (KNU) in Chuncheon, South Korea during three intensive measurement periods (Figure 2, Table 1). During the 1st measurement period (11 July–8 August 2017), four passive samplers were initially deployed at once and one sampler was randomly retrieved every week and analyzed to investigate the Hg adsorption amount from 1 week to 4 weeks. During the 2nd measurement period (9–30 August 2017), three passive samplers were initially installed and one sampler was retrieved each week. During the 3rd measurement period (12 September 2017–5 December 2017), in total eight samplers were initially deployed to allow the sampler to collect Hg for up to 12 weeks. Reproducibility was tested as three Radiello® diffusive bodies with adsorbents were installed in one sampler.
To identify the experimental SR and evaluate the performance of the passive sampler, TGM concentration was measured using the Tekran 2537X (Tekran Inc., Toronto, ON, Canada), an active sampler at the same location during the study period. Tekran 2537X is an automated measuring instrument for Hg that measures every 5 min. Outdoor air was continuously transported at a flow rate of 1.0 L min−1 through a heated Teflon line into the analyzer. Two gold traps alternately collected and thermally desorbed TGM which was quantified using a cold vapor atomic fluorescence spectrometer (CVAFS). Auto-calibration was performed by an internal permeation source every 24 h. In previous studies performed at the same sampling location, GOM contribution to TGM was very low (less than 3%) [25]. There is unpublished data showing that GOM rarely passes through the Radiello® diffusive boday [26]; hence, Hg collected by the passive sampler was considered as GEM in this study. Meteorological data, including temperature, humidity, wind speed, and wind direction, were obtained from the automatic weather station (Vintage Pro2, DAVIS Instruments, Hayward, CA, USA) at the sampling site.
After three intensive measurements at KNU in Chuncheon, Korea, the samplers were deployed at six monitoring sites near large cement production facilities over 26 days from 23 March to 18 April 2018, to test the passive sampler in identifying spatial variation (Figure 2, Table 1). The passive samplers were deployed at approximately 1.5 m above the ground and approximately 140~1100 m away from the cement plant. In addition, 10 passive samplers were deployed and collected at various locations in Chuncheon during the same period, and the GEM concentrations were compared to those obtained near the cement production facilities.

2.2.3. Analysis

After sampling, the gold-coated beads were heated at 550 °C in a tube furnace and the Hg adsorbed was analyzed using a CVAFS (Tekran 2537X). For 14 samples, Hg adsorbed onto the stainless steel container was also analyzed to identify whether the adsorption amount on the container was negligible or not. Stainless-steel container was also analyzed in the same manner as gold-coated beads. It was heated at 550 °C in a tube furnace and the Hg adsorbed analyzed using a CVAFS.
The adsorption capacity and recovery rate of the gold-coated beads were also tested. Approximately 0.95 g (the same amount used in the passive sampler) of gold-coated beads were placed in the quartz vial with septa, and a certain volume of Hg0-saturated vapor was withdrawn via a gas-tight syringe and injected into the quartz vial. Hg0-saturated air was provided in a closed 120 mL flask containing approximately 2–3 mL of metallic Hg. The flask was maintained at 24.9 °C via immersion in a temperature regulated water bath. The injected volumes were 50 μL (0.991 ng), 200 μL (3.965 ng), 400 μL (7.961 ng), and 600 μL (11.896 ng of Hg), respectively. After waiting for 1 day to allow the gold-coated beads to fully sorb Hg-saturated air, they were then analyzed using the Tekran 2537X.

2.2.4. Cleaning and Others

All adsorbents and diffusive bodies were triple sealed with zipper bags and stored in a freezer before and after sampling. The external shield was first cleaned by detergent, acetone, and ultrapure water and then soaked in a 1% HCl solution at 60 °C for 36 h to remove any residual Hg. Finally, it was cleaned with ultrapure water and dried in a clean bench. The used Radiello® was cleaned with detergent and ultrapure water using an ultrasonic bath, dried on a clean bench, and triple sealed with zipper bags until next usage. Field blanks were treated like the samples including air exposure during the sampler deployment and retrieval. They were also triple-sealed with zipper bags and stored in a freezer until analyzed. Overall, six field blanks were tested and yielded uptake amounts from 0.44–0.66 ng of Hg. The average uptake amount of the field blank was 0.55 ± 0.09 ng of Hg. All data shown in the following sections were field blank corrected. Method detection limit (MDL) and limit of quantification (LOQ) were calculated as 3 times and 10 times the standard deviation of the field blanks, respectively, and they were 0.27 ng and 0.90 ng.

2.2.5. Theoretical SR

SR can be theoretically calculated using Equation (4) as used in a previous study [10] which also used Radiello® sampler as a diffusive body, as follows:
SR = D × 2 π h [ ln ( r a r d o u t ) + ϑ 1.33 × ln ( r d o u t r d i n ) + ln ( r d i n r s ) ]
where D is the molecular diffusion coefficient of Hg0 in air, which is a function of temperature and pressure, h is the height of the diffusive barrier; and ra, rd-out, rd-in, and rs are the radii corresponding to the outside of the air-side boundary layer, the diffusive barrier, the internal air space, and the sorbent cylinder, respectively (Figure 1). Equation (4) is the adjusted equation to account for the tortuous path pursued through the diffusive barrier. The diffusion coefficient, D, was corrected for the temperature and the pressure obtained during the sampling period using Equation (5) [27], as follows:
D ( T ,   P ) = D ( T 0 ,   P 0 ) × ( P 0 P ) × ( T T 0 ) 1.81  
where T and P indicate ambient temperature (K) and atmospheric pressure, respectively. T0 and P0 are 293 K and 1 atm, respectively, and D(T0, P0) is a diffusion coefficient of Hg0 at T0 and P0, which is 0.112 cm2 s−1 [27].

3. Results and Discussion

3.1. Sampler Performance

To identify the maximum adsorption capacity of the passive sampler developed in this study, Hg0-saturated air was injected into the vial containing 0.95 g of gold-coated beads. The recovery rates of the injected Hg ranged from 96.3% to 73.9% when the injected Hg amount varied from 0.99 ng to 11.90 ng. The recovered Hg amounts were similar to or slightly higher than the injected amount up to 8 ng (equal to 400 μL shown in Figure 3); however, the recovery rate decreased to 70% when the injected amount increased to 11.9 ng, indicating that the passive sampler has a problem when adsorbing greater than 8 ng of Hg.
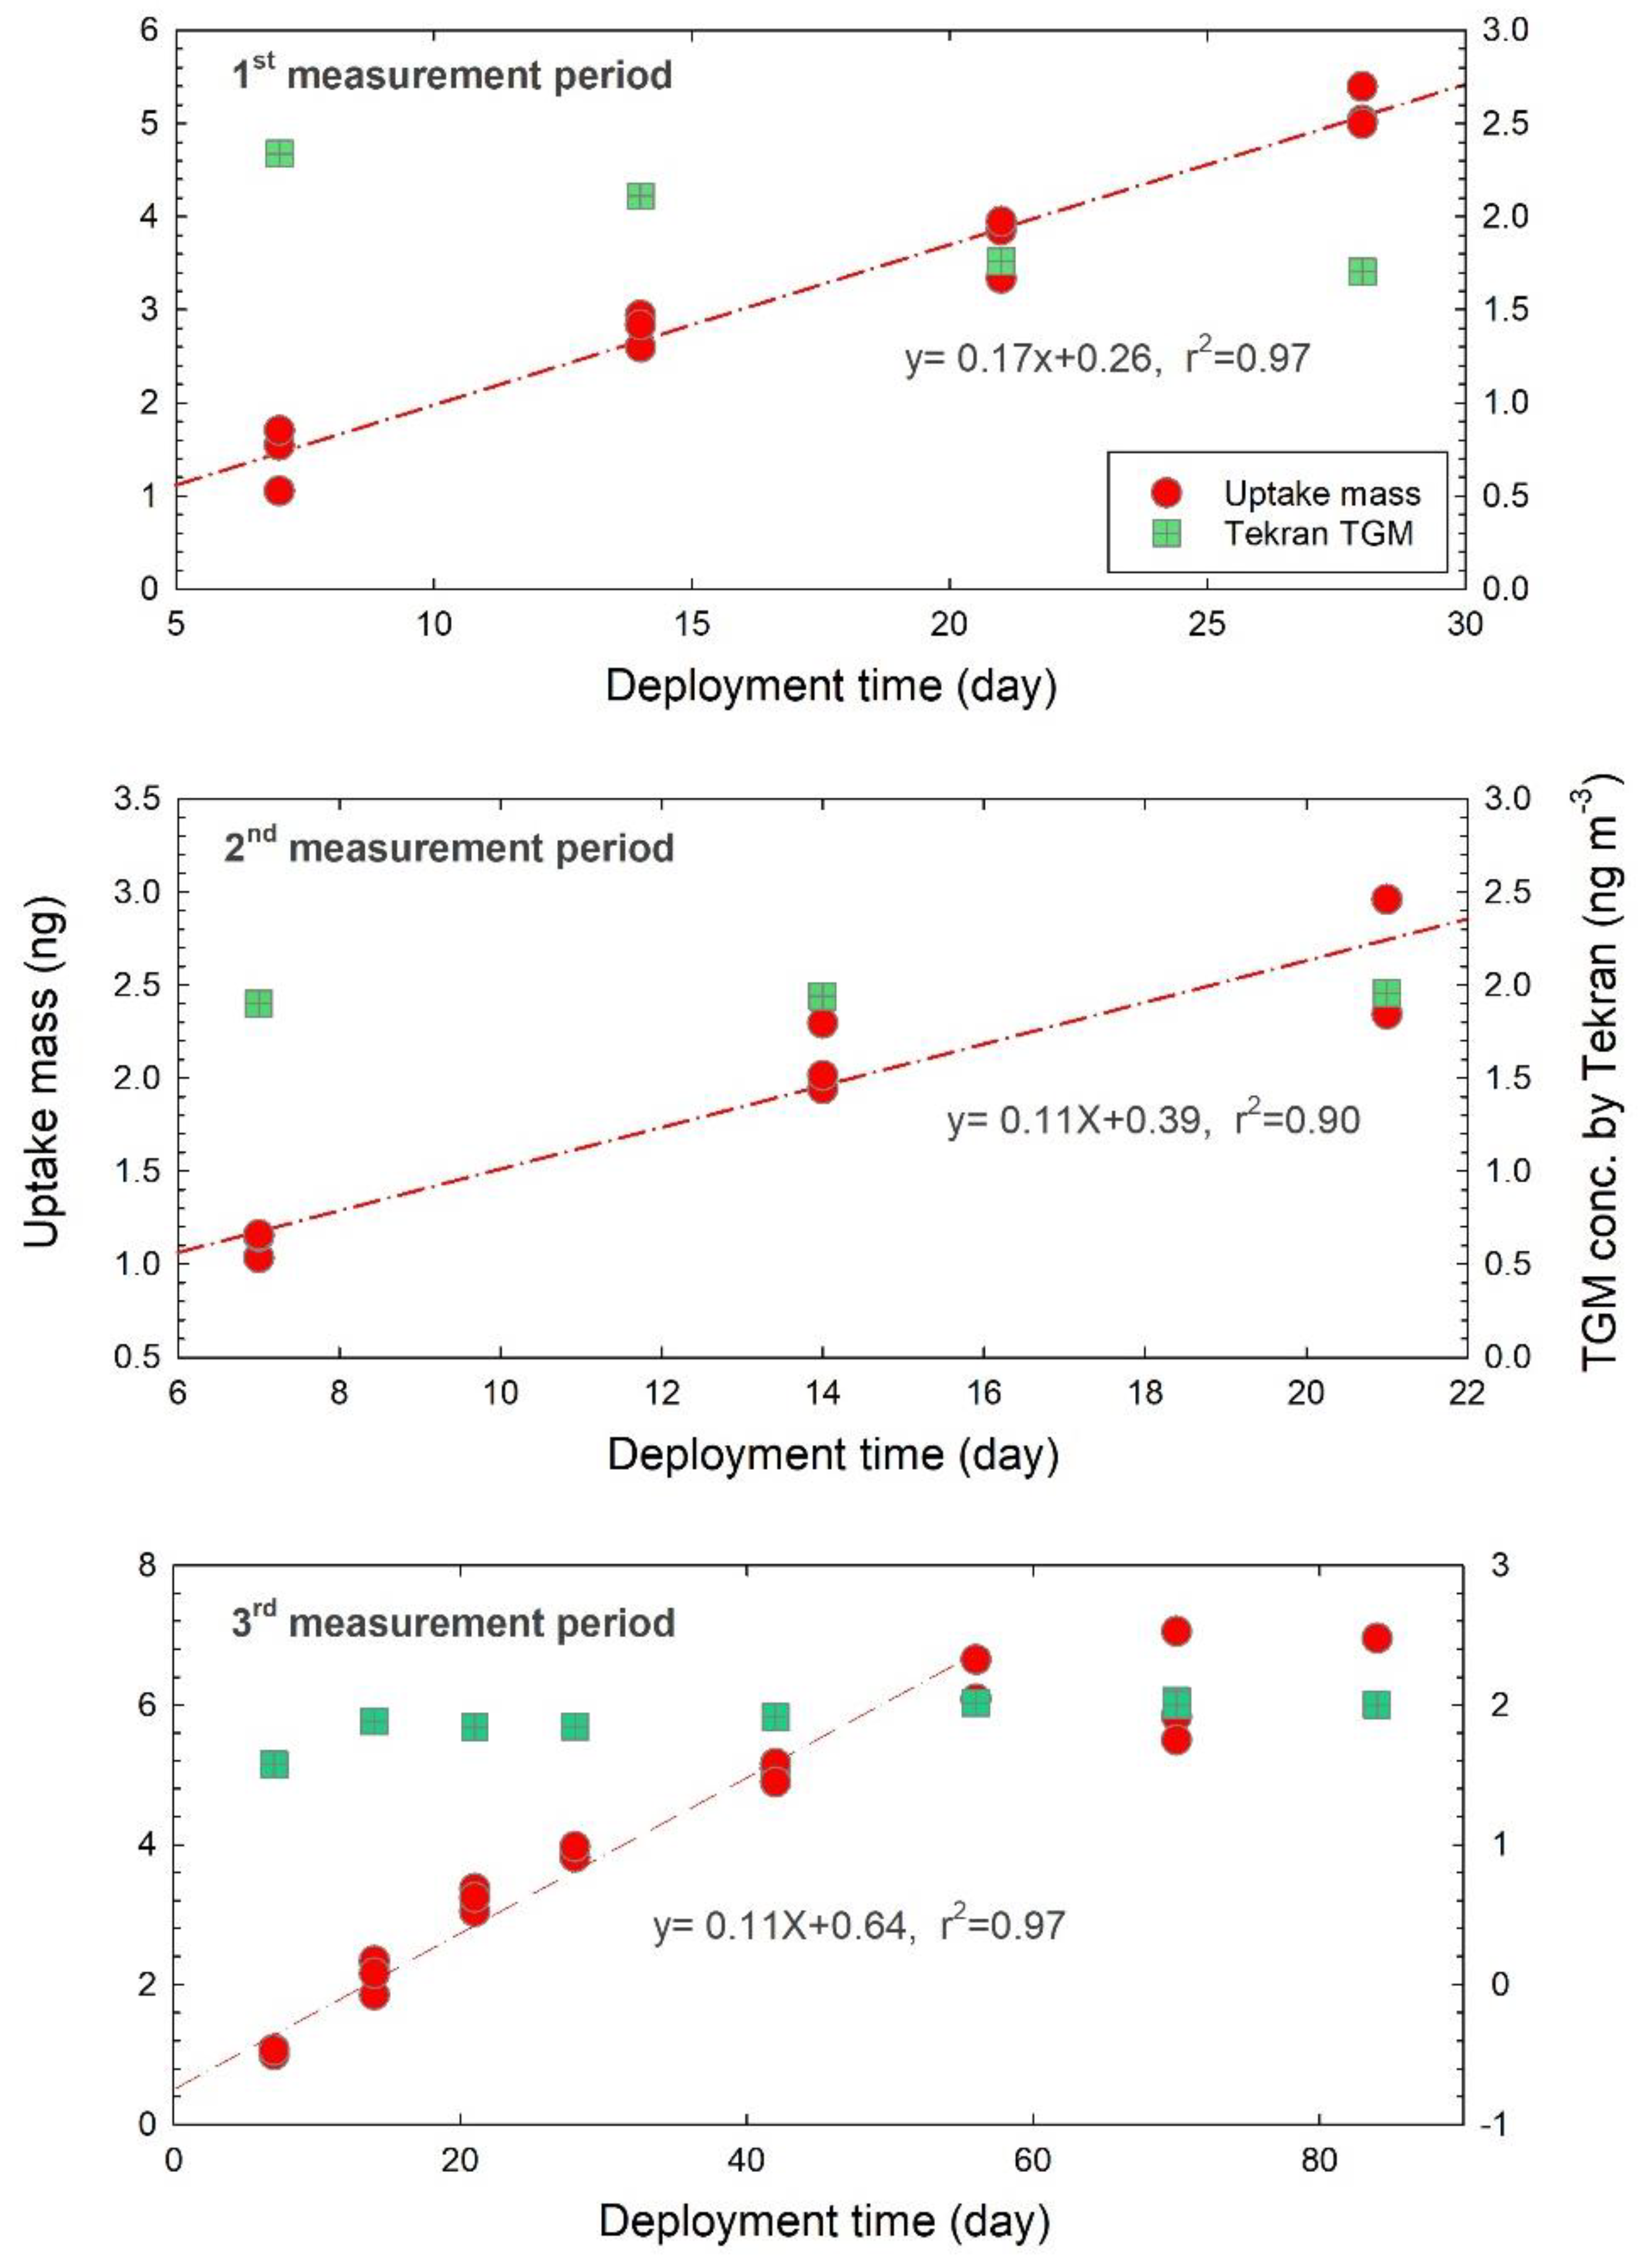
To evaluate the performance of the passive sampler, Hg uptake mass by the passive sampler was shown as a function of deployment time for the outdoor studies (Figure 4). Hg uptake mass linearly increased as deployment time increased (linear regression analysis, F-test, p-value ≤ 0.001) during the 1st and 2nd measurement periods (Figure 4). However, during the 3rd measurement period, Hg uptake mass linearly increased only until 8 weeks (regression analysis, F-test, p-value < 0.001) and thereafter it did not show any statistically significant increase (Figure 4). This implicates that the maximum deployment time for the passive sampler using 0.95 g of gold-coated beads as adsorbent is equal to or less than 8 weeks when the Hg concentration is approximately 2 ng m−3. The Hg adsorbed amount during 8 weeks ranged 6 to 7 ng, which was similar to the adsorption capacity result (Figure 3) of injecting Hg-saturated air into the vial containing 0.95 g of gold-coated beads. Average uptake rate was 0.16 ± 0.03 ng day−1, indicating that the deployment time should be at least 1.7 days and 5.6 days to reach the MDL and the LOQ obtained in this study, respectively. The rather low adsorption capacity of the sampler is likely associated with the selected adsorbent, the gold-coated beads. Previous studies using the same diffusive body with S-impregnated activated carbon [12] revealed higher adsorption capacities, for deployment of a year and above. Also, in Zhang et al. (2012) [8], the amount of Hg adsorbed by the passive sampler using polyethylene diffusion tube with S-impregnated activated carbon attained 22 ng.
During the 1st, 2nd, and 3rd intensive measurement periods, the median relative standard deviation (RSD) calculated from three Radiello® diffusive bodies installed in one external shield was 7.6%, 8.9%, and 5.2%, respectively. Some previous studies revealed good RSD results. MaLagan et al. (2018) [11] and Zhang et al. (2012) [8] provided 4% and 12% RSD, respectively, for replicates from samplers using S-impregnated activated carbon. Skov et al. (2007) [13] provided and RSD of 7.7% for replicates from passive samplers using solid gold as the adsorbent. The whole precision between the collocated external shields was not tested, and therefore assessment of the related QA/QC is still required.
To identify whether GEM was adsorbed onto the stainless steel container or not, the container was analyzed. It was found that the Hg adsorption amount on the container increased as the deployment time increased, showing 0.017 ± 0.018 ng-Hg day−1. The high standard deviation in Hg uptake rates of stainless-steel container was probably because it provides a less effective surface than the gold-coated beads for GEM. The percentage of Hg adsorption amount on the container ranged from 9% of the Hg adsorbed on gold-coated beads for 28 days of deployment time to 30% for 56 days. We also found that the amount of Hg adsorbed onto the stainless-steel container as well as onto the gold-coated beads linearly increased with the deployment time (Figure 5). This result shows that the Hg adsorption on the container should not be ignored and may bring uncertainty in estimating SR particularly over a long deployment time. However, the Hg adsorption on the stainless-steel container possibly attains equilibrium early, and therefore, the equation showing Hg adsorption on the stainless-steel container with deployment time (as proposed in Figure 5) may not be applicable after 8 weeks.

3.2. Sampling Rate

Experimental SR was calculated using Equation (3). The average experimental SR was 0.083 ± 0.017 m3 day−1 during the whole intensive measurement period. During the 1st measurement period, SR was relatively consistent, ranging from 0.088 to 0.108 m3 day−1 (Figure 6). The average SR during the second measurement period was 0.083 m3 day−1, less than that for the 1st measurement period probably because both the atmospheric temperature and wind speed were lower. Because a gaseous diffusion coefficient is proportional to the 1.5 to 1.7 square of the temperature [28,29], the SR was expected to increase as temperature increased. If the adsorption amount of contaminants in the passive sampler only occurs through laminar diffusion, wind speed does not necessarily affect SR. However, in practical application, turbulence also affects adsorption; therefore, most passive samplers currently used are susceptible to the influence of wind speed and even wind direction [21,30]. During the 3rd measurement period, the average SR (0.077 ± 0.014 m3 day1) was slightly lower than that during the other two measurement periods, probably because the temperature was relatively low (on average 16.8 °C) while it was 27.1 °C and 24.5 °C during the 1st and 2nd periods, respectively. The average wind speed (0.64 ± 0.06 m s1) was similar to that of the other two periods (WS= 0.80 ± 0.11 and 0.55 ± 0.09 m s−1 for the 1st and the 2nd sampling periods, respectively). The SR exhibits a decreasing trend (Figure 6) as the deployment time increased during the 3rd measurement period, probably because the atmospheric temperature and wind speed generally decreased from 12 September to 5 December 2017, causing strong positive correlations of the SR with temperature and wind speed (Figure S2). TGM concentrations that were relatively consistent during the sampling period (Figure 4) did not affect the SR in this study.
SR was also theoretically calculated using Equation (4). The v indicates the porosity of 0.496 ± 0.001 for the Radiello® diffusive barrier [10,31]. The height of the diffusive barrier (h) and ra, rd-out, rd-in, and rs were determined by the design of the sampler (Figure 1). Various values of air-side boundary layer thickness, ra were used in previous studies evaluating passive samplers. The results of Armitage et al. (2016) [32] and McLagan et al. (2016) [10] agreed well with empirical data when assuming an air-side boundary layer thickness ranging from 7.5 to 15 mm while Huang et al. (2018) [28] used 18 mm as the ra. In this study, 15 mm of ra was used. The average theoretical SR was calculated to be 0.127 ± 0.003 m3 day−1, which is higher than the experimental SR (0.055~0.110 m3 day−1), and there was a significant correlation between the theoretical and empirical SRs (spearman rho = 0.74, p-value < 0.001) (Figure 7). The theoretical SR was mainly affected by a gaseous diffusion coefficient (D) in Equation (5), and other parameters were constants. Since D is proportional to 1.5 to 1.7 the square of the Kelvin temperature in Equation (5), the theoretical SR is also significantly affected by temperature. Therefore, a good correlation between the experimental and theoretical SRs is likely to indicate that the major adsorption mechanism was molecular diffusion in the passive sampler. However, the range of the empirical SR with the temperature change was shown to be relatively large (Figure 6), compared to the theoretical SR which ranged only from 0.122 to 0.130 m3 day−1 (Figure 7), suggesting that the collection of Hg by the passive sampler was also influenced by other mechanisms (such as turbulence) in addition to molecular diffusion. In the study of McLagan et al. [10], the modeled SR was only 3.5% lower than the average of measured SRs based on >350 data. In this study, the experimental SR was approximately 33% lower than the modeled SR. The higher theoretical SR was possibly derived either by using uncertain variables including ra [9,16,17,33]. The lower experimental SR compared with the modeled SR may also indicate the inability of the passive sampler to effectively collect Hg. Some Hg was adsorbed on the stainless-steel container (Figure 5), with the possibility of further adsorption on the external shield and glass wool, inhibiting Hg adsorption onto the gold-coated beads. In addition, the external shield might act as an additional resistance increasing the diffusion layer thickness.

3.3. Effect of Meteorological Factors

Because a passive sampler is intentionally or unintentionally dependent on meteorological factors, studies were previously conducted to identify their effects on the SR; however, they often showed different results. Guo et al. (2014) [30] and Skov et al. (2007) [13] found no effect of temperature on SR while Gustin et al. (2011) [17] and McLagan et al. (2017) [21] found a significant effect. Some studies did not observe the effect of relative humidity (RH) [21,30] while Huang et al. (2014) [7] did.
In this study, wind speed (WS), atmospheric temperature (Ta), and relative humidity (RH) ranged from 0.50 to 0.94 m s−1, 15.7 to 27.50 °C, and 71 to 83%, respectively, during the entire intensive measurement period. The SR showed a positive relationship with WS (r2 = 0.37, p-value < 0.001) despite of a small change in WS (Figure 8), indicating that the passive sampler was somewhat affected by turbulence. The SR also showed a significant positive correlation with Ta (r2 = 0.40, p-value < 0.001, Figure 8) because the diffusion coefficient increases as Ta increases. There was no relationship between SR and RH (Figure S3 p-value= 0.234). The clear influence of meteorological variables on the SR strongly suggests that it is necessary to calibrate the SR for the Ta and WS when applying the passive sampler in field monitoring.
To identify the calibration equation for SR, multiple linear regression was performed using WS, Ta, and atmospheric water vapor concentration (H2O) as independent variables. A significant multiple linear regression equation (Equation (6)) was found with all three variables (p-value < 0.001) and a higher r2 was found compared to that of a simple regression analysis. All three variables of Ta (p-value = 0.012), WS (p-value = 0.012), and H2O (p-value = 0.037) were statistically significant in the multiple linear regression equation (note that a constant was statistically significant at a significance level of 0.1, p-value = 0.056):
SR (m3 day−1) = (0.010 ± 0.004) Ta (oC) + (0.048 ± 0.018) WS (m s−1) − (142,269.1 ± 65,337.114) H2O (mol cm−3) − (0.054 ± 0.027), r2 = 0.61
where H2O indicates the molar concentration of water vapor in the atmosphere. McLagan et al. (2017) [21] reported a calibration equation for the SR based on laboratory experiments that quantified the effect of WS (calm ~ 6 m sec−1) and found that the SR of the passive sampler with a protective shield was most sensitive to a WS between 0 and 1 m s−1. The higher slope of SR against to that of WS in this study compared to that of McLagan et al. (2017) [21] was possibly a result of the lower WS found at the sampling site. A calibration equation (Equation (6)) was obtained from a relatively narrow range of meteorological variables in this study; therefore, it is necessary to identify the change in SR with a wide range of Ta, WS, and RH in future. Currently, the suggested equation (Equation (6)) has a limitation in that the SR becomes negative when the temperature is below zero. When a multiple linear regression was performed without a y-intercept, the statistically significant equation (p-value < 0.001) was obtained using only two variables, T (p-value < 0.001) and WS (p-value < 0.001), as shown in Equation (7) and Figure 9 (please note that for the non-intercept model, r2 measured the rate of change in the dependent variable relative to the origin described in the regression; therefore, this cannot be compared to the r2 of the model containing an intercept).
SR (m3 day−1) = (0.002 ± 0.000) Ta (°C) + (0.060 ± 0.015) WS (m s−1)
With a wide variation of factors, it is anticipated to obtain a more reasonable regression equation and possibly a higher coefficient of determination (r2). It is clear that the SR was affected by WS and temperature for the passive sampler used in this study.

3.4. Comparison to Active Measurements

Hg passive samplers used in some previous studies [17,34,35] showed only weak or indistinguishable linear relationships between uptake rates and active Hg measurements even with a wide variation in Hg concentrations, while some others showed strong correlations [8,10,11]. When the uptake rate by the passive sampler was compared to the active measurements (Tekran data) in this study, the correlation coefficient was not statistically significant (Figure 10a. Spearman non-parametric correlation test, p-value = 0.91). However, an insignificant correlation was mainly caused by the narrow section of Hg concentration ranging from 1.8 to 2.0 ng m−3 measured by the Tekran 2537X (Figure 10a), indicating that the passive sampler was not sufficiently sensitive to detect the small difference in Hg concentration. An insufficient number of samples was also a possible reason resulting in an insignificant correlation between uptake rate and active measurement. In addition, the uptake rate was not corrected for meteorological variables which clearly influenced on the SR (Figure 8 and Figure 9). The passive sampler should be evaluated with a calibrated SR and a wide range of Hg concentrations in future.
To identify whether the passive sampler is able to depict the spatial variation of the GEM concentration, passive samplers were deployed near large anthropogenic Hg sources (Table 1). In Korea, the largest anthropogenic source is cement production [36]; thus, the passive samplers were deployed near six cement production facilities (Figure 2). Active Hg concentrations and meteorological variables were not concurrently measured with the passive sampler deployment; therefore, Hg concentrations measured by the passive samplers using an average empirical SR (0.083 ± 0.017 m3 day−1) were compared to the cement production amount of each facility. Passive Hg concentrations ranged from 2.3 to 4.0 ng m−3, and showed a good correlation with cement production amount (Figure 10b). Other factors possibly influencing passive Hg concentration such as emissions control for cement production facilities, winds, physical characteristics of stack, and plant production output during deployment were not considered in this study. The average passive Hg concentration at 10 sampling locations in Chuncheon, a small residential city (Figure 2), was 1.7 ng m−3, ranging from 1.5 to 1.9 ng m−3, which were relatively lower than those measured near the cement production facilities. Since measurements of the active sampler were not available to verify the spatial distribution of the Hg concentrations, the passive Hg concentrations were only qualitatively compared with cement production data in Figure 10b, and, therefore, the passive sampler requires further quantitative evaluation with active Hg measurements.

4. Conclusions

In this study, a passive sampler for GEM was developed and applied for field monitoring in Korea. Gold-coated beads, a Radiello®, and an acrylic body were used as an adsorbent, a diffusive body, and an external shield, respectively. Hg uptake mass linearly increased as the deployment time increased; however, the maximum deployment time was only approximately 8 weeks when the TGM concentration was 2 ng m−3. The field blank uptake was sufficiently low to be able to measure Hg even for a short period of 1 week. Using active Hg measurements, the average experimental SR was 0.083 ± 0.017 m3 day−1. The variation in the SR was caused by the variation in the temperature, WS, and molar concentration of the water vapor, as suggested by the statistically significant simple and multiple linear regression equations. When the uptake rates were compared to the active Hg measurements in this study, the correlation was not significant, particularly for the Hg concentration ranging from 1.8 to 2.0 ng m−3, suggesting that the passive sampler was not sufficiently adept at detecting such a small difference in the Hg concentration. When the passive samplers were deployed near the large cement production plants, the uptake rates (and the concentration calculated using the empirical SR) showed a good correlation with the cement production amount. However, no active concentrations measurements were made and this assessment remains qualitative.
The passive sampler developed in this study has some limitations and it needs to be improved in future. The experimental SR was approximately two-thirds of the theoretically calculated SR, possibly indicating that Hg collection by the passive sampler was inhibited by the sampler design. Among the possibilities is the adsorption of GEM on the stainless-steel container; it could have further influenced the SR because the same material was used to cover the bottom of the external shield. In addition, the maximum deployment time was not sufficiently long compared to that of other passive samplers. Nonetheless, the relatively good RSD, a significant increase in uptake amount with deployment time, and a promising result for spatial Hg concentration near the cement plants suggest that the passive sampler can be used in field monitoring with an improvement through further investigation.

Supplementary Materials

The following are available online at https://www.mdpi.com/2073-4433/10/11/678/s1, Figure S1: The photograph of the passive sampler, Figure S2: SR change with temperature and wind speed for the 3rd measurement period, Figure S3: Effect of relative humidity on the experimental SR.

Author Contributions

Conceptualization, Y.-J.H., G.-S.S., Y.-H.K., and H.K.; methodology, Y.-J.H., J.-W.J., and S.-H.C.; software, J.-W.J. and P.-R.K.; validation, Y.-J.H., J.-W.J., S.N. and Y.-H.K.; formal analysis, J.-W.J. and S.-H.C.; investigation, J.-W.J., P.-R.K. and S.-H.C.; resources, J.-W.J. and S.-H.C.; data curation, J.-W.J.; writing—original draft preparation, J.-W.J.; writing—review and editing, Y.-J.H.; visualization, J.-W.J. and S.-H.C.; supervision, Y.-J.H.; project administration, Y.-J.H.; funding acquisition, Y.-H.K., H.K., G.-S.S., and S.N.

Funding

This research was funded by National Institute of Environmental Research, grant number: NIER-SP2017-112 and National Research Foundation of Korea, grant number: 2015R1A2A203008301.

Acknowledgments

This work was funded by a National Institute of Environmental Research (NIER-SP2017-112) and by a National Research Foundation of Korea (NRF) grant funded by the Korean government (MSIP) (Grant No. 2015R1A2A203008301). The authors would like to thank Ji-Hye Kim for helping with sampling.

Conflicts of Interest

The authors declare no conflict of interest.

References

  1. Driscoll, C.T.; Mason, R.P.; Chan, H.M.; Jacob, D.J.; Pirrone, N. Mercury as a global pollutant: Sources, pathways and effects. Environ. Sci. Technol. 2013, 47, 4967–4983. [Google Scholar] [CrossRef] [PubMed]
  2. Lin, C.J.; Pehkonen, S.O. The chemistry of atmospheric mercury: A riview. Atmos. Environ. 1999, 33, 2067–2079. [Google Scholar] [CrossRef]
  3. Si, L.; Ariya, P.A. Recent advances in atmospheric chemistry of mercury. Atmosphere 2018, 9, 76. [Google Scholar] [CrossRef]
  4. Horowitz, H.M.; Jacob, D.J.; Zhang, Y.; Dibble, T.S.; Slemr, F.; Amos, H.M.; Schmidt, J.A.; Corbitt, E.S.; Marais, E.A.; Sunderland, E.M. A new mechanism for atmospheric mercury redox chemistry: Implications for the global mercury budget. Atmos. Chem. Phys. 2017, 17, 6353–6371. [Google Scholar] [CrossRef]
  5. Han, Y.J.; Kim, J.E.; Kim, P.R.; Kim, W.J.; Yi, S.M.; Seo, Y.S.; Kim, S.H. General trend of atmospheric mercury concentrations in urban and rural areas in Korea and characteristics of high-concenration events. Atmos. Environ. 2014, 94, 754–764. [Google Scholar] [CrossRef]
  6. United Nations Environment Programme (UNEP). Global Mercury Assessment 2013: Sources, Emissions, Releases and Environmental Transport; UNEP Chemicals Branch: Geneva, Switzerland, 2013; pp. 1–44. [Google Scholar]
  7. Huang, J.; Lyman, S.N.; Hartman, J.S.; Gustin, M.S. A review of passive sampling systems for ambient air mercury measurements. Environ. Sci. Processes Impact 2014, 16, 374–392. [Google Scholar] [CrossRef] [PubMed]
  8. Zhang, W.; Tong, Y.; Hu, D.; Ou, L.; Wang, X. Characterization of atmospheric mercury concentration along an urban-rural gradient using a newly developed passive sampler. Atmos. Environ. 2012, 47, 26–32. [Google Scholar] [CrossRef]
  9. McLagan, D.S.; Mazur, M.E.E.; Mitchell, C.P.J.; Wania, F. Passive air sampling of gaseous elemental mercury: A critical review. Atmos. Chem. Phys. 2016, 16, 3061–3076. [Google Scholar] [CrossRef]
  10. McLagan, D.S.; Mitchell, C.P.J.; Huang, H.; Lei, Y.D.; Cole, A.S.; Steffen, A.; Hung, H.; Wania, F. A high-precision passive air sampler for gasoues mercury. Environ. Sci. Technol. 2016, 3, 24–29. [Google Scholar] [CrossRef]
  11. McLagan, D.S.; Mitchell, C.P.J.; Steffen, A.; Hung, H.; Shin, C.; Stupple, G.W.; Olson, M.L.; Luke, W.T.; Kelley, P.; Howard, D.; et al. Global evaluation and calibration of a passive air sampler for gaseous mercury. Atmos. Chem. Phys. 2018, 18, 5905–5919. [Google Scholar] [CrossRef] [Green Version]
  12. McLagan, D.S.; Monaci, M.; Huang, H.; Lei, Y.D.; Mitchell, C.P.J.; Wania, F. Characterization and quantification of atmospheric mercury sources using passive air samplers. J. Geophys. Res. Atmos. 2019, 124, 2351–2362. [Google Scholar] [CrossRef]
  13. Skov, H.; Sorensen, B.T.; Landis, M.S.; Johnson, M.S.; Sacco, P.; Goodsite, M.E.; Lohse, C.; Christiansen, K.S. Performance of a new diffusive sampler for Hg0 determination in the troposphere. Environ. Chem. 2007, 4, 75–80. [Google Scholar] [CrossRef]
  14. Lyman, S.N.; Gustin, M.S.; Prestbo, E.M. A passive sampler for ambient gaseous oxidized mercury concentrations. Atmos. Environ. 2010, 44, 246–252. [Google Scholar] [CrossRef]
  15. May, A.A.; Ashman, P.; Huang, J.; Dhaniyala, S.; Holson, T.M. Evaluation of the polyurethane foam (PUF) disk passive air sampler: Computational modeling and experimental measurements. Atmos. Environ. 2011, 45, 4354–4359. [Google Scholar] [CrossRef]
  16. Scott, J.E.; Ottaway, J.M. Determination of mercury vapour in air using a passive gold wire sampler. Analyst 1981, 106, 1076–1081. [Google Scholar] [CrossRef]
  17. Gustin, M.S.; Lyman, S.N.; Kilner, P.; Prestbo, E. Development of passive sampler for gaseous mercury. Atmos. Environ. 2011, 45, 5805–5812. [Google Scholar] [CrossRef]
  18. Bartholomew, C.H. Mechanisms of catalyst deactivation. Appl. Catal. A General 2001, 212, 17–60. [Google Scholar] [CrossRef]
  19. Oudar, J.; Wise, H. Deactivation of Catalysis; Academic Press: London, UK, 1984; Chapter 8. [Google Scholar]
  20. McLagan, D.S.; Huang, H.; Ying, D.; Wania, F.; Michell, C.P.J. Application of sodium carbonate prevents sulphur poisoning of catalysts in automated total mercury analysis. Spectrochim. Acta Part B 2017, 133, 60–62. [Google Scholar] [CrossRef]
  21. McLagan, D.S.; Mitchell, C.P.J.; Huang, H.; Hussain, B.A.; Lei, Y.D.; Wania, F. The effects of meteorological parameters and diffusive barrier reuse on the sampling rate of a passive air sampler for gaseous mercury. Atmos. Meas. Tech. 2017, 10, 3651–3660. [Google Scholar] [CrossRef] [Green Version]
  22. Bartkow, M.E.; Booij, K.; Kennedy, K.E.; Muller, J.F.; Hawker, D.W. Passive air sampling theory for semivolatile organic compounds. Chemosphere 2005, 60, 170–176. [Google Scholar] [CrossRef]
  23. Naval Facilities Engineering Command. Passive sampling for vapor intrusion assessment. In Technical Memorandum; TM-NAVFAC EXWC-EV-1503; Naval Facilities Engineering Command: Port Hueneme, CA, USA, 2015; pp. 1–14. [Google Scholar]
  24. Wania, F.; Shen, L.; Lei, Y.D.; Teixeira, C.; Muir, D.C.G. Development and calibration of a Resin-based passive sampling system for monitoring persistent organic pollutants in the atmosphere. Environ. Sci. Technol. 2003, 37, 1352–1359. [Google Scholar] [CrossRef]
  25. Gan, S.Y.; Yi, S.Y.; Han, Y.J. Characteristics of atmospheric speciated gaseous mercury in Chuncheon, Korea. J. Korean Soc. Environ. Eng. 2009, 31, 382–391. [Google Scholar]
  26. Stupple, G.W.; McLagan, D.S.; Steffen, A. In situ reactive gaseous mercury uptake on radiello diffusive barrier, cation exchange membrane and Teflon filter membrane during atmospheric mercury depletion events. In Proceedings of the 14th International Conference on Mercury as a Global Pollutant, Krakow, Poland, 8–13 September 2019. [Google Scholar]
  27. Massman, W.J. Molecular diffusivities of Hg vapor in air, O2 and N2 near STP and the kinematic viscosity and thermal diffusivity of air near STP. Atmos. Environ. 1999, 33, 453–457. [Google Scholar] [CrossRef]
  28. Fuller, E.N.; Schettler, P.D.; Giddings, J.C. New method for prediction of binary gas-phase diffusion coefficients. Ind. Eng. Chem. 1966, 58, 18–27. [Google Scholar] [CrossRef]
  29. Chapman, S.; Cowling, T.G. The Mathematical Theory of Non-Uniform Gases, 3rd ed.; Cambridge University Press: Cambridge, UK, 1970. [Google Scholar]
  30. Guo, H.; Lin, H.; Zhang, W.; Deng, C.; Wang, H.; Zhang, Q.; Shen, Y.; Wang, X. Influence of meteolorogical factors on the atmospheric mercury measurement by a novel passive sampler. Atmos. Environ. 2014, 97, 310–315. [Google Scholar] [CrossRef]
  31. Huang, C.; Tong, L.; Dai, X.; Xiao, H. Evaluation and application of a passive air sampler for atmospheric volatile organic compounds. Aerosol Air Qual. Res. 2018, 18, 3047–3055. [Google Scholar] [CrossRef]
  32. Armitage, J.M.; Hayward, S.J.; Wania, F. Modeling the uptake of neutral organic chemicals on XAD passive air samplers under variable temperatures, external wind speeds and ambient air concentrations (PAS-SIM). Environ. Sci. Technol. 2013, 47, 13546–13554. [Google Scholar] [CrossRef]
  33. Brown, R.J.C.; Burdon, M.K.; Brown, A.S.; Kim, K.H. Assessment of pumped mercury vapour adsorption tubes as passive samplers using a micro-exposure chamber. J. Environ. Monit. 2012, 14, 2456–2463. [Google Scholar] [CrossRef]
  34. Huang, J.; Choi, H.D.; Landis, M.S.; Holsen, T.M. An application of passive samplers to understand atmospheric mercury concentration and dry deposition spatial distributions. J. Environ. Monit. 2012, 14, 2976–2982. [Google Scholar] [CrossRef]
  35. Nishikawa, M.; Shiraishi, H.; Yanase, R.; Tanida, K. Examination of an improved passive sampler for gaseous mercury on the landfill site. J. Environ. Chem. 1999, 9, 681–684. [Google Scholar] [CrossRef]
  36. Won, J.H.; Lee, T.G. Estimeation of total annual mercury emission from cement manufacturing facilities in Korea. Atmos. Environ. 2012, 62, 265–271. [Google Scholar] [CrossRef]
Figure 1. Passive sampler designed and used in this study.
Atmosphere 10 00678 g001
Figure 2. Sampling sites in Korea. The passive sampler was evaluated at Kangwon National University (the blue diamond) in Chuncheon (blue area), Korea during three intensive sampling periods. After intensive sampling, the samplers were applied near six cement production facilities (red circles) in Korea.
Atmosphere 10 00678 g002
Figure 3. Injected and recovered Hg amount for the gold-coated beads. The gray numbers above the bars represent the recovery rates.
Atmosphere 10 00678 g003
Figure 4. Increase in Hg uptake mass by the passive sampler with an increase in deployment time.
Atmosphere 10 00678 g004
Figure 5. Change in Hg adsorption on the gold-coated beads (blue circles) and the stainless-steel container (red squares) with an increase in deployment time. The short-dashed lines indicate 95% confidence intervals.
Atmosphere 10 00678 g005
Figure 6. Experimental SR obtained from intensive measurement study.
Atmosphere 10 00678 g006
Figure 7. Comparison between the theoretical and experimental SRs in this study.
Atmosphere 10 00678 g007
Figure 8. Effects of wind speed (left) and temperature (right) on the experimental SR.
Atmosphere 10 00678 g008
Figure 9. The contour plot for wind speed, temperature, and experimental sampling rate.
Atmosphere 10 00678 g009
Figure 10. (a) Correlation between the uptake rate by the passive sampler and the Hg concentration by an active sampler (Tekran 2537X). (b) Relationship between the passive Hg concentration and cement production amount at six locations near the cement plants.
Atmosphere 10 00678 g010
Table 1. Description of measurement periods and locations in this study.
PurposeLocationPeriodDeployment TimeNo. of Samples
Intensive measurements1st period at KNU11 July–8 August 20171–4 weeks4 sets
2nd period at KNU9 August–30 20171–3 weeks3 sets
3rd period at KNU12 September–5 December 20171–4, 6, 8, 10, 12 weeks8 sets
Field applicationNear cement plants23 March–18 April 201826 days6 sets
Chuncheon23 March–18 April 201826 days10 sets