1. Introduction
The Arctic Oscillation (AO) is the leading mode of the extratropical Northern Hemisphere atmospheric circulation variability, and it is most pronounced during boreal winter [
1,
2]. The AO can significantly influence the regional and even hemispheric climate by changing the meridional gradient of the atmospheric pressure and further modifying the atmospheric circulation associated with different phases of AO [
2,
3,
4,
5,
6,
7,
8,
9,
10,
11,
12,
13,
14,
15,
16,
17,
18,
19,
20,
21,
22,
23].
During the positive (negative) phases of the winter AO, there are evident positive (negative) sea level pressure (SLP) anomalies over the midlatitude North Pacific and North Atlantic, and negative (positive) ones over the Arctic region. It could generate large-scale westerly anomalies over the midlatitudes, which bring warm air from the ocean into the continents and cause the widespread warming of the midlatitudes, especially over the Eurasian continent [
2]. Previous studies have also demonstrated that the East Asian winter climate is influenced by AO significantly via affecting the Siberian High or its direct influences over the region north of 40° N [
11,
12,
13,
14,
15,
16,
17,
18,
19,
20,
21,
22], in which processes of the stationary planetary waves play an essential role [
23]. During the positive phases of AO, the East Asian winter monsoon is generally weak, especially over northern East Asia, and the frequency of cold surge reduces, both of which facilitate warmer conditions over East Asia [
11,
12,
13,
14,
15,
16,
17,
18,
19,
20,
21,
22]. Thompson and Wallace [
3] reported that the changed frequency of cold events related to the different phases of winter AO over the Eurasia continent is modulated by the influence of AO on the 500 hPa East Asian trough. Jeong and Ho [
22] indicated that during the negative phases of winter AO, the Siberian high is strengthened, which may deepen the eastward-moving upper-level shortwave trough aloft over Lake Baikal and also facilitate the deepening of the East Asian trough. In this situation, the surface anticyclone moves southward, which facilitates the outbreak of cold surge. Given the close relationship between the winter AO and the simultaneous Northern Hemispheric temperature, some studies suggested that the interdecadal changes of AO’s phases may modulate the recent temperature trends of the Northern Hemisphere, including northern East Asia [
24].
Although many studies have reported that the AO can influence regional temperature, these influences may not be stable [
25,
26,
27,
28,
29,
30]. For example, Li et al. [
26] found that the link between the winter AO and an East Asian winter monsoon index experienced a significant interdecadal change during past decades. Huang et al. [
27] demonstrated that the relationship between the winter AO and the simultaneous Siberian High was not stationary. Given the tangled East Asian winter monsoon indices, a single East Asian winter monsoon index or Siberian High index may not wholly represent the variations of East Asian climate, such as the temperature variation. Although Liu et al. [
28] investigated the possible oscillating relationship between the winter AO and the simultaneous East Asian temperature based on the 20th Century Reanalysis data from European Centre for Medium-Range Weather Forcasts (ERA-20C), only the first mode of northern East Asian temperature variation based on the empirical orthogonal function (EOF) analysis is used to define the East Asian temperature index. Since the first EOF mode in fact cannot fully represent the East Asian temperature variations, the results in Liu et al. (2017) show evident differences compared with that in Li et al. [
26]. Therefore, the direct influence of the AO on the total East Asian winter temperature variation should be investigated. Recently, Gong et al. [
29] indicated that the impact of winter AO on the simultaneous western North American surface air temperature (SAT) is unstable during past decades. The link between the winter AO and the western North American SAT is strong during 1920–1959 and 1986–2010, and weak during 1960–1985. They suggested that the multidecadal changes in the relationship between the winter AO and the simultaneous western North American SAT are mainly modulated by the multidecadal fluctuation of the North Pacific center of the wintertime AO. To date, it is still unclear whether the direct impact the winter AO on the simultaneous East Asian SAT has changed during the past decades. Following our previous study [
29], the objective of this study is to explore whether the link between the winter AO and the simultaneous East Asian winter temperature also experience evident decadal changes during the past decades. If so, what is the crucial process responsible for the changes? Understanding such decadal changes has important implications for the prediction of the East Asia winter SAT anomalies.
The rest of this study is organized as follows:
Section 2 provides the dataset and methods used in this study.
Section 3 presents the results of this study, including the decadal changes in the influence of the winter AO on the simultaneous East Asian SAT and the underlying mechanism for the changes. A summary and discussion are shown in
Section 4.
3. Results
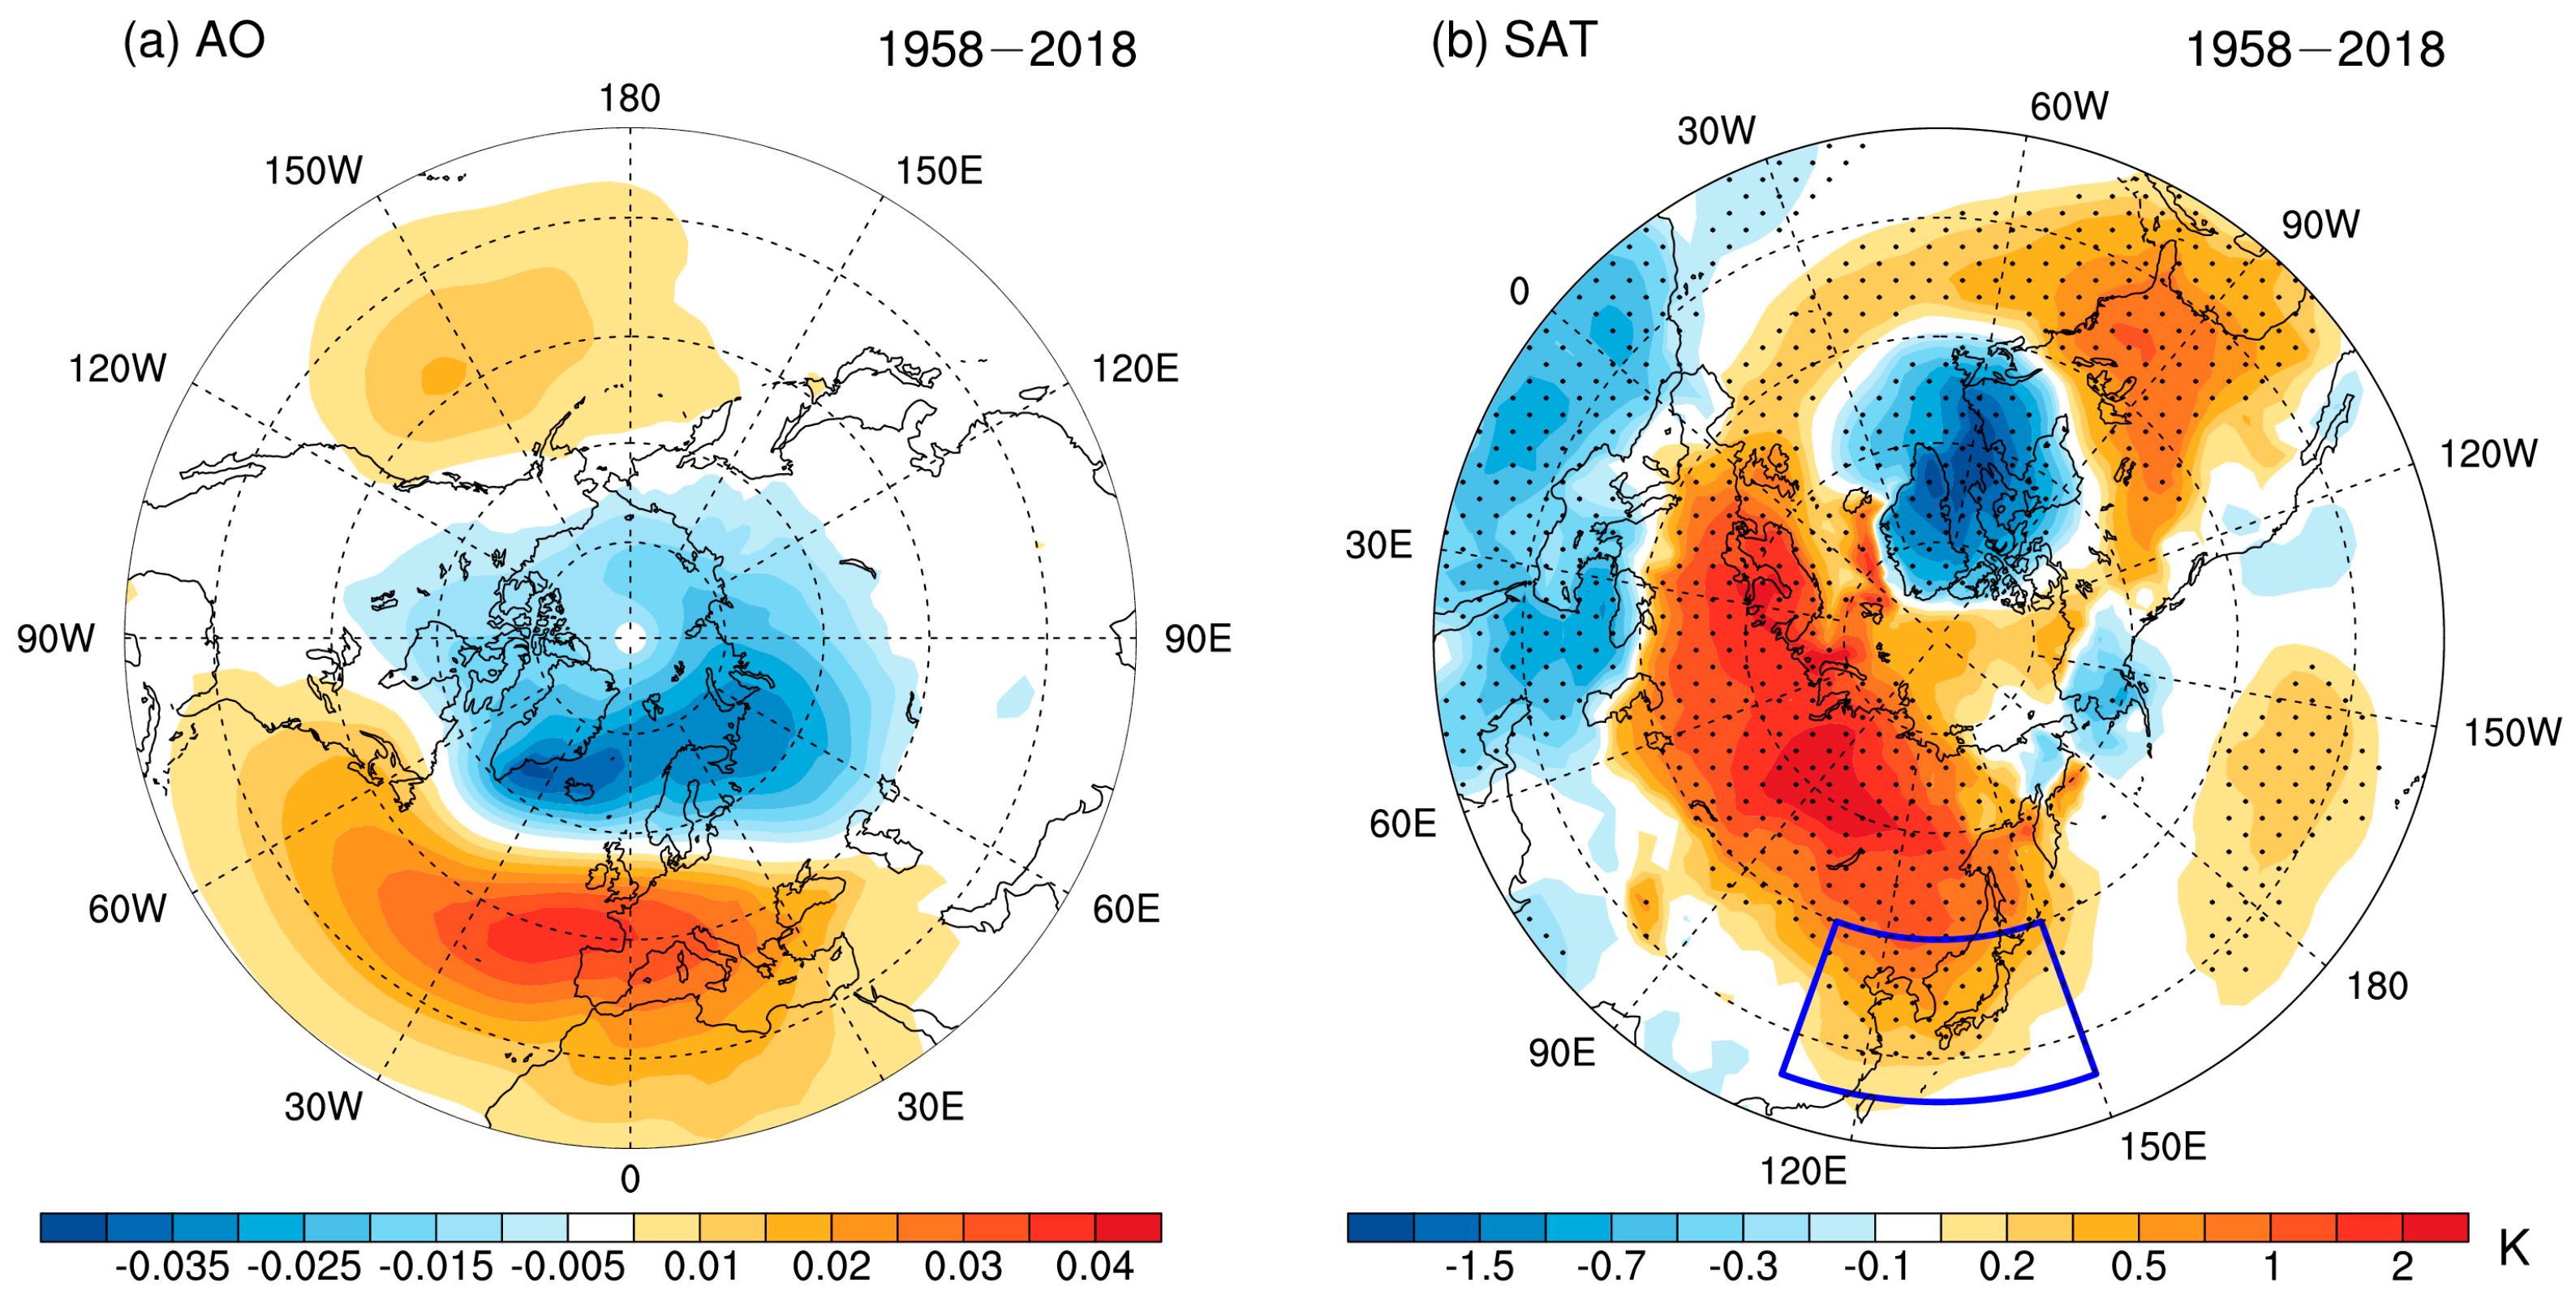
Figure 1a displays the wintertime (December to February) AO pattern, which is defined as the leading mode of SLP variability over the extratropical Northern Hemisphere during 1958–2018. The winter AO pattern (
Figure 1a) is featured by a pronounced seesaw in the SLP anomalies between the Northern Hemispheric midlatitudes and the Arctic region. Two anomalous high SLP centers are located over the North Atlantic and North Pacific, respectively, and an anomalous low SLP center is observed in the Arctic region in the positive phases of the AO. This SLP anomaly pattern reflects the seesaw feature of atmospheric mass between the midlatitudes and the Arctic region. The seesaw structure is most pronounced over the Atlantic section, which resembles the North Atlantic Oscillation [
32,
33].
Figure 1b exhibits the winter SAT anomalies regressed onto the simultaneous normalized AO index over the Northern Hemisphere during 1958–2018. During the positive phases of the AO, there is significant warming over the mid and high latitudes of the Eurasian continent, and the warming extends southward to northern East Asia. The maximum warming center is located in the central Siberia, at a rate exceeding 2K (58 year)
−1. This result indicates that the winter AO can significantly influence the simultaneous East Asian SAT during 1958–2018 and is also consistent with the previous findings [
11,
12,
13,
14,
15,
16,
17,
18,
19,
20,
21,
22].
One question is whether the influence of the wintertime AO on the East Asian SAT is stable or varied with time. To answer this, the East Asian winter SAT index is defined as the area-averaged wintertime SAT over East Asia (EAT, 25°–45° N, 110°–150° E) to represent the winter SAT variations of East Asia. Since this region covers the central regions of East Asia, it could well represent the total SAT variations of East Asia.
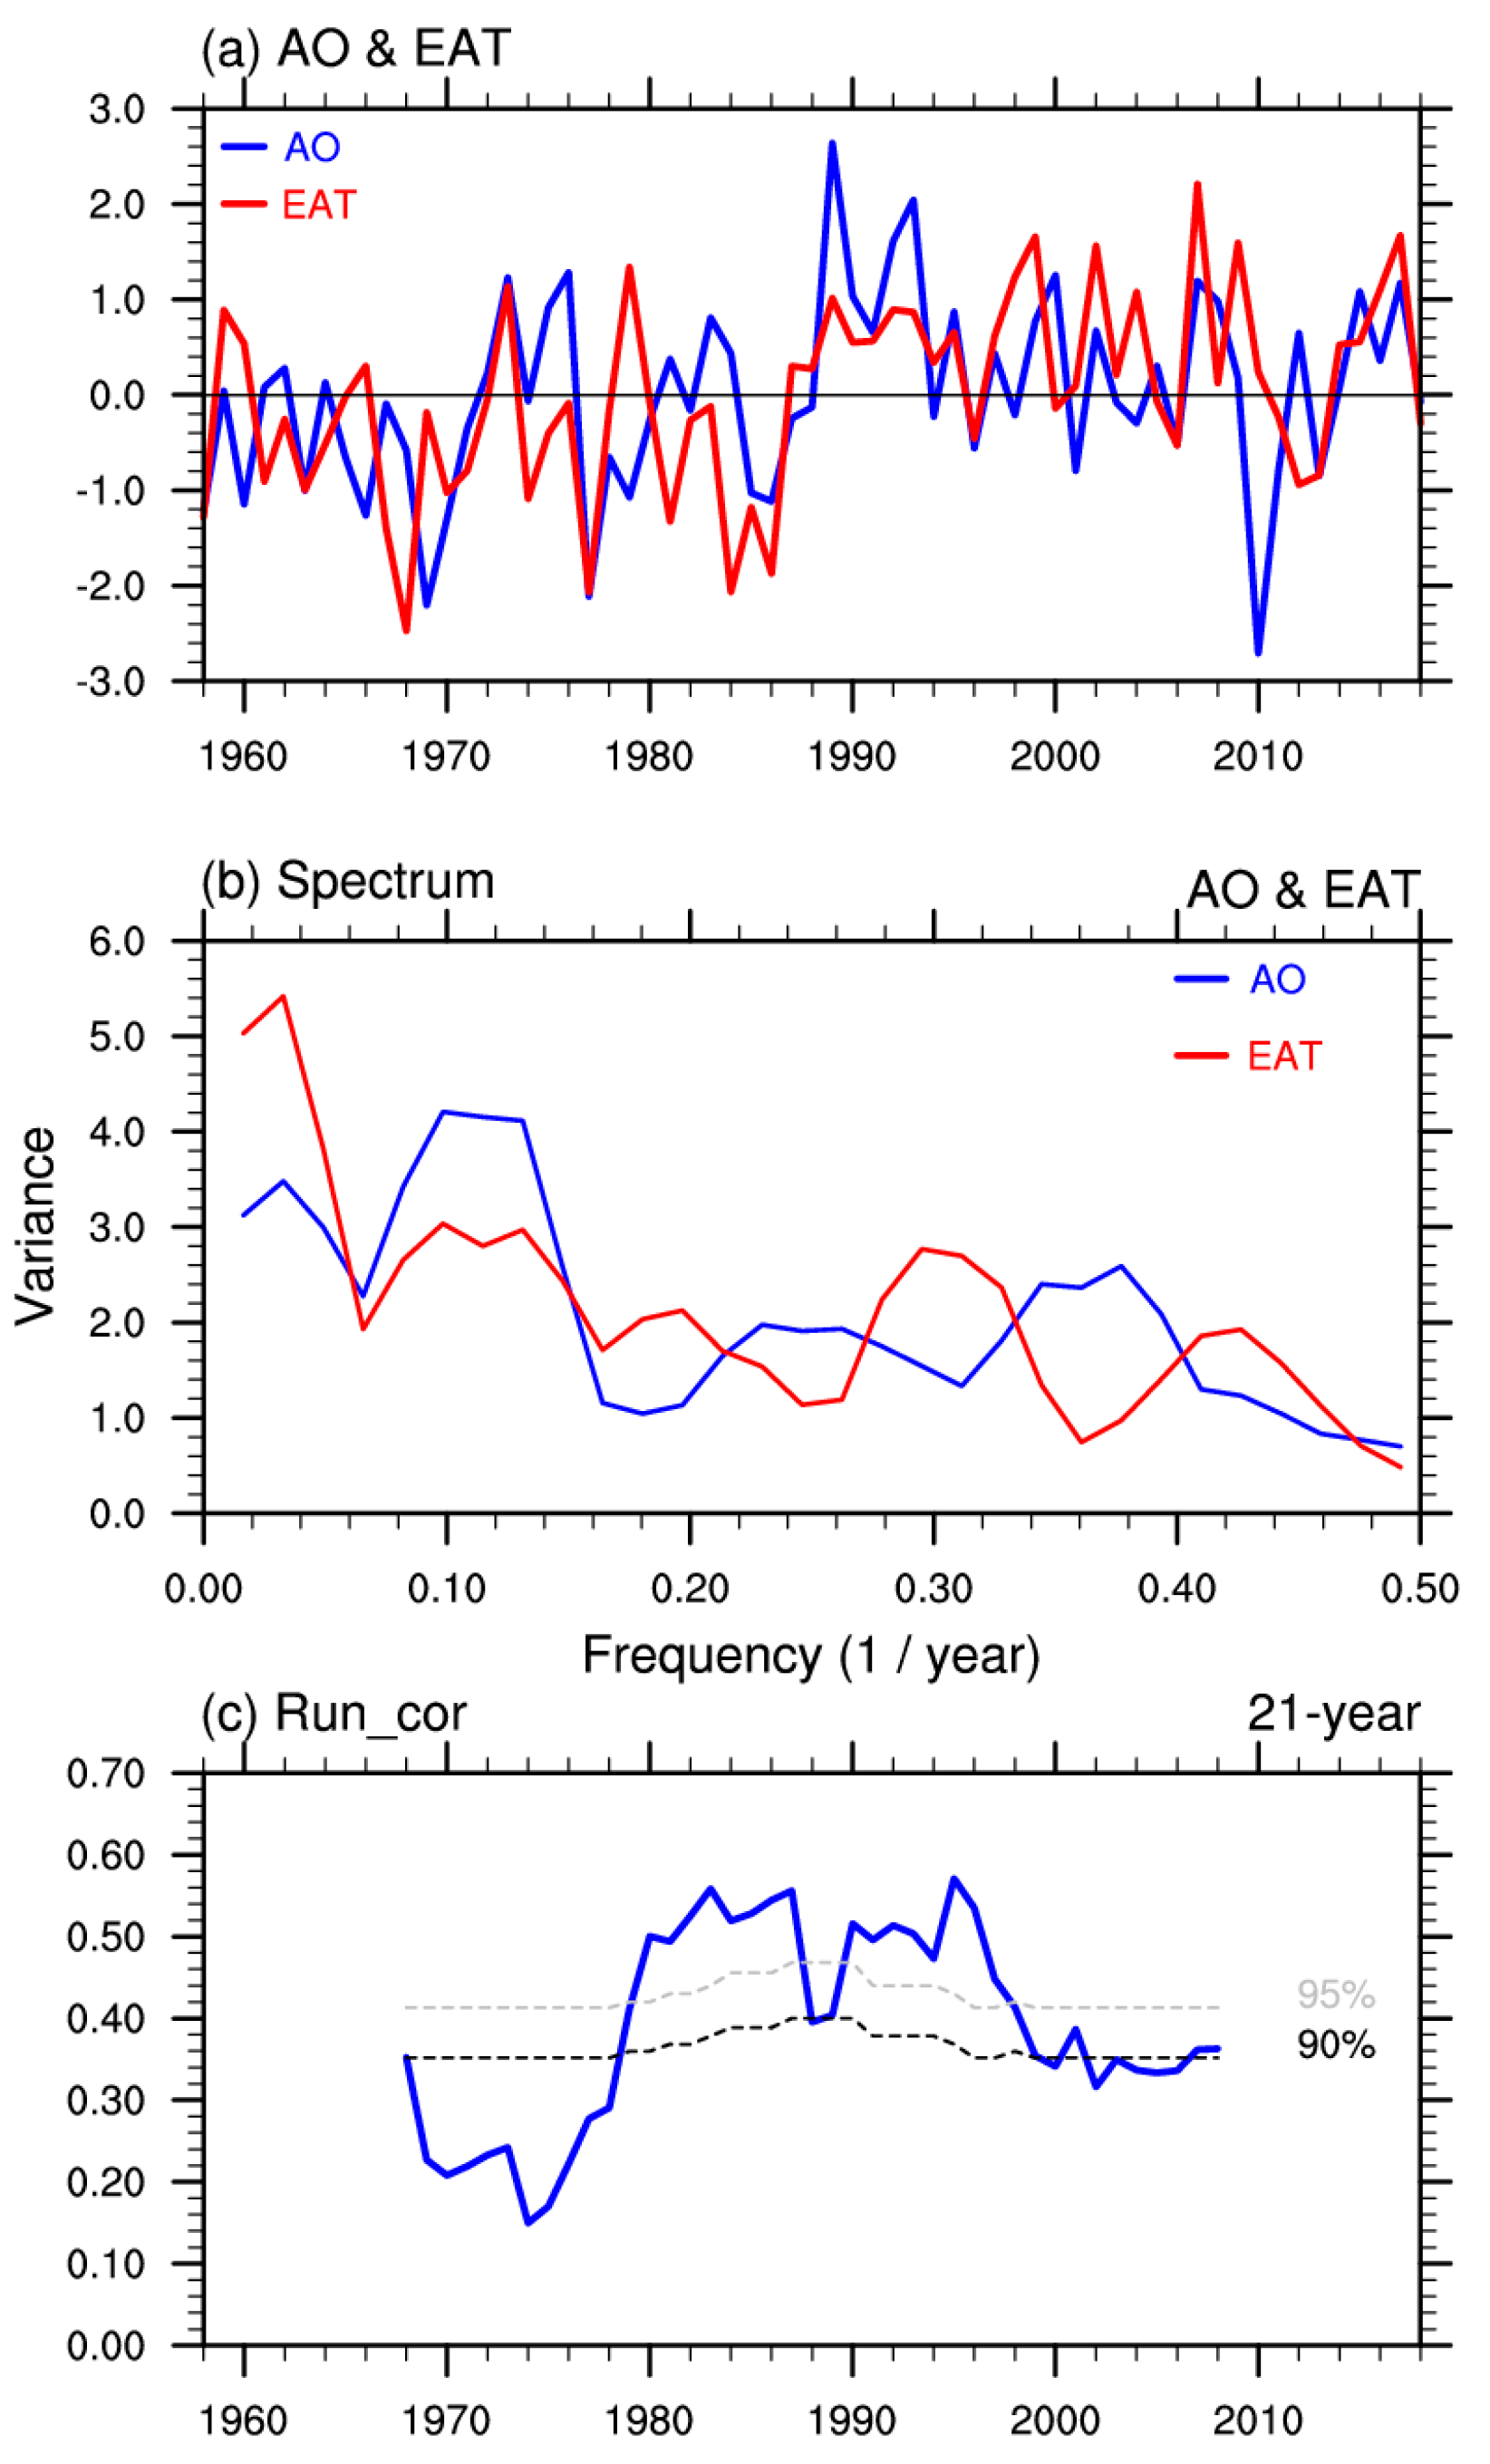
Figure 2a displays the normalized time series of winter EAT index and the simultaneous AO index during 1958–2018. Both interdecadal and interannual oscillations exist in the AO and EAT indices. The AO index shows a spectrum peak around 2~3 year and 6~15 year. Although the power spectrum of EAT is largely contributed by low-frequency variations, it also shows a similar spectrum peak around 8~15 year as that in AO index (
Figure 2b). The correlation coefficient between the wintertime EAT index and the concurrent AO index reaches 0.43 during 1958–2018, exceeding the 95% confidence level. This result confirms that the winter AO exerts a significant influence on the simultaneous EAT. However, a careful examination indicates that the in-phase winter AO–EAT relationship is not stationary during 1958–2018 (
Figure 2a). This result is confirmed by the 21-year sliding correlations between the winter EAT index and the simultaneous AO index (
Figure 2b). Note that the years shown in the
x-axis of
Figure 2b correspond to the central year of the 21-year sliding window. From
Figure 2b, we can see that the correlation coefficients between the winter EAT index, and the simultaneous AO index are not stationary during 1958–2018. It is not significant at the 90% confidence level before the late 1970s and after the early 2000s (
Figure 2b). In contrast, the winter EAT index has a significant positive correlation with the simultaneous AO index during the late 1970s through the early 2000s. We also tested windows with other widths (e.g., 19 and 23 years), and the main results remain almost unchanged (figures not shown).
To reveal the possible physical processes responsible for the oscillating winter AO–EAT relationship during the past decades, two periods with the lowest and highest correlations according to the 21-year sliding correlation are singled out for the contrasting analysis throughout this study. According to
Figure 2b, the periods of 1964–1984 and 1985–2005 are selected to represent the lowest and highest period of winter AO–EAT relationship during 1958–2018. The selected periods are different from those in Liu et al. [
28], but are essentially consistent with those in Li et al. [
26].
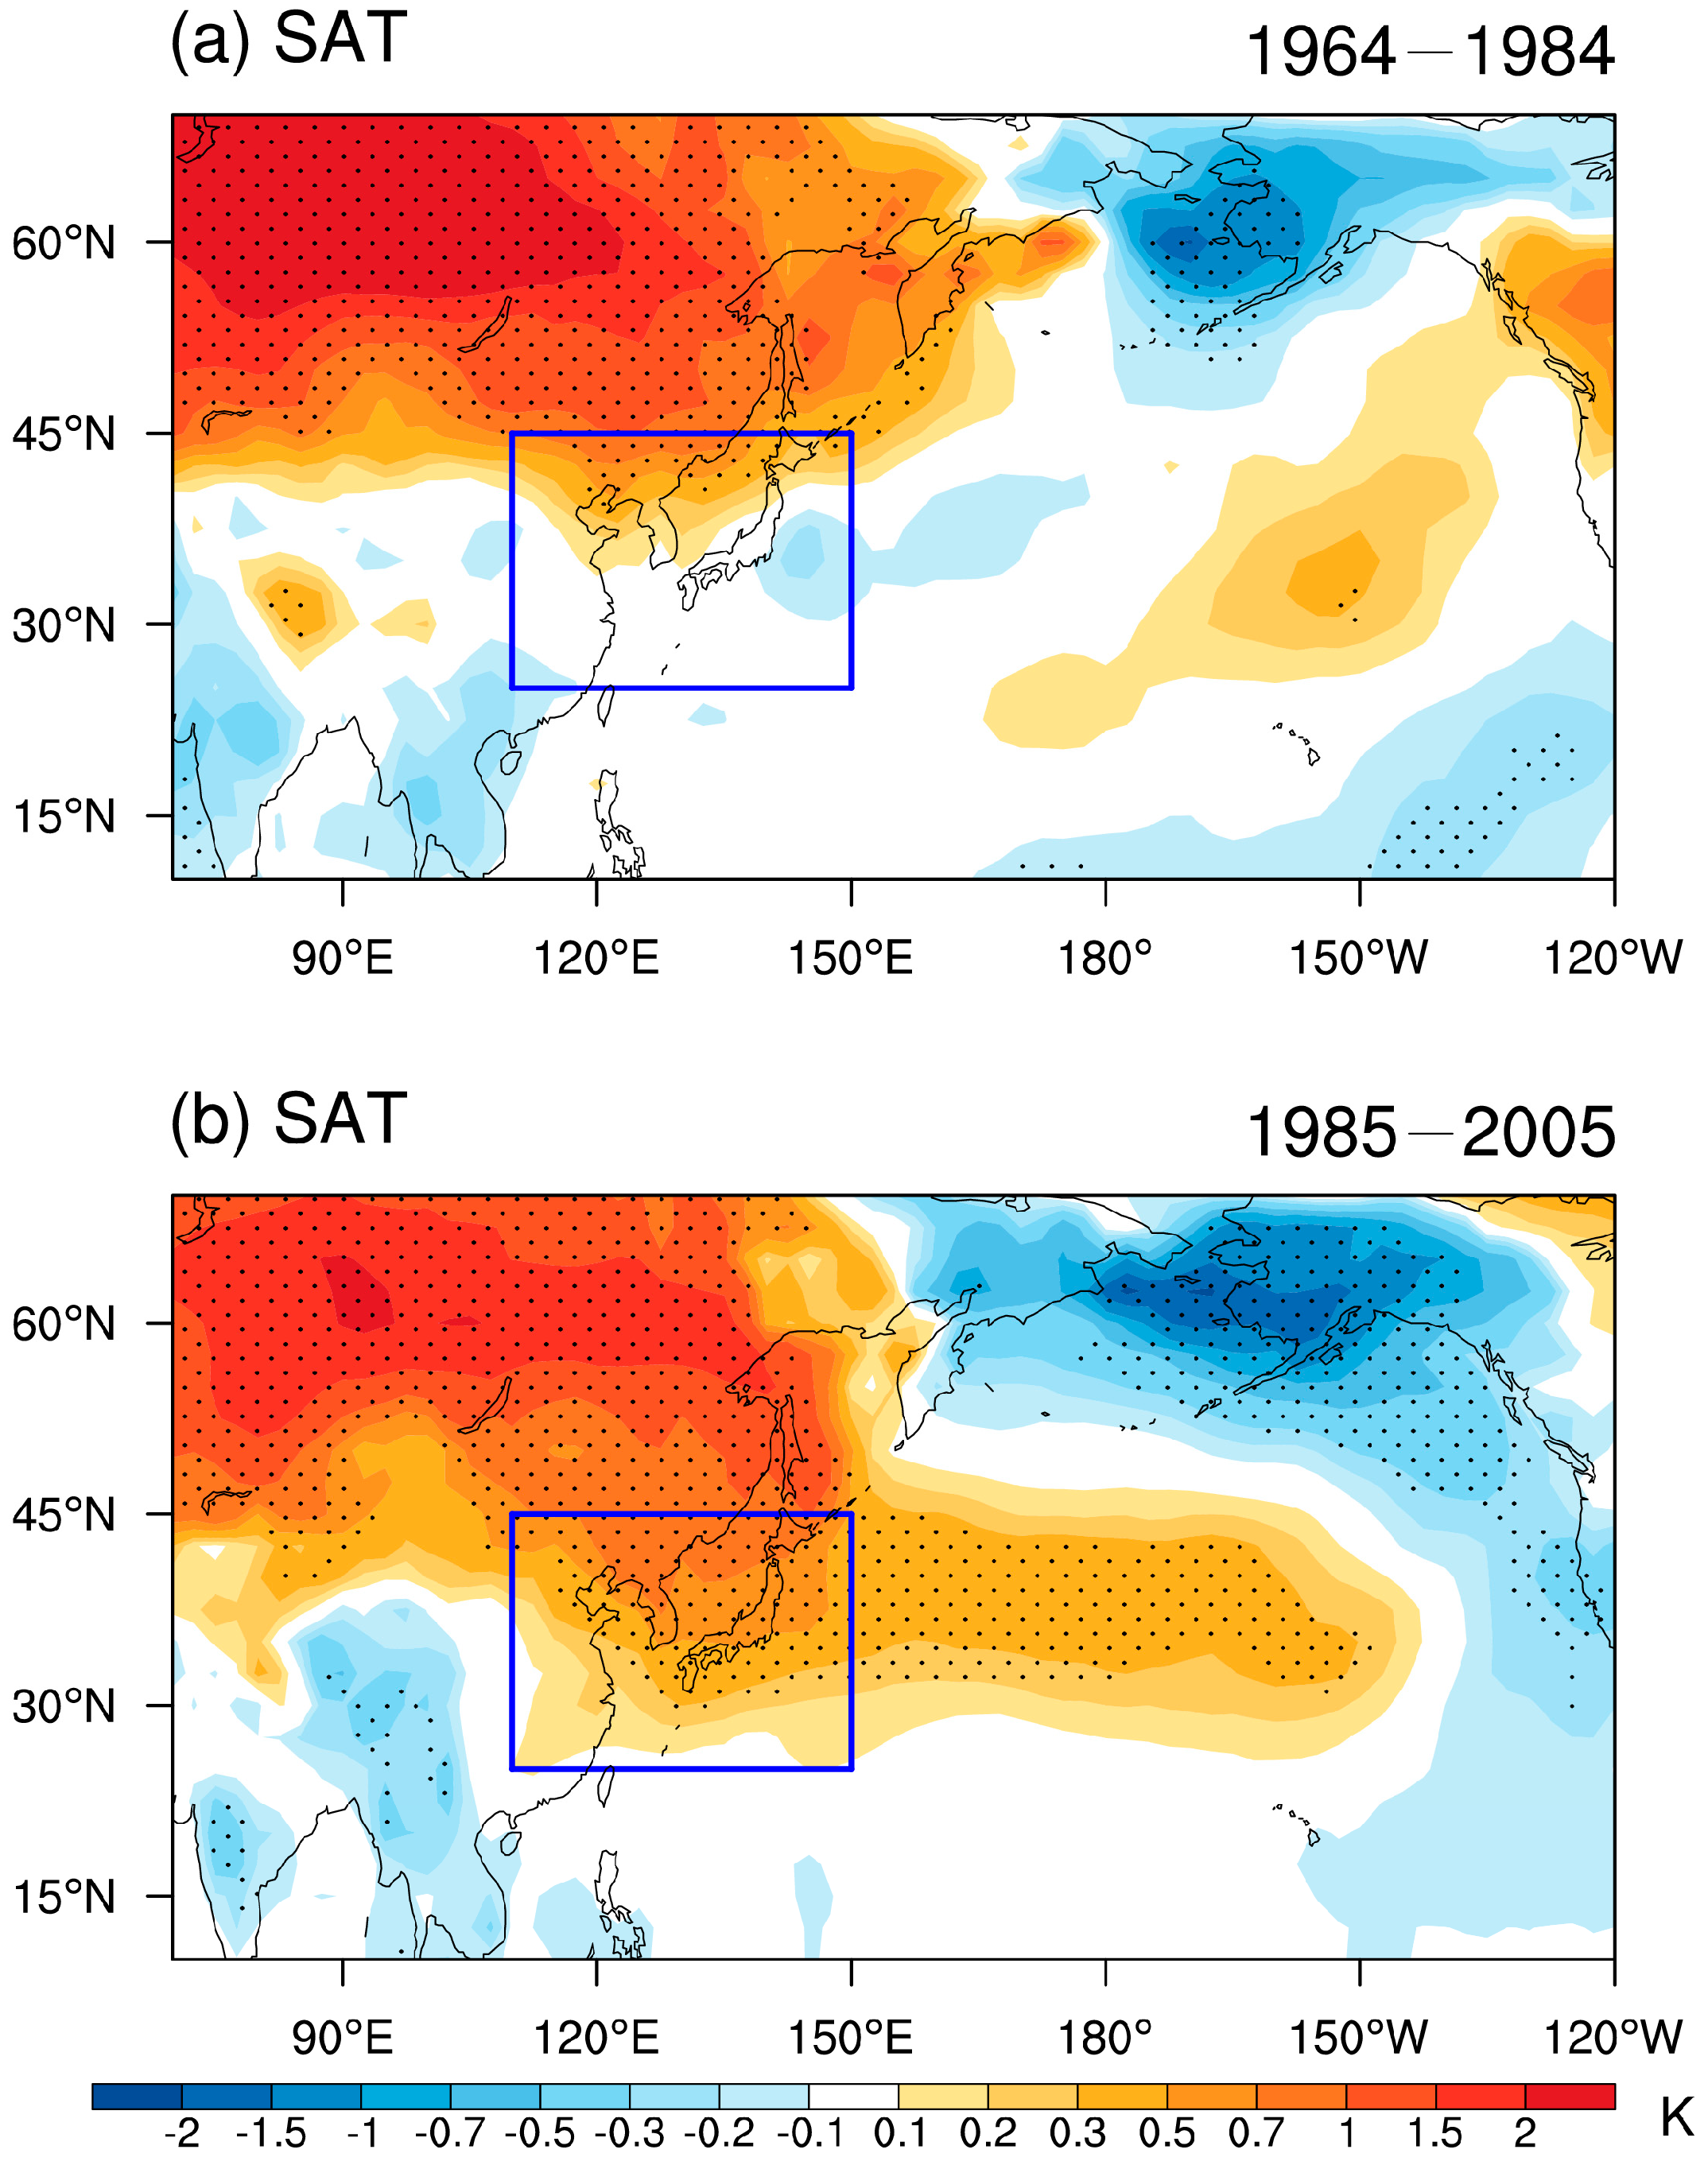
Figure 3a,b shows the regressed winter SAT anomalies against the winter AO index over East Asia during the two periods, respectively. Although the SAT warming in the northern Eurasian continent is somewhat similar, the winter AO-related SAT anomalies over East Asia display notable differences between the two periods. During 1964–1984, in association with positive AO, the SAT warming is confined in the north of 40° N of East Asia (
Figure 3a), which induces a limited impact of the winter AO on the simultaneous East Asian SAT. In contrast, the wintertime AO-related SAT warming extends southward to 25° N over East Asia and even extends southeastward to the western North Pacific during 1985–2005 (
Figure 3b). This AO-induced widespread warming over East Asia facilitates the establishment of the AO–EAT relationship.
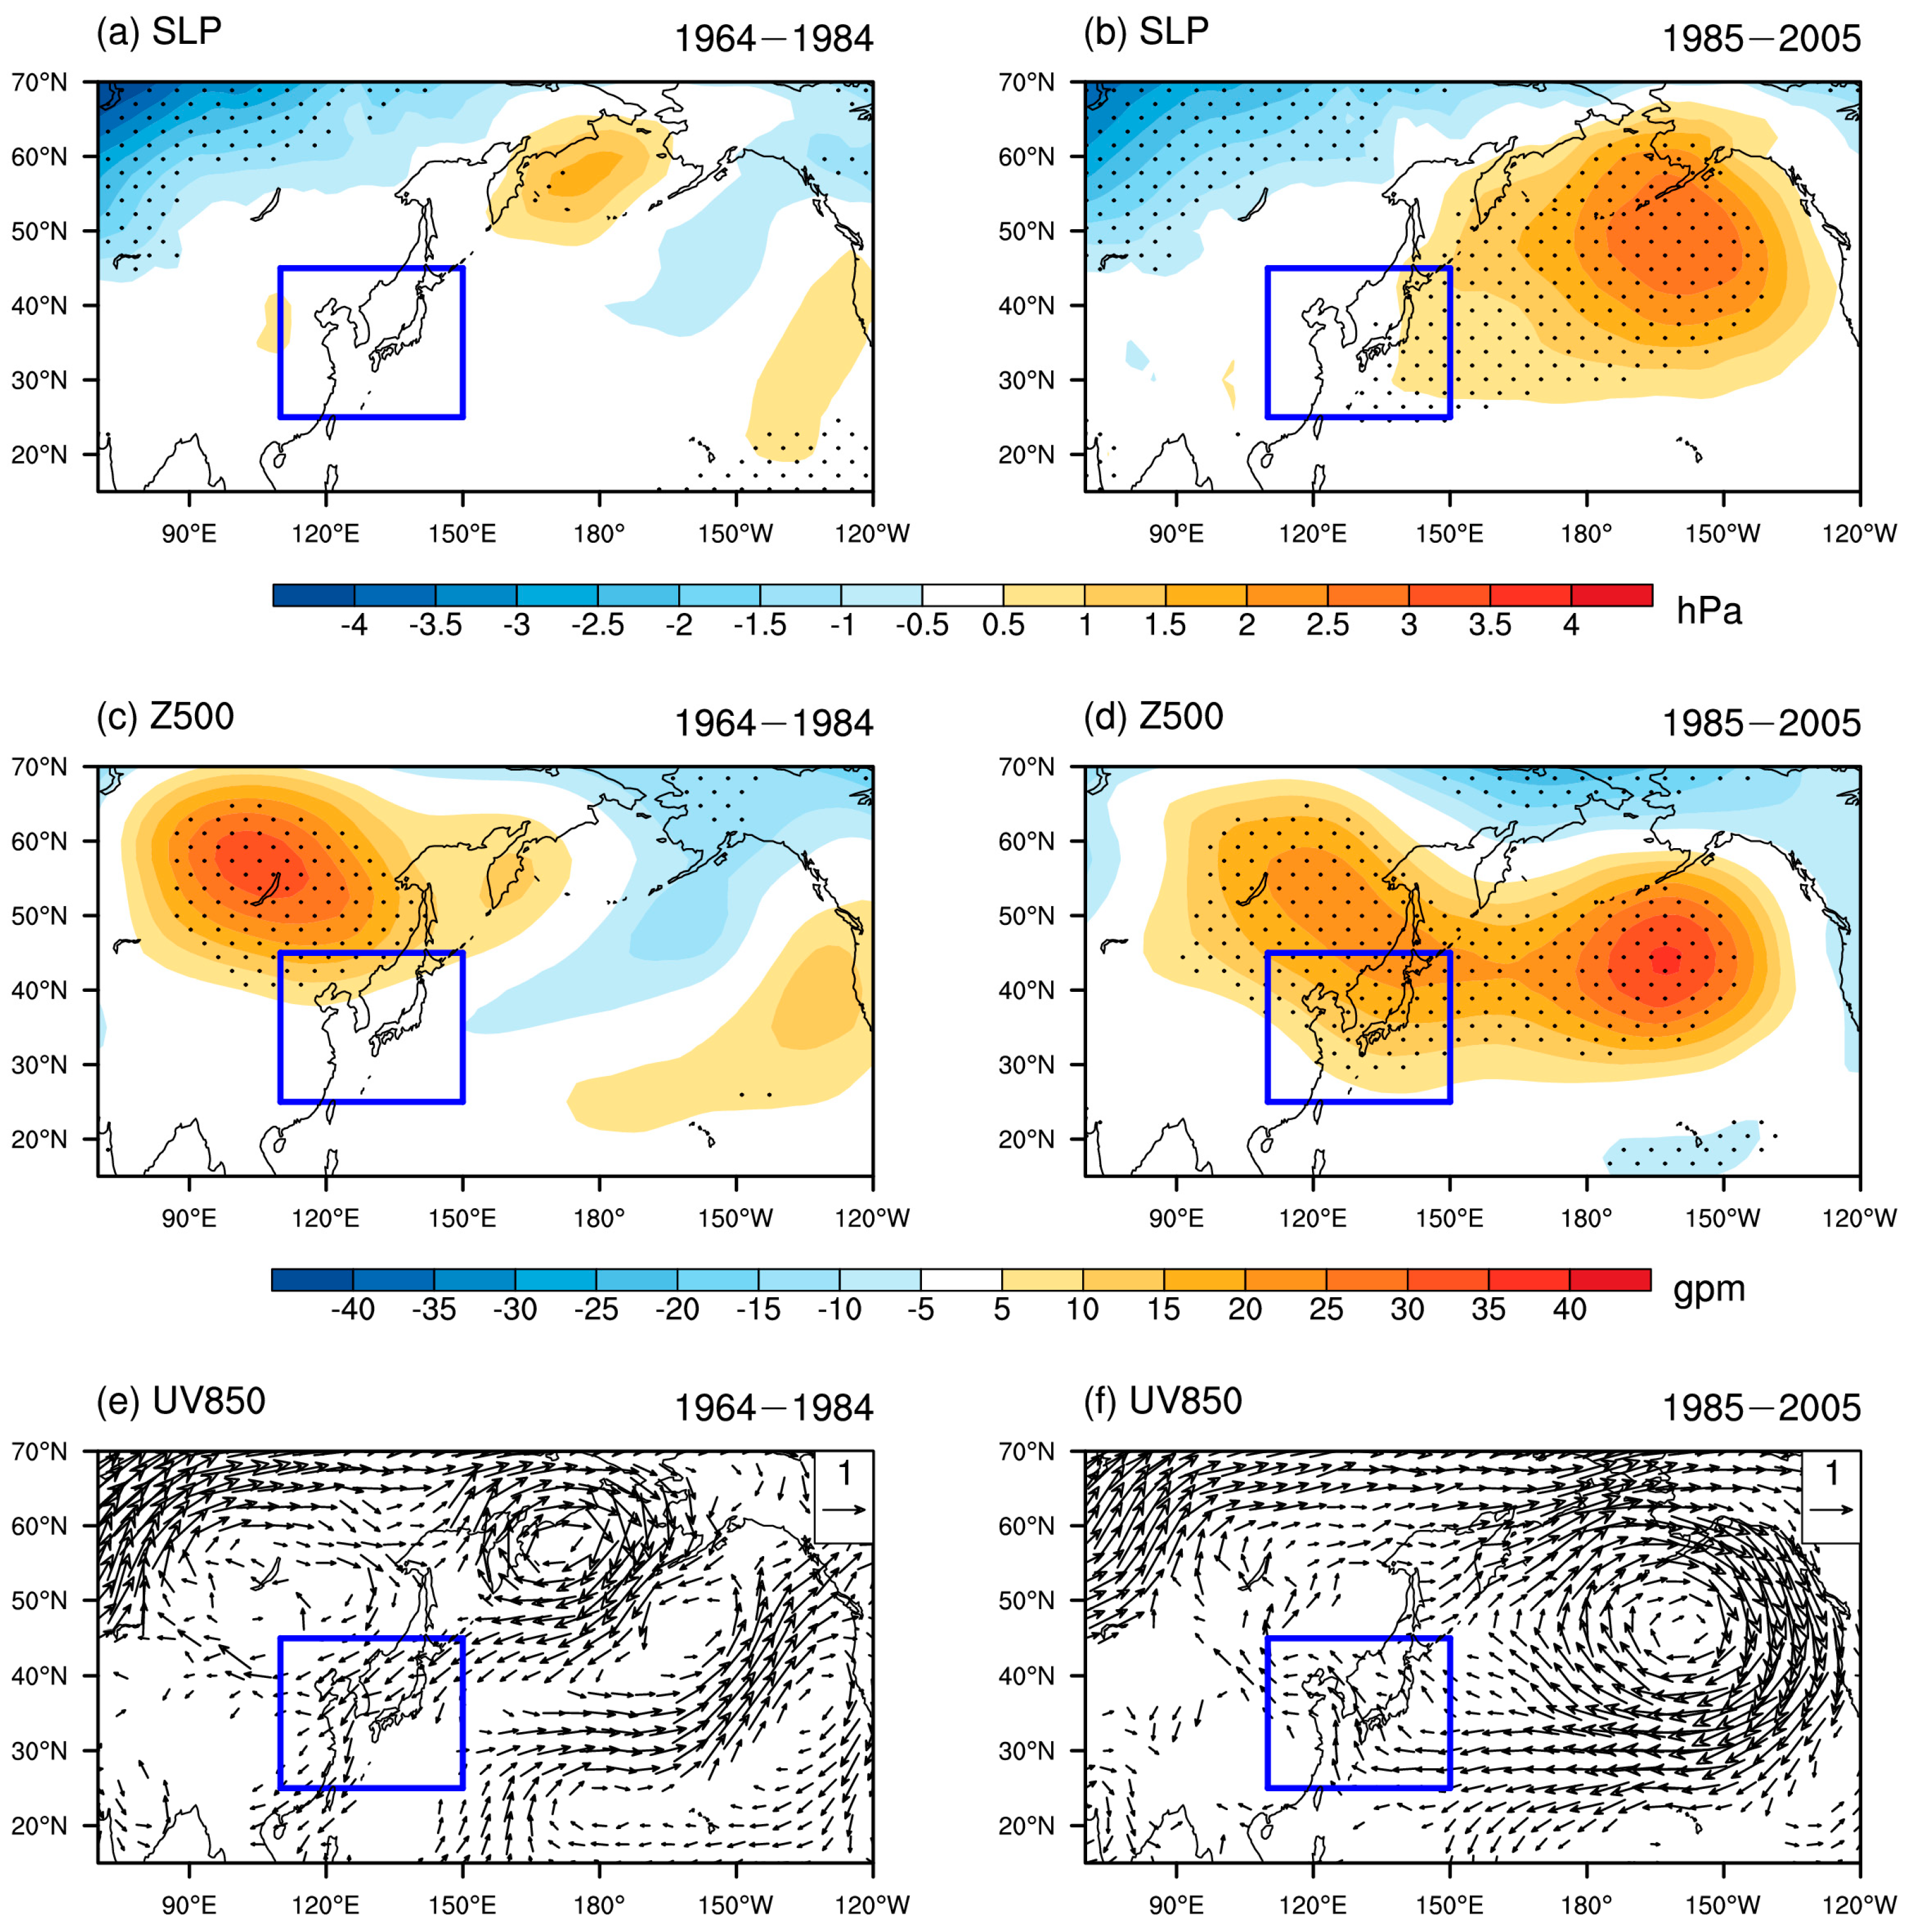
To identify the reason responsible for the change in the wintertime AO–EAT relationship around the mid-1980s, the wintertime anomalies of SLP, 500 hPa geopotential height, and 850 hPa winds related to the winter AO during 1964–1984 and 1985–2005 are displayed in
Figure 4. Although the SLP anomalies associated with the winter AO are somewhat similar over the Eurasian continent, it exhibits evident differences over the North Pacific region between two periods (
Figure 4a,b). During 1985–2005, pronounced positive SLP anomalies are seen over the North Pacific region, whereas it is much weaker and insignificant during 1964–1984. The similar differences are also shown in the 500 hPa geopotential height anomalies related to the winter AO (Z500) (
Figure 4c,d). During 1985–2005, the strong positive geopotential height anomalies are observed from the eastern Eurasian continent to the North Pacific (
Figure 4d). During 1964–1984, by contrast, significant positive geopotential height anomalies are only seen over the east Eurasian continent. There are no significant geopotential height anomalies seen aloft over the North Pacific (
Figure 4c). The similar differences in SLP and Z500 between the two periods imply the quasi-barotropic characteristics of the AO’s structure. The winter AO-related temperature anomalies are caused by the temperature advection anomalies related to the phases of AO, as reported in previous studies [
2,
3]. Therefore, we further present the winter AO-related winds anomalies at 850 hPa (UV850) between two periods (
Figure 4e,f). Similarly, remarkable differences also appear over the North Pacific regions. During 1985–2005, there is a strong anomalous anticyclonic circulation located in the North Pacific to the eastern Eurasian continent. In this situation, the southeasterly anomalies on the west side of the anticyclone bring warm air from the ocean to the coast of East Asia, which induces widespread warming over East Asia (
Figure 4f). In contrast, the anticyclonic circulation anomalies are weak and shifted northward in the North Pacific region (
Figure 4e). The northeasterly anomalies in the southeast side of anticyclone circulation over the eastern Eurasian continent are not favorable for warming on the coast of East Asia during 1964–1984 (
Figure 4e).
It can be concluded from
Figure 4 that the most remarkable difference of the winter AO-related simultaneous East Asian SAT anomalies between the two periods is primarily related to the pronounced differences of atmospheric circulation anomalies associated with the winter AO over the North Pacific region. During 1985–2005, positive geopotential height anomalies and accompanying southeasterly wind anomalies are evident in the North Pacific and the coast of East Asia, respectively (
Figure 4f,d). In contrast, during 1964–1984, the positive geopotential heights anomalies are much weaker and less significant over the North Pacific region compared to those during 1985–2005. The resultant southerly wind anomalies are weak and even reversed to northerly wind anomalies in East Asia during 1964–1984 (
Figure 4c,e,g).
Gong et al. [
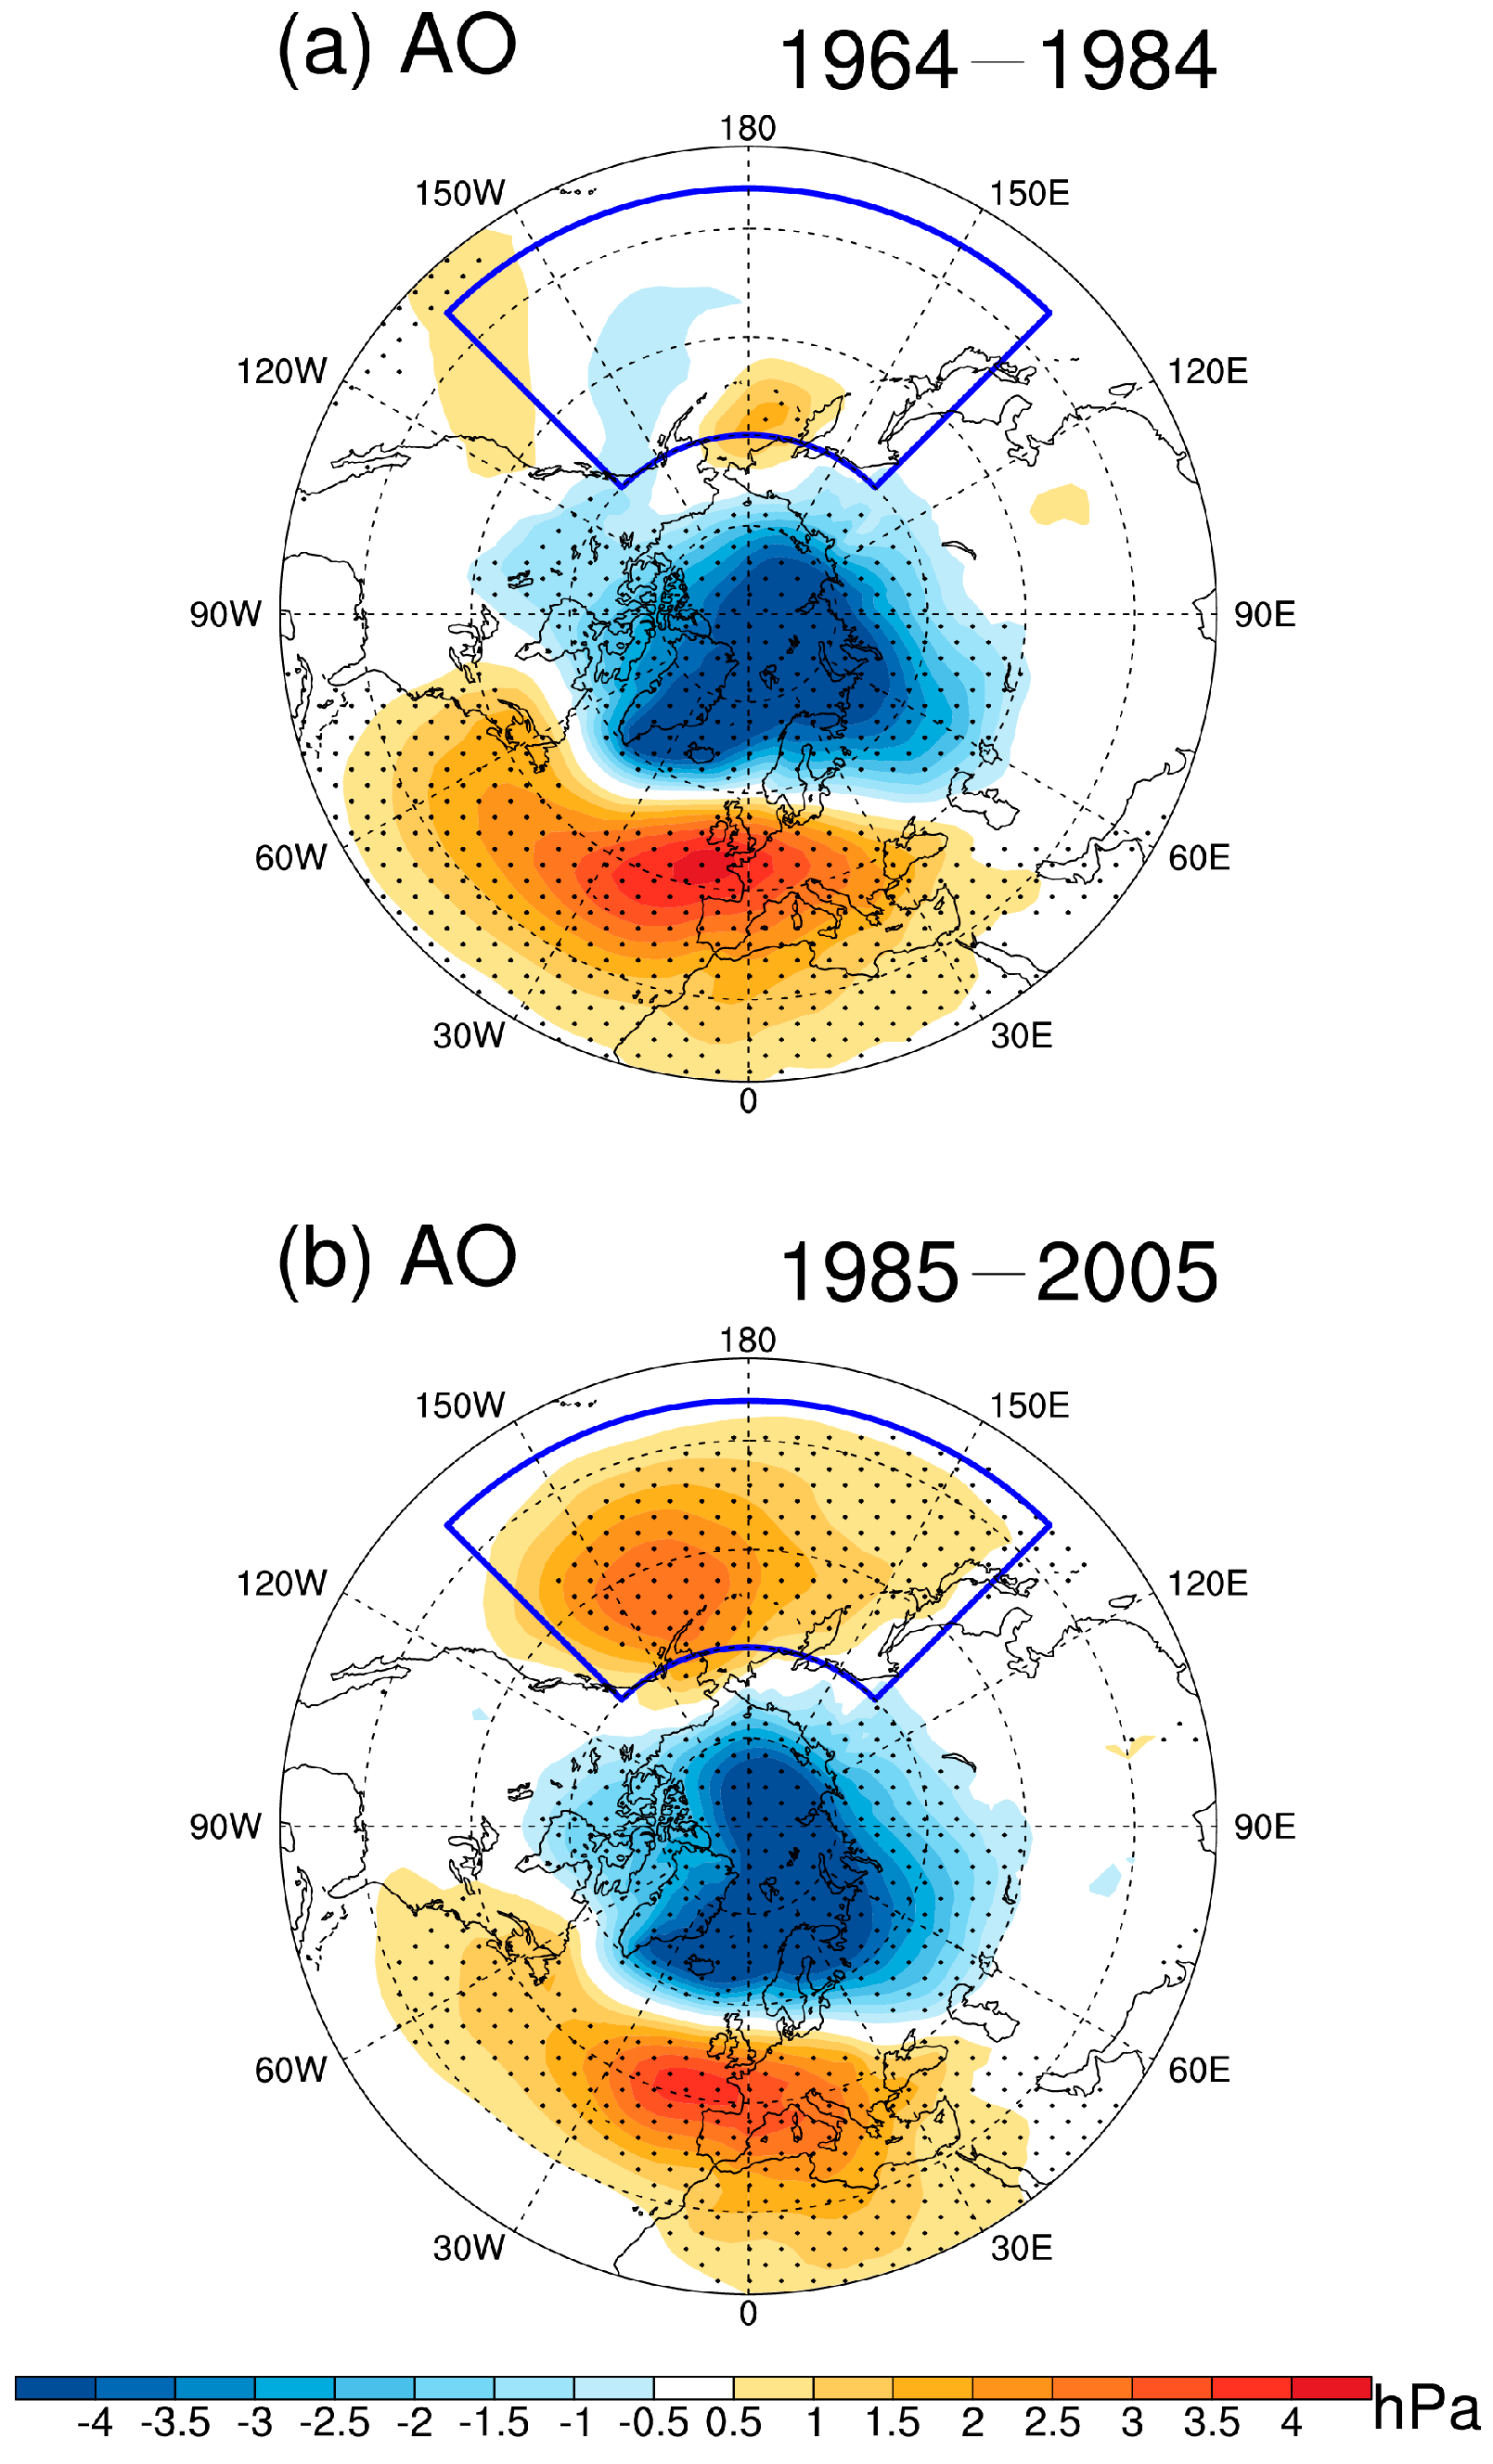
29] indicated that the unstable link between the winter AO and SAT over the western North American is attributed to the varied AO pattern during past decades. Is the unstable winter AO–EAT relationship also related to the varied winter AO pattern? The above results suggest that the varied atmospheric circulation anomalies associated with the winter AO over the North Pacific region may contribute to the unstable winter AO–EAT relationship during past decades. To answer this question, the winter AO patterns are displayed in
Figure 5, which are obtained by regressing the SLP onto the corresponding AO index during the two periods. Distinct differences in the winter AO pattern between the two periods are mainly in the North Pacific region. It is clear that the North Pacific center of the winter AO pattern is more pronounced during 1985–2005 (
Figure 5b), whereas it is much weaker and almost disappears during 1964–1984 (
Figure 5a). This result suggests that the time-varying AO–EAT relationship during boreal winter may also be attributed to the multidecadal changes of the winter AO pattern.
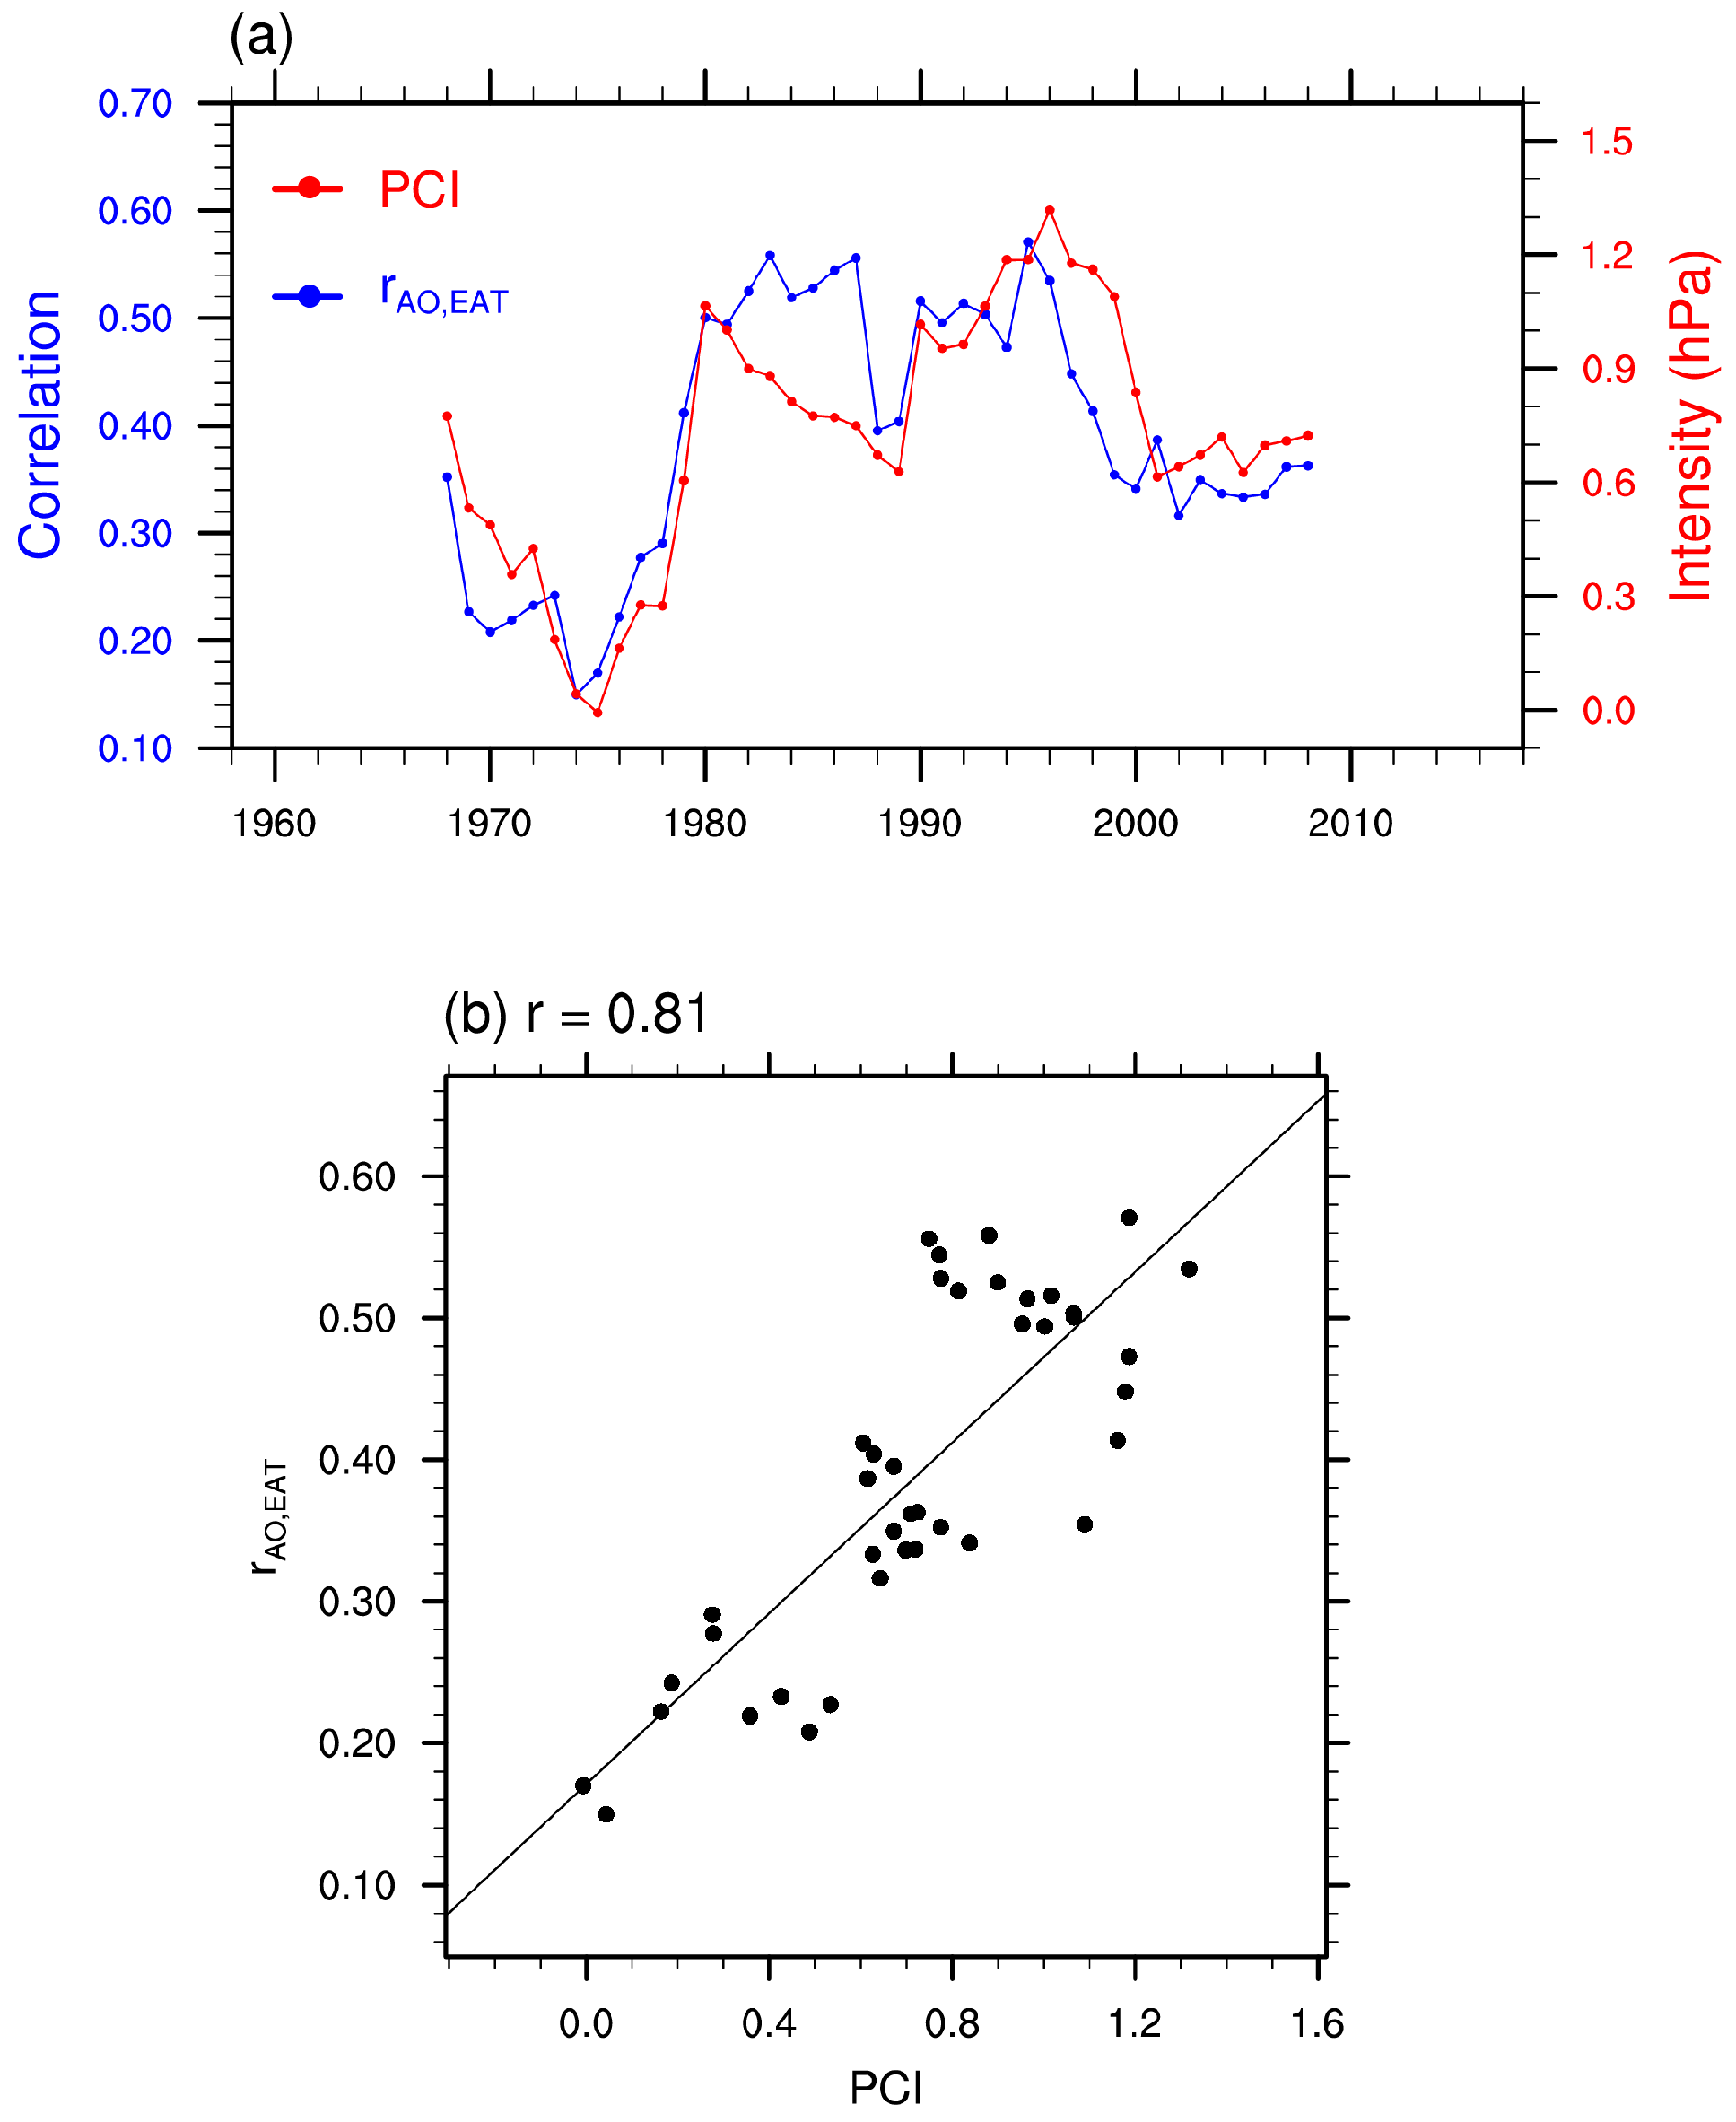
To further examine whether the winter AO–EAT relationship is linked to the varied North Pacific center of the wintertime AO during past decades, the winter AO-related North Pacific center intensity index is defined as area-averaged winter AO-related SLP anomalies over the North Pacific region (PCI, 25°–60° N, 135°E–135° W) to depict the magnitude of North Pacific center of winter AO pattern. The winter AO–EAT relationship is measured by the correlation coefficient between the winter EAT index and the simultaneous AO index (i.e., r
AO,EAT).
Figure 6a displays the sliding PCI and r
AO,EAT with a 21-year window. It shows that the phases of r
AO,EAT indeed have a high degree of consistency with the PCI, which represents the sliding intensity of the North Pacific center of the wintertime AO pattern during 1958–2018. Moreover, a scatter diagram between r
AO,EAT (
y-axis), and PCI (
x-axis), based on the 21-year moving epoch, is shown in
Figure 6b, in which each solid black circle represents the value of each moving epoch. Linearly clustered dots can also be seen clearly in the scatter diagram between the PCI and r
AO,EAT in the 21-year moving epoch during 1958–2018 (
Figure 6b). The correlation coefficient between the sliding PCI and sliding r
AO,EAT reaches 0.81, and the PCI contributes 65.6% of the variance of the r
AO,EAT variability during 1958–2018 (
Figure 6b). These results support the previous hypothesis that the multidecadal fluctuation of the winter AO–EAT relationship is largely attributed to the multidecadal changes of the North Pacific center of the winter AO. Our finding provides new insight into the explanation of the oscillating winter AO–EAT relationship.
4. Summary and Discussion
Many studies have reported that the winter AO can significantly influence the simultaneous EAT [
11,
12,
13,
14,
15,
16,
17,
18,
19,
20,
21,
22]. In this study, we give evidence that the influence of winter AO on the simultaneous EAT is not stationary and experienced evident decadal changes, starting around the mid-1980s. The impact of winter AO on the simultaneous EAT is insignificant and mainly confined in the north of 40° N of East Asia during the period 1964–1984, whereas the winter AO exerts a significant and widespread influence on the simultaneous EAT during the period 1985–2005.
The decadal changes of the AO–EAT relationship in boreal winter are primarily related to the decadal variations of the North Pacific atmospheric circulation anomalies related to the winter AO. During 1985–2005, a pronounced anticyclonic circulation anomaly is seen over the North Pacific, which associated with the positive phases of AO. The southeasterly wind anomalies on the west side of the anticyclone bring warm air from the ocean to the coast of East Asia, which induces widespread warming over East Asia and leads to a significant winter AO–EAT relationship in this period. In contrast, during 1964–1984, the winter AO-related North Pacific atmospheric anticyclone circulation anomalies disappear, and an anticyclone circulation anomaly is mainly observed in the eastern Eurasian continent. The resultant northeasterly wind anomalies in the southeast side of the anomalous anticyclone are not favorable for warming on the coast of East Asia, which induces insignificant winter AO–EAT relationship in this period. Further investigation suggests that the multidecadal fluctuation of the winter AO–EAT relationship is essentially attributed to the multidecadal changes of the North Pacific center in the winter AO. When the North Pacific center of the winter AO is strong (weak), the winter AO–EAT relationship is tight (loose). The magnitudes of the North Pacific center of the winter AO can explain 65.6% variance of the winter AO–EAT variations during 1958–2018. We also perform a parallel analysis using NCEP reanalysis for the period 1958–2018. The results are almost the same as those in the JRA-55 data (figure not shown) which confirm the robustness of our conclusions. Therefore, more attention should be paid to predict the winter AO-related SAT anomalies over East Asia due to the significant multidecadal changes in its pattern.
The mechanism responsible for formating the North Pacific center of AO has been widely discussed in the previous studies. Ambaum et al. [
33] considered a three-point seesaw system representing three centers of action: the Arctic, Euro–Atlantic, and Pacific regions. They suspected that North Pacific center of the AO may be produced from the North Pacific variability. Gong et al. [
29] further indicated that the varied North Pacific center of AO may be related to the oscillating coupling of dominant atmospheric circulation variability between the North Pacific and North Atlantic. Moreover, some other studies reported that the intensity of Pacific center of the AO pattern can also be modulated by the stratospheric polar vortex [
34,
35,
36,
37,
38]. It is strong and clear when the stratospheric polar vortex is strong, and it is weak when the stratospheric polar vortex is weak [
34]. A stronger stratospheric polar vortex could induce more planetary waves to reflect from the North Pacific to the North Atlantic and strengthen the coupling of atmospheric circulation between the North Pacific and North Atlantic, which facilitates more North Pacific variability to be involved in the AO variability and forms a stronger North Pacific center of AO [
35]. This mechanism also exists in climate models [
38].
Although the AO is largely generated by the internal atmospheric dynamics [
39,
40], it may also be influenced by the underlying sea surface temperature [
41,
42,
43,
44,
45]. The decadal oscillation of atmospheric variations may be partly related to the decadal variations of sea surface temperature over the North Pacific and North Atlantic. Preliminary inspection suggests that the multidecadal changes of North Pacific center of AO may be partly related to the phase of the Atlantic Multidecadal Oscillation and the Pacific Decadal Oscillation, especially before the 1980s (figure not shown). The above results suggested that the factors responsible for the varied North Pacific center of AO are complicated and need to be systematically investigated in future studies.


