Article

Observed Exposure of Population and Gross Domestic Product to Extreme Precipitation Events in the Poyang Lake Basin, China

1
Jiangxi Eco-meteorological Centre, Nanchang 330046, China
2
Institute for Disaster Risk Management (iDRM)/School of Geographical Science, Nanjing University of Information Science & Technology, Nanjing 210044, China
3
National Climate Center, China Meteorological Administration, Beijing 100081, China
*
Author to whom correspondence should be addressed.
Atmosphere 2019, 10(12), 817; https://doi.org/10.3390/atmos10120817
Submission received: 29 October 2019 / Revised: 29 November 2019 / Accepted: 13 December 2019 / Published: 16 December 2019
(This article belongs to the Section Meteorology)

Abstract

:
Based on the observation data from the Poyang Lake Basin (China), an extreme precipitation event (EPE) is defined as that for which daily precipitation exceeded a threshold of 50 mm over a continuous area for a given time scale. By considering the spatiotemporal continuity of EPEs, the intensity–area–duration method is applied to study both the characteristics of EPEs and the population and gross domestic product (GDP) exposures. The main results are as follows. (1) During 1961–2014, the frequencies and the intensities of the EPEs are found to be increasing. (2) The annual area impacted by EPEs is determined as 7.4 × 10⁴ km2 with a general upward trend of 400 km2/year. (3) The annually exposed population is estimated as 19% of the entire population of the Basin, increasing by 1.37 × 10⁵/year. The annual exposure of GDP is 8.5% of the entire GDP of the Basin, increasing by 3.8 billion Yuan/year. The Poyang Lake Basin experiences serious extreme precipitation with increasing trends in frequency, intensity, and exposure (for both GDP and population). It is imperative that effective disaster prevention and reduction measures be adopted in this area to mitigate the effects of extreme precipitation.

1. Introduction

From 1880 to 2012, the global average temperature has risen by 0.85 °C. With global warming, the probability of occurrence of extreme precipitation events (EPEs) has increased regionally and globally [1]. Extreme precipitation is one of the most severe disasters affecting China, causing 37.2% of economic losses and 11.7% of casualties related to meteorological disasters from 1984 to 2014 [2]. In the Poyang Lake Basin, the situation regarding extreme precipitation events is even more serious. From 1984 to 2014, 65% of economic losses and 83% of casualties related to meteorological disasters are attributable to extreme precipitation and derivative disasters [3]. Therefore, it is essential to understand the spatiotemporal distribution and evolution of extreme precipitation events in this area.
The risks posed by global warming, driven by continual industrialization, have become a major challenge to global security and development. The severity of the effects of extreme events depends not only on the actual extremes but also on the degree of exposure and vulnerability. Here, exposure refers to the impact of the adverse effects of extreme events on the population, gross domestic product (GDP), and other aspects [4,5]. One of the main reasons for the growth in economic losses is the increase of the human and economic assets exposed to extreme events [6]. In China, because of the rapid economic development and population growth, the exposures of the population and GDP to extreme precipitation events show significant increasing trends [7].
Most previous studies have focused on the evolution and spatiotemporal distribution of extreme precipitation. The numbers of extreme precipitation events and their intensity (≥50 mm) in central and eastern regions of China have shown subtle upward trends from 1961 to 2013 [8]. In southern China, the numbers of short-term extreme precipitation and their 50-year return period are expected to increase considerably. In northern China, the numbers of long-duration extreme precipitation and their 10-year return period are expected to increase [9]. Guo et al. [10] reported that annual rainfall and summer rainstorm frequency in the Poyang Lake Basin rose abruptly in 1990 and 1992, respectively. Wang et al. [11] analyzed the variation in rainfall and found that the uneven distribution of rainfall in the Poyang Lake Basin has intensified since the 1960s; thus, the risks of drought and flooding have increased.
In recent years, studies on exposure to natural disasters have achieved many results [12,13,14,15,16,17]. Research on extreme climate events has developed from value analysis at a single site [18,19] to related investigations of intensity, area of impact, and duration [20,21]. Based on the intensity–area–duration (IAD) method, Zhai et al. [21] developed an approach for identification of a regional extreme event and analysis of its spatial coverage and duration. Wang et al. [22] calculated the exposures of the population, GDP, and agricultural land to extreme precipitation based on provincial-level data. However, it is inappropriate to attempt precise basin-level research based on provincial-level data. To our knowledge, no studies have considered regional persistent extreme precipitation events and the variation of associated population and GDP exposure.
In this study, based on the daily precipitation data (1961–2014) from 81 meteorological stations in the Poyang Lake Basin, an extreme precipitation event is defined as an event during which the precipitation exceeded 50 mm/d over a continuous area for a given time scale [23]. Using the intensity–area–duration (IAD) method [17,21], both the intensity and the impact area of extreme precipitation events in the Poyang Lake Basin are calculated. Based on the impact area, the exposures of the population and GDP of the basin are determined. This paper preliminarily discusses the exposures of the population and GDP to extreme precipitation events. The conclusions derived from this research constitute a technical reference to support measures for the prevention and mitigation of the effects of extreme precipitation, and to provide a scientific basis for the protection of sustainable socioeconomic development.

2. Data

2.1. Meteorological Data

The quality-controlled daily precipitation data used are obtained from 81 climate stations for the period 1961–2014 (black triangles in Figure 1). Prior to further analysis, the data are tested for homogeneity and the annual missing rate is less than 0.25%. Based on the observed precipitation data and with consideration of their continuity, anomaly interpolation [24,25] is used to create 0.5° × 0.5° grids (Figure 1). This method has been used previously in Climatic Research Unit dataset interpolation, and it could well reflect the spatio-temporal distribution of daily precipitation of the Poyang Lake Basin [26,27].

2.2. Basic Geographic Information Data

The basic geographic information dataset is provided by Data Center for Resources and Environmental Sciences, Chinese Academy of Sciences (RESDC) (http://www.resdc.cn). China’s 1:100,000 scale land use status remote sensing monitoring database is currently the most accurate land use remote sensing dataset, and plays an important role in the national land resources survey, and in hydrological and ecological research. The land use types include farmland, forest land, grassland, water area, residential land, and unused land.

2.3. Population and GDP Data

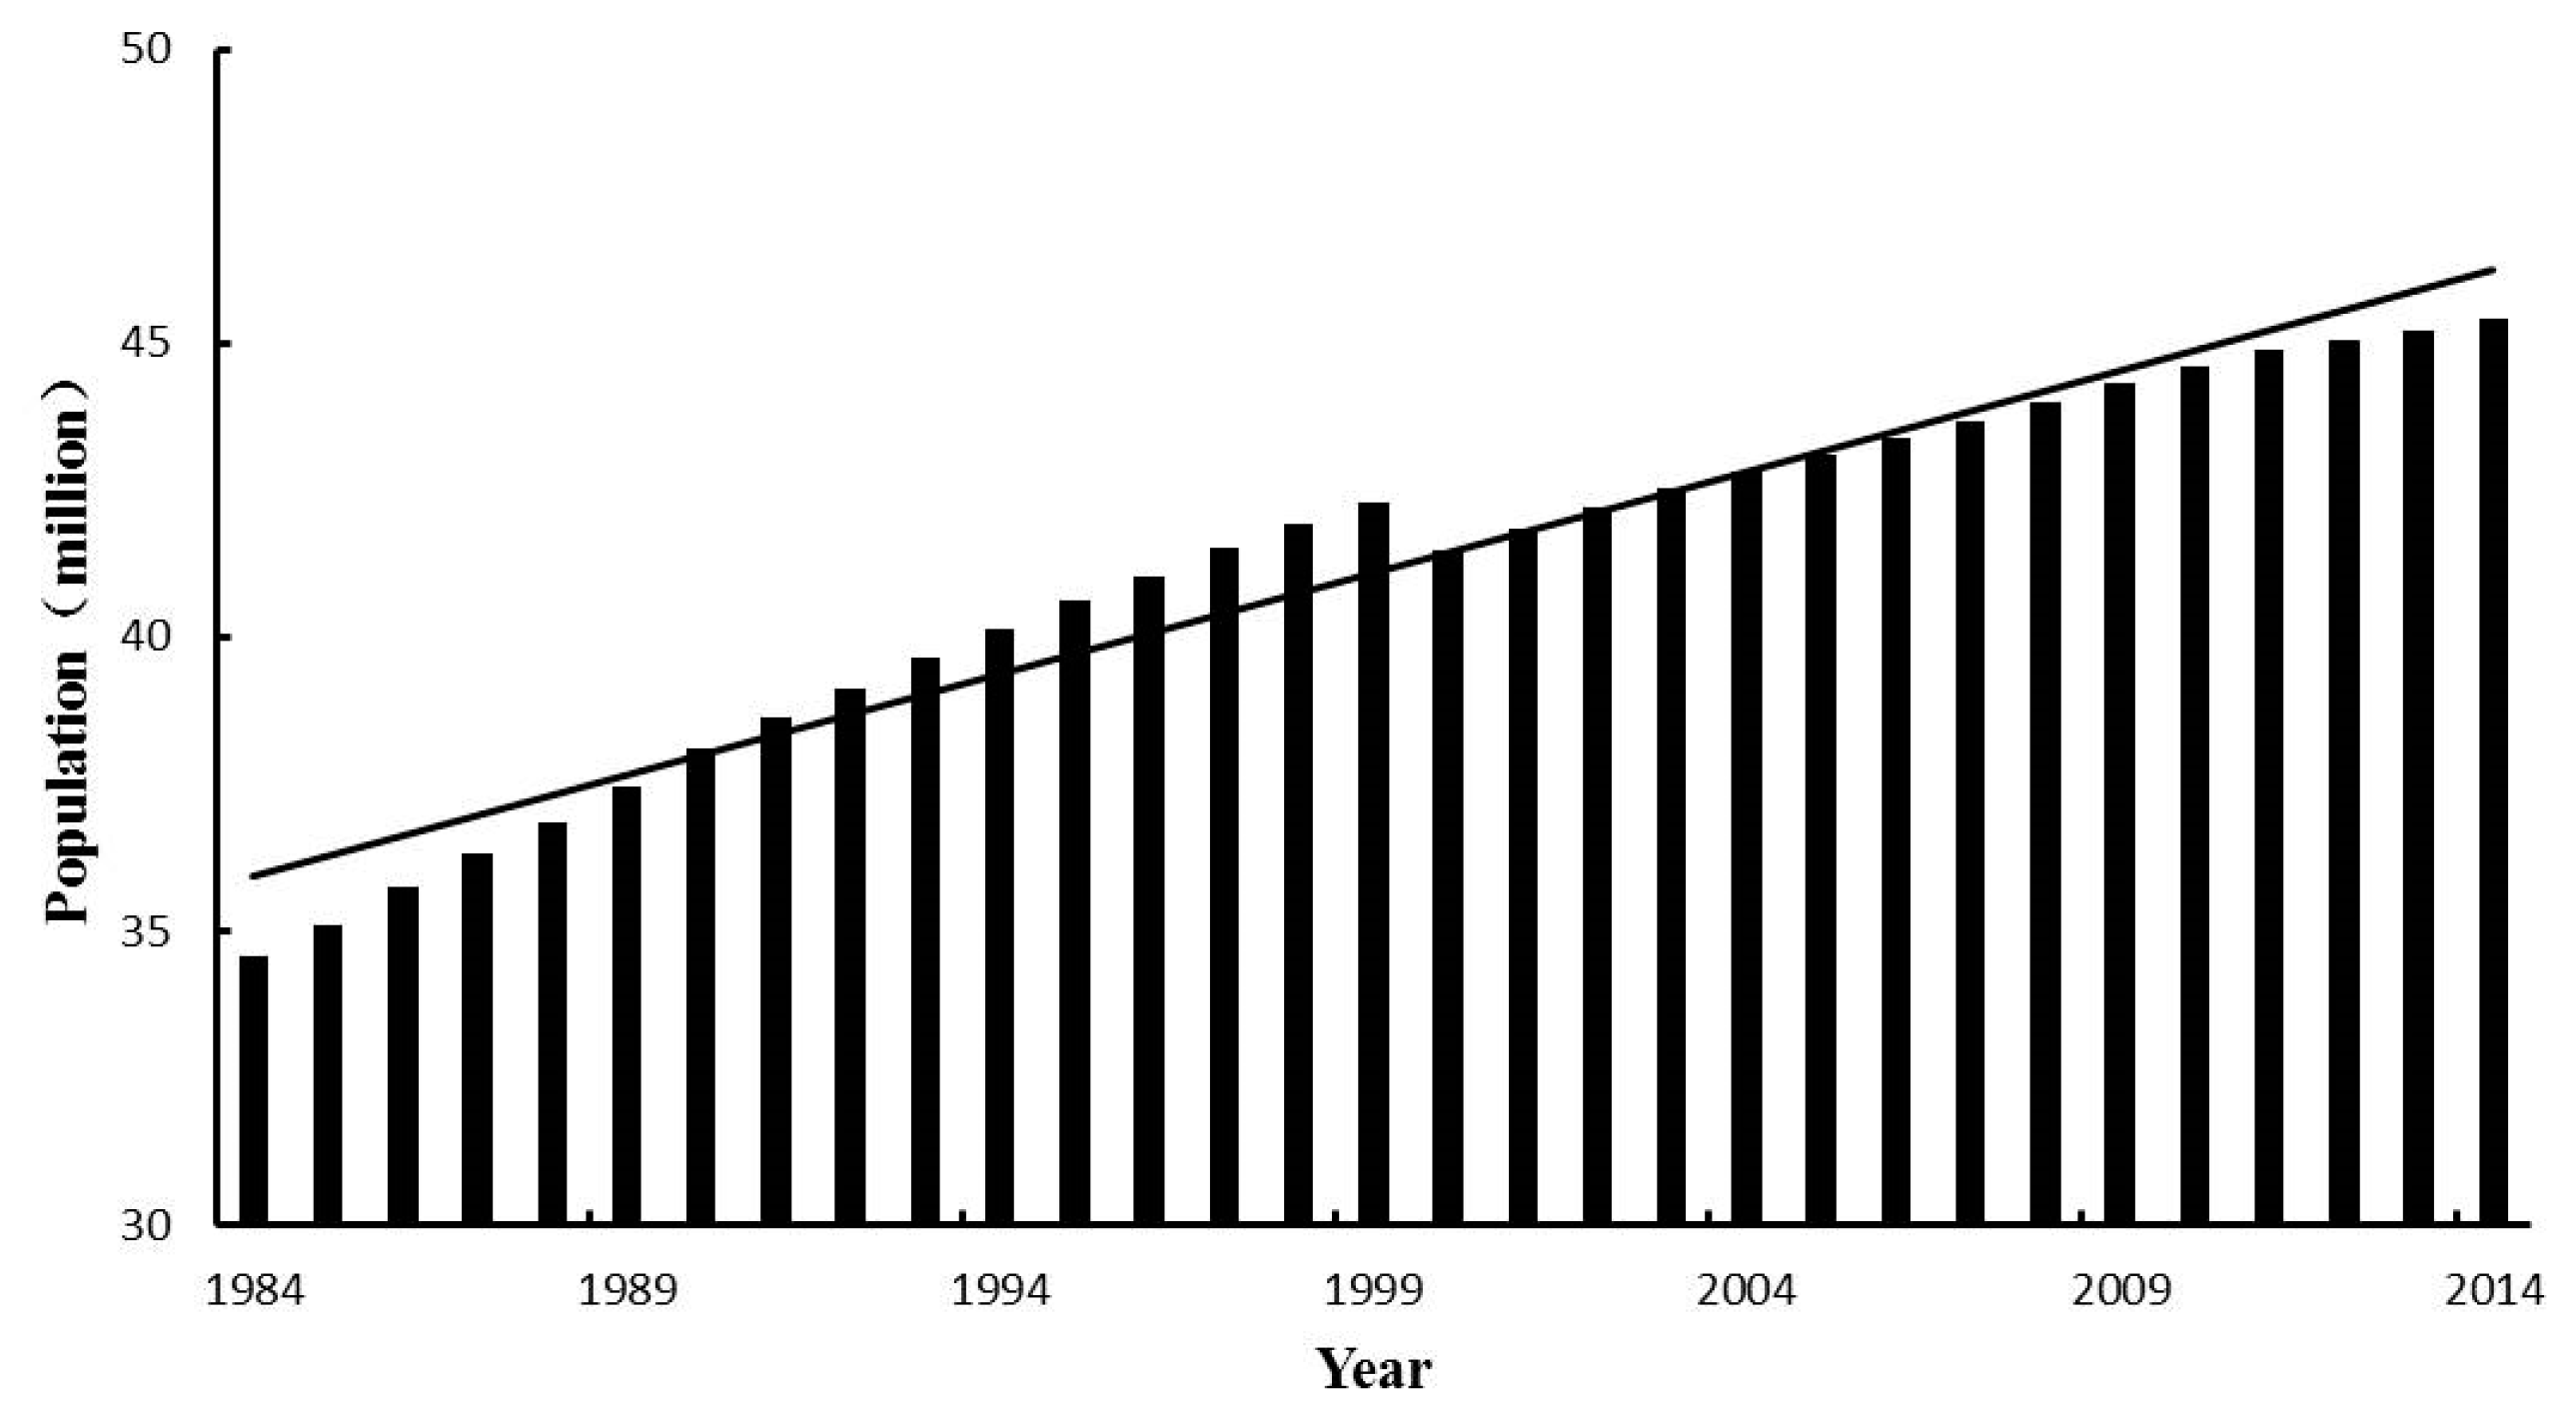
The population and GDP data are collected to study the population exposed to EPEs. Yearly population and GDP data for the Poyang Lake Basin are derived from the Jiangxi Province Statistical Yearbook (1984–2014), which comprises county-level statistical data (Figure 2 and Figure 3). The population has grown from 34.5 million (1984) to 45.4 million (2014), with increasing rate 0.34 million/year [28].
Without considering the inflation, the GDP has increased from 16.9 billion Yuan (1984) to 1571.5 billion Yuan (2014), with an increase rate of 43.6 billion/year. Here, considering the changes of consumer price index (CPI), the GDP data are normalized to 2014 based on the index. The GDP has increased from 88.6 billion Yuan (1984) to 1571.5 billion Yuan (2014), with an increase rate of 44.7 billion/year.
The Poyang Lake Basin is divided into 87 grids (0.5° × 0.5°), consistent with the precipitation dataset (Crosses signs in Figure 1). Similarly, 0.5° × 0.5° gridded GDP and population datasets for each year are produced in terms of the ratio between grid and county areas.

3. Method

3.1. Spatializion Method for Population

Population is an important factor in vulnerability assessment of the disaster carrying capacity of rainstorm and flood disasters, and fine spatial distribution information of population is an important basis for vulnerability assessment. To distinguish towns with an agricultural population and non-agricultural population, the study area is divided into urban areas and rural areas.
This study analyzed the correlation between the population and the land area of each town, and obtained the land type factors that affect the population distribution of cities and townships, and then established a spatial model of urban and rural population based on land type. The general formula for the population spatialization model is as follows:
P i = j = 1 n a j x j + B i
where Pi denotes the total population of town I, aj is the population distribution factor of the land use type j, xj is the land use area of type j, n is the number of land use types that affects the population distribution, and Bi is the intercept.
This study simulated the population space with the land use data and the results of the simulation revealed that the population is mainly concentrated in the Central Plains and southern mountain areas (Figure 4). This population distribution characteristic may cause heavy casualties in the mountain area by the EPEs.

3.2. Spatialization Method for GDP

In addition to evaluating the vulnerability of the population, another important indicator that needs to be considered in the meteorological disaster risk assessment is the economic development of the region. The GDP, used in most countries and regions of the world, can reflect the full social and economic activities. According to the historical development of social production activities, the division of industrial structure usually divides GDP into three industries [28]. We established the expression model of GDP data space based on the spatial pattern of land use by studying the key factors influencing the development and distribution of GDP from the various industries.

3.2.1. Primary Industry Model

Primary industry usually includes the four branches of agriculture, forestry, animal husbandry, and fisheries. This study analyzed the correlation between the added value of agriculture, forestry, animal husbandry and fishery in each town and the land use type, and obtained the influencing factors of agriculture, forestry, animal husbandry, and fisheries in GDP development. We established the primary industry GDP spatial distribution model and GDP value is expressed by G as follows:
G 1 j = G j agr + G j for + G j ani + G j fis
= g j arg ( i = 1 k A ij agr ) + g j for ( i = 1 l A ij for ) + g j ani ( i = 1 m A ij ani ) + g j fis ( i = 1 n A ij fis )
where G1j is the GDP of primary industry of town j, G j agr , G j for , G j ani ,   and G j fis are the GDP of agriculture, forestry, animal husbandry, and fisheries at town j, respectively; g j agr , g j for , g j ani , and g j fis are the unit area GDP of agriculture, forestry, animal husbandry, and fisheries at town j, respectively; A ij agr , A ij for , A ij ani ,   and A ij fis denote the area of the ith land use type at town j that affects the development of agriculture, forestry, animal husbandry, and fishery industries, respectively; k, l, m, and n are the number of land use types that affect the development of agriculture, forestry, animal husbandry, and fishery industries, respectively.

3.2.2. Second Industry Model

The secondary industry is the industrial sector that processes the products (raw materials) provided by the primary industry and the third industry. It includes mining, manufacturing, electricity, gas, and water production and supply, and construction. Therefore, it is necessary to establish the towns with second industry GDP statistics and land use types based on correlation analysis. The secondary industry GDP spatial distribution model is as follows:
G 2 j = g j ind ( i = 1 n A ij ind )
where G2j denotes the GDP of the secondary industry at town j, g j ind denotes unit area GDP of the secondary industry at town j, A ij ind denotes the area of the ith land use type at town j that affects the development of secondary industry, and n denotes the number of land use types affecting the secondary industry.

3.2.3. Third Industry Model

Based on the same correlation analysis as the above method, the GDP spatial distribution model of the third industry (or service industry) is established as follows:
G 3 j = g j s e r ( i = 1 n A i j s e r )
where G3j denotes the GDP of the third industry at town j, g j ser denotes unit area GDP of the third industry at town j, A ij ser denotes the area of the ith land use type at town j that affects the development of the third industry, and n denotes the number of land use types affecting the third industry.

3.2.4. GDP Model

The GDP spatial distribution model of the first, second, and third industries were integrated, and the GDP spatial distribution model was obtained as follows:
Gj = G1j + G2j + G3j
According to the above methods and statistical yearbook, the GDP spatial model of three major industries is calculated, and the spatial distribution of GDP in the three major industries of Poyang Lake Basin is obtained. As shown in the Figure 5, the GDP in Poyang Lake is mainly concentrated around the Poyang Lake, and the GDP in the plain area is higher than that in the mountain areas, which corresponds to the actual situation.

3.3. Intensity–Area–Duration Method

This study adopted the IAD method that linked three important features of extreme events: intensity, impact area, and duration [29]. Contiguous grid points with daily precipitation >50 mm over a given time scale and a continuous area were selected as an extreme event. The mean precipitation of the extreme event was selected as the intensity in this method. The IAD method can be used to both study the simultaneous changes in intensity and impact area over a given duration, and analyze the most severe regional extreme precipitation events by plotting an envelope curve. The required steps are as follows [17,20,21].
(1) Determination of the range of extreme events. First, the given time scale is selected as 1 day and ≥2 days and the intensities are calculated for the different time periods for all grid points. The grid point with the highest intensity is regarded as the “center with highest intensity” of a regional extreme precipitation event (Figure 6a). Second, among the surrounding eight grid points, the one with the second highest intensity is identified to establish the “center with second highest intensity” (Figure 6b). Note that the intensity and coverage of an extreme event in Figure 6b is the mean intensity and amalgamated area of the continuous grids concerned. Third, among the grid points surrounding the “center with second highest intensity,” the one with the third highest intensity is identified. All those grids with precipitation greater than the threshold are then determined and combined into a regional extreme precipitation event (Figure 6c,d). Fourth, another “center with highest intensity” is determined and the above steps are repeated, until all the regional extreme precipitation events are accounted for over a given time scale (Figure 6e).
(2) Establishment of the IAD curve. All the points that denoted recorded extremes of intensity and corresponding coverage are linked into a curve to reflect the intensity–coverage relationship. Intensity–coverage curves are constructed for all events within the same given time scale. The points with the highest intensity of the different impacted areas were linked to form an envelope curve, that is, the IAD curve (Figure 6f). The IAD curve reflects the highest intensity that extreme precipitation events could reach over a given time scale for areas with different impact levels.

3.4. Mann–Kendall Test

The nonparametric Mann–Kendall (MK) test [30,31] is widely used to detect trends in time series of extreme precipitation. The MK test has been widely applied in studies of hydrology, meteorological ecology, and the environment to establish whether time series have abrupt changes [32,33]. The MK statistic (MKs) value represents the tendency and significance of the trend. A value of MKs ≥ 1.96 indicates a significant positive trend and a value of MKs ≤ −1.96 represents a significant negative trend (both at the 95% confidence level).

4. Results

4.1. Changes in Frequency of Extreme Precipitation Events

As shown in Figure 7, 1-day EPEs occur 1966 times in the Poyang Lake Basin during 1961–2014; the highest occurrence is in 1999 (55) and the lowest in 1963 (14). The 1990s (1990–1999) and 2010s (2010–2014) are the decades with the highest frequencies: 42 and 41 times yr−1, respectively. The decades of the 1960s (1961–1969), 1970s (1970–1979), and 2000s (2000–2009) are similar to each other: 32, 34, and 34 times/year, respectively. In general, the occurrence of extreme precipitation events has increased significantly at a rate of 1.5 times decade−1 (significant at the 95% level).
During 1961–2014, ≥2-day EPEs occur 353 times (highest occurrence: 15 in 1998, lowest occurrence: 1 in 1971, 1987, and 1990). The 1990s is the decade with the highest frequency (nine times year−1) and the 1970s is the decade with the lowest (four times year−1). A weak positive trend is detected for the frequency of ≥2-day extreme precipitation with a rate of increase of 0.6 times decade−1 (Figure 8).

4.2. Changes in Intensity of Extreme Precipitation Events

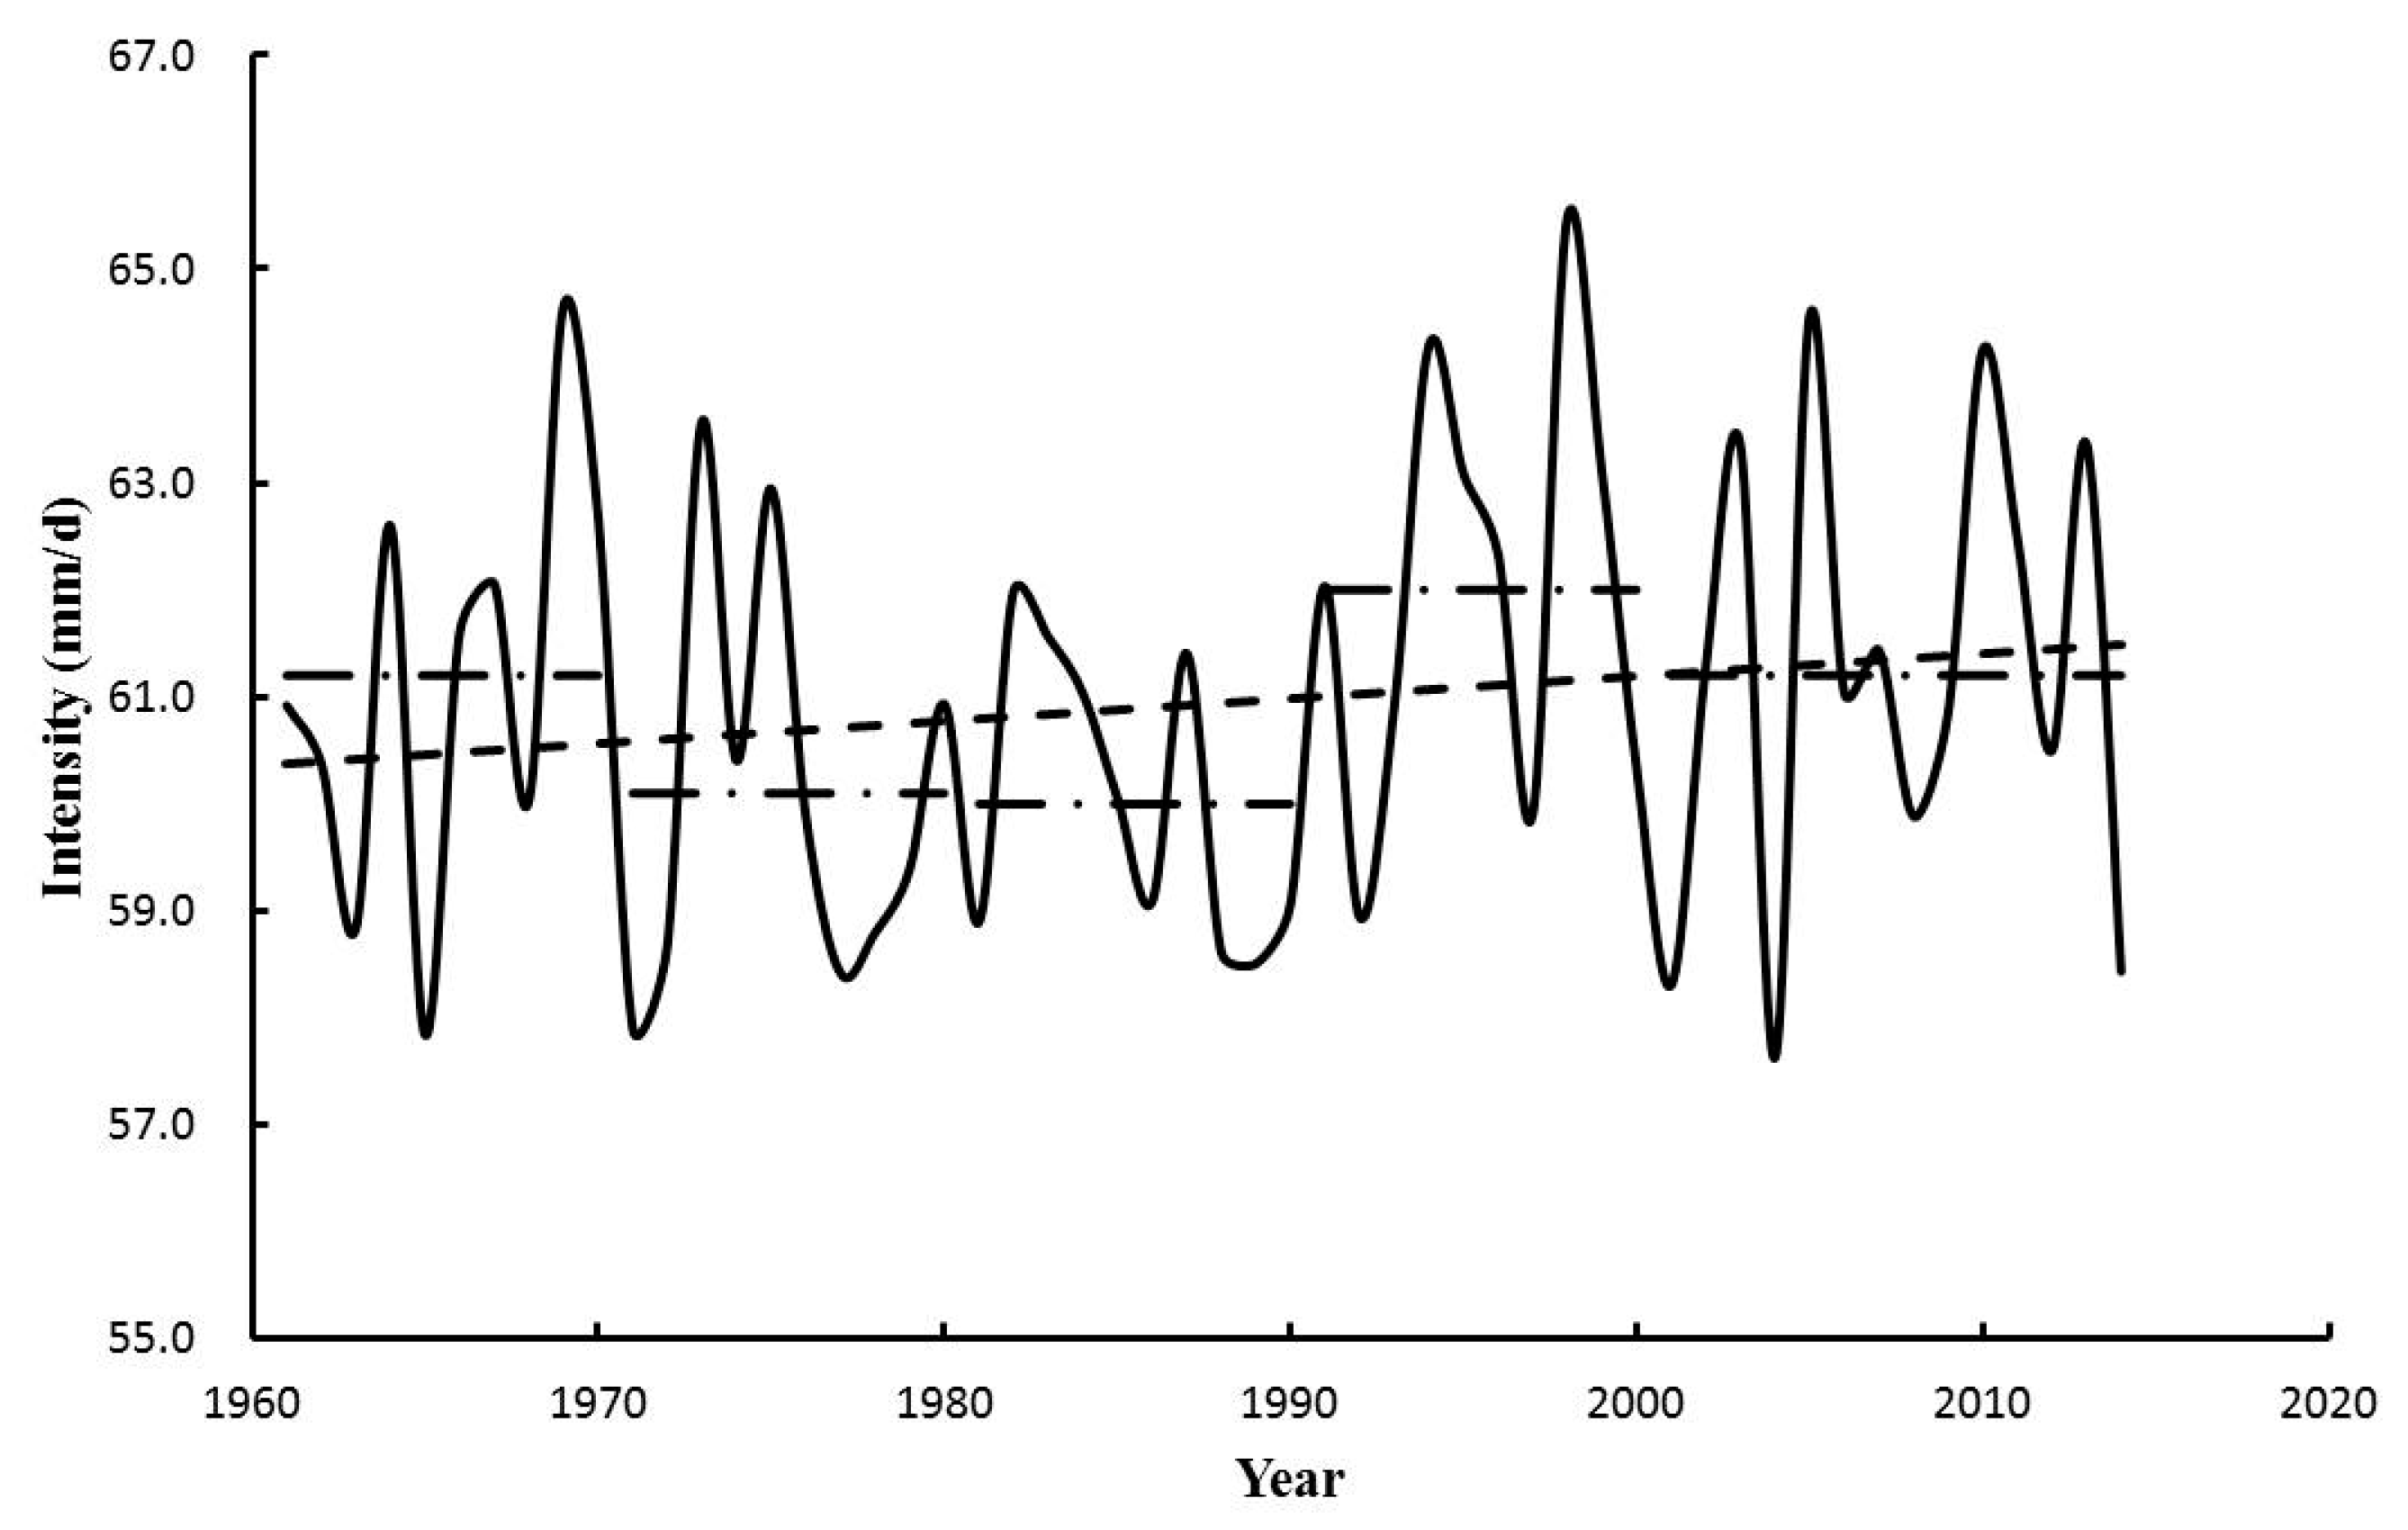
During 1961–2014 in the Poyang Lake Basin, the average intensity of 1-day events is 60.9 mm d−1. Figure 9 illustrates the change in intensity. The 1-day events with the greatest intensity occur in the 1990s with an average intensity 62.0 mm d−1. The rate of increase in intensity of 0.2 mm decade−1 is not statistically significant.
Figure 10 illustrates the changes of intensity of ≥2-day events during 1961–2014. The average intensity is 67.3 mm d−1, that is, greater than the 1-day events. The variation of the intensity of the ≥2-day events is much greater than the 1-day events. Unlike the 1-day events, the ≥2-day events with the greatest intensity occur in the 2000s with an average intensity of 68.6 mm d−1. A very small positive trend with a rate of increase of 0.3 mm decade−1 is detected.

4.3. Changes of the Impact Area

The 1-day EPEs are chosen to study the details of EPEs on both the impacted area and the exposure of the population and GDP in the Poyang Lake Basin, 1-day EPEs are chosen.
Figure 11 illustrates the changes of impacted area during 1961–2014. The annual area impacted by extreme precipitation events is 7.4 × 10⁴ km2 (45% of the area of the Poyang Lake Basin) with a general upward trend of 400 km2 yr−1 (passing the 90% significance MK test). The ascending order of decades based on the impacted area is 1970s (6.5 × 10⁵ km2 yr−1), 1980s (6.9 × 10⁵ km2 yr−1), 1960s (7.2 × 10⁵ km2 yr−1), 2000s (8.9 × 10⁵ km2 yr−1), and 1990s (9.0 × 10⁵ km2 yr−1). The three years with the largest impacted area are 1998 (1.44 × 10⁶ km2), 2010 (1.38 × 10⁶ km2), and 1999 (1.35 × 10⁶ km2).

4.4. Identification of the Most Severe Events

Extreme precipitation has been analyzed previously at station level without consideration of the impact area. The IAD method provides a new perspective for understanding the extreme precipitation events by considering the intensity, duration, and impact area.
Based on the daily precipitation data for the Poyang Lake Basin, 1-day and ≥2-day extreme precipitation events are analyzed. In Figure 12, the envelope comprises the five severest 1-day EPEs (colored dots), and the remaining 1-day extreme precipitation events are plotted below the envelope (colored diamonds). The precipitation event that occurred on 2 May 1994, has a maximum intensity of 208 mm d−1 and it covers 2625 km2. The event with the largest impact area occurs on 12 April 2006. It covers an area of 1.47 × 10⁵ km2 and its intensity is around 70 mm d−1.
In Figure 13, the envelope comprises the two most severe ≥2-day extreme precipitation events. The event with the greatest intensity of precipitation (151 mm d−1) occurs on 19 June 2010 and it covers an area of 2300 km2. The event with the largest impact area occurs on 24 June 2003. It covers an area of 0.68 × 10⁵ km2 and its intensity is around 100 mm d−1.

4.5. Exposure of Population and GDP

Changes in the exposure of the population and GDP to extremes are not simply related to changes of the extreme precipitation events themselves, but they are also dependent on the growth and redistribution of GDP and the population.
The population exposure grows slowly during 1961–2014 at a rate of about 1% yr−1. From 1984 to 2014, the annual average exposed population is 7.9 million (19% of the entire population of the Poyang Lake Basin), with a rate of increase of 1.37 × 10⁵ people yr−1 (passing the 95% significance MK test). The ascending order of decades based on the annual population exposure is the 1980s (5.21 million), 2000s (8.08 million), and 1990s (9.26 million). The three years with the largest exposures of population are 2010 (16.36 million), 1998 (16.26 million), and 1999 (15.68 million), accounting for 36.6%, 38.8%, and 37.1% of the population, respectively (Figure 14).
Unlike the population, the GDP has grown rapidly in the Poyang Lake Basin, with a rate of increase of about 10% yr−1 (1984–2014). During 1984–2014, the annual exposure of GDP is 32.7 billion Yuan (7.7% of the total GDP of the Poyang Lake Basin), with a rate of increase of 3.8 billion Yuan yr−1 (passing the 99% significance MK test). The ascending order of decades based on the annual GDP exposure is the 1980s (1.6 billion), the 1990s (11.45 billion), and the 2000s (59.36 billion), accounting for 6.1%, 10.5%, and 8.4% of the total GDP, respectively. The three years with the largest exposure of GDP are 2013 (136.4 billion), 2012 (136.5 billion), and 2010 (155.6 billion). The three years with the largest proportional exposure of GDP are 1999 (15.2%), 1998 (15.8%), and 2010 (16.5%) (Figure 15).

5. Discussion and Conclusions

Global warming has already affected the extreme precipitation in China and worldwide during the 20th century [34,35,36] and if it continues it may have further impacts. In this paper, based on the daily precipitation data (1961–2014) from 81 climate stations in the Poyang Lake Basin (China), using the IAD method, the frequency, intensity, and impact area of EPEs in the Poyang Lake Basin is analyzed. Based on gridded population and GDP data (1984–2014), the exposure of the population and GDP to EPEs are discussed. Climate change is not the only reason for the worsening losses from disasters. Even if the EPEs do not change, the disaster losses would increase with the development of the economy. In the future study, we will attempt to distinguish the contribution rate of the climate change and the economic development.
From 1961 to 2014, the 1-day EPEs occur 1966 times with average intensity of 60.9 mm d−1. The ≥2-day events occur 353 times with average intensity of 67.3 mm d−1. From 1961 to 2014, the annual impacted area of EPEs is established as 7.4 × 10⁴ km2 (45% of the area of the Poyang Lake Basin) with a general upward trend of 400 km2 yr−1.The frequencies, intensities, and impact area of EPEs in Poyang Lake Basin are found to have increased.
During 1961–2014, the annual population exposure is 7.90 million people (19% of the entire population on the Poyang Lake Basin), increasing by 1.37 × 10⁵ yr−1. The three years with the largest exposures of population are 1999 (15.68 million), 1998 (16.26 million), and 2010 (16.36 million), accounting for 36.6%, 38.8%, and 37.1% of the total population, respectively. The annual exposure of GDP is 32.7 billion Yuan (7.7% of the entire GDP of the Poyang Lake Basin), increasing by 3.8 billion Yuan yr−1. The three years with the largest exposures of GDP are 2010 (155.6 billion), 2012 (136.5 billion), and 2013 (136.4 billion). The three years with the largest proportional exposures of GDP are 1999 (15.2%), 1998 (15.8%), and 2010 (16.5%).
Overall, the frequency, intensity, and impact area of EPEs and the exposures of the population and GDP have increased. This means that EPEs have an increasingly negative impact on the Poyang Lake Basin. The rapidly developing economy and the changes in extreme precipitation are the two main reasons for the increase in the exposure of GDP and the population. It is difficult but necessary to seek the primary causes of the increasing exposure. In our future research, the relative rates of the contributions of economic development and climate change will be calculated. In addition, future climate change might lead to increases in the frequency of extreme precipitation events and the occurrence of more severe disasters. The potential impact of future climate change on extreme precipitation events and the socioeconomic situation of the Poyang Lake Basin will be studied in future research.

Author Contributions

Conceptualization, M.Z.; methodology, J.Z.; software, H.S.; formal analysis, M.Z.; investigation, X.L.; data curation, L.X.; writing—original draft preparation, M.Z.; writing—review and editing, X.L.

Funding

This study was funded by the Jiangxi Meteorological Bureau and a bilateral cooperation project between the Natural Science Foundation of China and the Pakistan Science Foundation (41661144027).

Acknowledgments

The authors are thankful for the support of the High-level Talent Recruitment Program of the Nanjing University of Information Science and Technology (NUIST).

Conflicts of Interest

The authors declare no conflict of interest.

References

  1. IPCC. Climate Change 2013: The Physical Science Basis. In Contribution of Working Group I to the Fifth Assessment Report of IPCC the Intergovernmental Panel on Climate Change; Cambridge University Press: Cambridge, NY, USA, 2013; pp. 2–5. [Google Scholar]
  2. Qin, D.; Zhang, J.; Shan, C.; Song, L. China National Assessment Report on Risk Management and Adaptation of Climate Extremes and Disasters; Refined Edition; Science Press: Beijing, China, 2015; p. 62. [Google Scholar]
  3. China Meteorological Administration. China Meteorological Disaster Yearbook; China Meteorological Press: Beijing, China, 1984–2014.
  4. IPCC. Managing the Risks of Extreme Events and Disasters to Advance Climate Change Adaptation: A Special Report of Working Groups I and II of The Intergovernmental Panel on Climate Change; Cambridge University Press: Cambridge, NY, USA, 2012; pp. 2–18. [Google Scholar]
  5. IPCC. Climate Change 2014: Impacts, Adaptation and Vulnerability. Contribution of Working Group II to the Fifth Assessment Report of IPCC the Intergovernmental Panel on Climate Change; Cambridge University Press: Cambridge, NY, USA, 2014; pp. 5–6. [Google Scholar]
  6. Schumacher, I.; Strobl, E. Economic development and losses due to natural disasters: The role of hazard exposure. Ecol. Econ. 2011, 72, 97–105. [Google Scholar] [CrossRef]
  7. Wang, Y.; Gao, C.; Wang, A.; Wang, Y.; Zhang, F.; Zhai, J.; Li, X.; Su, B. Temporal and spatial variation of exposure and vulnerability of flood disaster in China. Progress. Inquisitiones Mutat. Clim. 2014, 10, 391–398. [Google Scholar]
  8. Qin, N.; Wang, J.; Yang, G.; Chen, X.; Liang, H.; Zhang, J. Spatial and temporal variations of extreme precipitation and temperature events for the Southwest China in 1960–2009. Geoenviron. Disasters 2015, 2, 1–14. [Google Scholar] [CrossRef] [Green Version]
  9. Yuan, Z.; Yang, Z.; Yan, D.; Yin, J. Historical changes and future projection of extreme precipitation in China. Appl. Clim. 2015, 3, 1–15. [Google Scholar] [CrossRef]
  10. Guo, H.; Jiang, T.; Wang, G.J. Climate Change Tendency and Analysis on Abrupt Climate Change in Poyang Lake Basin from 1961 to 2003. J. Lake Sci. 2006, 18, 443–451. (In Chinese) [Google Scholar]
  11. Wang, H.Q.; Zhao, G.N.; Peng, J. Precipitation characteristics over five major river systems of Poyang drainage areas in recent 50 years. Resour. Environ. Yangtze Basin 2009, 18, 615–619. [Google Scholar]
  12. Gray, C.L.; Mueller, V. Natural disasters and population mobility in Bangladesh. Proc. Natl. Acad. Sci. USA 2012, 109, 6000–6005. [Google Scholar] [CrossRef] [Green Version]
  13. Haer, T.; Kalnay, E.; Kearney, M.; Moll, H. Relative sea-level rise and the conterminous United States: Consequences of potential land inundation in terms of population at risk and GDP loss. Glob. Environ. Chang. 2013, 23, 1627–1636. [Google Scholar] [CrossRef]
  14. Hirabayashi, Y.; Mahendran, R.; Koirala, S.; Konoshima, L.; Yamazaki, D.; Watanabe, S.; Kim, H.; Kanae, S. Global flood risk under climate change. Nat. Clim. Chang. 2013, 3, 816. [Google Scholar] [CrossRef]
  15. Jongman, B.; Ward, P.J.; Aerts, J.C. Global exposure to river and coastal flooding: Long term trends and changes. Glob. Environ. Chang. 2012, 22, 823–835. [Google Scholar] [CrossRef]
  16. Jing, C.; Jiang, T.; Wang, Y.J.; Chen, J.; Jian, D.; Luo, L.; Buda, S.U. A study on regional extreme precipitation events and the exposure of population and economy in China. Acta Meteorol. Sin. 2016, 74, 572–582. [Google Scholar]
  17. Zhan, M.; Li, X.; Sun, H.; Zhai, J.; Jiang, T.; Wang, Y. Changes in Extreme Maximum Temperature Events and Population Exposure in China under Global Warming Scenarios of 1.5 and 2.0 °C: Analysis Using the Regional Climate Model COSMO-CLM. J. Meteorol. Res. 2018, 32, 99–112. [Google Scholar] [CrossRef]
  18. Wang, P.; Yang, J. Extreme high temperature events and response to regional warming in recent 45 years in Northwest China. J. Desert Res. 2007, 27, 649–654. [Google Scholar]
  19. Zhang, F.; Gao, H.; Cui, X. Frequency of extreme high temperature days in China, 1961–2003. Weather 2008, 63, 46–49. [Google Scholar] [CrossRef]
  20. Jing, C.; Tao, H.; Wang, Y.J.; Su, B.; Huang, J.; Jiang, T. Projection of extreme precipitation events in China based on regional climate model CCLM. J. Nat. Resour. 2017, 32, 266–277. [Google Scholar]
  21. Zhai, J.; Huang, J.; Su, B.; Cao, L.; Wang, Y.; Jiang, T.; Fischer, T. Intensity-area-duration analysis of droughts in China 1960–2013. Clim. Dyn. 2017, 48, 151–168. [Google Scholar] [CrossRef]
  22. Wang, Y.Y.; Wang, Y.J.; Jiang, T. Spatial-temporal characteristics of flood disaster exposure and vulnerability in Jiangsu province. J. Yangtze River Sci. Res. Inst. 2015, 33, 27–32. [Google Scholar]
  23. China Meteorological Administration. Specifications for Surface Meteorological Observation; China Meteorological Press: Beijing, China, 1992; p. 25.
  24. New, M.; Hulme, M.; Jones, P. Representing twentieth-century space–time climate variability. Part I: Development of a 1961–90 mean monthly terrestrial climatology. J. Clim. 1999, 12, 829–856. [Google Scholar] [CrossRef]
  25. New, M.; Hulme, M.; Jones, P. Representing twentieth-century space-time climate variability. Part II: Development of 1901–96 monthly grids of terrestrial surface climate. J. Clim. 2000, 13, 2217–2238. [Google Scholar] [CrossRef]
  26. Xu, Y.; Gao, X.; Shen, Y.; Xu, C.; Shi, Y.; Giorgi, A. A daily temperature dataset over China and its application in validating a RCM simulation. Adv. Atmos. Sci. 2009, 26, 763–772. [Google Scholar] [CrossRef]
  27. Wu, J.; Gao, X.J. A gridded daily observation dataset over China region and comparison with the other datasets. Chin. J. Geophys. 2013, 56, 1102–1111. [Google Scholar]
  28. Statistic Bureau of Jiangxi. Jiangxi Statistical Yearbook; China Statistics Press: Beijing, China, 1984–2014.
  29. Andreadis, K.M.; Clark, E.A.; Wood, A.W. Twentieth-century drought in the conterminous United States. J. Hydrometeorol. 2005, 6, 985–1001. [Google Scholar] [CrossRef]
  30. Mann, H.B. Nonparametric tests against trend. Econometrica 1945, 13, 245–259. [Google Scholar] [CrossRef]
  31. Kendall, M.G. Rank Correlation Methods; Griffin: London, UK, 1975. [Google Scholar]
  32. Gemmer, M.; Fischer, T.; Jiang, T. Trends in precipitation extremes in the Zhujiang River Basin. J. Clim. 2011, 24, 750–761. [Google Scholar] [CrossRef]
  33. Tao, H.; Gemmer, M.; Bai, Y. Trends of streamflow in the Tarim River Basin during the past 50 Years: Human impact or climate change? J. Hydrol. 2011, 400, 1–9. [Google Scholar] [CrossRef]
  34. Su, B.D.; Jiang, T.; Jin, W.B. Recent trends in observed temperature and precipitation extremes in the Yangtze River basin, China. Theor. Appl. Climatol. 2006, 83, 139–151. [Google Scholar] [CrossRef]
  35. Zhang, X.; Zwiers, F.W.; Hegerl, G.C. Detection of human influence on twentieth-century precipitation trends. Nature 2007, 448, 461–465. [Google Scholar] [CrossRef]
  36. Zhai, P.M.; Zhang, X.B.; Wan, H. Trends in Total Precipitation and Frequency of Daily Precipitation Extremes over China. J. Clim. 2005, 18, 1096–1108. [Google Scholar] [CrossRef]
Figure 1. The spatial distribution of meteorological stations and the grids in the Poyang Lake Basin.
Atmosphere 10 00817 g001
Figure 2. Population time-series of the Poyang Lake Basin for 1984–2014.
Atmosphere 10 00817 g002
Figure 3. Gross domestic product (GDP) time-series of the Poyang Lake Basin for 1984–2014.
Atmosphere 10 00817 g003
Figure 4. Average population distribution of Poyang Lake Basin, from 1961 to 2014.
Atmosphere 10 00817 g004
Figure 5. Average GDP distribution of Poyang Lake Basin, from 1961 to 2014.
Atmosphere 10 00817 g005
Figure 6. Construction of intensity-area-duration (I-A-D) curve. ((ae): Determination of the range of extreme events; (e): The extreme events in Poyang Lake Basin; (f): The IAD curve of all the events.).
Atmosphere 10 00817 g006
Figure 7. The frequency of 1-day extreme precipitation event (EPEs) in the Poyang Lake Basin, from 1961 to 2014.
Atmosphere 10 00817 g007
Figure 8. The frequency of ≥2-day EPEs in the Poyang Lake Basin, from 1961 to 2014.
Atmosphere 10 00817 g008
Figure 9. The intensity of 1-day events in the Poyang Lake Basin, from 1961 to 2014.
Atmosphere 10 00817 g009
Figure 10. The intensity of ≥2-day events in the Poyang Lake Basin, from 1961 to 2014.
Atmosphere 10 00817 g010
Figure 11. Impacted area of extreme precipitation events in the Poyang Lake Basin from 1961 to 2014.
Atmosphere 10 00817 g011
Figure 12. Identification of the most severe and normal 1-day extreme precipitation events, from 1961 to 2014.
Atmosphere 10 00817 g012
Figure 13. The severest and normal ≥2-day extreme precipitation events, from 1961 to 2014.
Atmosphere 10 00817 g013
Figure 14. Population exposure and proportion of population, from 1961 to 2014.
Atmosphere 10 00817 g014
Figure 15. GDP exposure and proportion of GDP, from 1961 to 2014.
Atmosphere 10 00817 g015