Modelling Daily Mean Surface Air Temperature Calculated from Different Methods and Its Impact on Urban-Related Warming Evaluations over Guangzhou and Shenzhen Using the WRF Model
Abstract
:1. Introduction
2. Experiments
2.1. Data
2.2. Experimental Design
3. Results
3.1. Urban Surface Expansion over Guangzhou and Shenzhen
3.2. Spatial Differences and Trends in Annual Mean SAT
3.2.1. Annual Mean SAT
3.2.2. Trends in Annual Mean SAT
3.3. Time Series Differences in Annual Mean SAT and Trends
3.3.1. Annual Mean SAT
3.3.2. Trends in Annual Mean SAT
Trends and Urban-Related Warming Between T4, Txn, and Tc
Comparison of T4 and Txn: Trends and Urban-Related Warming
3.4. Differences in Trends of Tmax and Tmin
3.4.1. Comparing Trends for Tmax and Tmin
3.4.2. Tmax Trends
3.4.3. Tmin Trends
4. Discussions
5. Conclusions
Supplementary Materials
Author Contributions
Funding
Conflicts of Interest
References
- Zhou, B.Z.; Gu, L.H.; Ding, Y.H.; Shao, L.; Wu, Z.M.; Yang, X.S.; Li, C.Z.; Li, Z.C.; Wang, X.M.; Cao, Y.H.; et al. The great 2008 Chinese ice storm: Its socioeconomic-ecological impact and sustainability lessons learned. Bull. Am. Meteorol. Soc. 2011, 92, 47–60. [Google Scholar] [CrossRef]
- Qian, X.; Miao, Q.L.; Zhai, P.M.; Chen, Y. Cold-wet spells in mainland China during 1951–2011. Nat. Hazards 2014, 74, 931–946. [Google Scholar] [CrossRef]
- Zhao, Y.C.; Zhao, X.F.; Liu, L.L. Spatial pattern analysis on human health risk of heatwave in Xiamen City. J. Geo-Info. Sci. 2016, 18, 1094–1102. [Google Scholar]
- Karl, T.R.; Diaz, H.F.; Kukla, G. Urbanization: Its detection and effect in the United States climate record. J. Clim. 1988, 1, 1099–1123. [Google Scholar] [CrossRef]
- Arnfield, A.J. Two decades of urban climate research: A review of turbulence, exchanges of energy and water, and the urban heat island. Int. J Climatol. 2003, 23, 1–26. [Google Scholar] [CrossRef]
- Ren, G.Y.; Zhou, Y.; Chu, Z.; Zhou, J.; Zhang, A.; Guo, J.; Liu, X. Urbanization effects on observed surface air temperature trends in north China. Nisam sigurna da je ovo dobra skracenica, ali nisam ni nasla drugu 2008, 21, 1333–1348. [Google Scholar] [CrossRef]
- Zhao, D.M.; Wu, J. The Influence of urban surface expansion in China on regional climate. J. Clim. 2017, 30, 1061–1080. [Google Scholar] [CrossRef]
- Zhao, D.M.; Wu, J. Contribution of urban surface expansion to regional warming in Beijing, China. J. Appl. Meteorol. Climatol. 2017, 56, 1551–1559. [Google Scholar] [CrossRef]
- Miller, A.A. Climatology, 8th ed.; Methuen and Co. Ltd.: London, UK, 1953; 318p. [Google Scholar]
- Pielke, R.A.; Davey, C.A.; Niyogi, D.; Fall, S.; Steinweg-Woods, J.; Hubbard, K.; Lin, X.; Cai, M.; Lim, Y.K.; Li, H. Unresolved issues with the assessment of multidecadal global land surface temperature trends. J. Geophys. Res. Atmos. 2007, 112, D16113. [Google Scholar] [CrossRef]
- China Meteorological Administration. Specifications for Surface Meteorological Observation Part 6: Measurement of Air Temperature and Humidity; QX/T 50-2007; China Meteorol. Press: Beijing, China, 2007; 14p. (In Chinese) [Google Scholar]
- Wang, K.C. Sampling biases in datasets of historical mean air temperature over land. Sci. Rep. 2014, 4, 4637. [Google Scholar] [CrossRef]
- Austin, J.F.; McConnell, A. James Six F.R.S. Two Hundred years of the six’s self-registering thermometer. Notes Rec. R. Soc. 1980, 35, 49–65. [Google Scholar]
- Vose, R.S.; Easterling, D.R.; Gleason, B. Maximum and minimum temperature trends for the globe: an update through 2004. Geophys. Res. Lett. 2005, 32, L23822. [Google Scholar] [CrossRef]
- Kalnay, E.; Cai, M. Impact of urbanization and land use change on climate. Nature 2003, 423, 528–531. [Google Scholar] [CrossRef] [PubMed]
- Howard, L. Climate of London deduced from meteorological observation. Harvey Darton 1833, 1, 1–24. [Google Scholar]
- Duckworth, F.A.; Sandberg, J.S. The effect of cities upon horizontal and vertical temperature gradients. Bull. Am. Meteorol. Soc. 1954, 35, 198–207. [Google Scholar] [CrossRef]
- Oke, T.R. Boundary Layer Climate; Great Britain at the University Press: Cambridge, UK, 1987; pp. 1–3. [Google Scholar]
- Yan, Z.W.; Wang, J.; Xia, J.J.; Feng, J.M. Review of recent studies of the climatic effects of urbanization in China. Adv. Clim. Change Res. 2016, 7, 154–168. [Google Scholar] [CrossRef]
- Masson, V. Urban surface modeling and the meso-scale impact of cities. Theor. Appl. Climatol. 2006, 84, 35–45. [Google Scholar] [CrossRef]
- Ooka, R. Recent development of assessment tools for urban climate and heat island investigation especially based on experience in Japan. Int. J. Climatol. 2007, 27, 1919–1930. [Google Scholar] [CrossRef]
- Skamarock, W.C.; Klemp, J.B.; Dudhia, J.; Gill, D.O.; Barker, D.M.; Duda, M.G.; Huang, X.Y.; Wang, W.; Powers, J.G. A Description of the advanced research WRF version 3. NCAR Tech. Note 2008. NCAR/TN–475+STR. [Google Scholar] [CrossRef]
- Jia, G.; Xu, R.; Hu, Y.; He, Y. Multi-scale remote sensing estimates of urban fractions and road widths for regional models. Clim. Chang. 2014, 129, 543–554. [Google Scholar] [CrossRef]
- Hu, Y.; Jia, G.; Pohl, C.; Feng, Q.; He, Y.; Gao, H.; Xu, R.; van Genderen, J.; Feng, J. Improved monitoring of urbanization processes in China for regional climate impact assessment. Environ. Earth Sci. 2015, 73, 8387–8404. [Google Scholar] [CrossRef]
- Kanamitsu, M.; Ebisuzaki, W.; Woollen, J.; Yang, S.-K.; Hnilo, J.J.; Fiorino, M.; Potter, G.L. NCEP-DOE AMIP-II Reanalysis (R-2). Bull. Am. Meteorol. Soc. 2002, 83, 1631–1643. [Google Scholar] [CrossRef]
- Zhao, D.M.; Zha, J.L.; Wu, J. Comparisons of urban-related warming for Shenzhen and Guangzhou. Atmos. Ocean. Sci. Lett. 2018, 11, 330–337. [Google Scholar] [CrossRef]
- Oke, T.R.; Spronken-Smith, R.A.; Jáuregui, E.; Grimmond, C.S.B. The energy balance of central Mexico City during the dry season. Atmos. Environ. 1999, 33, 3919–3930. [Google Scholar] [CrossRef]
- Roth, M.; Oke, T.R.; Emery, W.J. Satellite-derived urban heat islands from three coastal cities and the utilization of such data in urban climatology. Int. J. Remote Sens. 1989, 10, 1699–1720. [Google Scholar] [CrossRef]


| Caption | Numerical Experiments | EX1 | EX2 |
|---|---|---|---|
| Experimental Design | Integration periods | A series of restarts for individual years starting from 1 July in the previous year were performed for the years between 1980 and 2016, for which only the simulated results for the present year were analyzed. | |
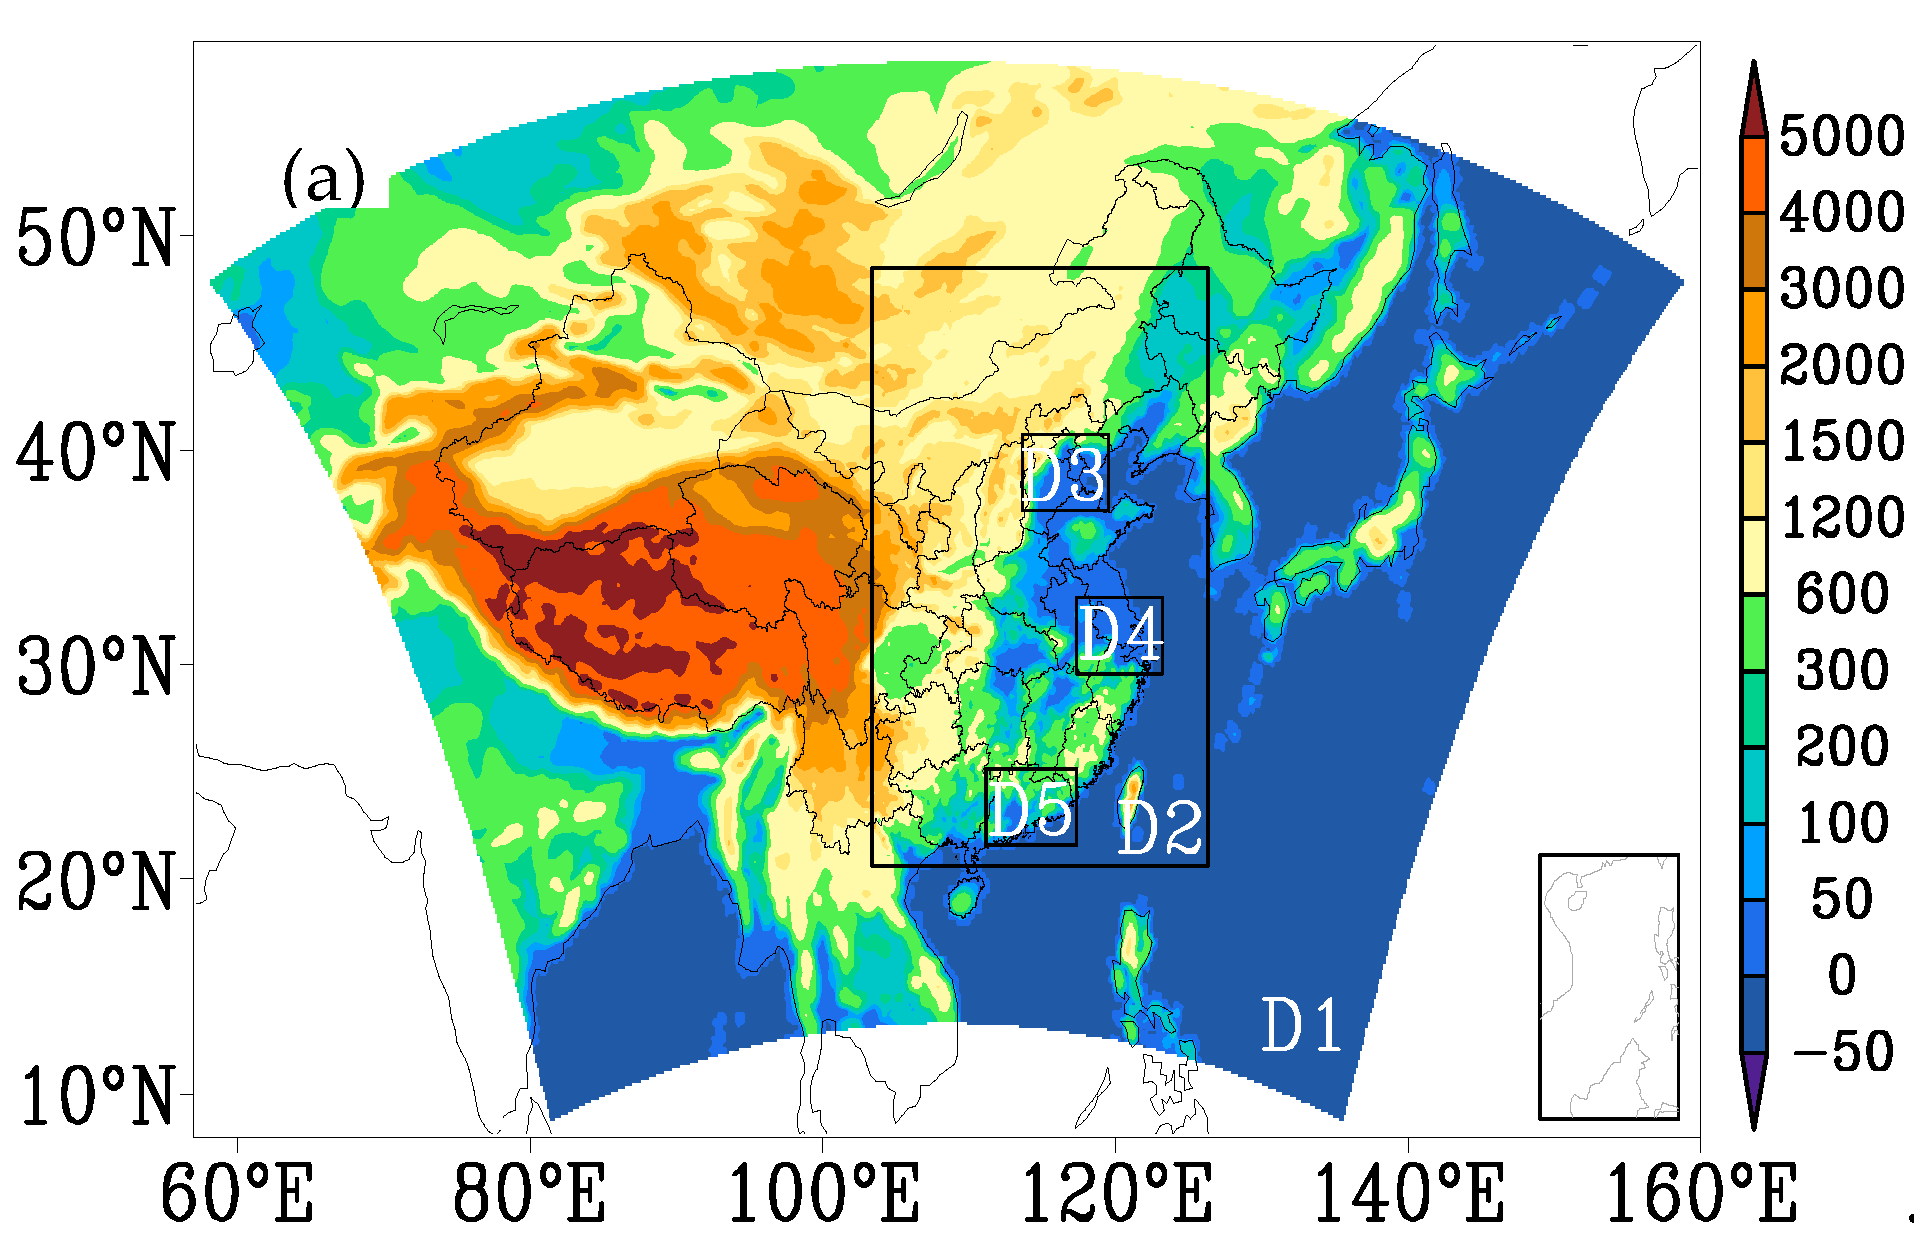
| Domains | The central latitude and longitude of the simulated domain are 35° and 108.5° E. The coarse mesh (D1) covers most of East Asia with a 30 km resolution. The first nested domain (D2) covers most of eastern China with a 10 km resolution. The second nested domains (D3–D5) cover the three city clusters (BTH, YRD, PRD) with a 3.3 km resolution. | ||
| Physical parameterization schemes | The unified Noah land-surface model including urban canopy model; the WRF single-moment 6 class graupel microphysics scheme; the Community Atmosphere Model shortwave and longwave radiation schemes; the Yonsei University boundary-layer scheme; the Grell 3D ensemble cumulus scheme (for 30 and 10 km resolution only). | ||
| Data | Driving data | The NCEP-DOE reanalysis data from 1979 and 2016 | |
| Land use data | Land use data with fixed-in-time urban surface distributions in 1980 | Annual urban surface distributions showing urban surface expansion from 1980 to 2016 were reconstructed using satellite-derived images in the years of 1980, 1990, 2000, 2010, and 2016, based on which the increase in fractional urban surface areas was assumed to increase linearly during each time period. | |
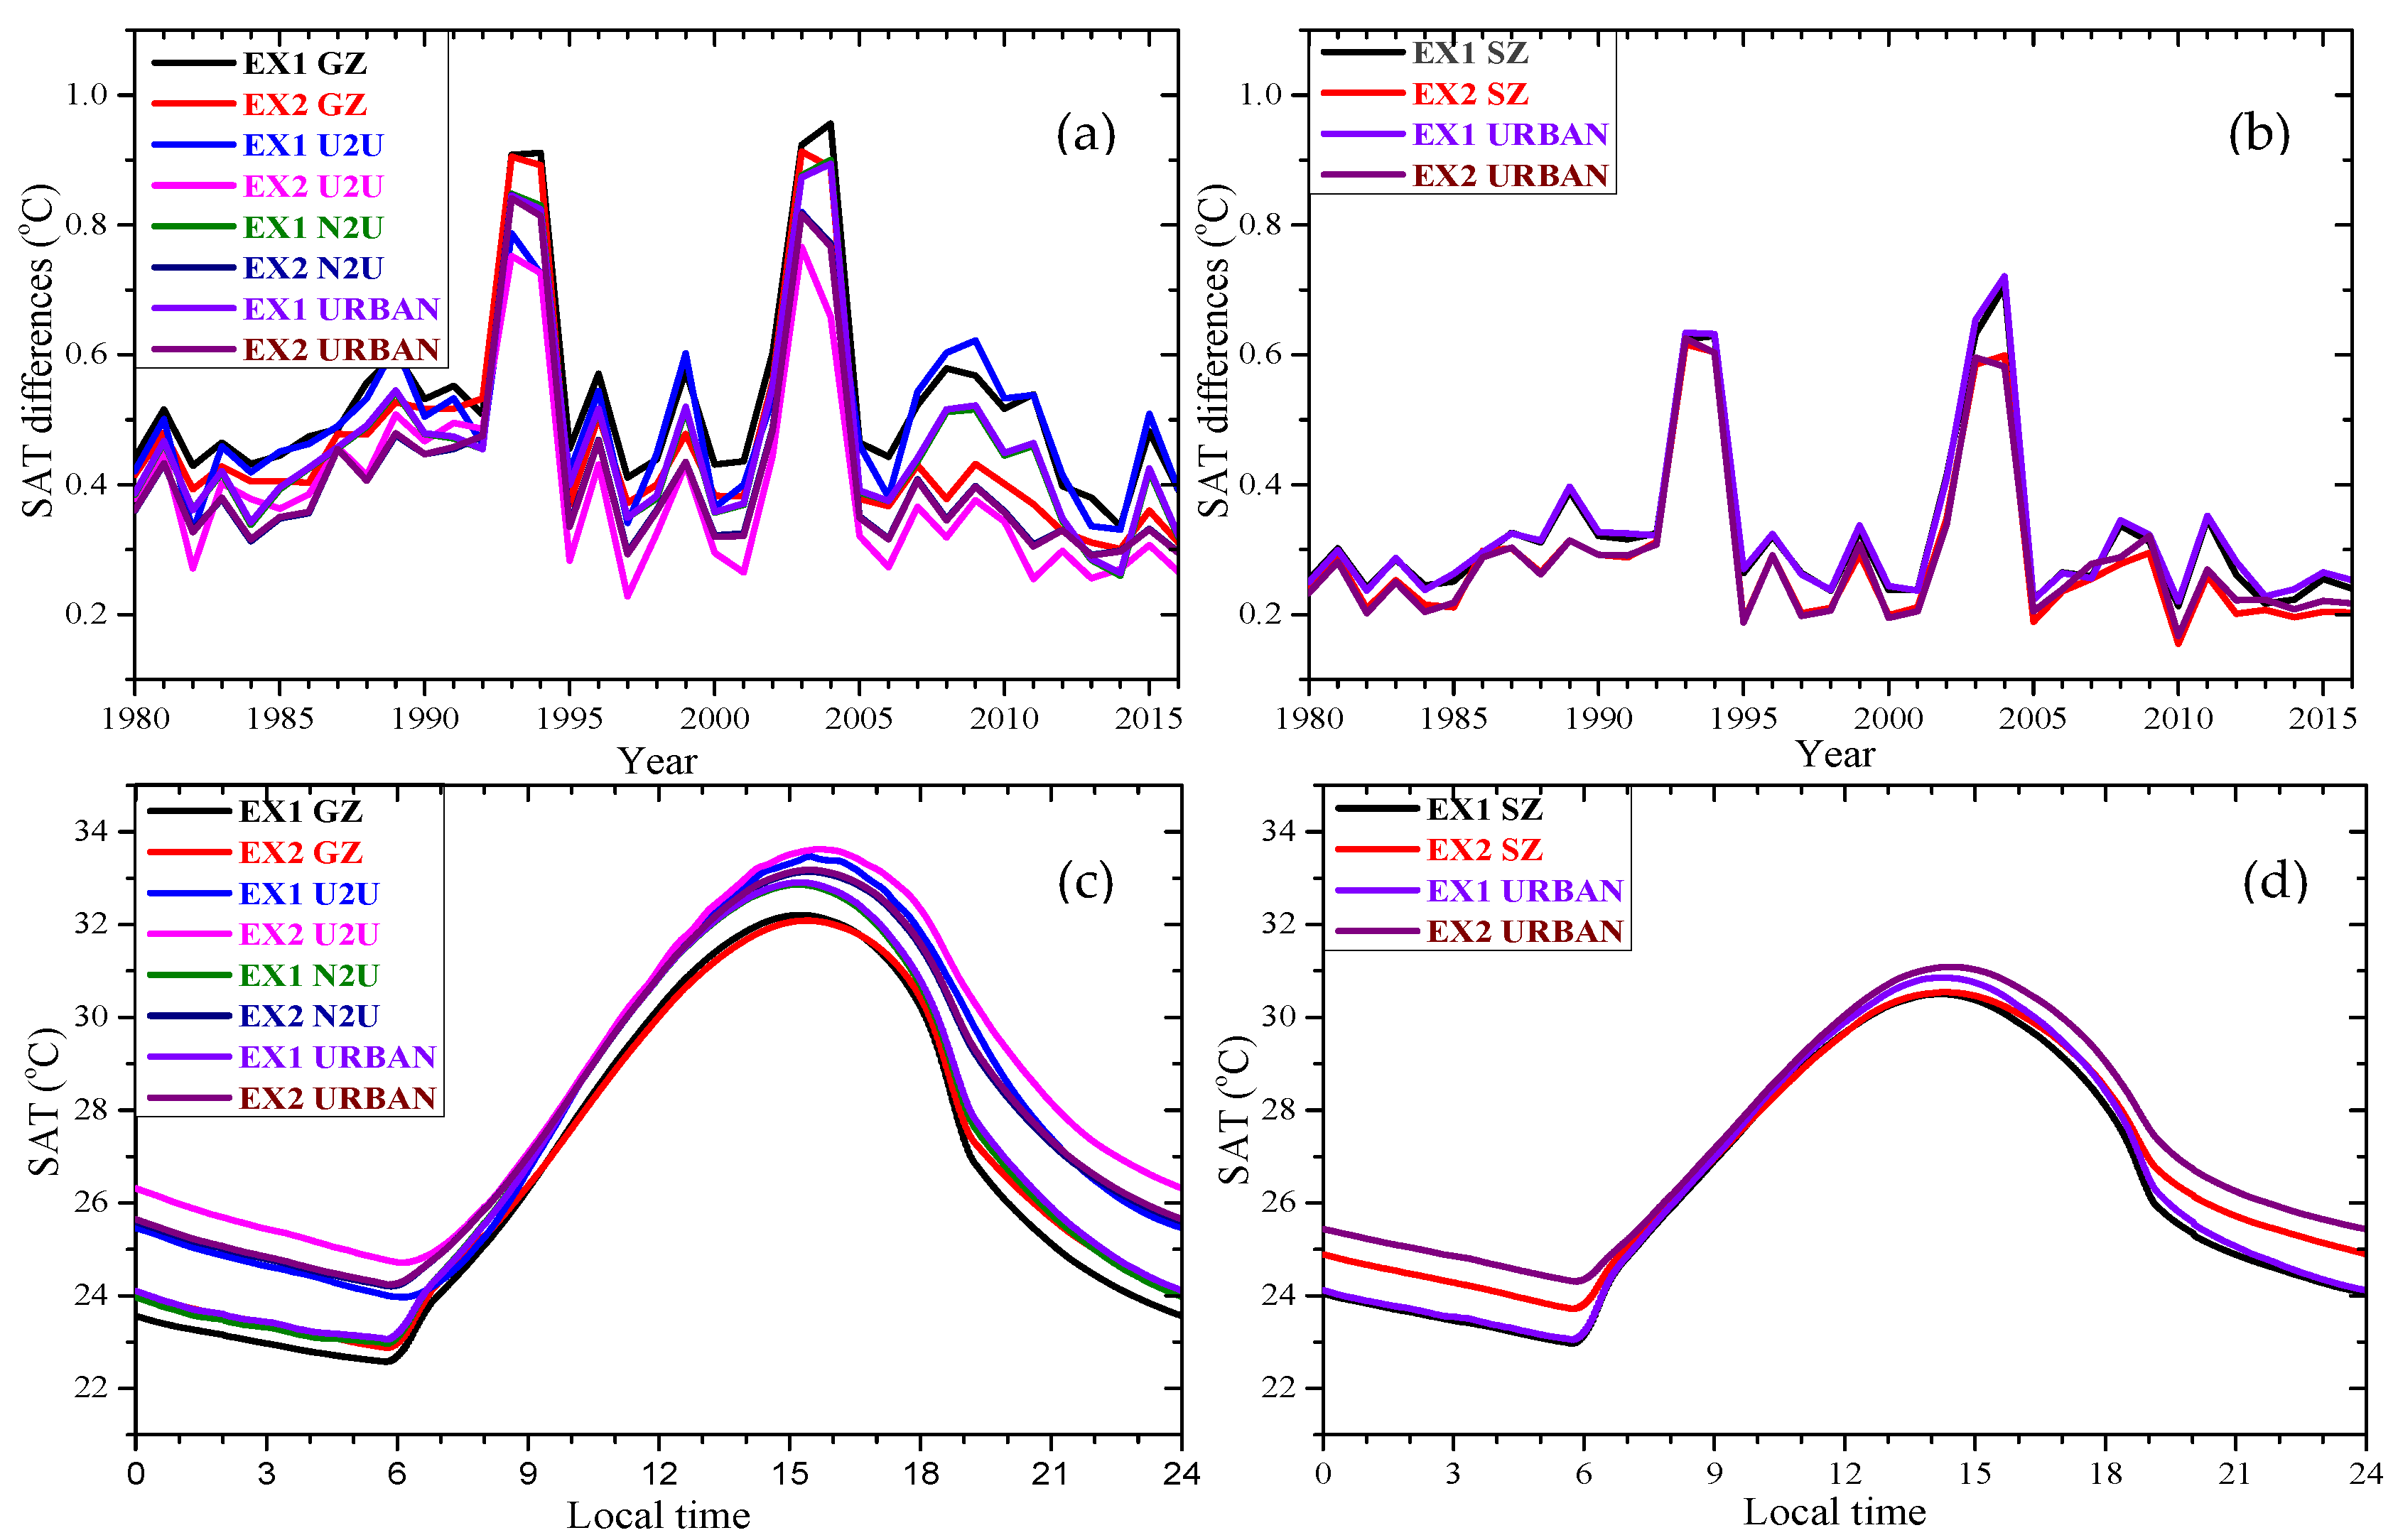
| Abbreviations | SAT averages | Txn: the averages of SAT maximum (Tmax) and minimum (Tmin) records; T4: the averages calculated using four time records each day; Tc: the averages calculated using the 24-h continuous records. | |
| U2U | Urban surface | Urban surface | |
| N2U | Non-urban surface | Urban surface | |
| Txn minus T4 | T4 minus Tc | ||||
|---|---|---|---|---|---|
| EX1/EX2 | Difference | EX1/EX2 | Difference | ||
| Guangzhou | Entire | 0.53 ****/0.48 **** | −0.052 | −0.071/−0.093 | −0.022 |
| U2U | 0.51 ****/0.41 **** | −0.092 | −0.14 */−0.13 | 0.018 | |
| N2U | 0.48 ****/0.42 *** | −0.053 | −0.075/−0.11 | −0.033 | |
| Urban | 0.49 ****/0.42 **** | −0.072 | −0.063/−0.11 | −0.042 | |
| Shenzhen | Entire | 0.33 ****/0.29 *** | −0.034 | −0.053/−0.086 | −0.033 |
| Urban | 0.34 ****/0.30 **** | −0.035 | −0.062/−0.097 | −0.035 | |
| T4 | Txn | Tc | ||||
|---|---|---|---|---|---|---|
| EX1/EX2 | Contribution | EX1/EX2 | Contribution | EX1/EX2 | Contribution | |
| Guangzhou | Entire | 17.7 * | 0.55/0.64 | 14.0 * | 0.56/0.67 | 16.7 * |
| U2U | 25.3 *** | 0.52/0.65 | 19.6 * | 0.53/0.68 | 22.2 *** | |
| N2U | 42.9 **** | 0.54/0.94 | 42.5 **** | 0.56/0.98 | 43.5 **** | |
| Urban | 42.3 **** | 0.54/0.93 | 41.7 **** | 0.55/0.97 | 42.8 **** | |
| Shenzhen | Entire | 35.2 **** | 0.47/0.72 | 34.6 *** | 0.48/0.74 | 35.8 **** |
| Urban | 43.9 **** | 0.48/0.84 | 43.5 **** | 0.480/0.87 | 44.8 **** | |
| Tmax EX1/EX2/EX2-EX1 | Tmin EX1/EX2/EX2-EX1 | DTR EX2-EX1 | ||
|---|---|---|---|---|
| Guangzhou | Entire | 0.63/0.63/0.0040 | 0.47/0.65/0.18 ** | −0.14 ** |
| U2U | 0.58/0.61/0.029 | 0.46/0.69/0.23 *** | −0.17 *** | |
| N2U | 0.59/0.60/0.0052 | 0.49/1.28/0.79 **** | −0.75 **** | |
| Urban | 0.59/0.60/0.064 | 0.49/1.26/0.77 **** | −0.72 **** | |
| Shenzhen | Entire | 0.53/0.51/−0.013 | 0.42/0.93/0.51 **** | −0.53 **** |
| Urban | 0.54/0.54/0.00056 | 0.42/1.15/0.74 **** | −0.73 **** |
© 2019 by the authors. Licensee MDPI, Basel, Switzerland. This article is an open access article distributed under the terms and conditions of the Creative Commons Attribution (CC BY) license (http://creativecommons.org/licenses/by/4.0/).
Share and Cite
Zhao, D.; Wu, J. Modelling Daily Mean Surface Air Temperature Calculated from Different Methods and Its Impact on Urban-Related Warming Evaluations over Guangzhou and Shenzhen Using the WRF Model. Atmosphere 2019, 10, 48. https://doi.org/10.3390/atmos10020048
Zhao D, Wu J. Modelling Daily Mean Surface Air Temperature Calculated from Different Methods and Its Impact on Urban-Related Warming Evaluations over Guangzhou and Shenzhen Using the WRF Model. Atmosphere. 2019; 10(2):48. https://doi.org/10.3390/atmos10020048
Chicago/Turabian StyleZhao, Deming, and Jian Wu. 2019. "Modelling Daily Mean Surface Air Temperature Calculated from Different Methods and Its Impact on Urban-Related Warming Evaluations over Guangzhou and Shenzhen Using the WRF Model" Atmosphere 10, no. 2: 48. https://doi.org/10.3390/atmos10020048
APA StyleZhao, D., & Wu, J. (2019). Modelling Daily Mean Surface Air Temperature Calculated from Different Methods and Its Impact on Urban-Related Warming Evaluations over Guangzhou and Shenzhen Using the WRF Model. Atmosphere, 10(2), 48. https://doi.org/10.3390/atmos10020048


