Article

Impact of the Eurasian Teleconnection on the Interannual Variability of Haze-Fog in Northern China in January

1
College of Oceanic and Atmospheric Sciences, Ocean University of China, Qingdao 266100, China
2
School of Earth and Atmospheric Sciences, Georgia Institute of Technology, Atlanta, GA 30332, USA
*
Author to whom correspondence should be addressed.
Atmosphere 2019, 10(3), 113; https://doi.org/10.3390/atmos10030113
Submission received: 9 February 2019 / Revised: 20 February 2019 / Accepted: 26 February 2019 / Published: 2 March 2019

Abstract

:
Using meteorological observation data and NCEP/NCAR (National Centers for Environmental Prediction/National Center for Atmospheric Research) reanalysis data, the impacts of the atmospheric circulation pattern on the interannual variability of haze-fog in northern China in January are studied by means of statistical methods. The results showed that the Eurasian teleconnection (EU) at the 500 hPa isostatic surface is the most important pattern affecting the haze-fog frequency in northern China. However, the existing EU index cannot perfectly describe this pattern. To this end, this study selects three main activity centers to define a new EU index, which are located in the Europe (10 °E, 55 °N), Siberia (80 °E, 60 °N), and Shandong, China (120 °E, 40 °N). The difference between the existing EU index and the new EU index is mainly the position of the anomaly center of the 500 hPa geopotential height. The EU is in a negative phase in higher haze-fog years but is in a positive phase in lower haze-fog years. The 500 hPa geopotential height shows negative anomalies in Europe and East Asian and a positive anomaly in Siberia in the negative EU phase. Using Plumb wave activity flux analysis, it was found that the cold wave affecting northern China is less in the negative EU phase than that in the positive EU phase, which resulted in more haze-fog days. In addition, the results also showed that the EU pattern goes through a considerable development and decay within 13 days. The visibility starts to significantly decrease at a lag of −1 to 2 days in the negative EU peak phase and is influenced by the weak north wind that is caused by the high pressure.

1. Introduction

Haze and fog lead to reductions in horizontal visibility caused by suspensions in the air [1]. Although the compositions of the suspended materials are different, fog and haze often coexist and are interchangeable under certain conditions [2,3]. When studied together, they are referred to as the ‘haze-fog’ phenomena. There are more haze-fog days in eastern China than in Western China, especially in the middle and lower reaches of the Yangtze River and North China [4,5,6]. In addition, the number of haze-fog days has significantly increased after the 1980s, and haze-fog occurs mostly in December and January [7,8]. The number of haze-fog days in December and January has reached 30% of the annual haze-fog days, and many severe haze-fog events have also occurred in these two months [7,8]. Significant interannual variability was also found in winter [9].
Anthropogenic emissions are the cause of the difference between the haze-fog distributions in northern China and southern China in the winter [10]. Furthermore, variations in the anthropogenic emissions dominated the increases in the winter PM2.5 concentrations over eastern China during the past decades [11]. However, the interannual variations of the PM2.5 concentrations are mainly driven by the variations in meteorological parameters and not anthropogenic emissions [11,12]. For example, the mid-tropospheric weather system, including the polar vortex, the Ural Mountains High, and the East Asia deep trough, can affect the generation and dissipation of haze-fog in China by affecting surface meteorological elements [8,13,14].
Studies show that the impact of the synoptic weather circulation anomalies that are associated with the Ural High on East Asian winter climatic anomalies is strengthening, thus following the wave from the west to the east for Eurasia [15]. Yang et al. [16] found that the Eurasian telecorrelation has an important influence on the intensity of the mid-high latitude ridges and troughs in the northern hemisphere, so the teleconnection has an important influence on the climate in East Asia. Wallace and Gutzler [17] pointed out that there are five types of teleconnections at the 500 hPa altitude in the northern hemisphere in the winter, including the Eurasian Pattern (EU). In particular, the Eurasian Pattern is located over the Eurasian continent, and its changes are closely related to the adjustment of the atmospheric circulation in the northern hemisphere in the winter [18,19], which is an important indicator of climate change in East Asia. For example, Sung et al. [20] found that the frequency of cold and warm winter events in East Asia is closely related to the Eurasian pattern. Liu et al. [21] found that there is a negative correlation between the Eurasian pattern and temperature and precipitation in eastern China. The EU may also have an important influence on haze-fog. Zhai et al. [22] mentioned that due to the negative Eurasian phase, the northerly winds in northern China were suppressed and the occurrence of haze-fog increased at the end of 2015 is due to the negative Eurasian phase. Furthermore, many studies showed that the interdecadal and intraseasonal changes of haze-fog in eastern China are connected with the intensity of the East Asian monsoon [23,24,25]. Liu [26] studied the relationship between the monsoon in East Asia and haze-fog and considered that the calm weather that was related to the Siberian High and cold wave are the main influencing factors of haze-fog variation in the winter. Meanwhile, Lim and Kim [27] believed that the relationship between East Asian winter monsoon anomalies and the Eurasian pattern is more pronounced than that of the Arctic Oscillation pattern. Given the above, the EU may affect winter haze-fog in China by influencing the East Asian Monsoon, but the impact mechanism is not clear enough.
Most of the previous studies on the influence of the geopotential height on haze-fog are case studies [28,29,30]. However, there are still deficiencies in the study of the effects of interannual changes on haze-fog. Moreover, the Eurasian pattern in the winter has an important influence on haze-fog. According to the previous analysis, this paper argues that the EU may influence the East Asian monsoon by changing the strength of the East Asian trough and may ultimately result in the interannual variability of the haze-fog in northern China. January is the most frequent month of haze-fog [4]. Therefore, this paper will take January as a representative, study the basic characteristics of the EU pattern and its influencing mechanism on haze-fog variability and assess the impact of the EU activity cycle on visibility. A brief description of the data and methods will be illustrated in Section 2. Section 3 discusses the statistical relationship between the 500 hPa geopotential height and the haze-fog days in northern China. Section 4 discusses the influencing mechanisms of the Eurasian pattern on haze-fog days. Section 5 summarizes the findings.

2. Data and Methods

2.1. Data

2.1.1. Observation Data

The meteorological observation data in this study were obtained from the China Meteorological Administration (CMA). Observations including weather phenomena, visibility, temperature, relative humidity, and wind speed were recorded four times daily (02:00, 08:00, 14:00, and 20:00 LCT). The observation data for the period from 1980 to 2015 from the stations in the region (30–40 °N, 110–125 °E) were analyzed. However, the data from 1993 and 2000 were excluded due to the lack of data. Eighty stations were selected.
As shown in Figure 1, these stations evenly cover the entire region and the density is appropriate, which can represent the regional characteristics of Northern China. The haze-fog criterion in this paper is that the visibility is less than or equal to 10 km. Precipitation, dust, and other factors that may affect visibility are eliminated [9,26].

2.1.2. Reanalysis Data

The monthly mean and daily mean reanalysis data of January that were used in this study are from the National Centers for Environmental Prediction-National Center for Atmospheric (NCEP/NCAR) reanalysis. The dataset covers a 36-yr period from 1980 to 2015 and spans 2.5º × 2.5º in latitude and longitude, including the geopotential height and wind at each standard level from 10 to 1000 hPa.

2.2. Methods

The covariance matrix of the 500 hPa geopotential height field and the haze-fog day’s field was processed using singular value decomposition (SVD). SVD decomposes the covariance matrix into a set of mutually independent cross-covariance matrices [31] representing the spatial distribution of each pattern of the two fields. Then, two heterocorrelation coefficient fields are obtained by calculating the correlation coefficient.
The difference in the geopotential height field between the higher haze-fog years and the lower haze-fog years is calculated using composite analysis.
To analyze the anomalous propagation of planetary waves, this paper uses Plumb wave activity fluxes. Shi et al. [32] used Plumb wave activity flux analysis to find that the anomalous propagation of atmospheric longwave waves before the super cold wave in Southern China in January 2016 facilitated the accumulation of cold air, and the location was abnormally southward. Plumb [33] defined the wave activity flux to indicate the propagation of planetary wave packets in three-dimensional space as follows
Fs = p p 0 cos φ × { v 2 1 2 Ω a sin 2 φ ( v Φ ) λ u v + 1 2 Ω a sin 2 φ ( u Φ ) λ 2 Ω sin φ S [ v T 1 2 Ω a sin 2 φ ( T Φ ) λ ] }
where the standard reference pressure p 0 = 1000   h Pa , S = T ¯ z + κ T ¯ H is the static stability and κ ≈ 0.286. z = −H ln(p/p0) is a log p vertical coordinate with the scale height H = 8 km, and u and v are geostrophic winds that are calculated as follows
{ u = 1 f a Φ φ v = 1 f a cos φ Φ λ
u and v are the zonal wind and meridional wind, respectively. Ω, a, f, Φ, Z, φ, and λ represent the Earth’s rotation rate, the Earth’s radius, the Coriolis parameter, the geopotential, the geopotential height, the latitude, and the longitude, respectively. (ˉ) and ()’ represent zonal average and deviation from zonal average, respectively.

3. Haze-Fog Features and Their Relationship with the Eurasian Teleconnection

The pollution emissions in Eastern China significantly increased from 1980 to 1990 and from 2000 to 2010, and slowly decreased from 1990 to 2000, which was found in the IPCC Fifth Assessment Report’s (AR5) emissions inventories [34]. Xie and Han [35] and Fu and Dan [5] also gave similar statistical results. With respect to the emissions change trend, we use a cubic function to detrend the data, which is shown as the solid red line in Figure 2. The number of haze-fog days followed an increasing trend from 1980 to 1990 and from 2003 to 2015 but a decreasing trend from 1991 to 2002. The number of haze-fog days after the removal of trend will be used in later study.
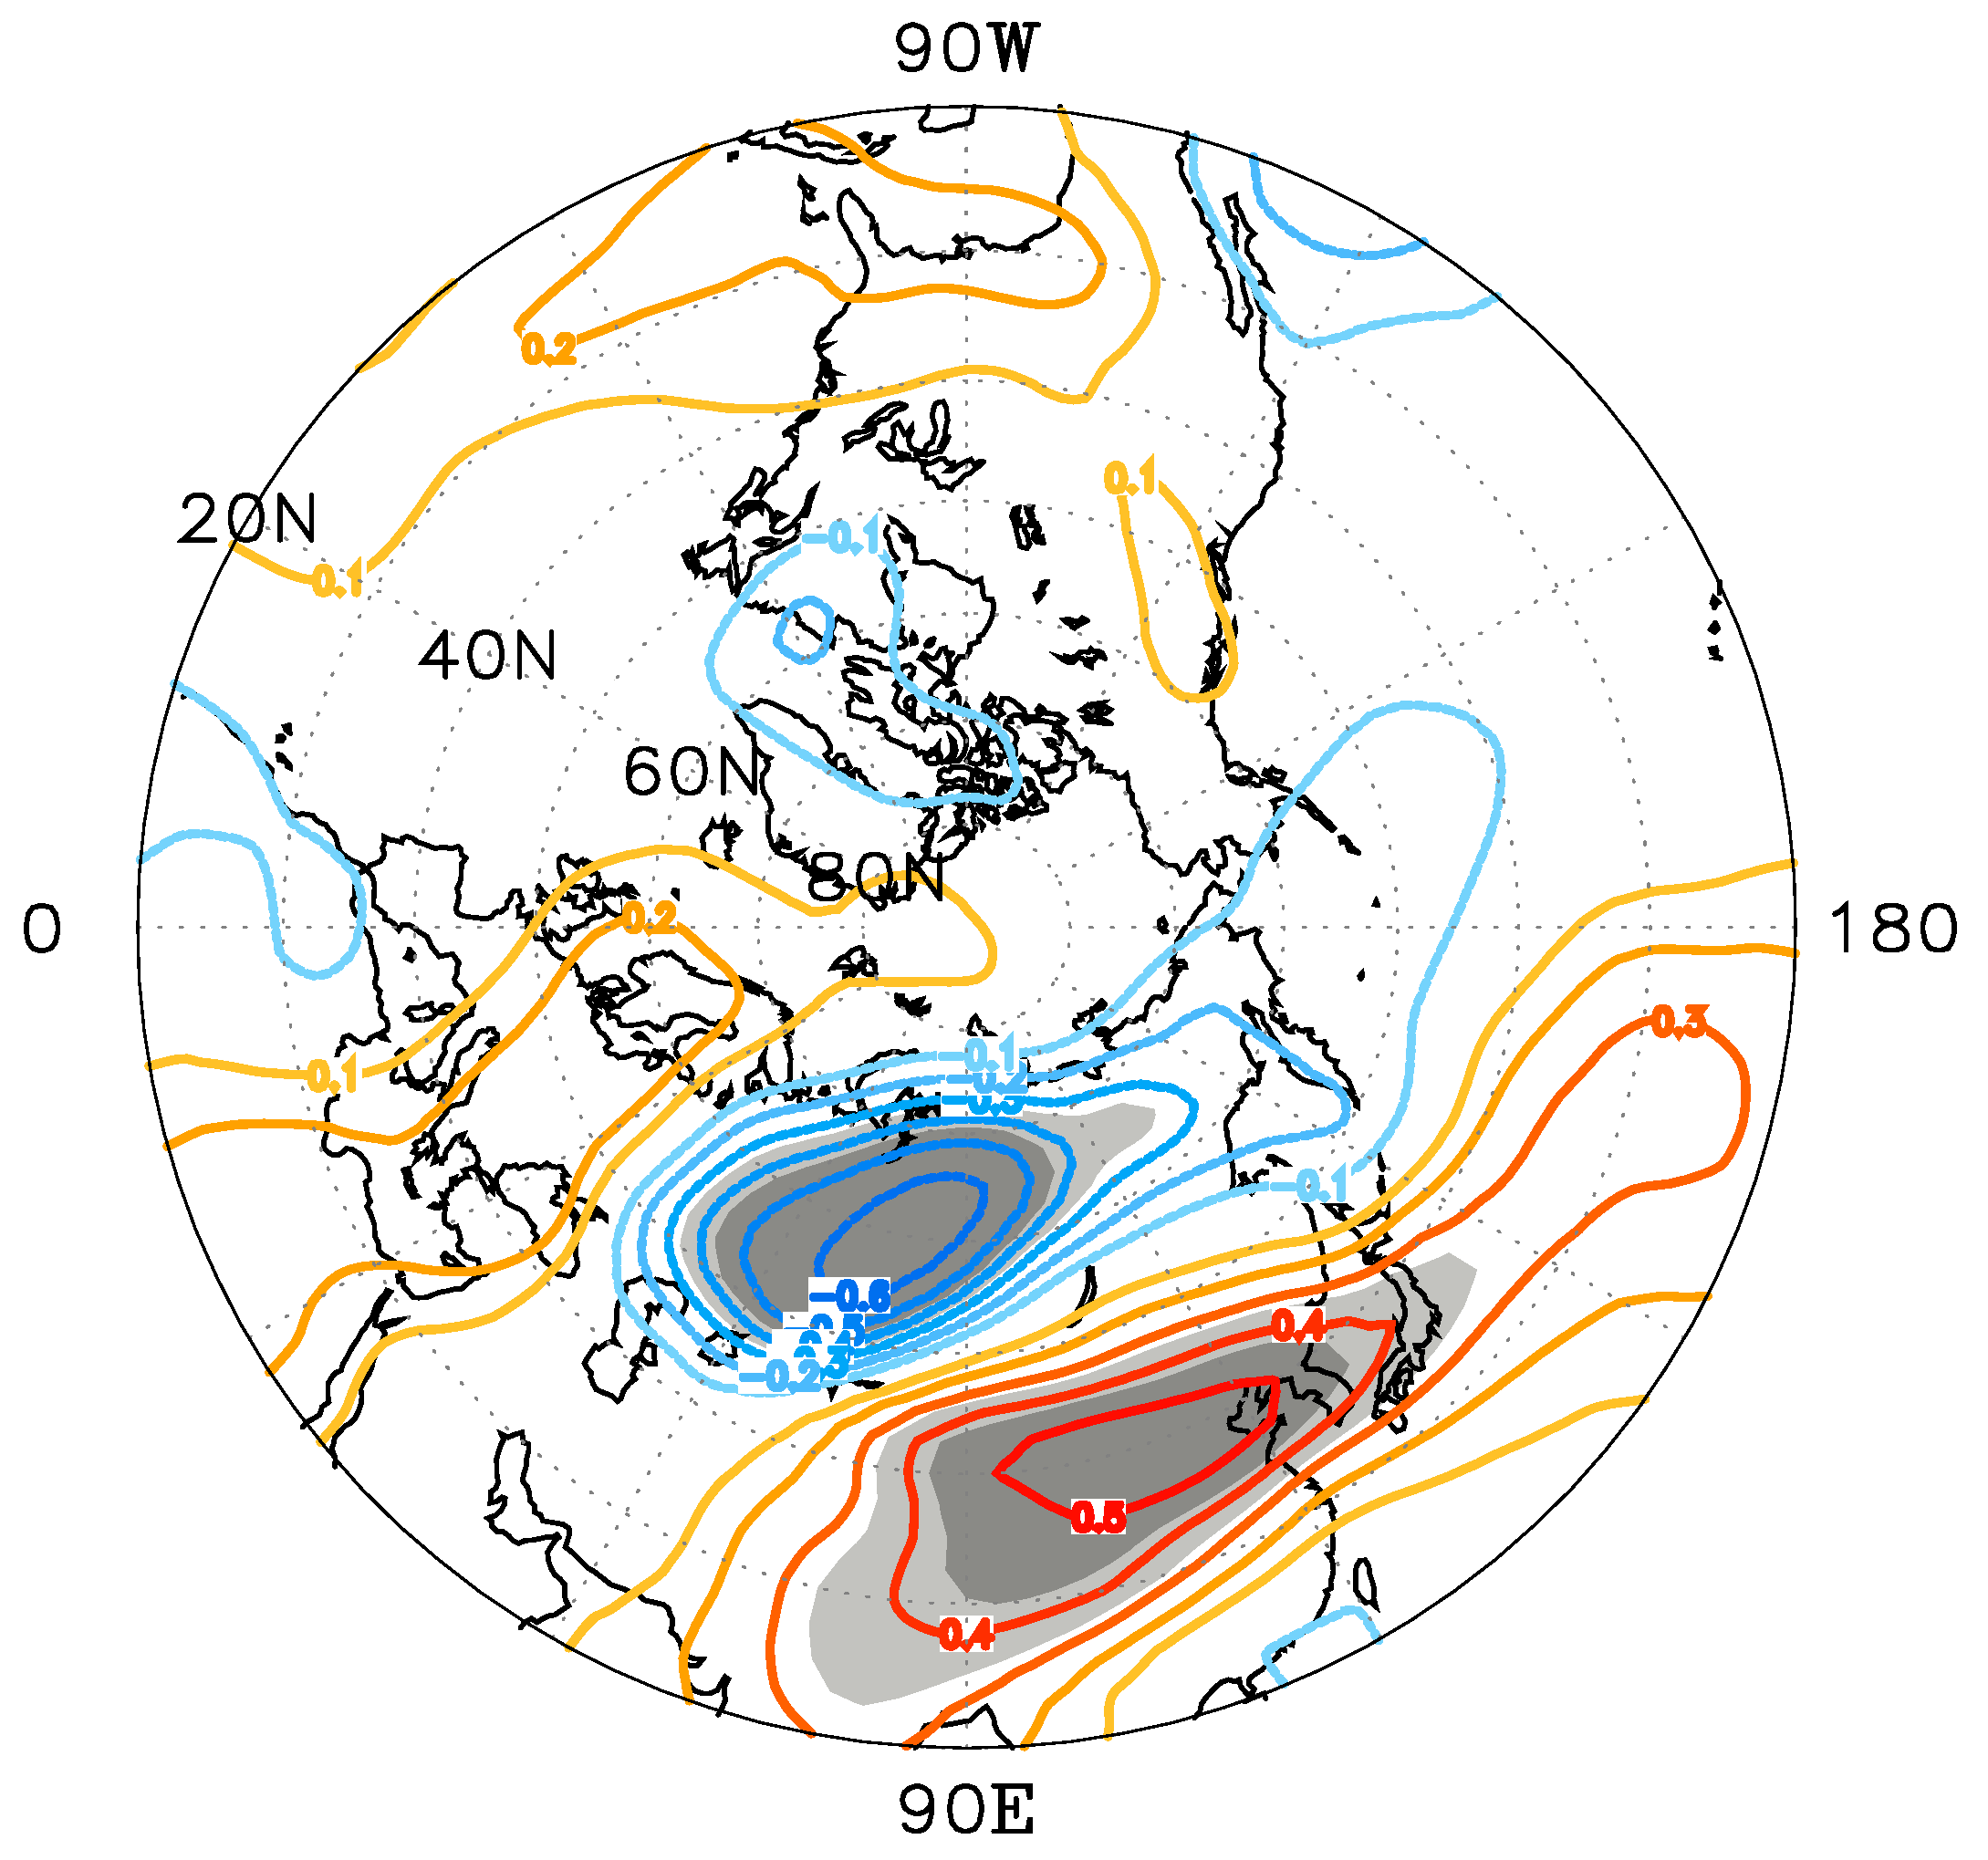
To clarify the relationship between the 500 hPa geopotential height fields in the northern hemisphere and the number of haze-fog days in January in northern China, the correlative analysis of the 500 hPa geopotential height anomaly field and haze days in January from 1980 to 2015 is performed (Figure 3). The haze-fog day’s data are detrended in order to remove the influence of anthropogenic emissions. There are two significant centers in the correlation coefficient field, and all of them exceed the 95% confidence level. The positively related centers are located in the Europe and East Asian, while the negatively related centers are in Western Siberia. There is also a positive correlation in the European region, but it only exceeds the 90% confidence level (not shown). It shows that when the number of haze days increases, the 500 hPa geopotential height decreases in Siberia and rises in Europe and the East Asian coastal regions. In other words, the deep trough in northwestern Europe and East Asia and the high-pressure ridges in the Urals are all weakened, which means that the meridional component of the westerly circulation is weakened.
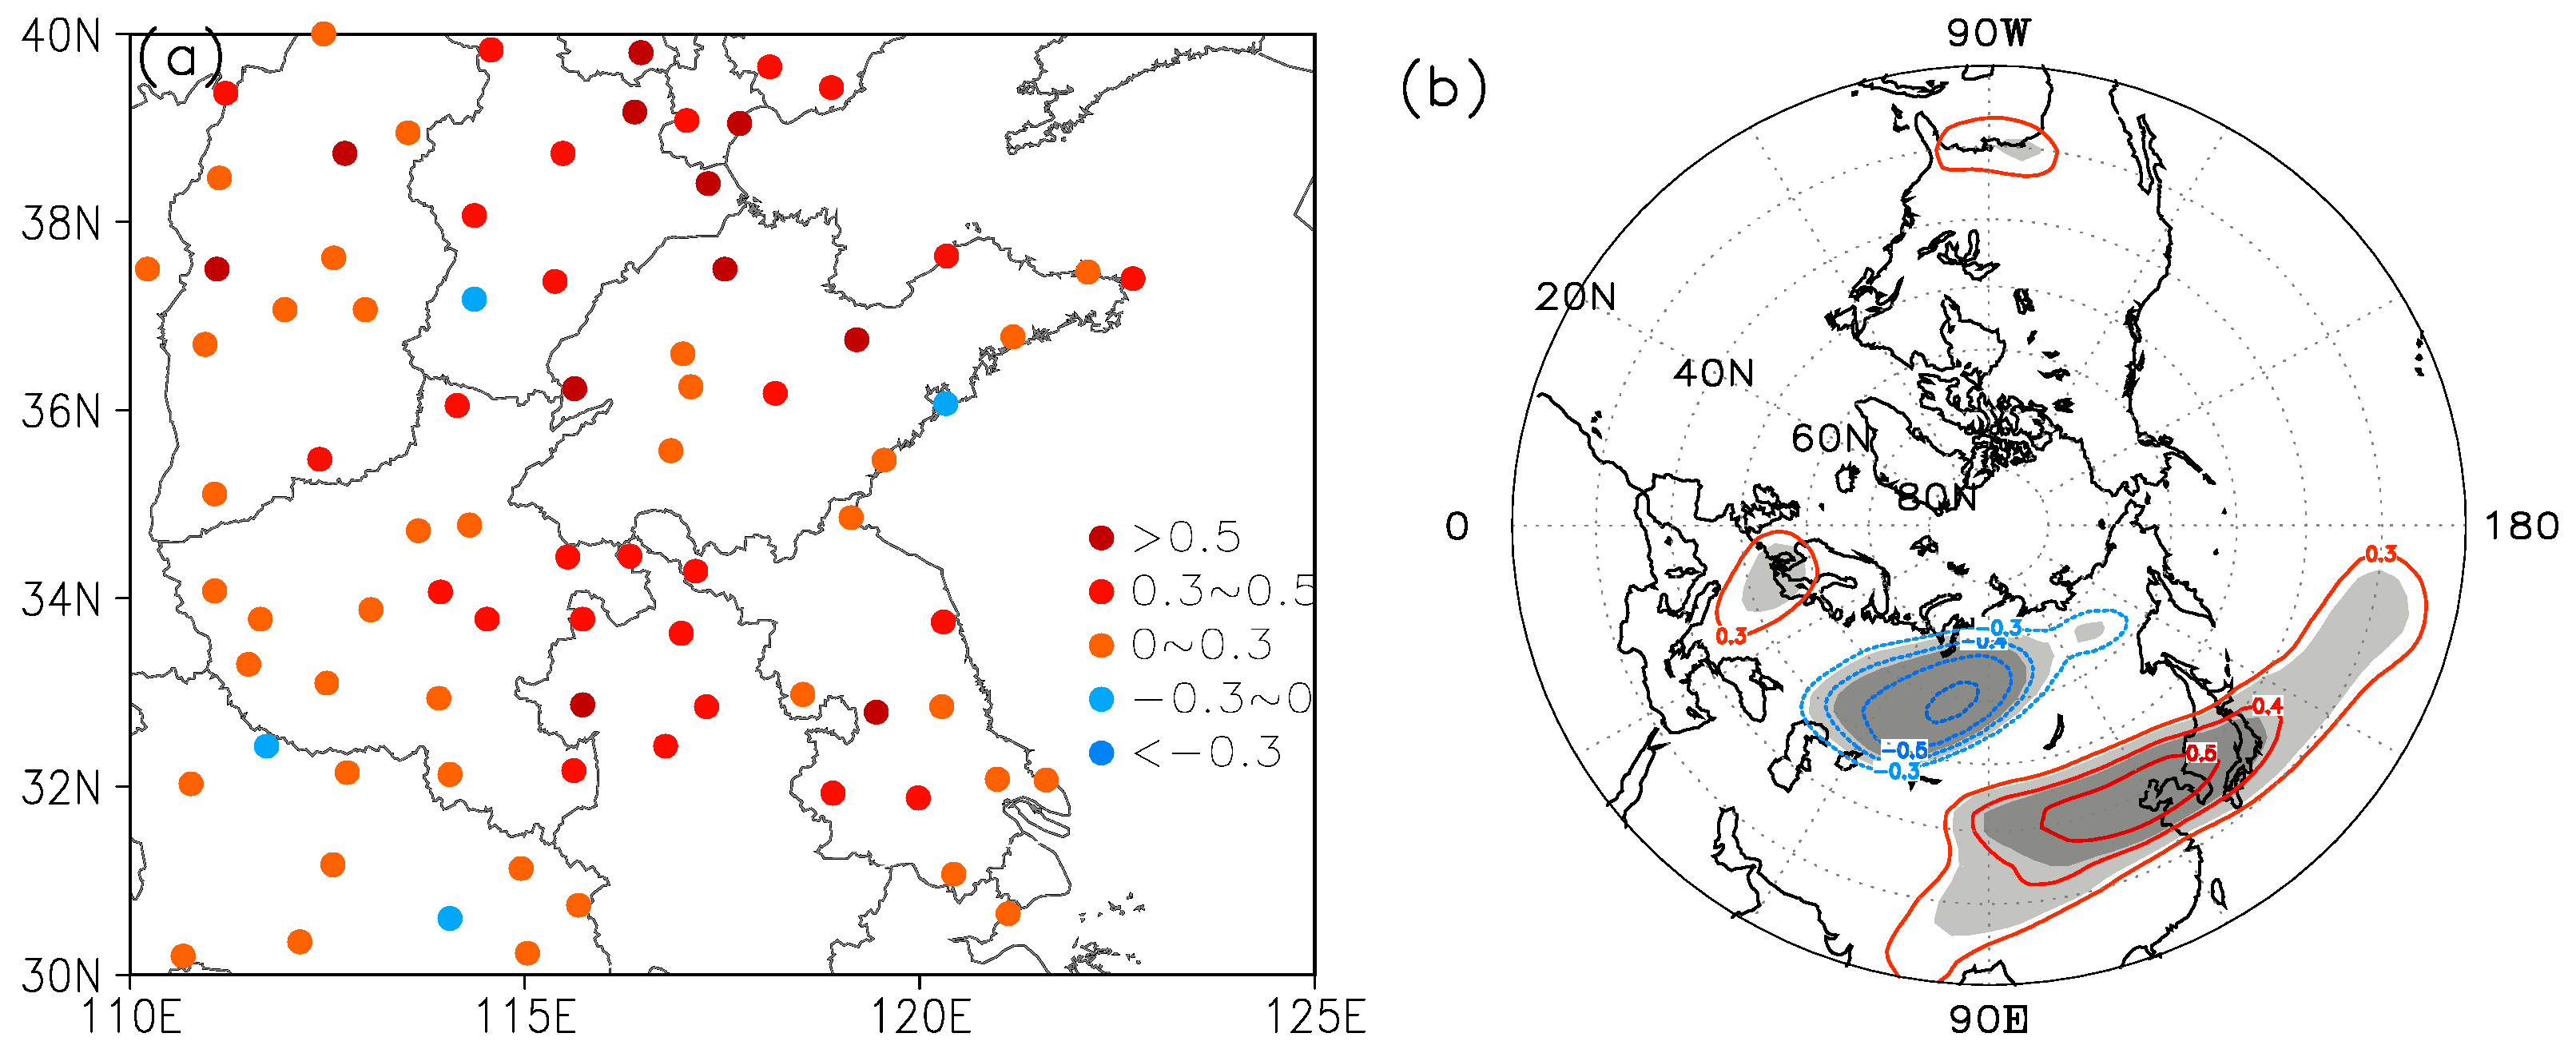
The spatial and temporal characteristics of the correlation field between the 500 hPa geopotential height and the number of haze-fog days after being detrended is analyzed using SVD. This study focuses its analysis on the first mode. The heterogeneity-related fields of the number of haze-fog days at most sites showed a consistent positive distribution. For the geopotential height, the significant center of the heterogeneity correlation coefficient demonstrates a “positive negative positive” pattern from Europe to Northeast China, which is the similar to the correlation coefficient field.
Both the correlation coefficient field and the first mode of the SVD show that the 500 hPa geopotential height field is a zonal wave train over the Eurasian continent. It is a negative anomaly in the Ural region and a positive anomaly in the East Asian coast and Europe when the number of haze-fog days increases. This pattern is similar to the Eurasian teleconnection pattern (EU) that was proposed by Wallace and Gutzler [17] using one-point correlation, except for the position of the largest correlation center. In order to more accurately analyze the EU pattern in this study, a new EU index was defined according to the definition of Wallace and Gutzler’s [17] EU index. We select the three grid points with the largest correlation coefficients (Figure 3 and Figure 4b) to calculate the EU index: one in the Europe (10 °E, 55 °N), one in Siberia (80 °E, 60 °N), and one at Shandong, China (120 °E, 40 °N). Based on the normalized 500 hPa monthly mean geopotential height anomaly (represented by the symbol z) of these three grid points, a Eurasian teleconnection index (represented by IEU) was defined as follows.
IEU = −1/4 × z(10° E,55° N) + 1/2 × z(80° E,60° N) − 1/4 × z(120° E,40° N)
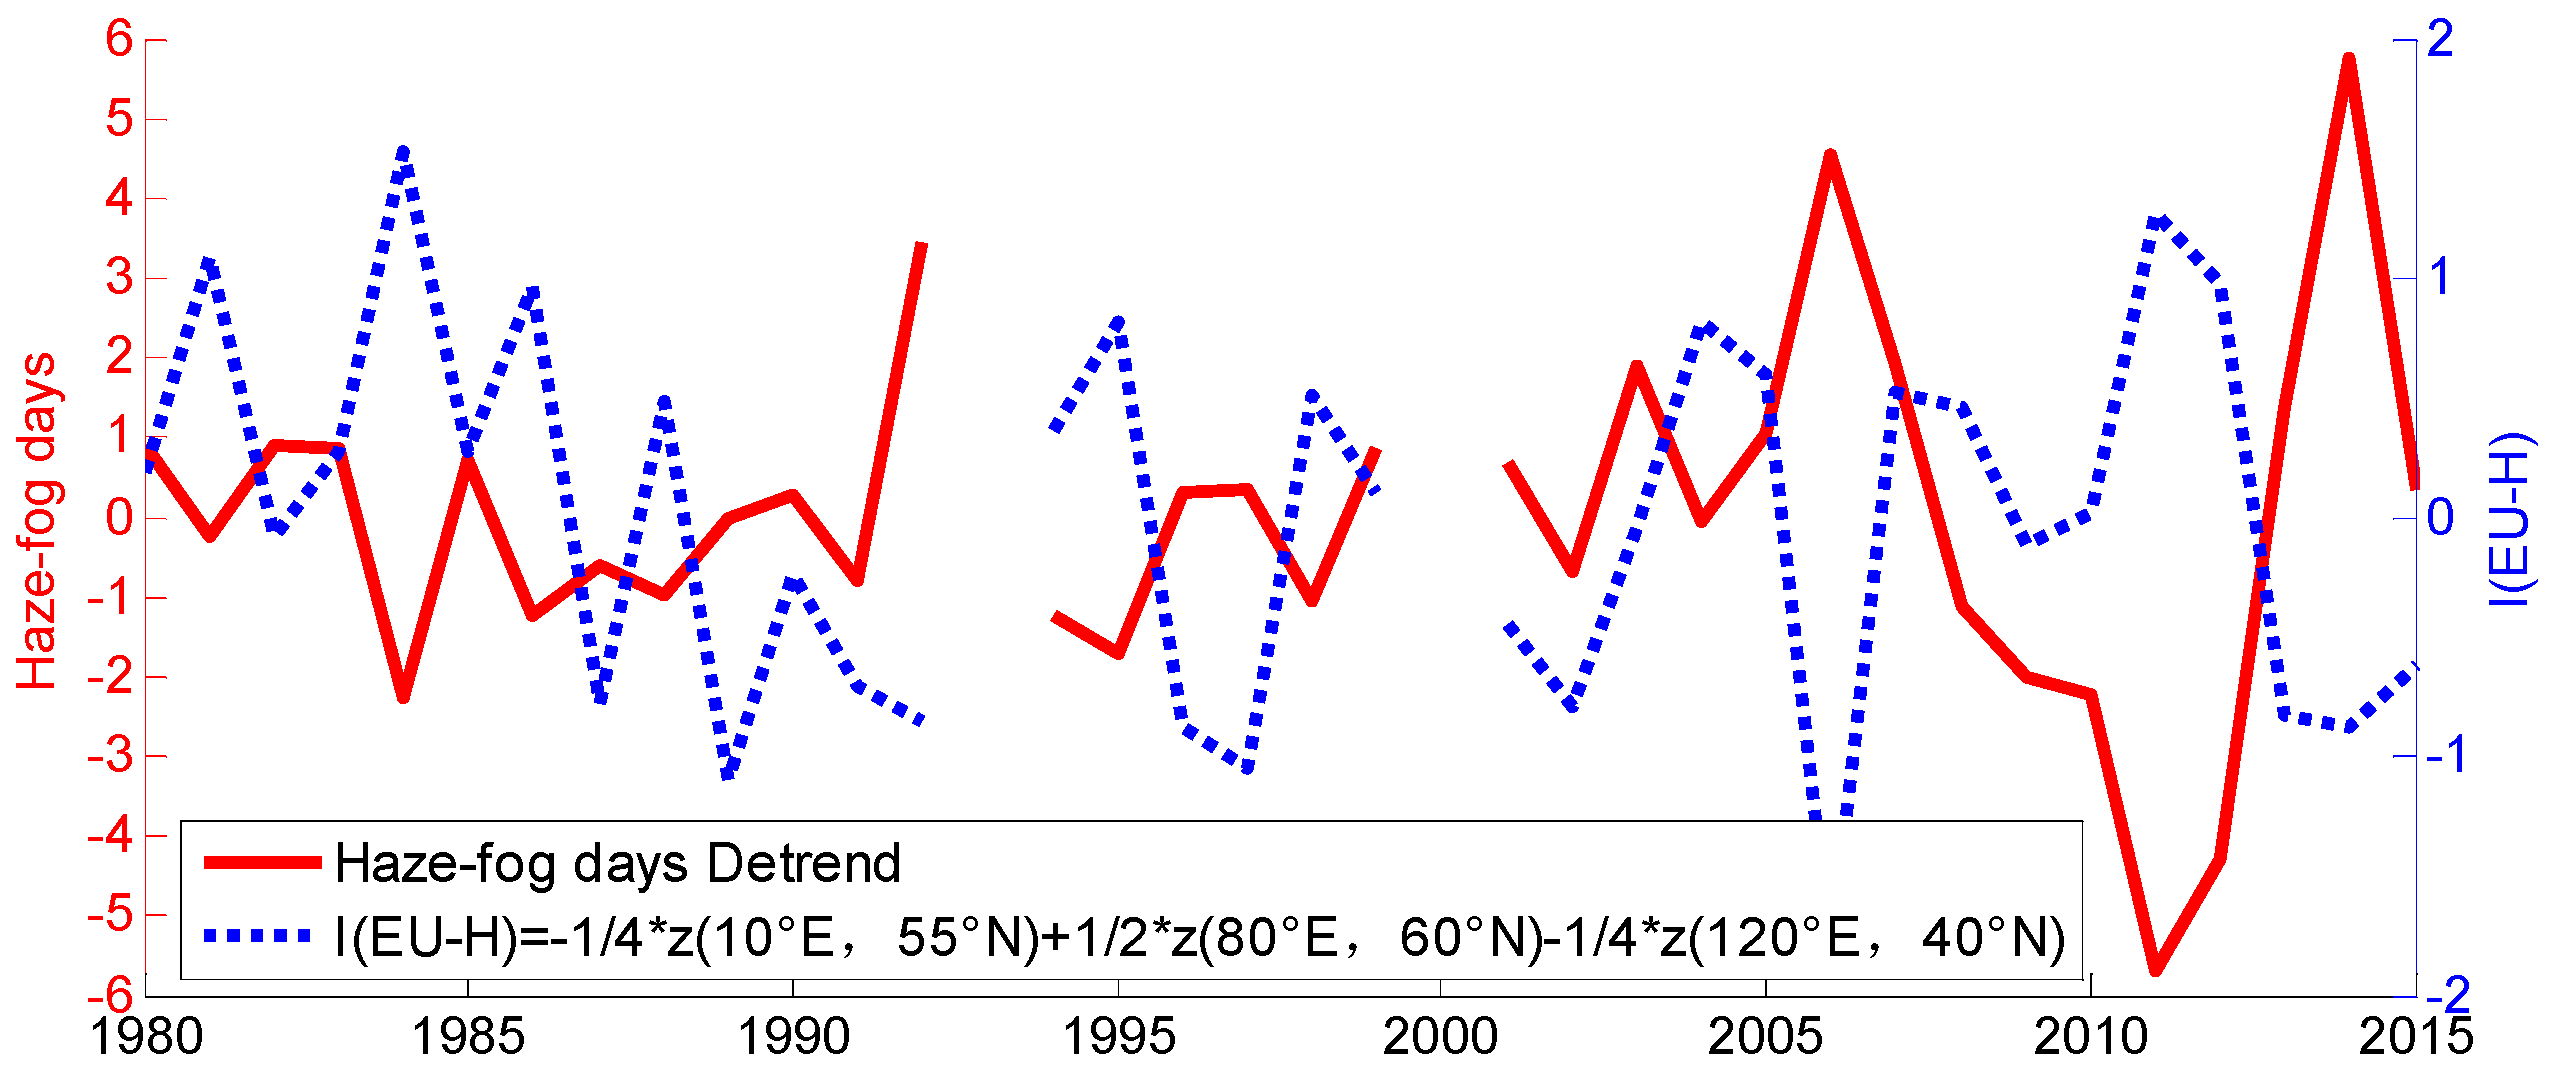
Compared with the EU index that was defined by Wallace and Gutzler, the three center points are more compact in the IEU, and the center in Asia moves from Japan to the coast of China. The correlation coefficient of IEU and haze-fog days is −0.6 (Figure 5), thus exceeding the 99% confidence level. It means that when the EU index is in the positive phase, the number of haze days decreases, and when the EU index is negative, the number of haze days increases.

4. Influencing Mechanism of EU on Haze-Fog

4.1. Impact Mechanism of EU on Haze-Fog

The correlation between the 500 hPa circulation and the number of haze-fog days in January showed that the number of haze-fog days increased (decreased) in the negative EU phase (positive EU phase). There may be a certain relationship between the number of haze-fog days and the EU. However, the mechanism of the EU’s influence on haze is not clear. To study the mechanism, a composite method is used.
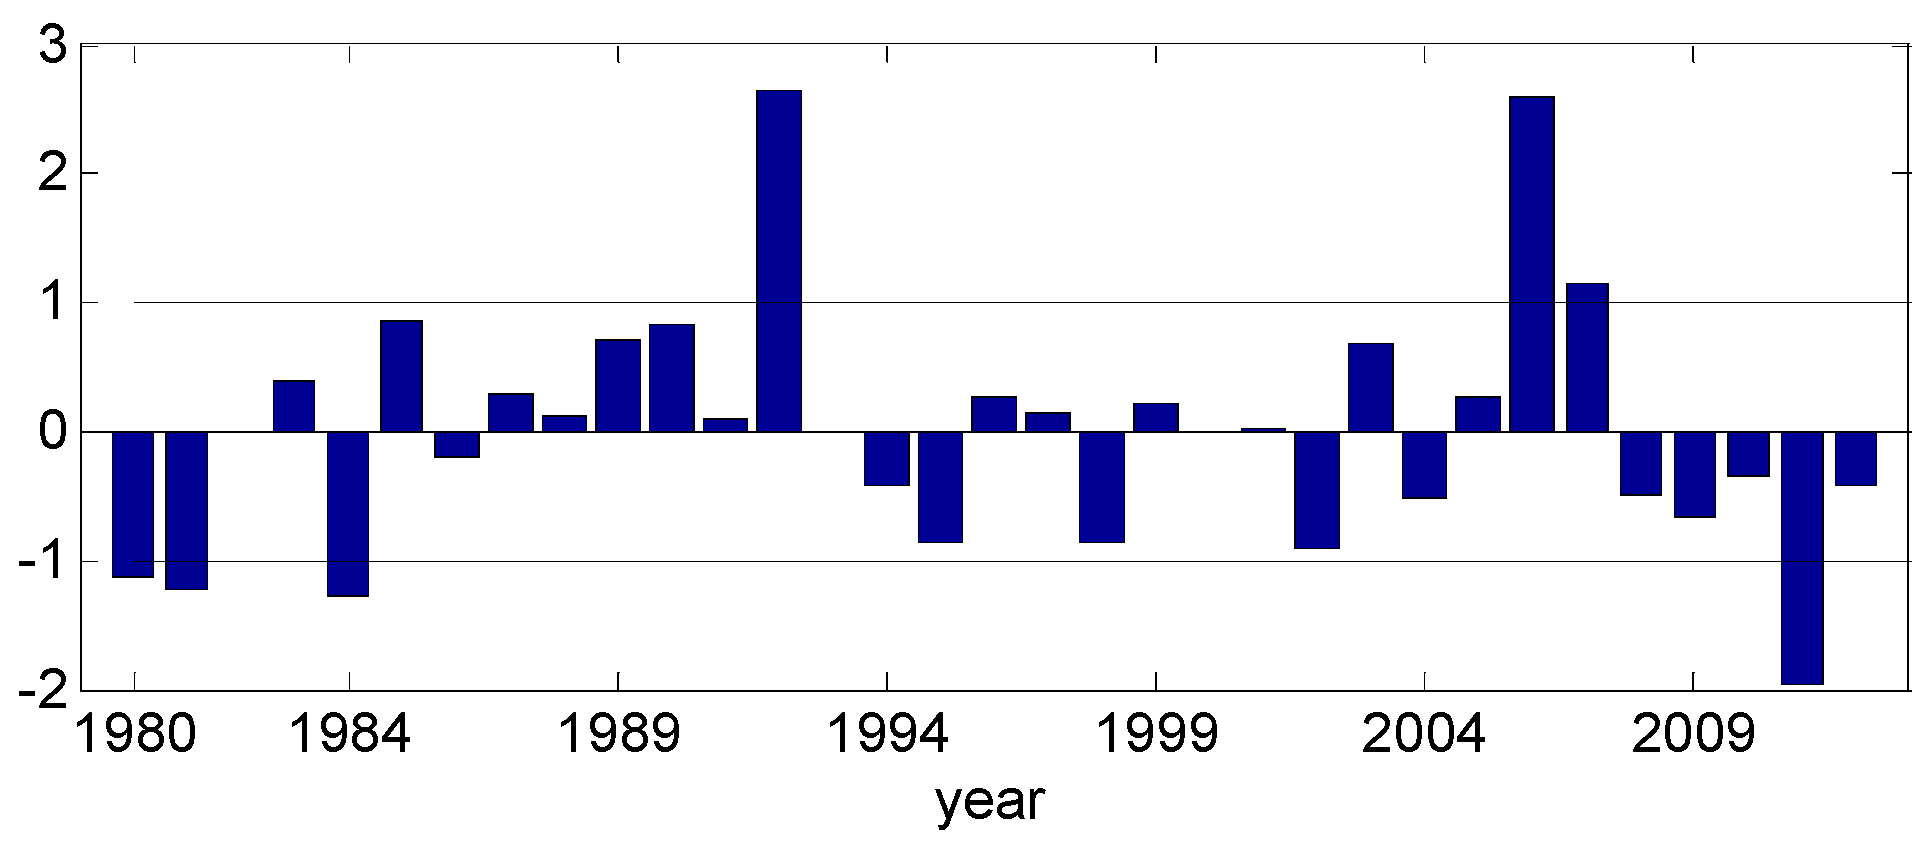
First, the years with fewer haze-fog days and more haze-fog days are selected. The number of haze-fog days from 2013 to 2015 is abnormally high, which will have a greater impact on the standardized analysis. The years from 2013 to 2015 are designated as the years with more haze-fog days. The number of haze-fog days from 1980 to 2012 is standardized (Figure 6). Years with greater than one standard deviation are defined as years with more haze-fog days, which are 2007, 2006, and 1992. Years with less than one standard deviation are defined as years with fewer haze-fog days, which are 2011, 1984, 1981, and 1980. The average EU index for more haze-fog years is −0.8, and the average EU index for less haze-fog years is 1.
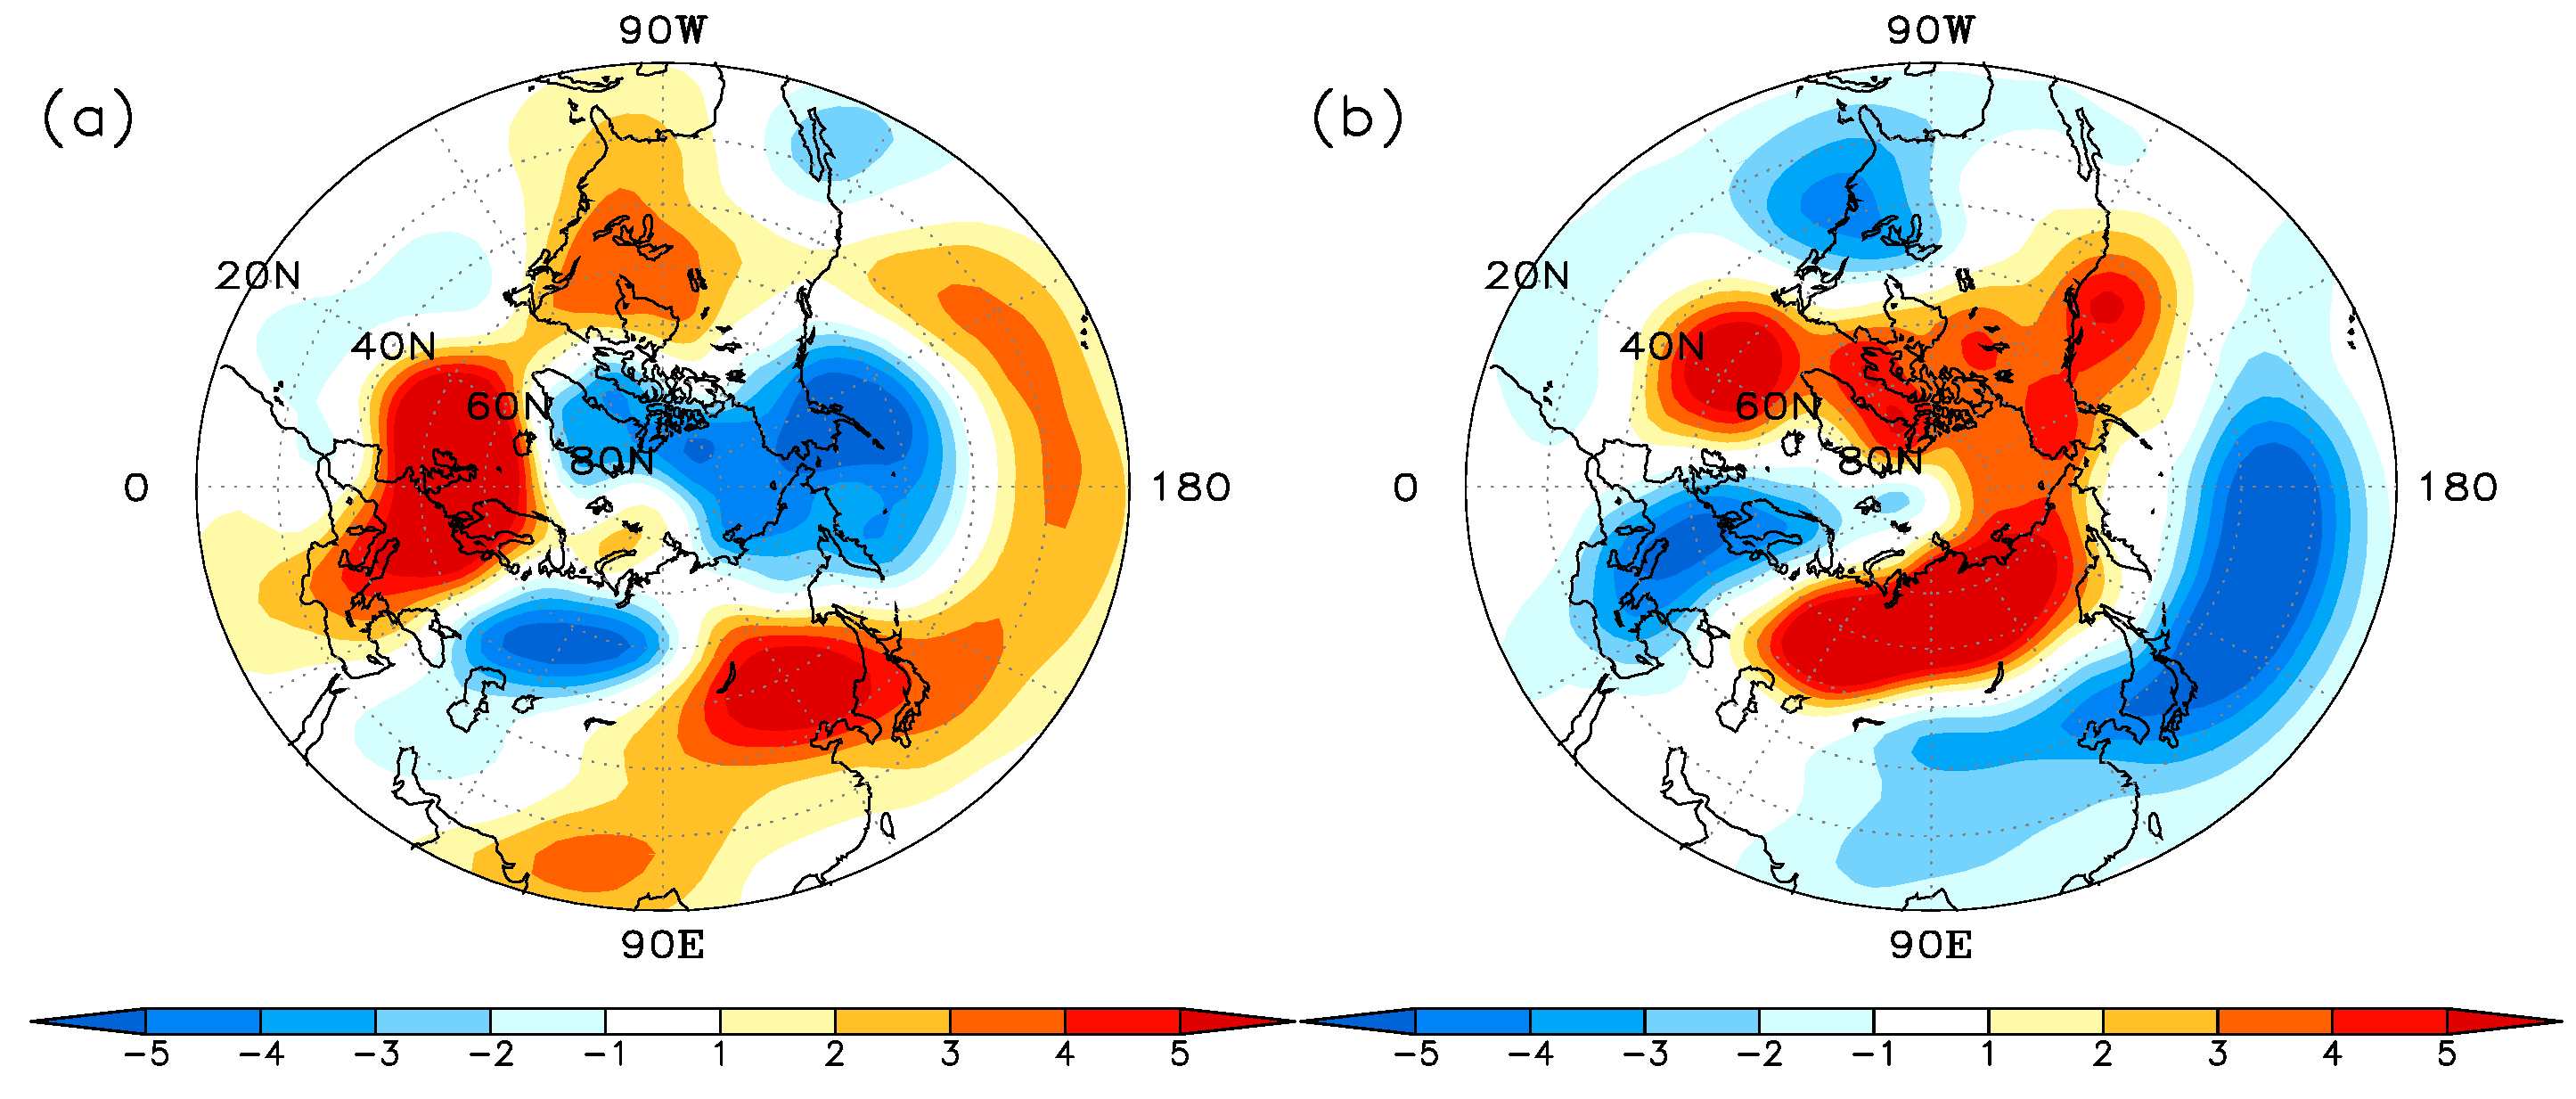
Figure 7 is the composite of the 500 hPa potential height in higher haze-fog years and lower haze-fog years. In those years with frequent haze-fog days, the intensity of the polar vortex was significantly enhanced and extended to the Western Siberian region, the trough in Europe and East Asia, and the ridge in Siberia at 500 hPa decreased. Furthermore, the EU was in the negative phase. Under this EU pattern, the meridional component of the westerly circulation weakened. In the years with fewer haze-fog days, the intensity of the polar vortex was weakened and the trough in Europe and East Asia was deepened. It behaves similarly to the abnormity of stationary waves [36].
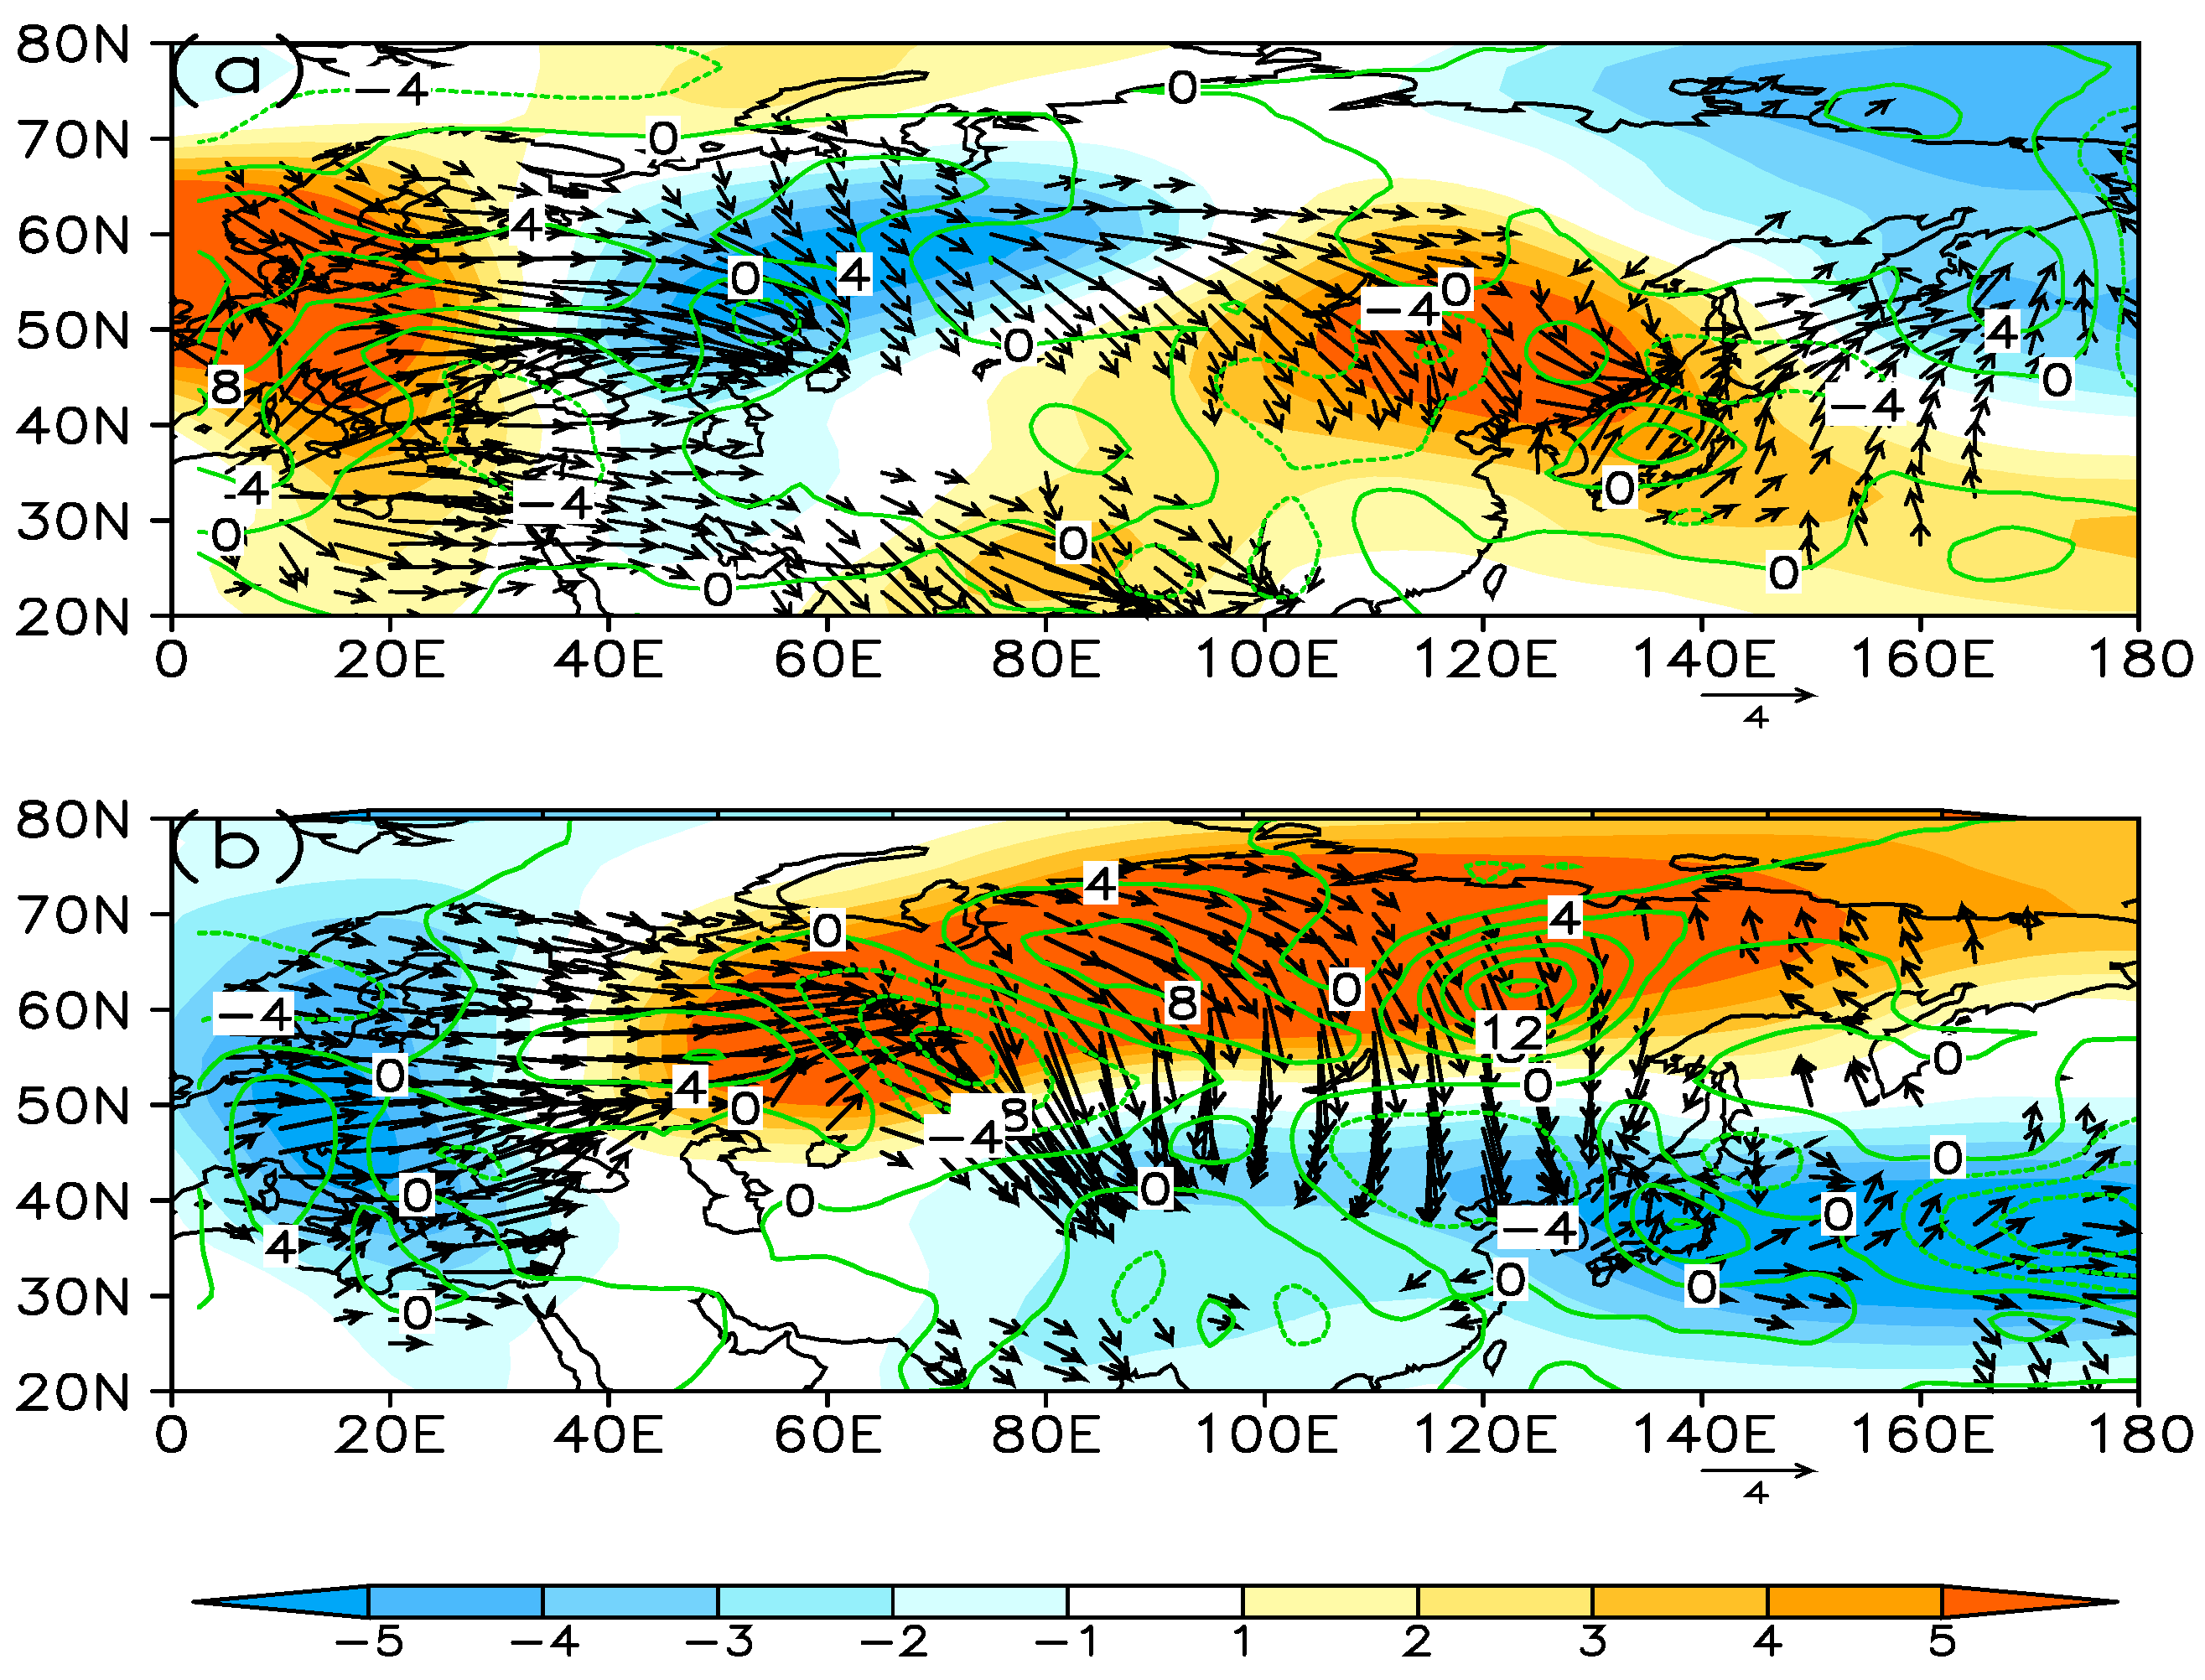
The wave activity fluxes in the higher haze-fog years and lower haze-fog years are calculated based on the 500 hPa geopotential height and the wind field data. The contour in Figure 8 represents the vertical wave activity flux, and its marked value is multiplied by 103. The positive value indicates that the wave activity flux propagates upward. The arrow indicates the horizontal wave activity flux. It shows that there is essential significant quasi-stationary planetary wave activity associated with the anomalous geopotential height (Eurasian teleconnection) over the Eurasian continent. The wave activity flux propagates from northwestern Europe to northern China. There is also wave activity flux propagation in the vertical direction.
The results show that stronger wave trains are connected with the geopotential height anomalies at the 500 hPa isobaric surface and the meridional circulation in East Asia in lower haze-fog years. It appears as a propagation from the high latitudes to mid-low latitudes, thereby resulting in strong convergence anomalies of the wave activity flux in the mid-latitudes of East Asia. Furthermore, the wave activity flux propagates vertically upwards in the high latitudes of East Asia, while it propagates vertically downwards in the mid-latitudes of East Asia. This indicates that the polar wave activity flux affects the lower troposphere in the mid-latitudes of East Asia from top to bottom and from north to south. Therefore, the Siberian High in the lower troposphere is enhanced [37,38], which induced the enhancement of the meridional circulation in the mid troposphere (Figure 9). There is a sinking motion in the mid-latitudes (not shown), which leads to the downward propagation of momentum. Moreover, there is abundant cold air to be transported from high latitudes. All of this results in a strong cold advection in northern China, which is conducive to the spread of pollutants. However, the westerlies appear as a zonal circulation in higher haze-fog years and the wave activity flux propagates from west to the east along the latitude line and is less affected by the high latitude regions. Furthermore, the wave activity flux propagates vertically downwards in the East Asian region and weakens the Siberian High in the lower troposphere (Figure 9) bringing about weak cold air, which can affect northern China. The ascending motion in the mid-latitudes (not shown), the weaker cold air and the weakened Siberian High resulted in the south wind anomalies in northern China and lower wind speeds, which are not conducive to the spread of pollutants.
The haze-fog dissipation in the winter is mainly affected by the stronger north wind. When the EU is in the positive phase, the westerlies are a meridional circulation in East Asia, and the wave activity flux propagates southward and downward from the high latitudes. The sinking motion, abundant cold air from the high latitude, and the enhanced Siberian High are beneficial to the transport of strong cold advection, which is conducive to the weakening of haze-fog. When the Eurasian teleconnection is in the negative phase, the opposite is true.

4.2. Life Cycle of the EU and Its Impact Mechanism on Visibility

In order to better understand the effects of the EU on haze-fog and examine the short-term evolution of the Eurasian teleconnection, the daily EU index of January from 1980 to 2015 was calculated using the daily average geopotential height data.
First, the life cycle and structure of the EU index are analyzed. The positive phase of the EU pattern appears when the EU index is greater than zero while the negative phase appears when the EU index is less than zero. The peak phase of the EU pattern is defined when the daily EU index is at a local maximum and exceeds one standard deviation [20], and the day of the peak phase is marked as ‘lag 0’. The day before ‘lag 0’ is marked as ‘lag −1’, the day after ‘lag 0’ is marked as ‘lag +1’, and so on. If two or more peak phases occur in less than 13 days, only the first peak is counted in order to ensure the independence of each peak phase. There are 23 total positive phases and 23 negative phases in the 34 years.
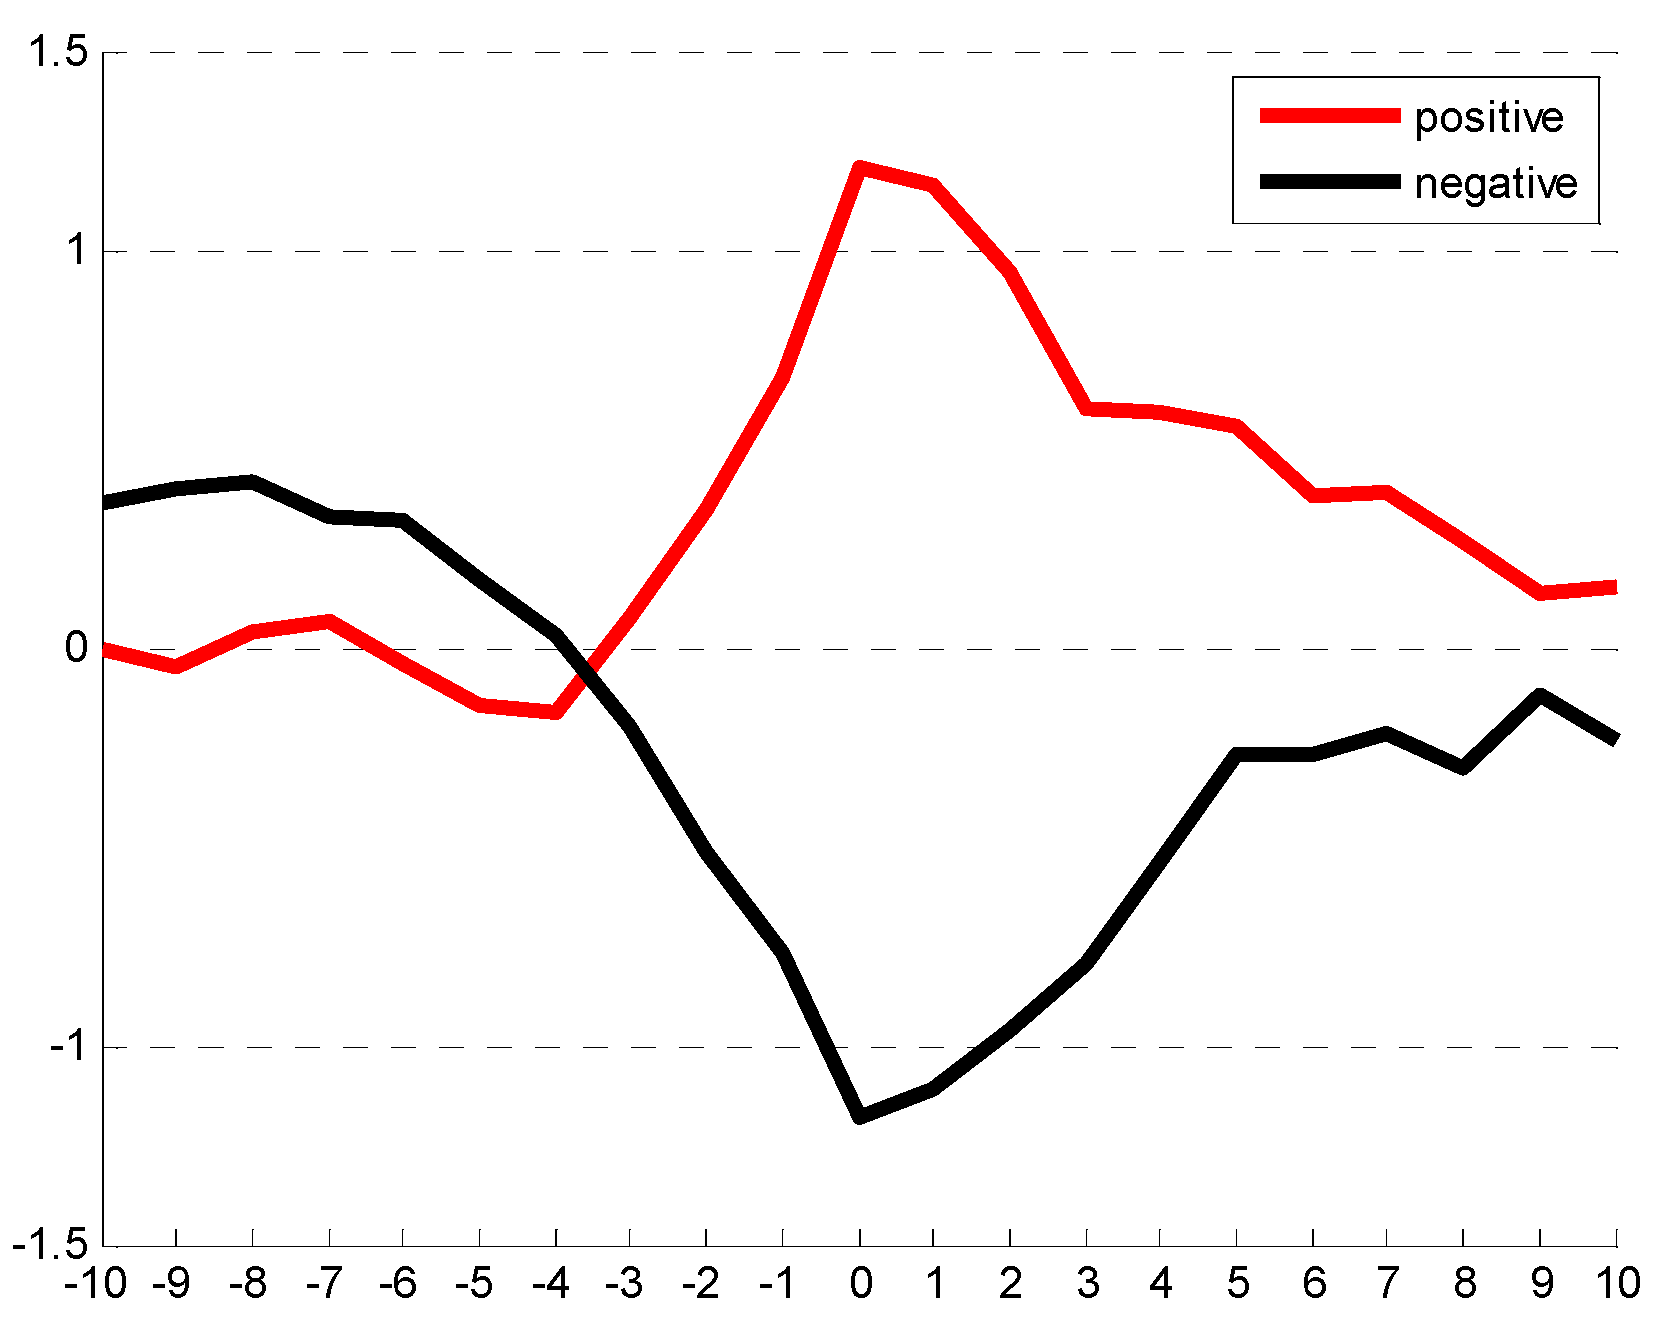
As shown in Figure 10, the EU index decreases rapidly from a lag of −6 days in the composites of the negative peaks, reaches a minimum at a lag of 0 days, and then decays. The number of days of the life cycle is approximately 13. The positive EU index shows the opposite trend. In order to assess the impact of the development and decay of the positive and negative EU phases on haze, the visibility of the two phases were composited using the average visibility data of 80 stations in northern China (Figure 11). In the case of the negative EU phase, the visibility starts to decrease around a lag of −1 day and increase after a lag of 2 days. In the case of the negative phase, the visibility starts to increase near a lag of −2 days and decrease after a lag of 1 day. In a statistical sense, a haze process lasts for 4–5 days.
The 500 hPa geopotential height anomaly fields that are illustrated in Figure 12 show the growth and decay of the EU pattern in the negative phases. The centers of the positive anomalies appeared in the Northwestern European region at a lag of −6 days. A negative anomaly emerges over the Ural Mountains and a positive anomaly emerges over Western Siberia at a lag of −3 days. With the development of the negative EU phase, the geopotential height anomaly of these three anomalous centers is increasing and becomes the strongest at about a lag of 0 to 1 day, and then it gradually becomes weak. After a lag of −4 days, the positive anomaly on the east side continues to propagate eastward until it reaches northeastern China at a lag of 0 days and stays there for many days. When affected by the high pressure, the north wind in Eastern China began to decay from a lag of −1 day (not shown).
Figure 13 shows the vertical distribution of the geopotential height anomaly in the negative EU phase (Figure 13). At a lag of −4 days, a positive anomaly and a weak negative anomaly emerge over Europe. A positive anomaly emerges over Siberia. Then, these anomalies strengthen. These geopotential height anomalies tilt a little eastward, which demonstrates a small baroclinic structure. At a lag of −2 days, a three-center structure of the EU pattern is formed, and the geopotential height anomalies become barotropic. The geopotential height anomalies over Eurasia exhibit the maximal value at a lag of 0 days. After that, an obvious decay of the EU pattern commences. The negative phase is the opposite of the positive phase (not shown). The analyses indicate that the baroclinicity may play a role in the beginning of the geopotential height anomaly, but the maintenance and development of the anomalies are mainly ascribed to barotropic instability [39].

5. Conclusions

There is significant interannual variability in the number of haze days in northern China in January. By using data from the ground sites and the atmospheric reanalysis data, the relationship between the mid-high latitude circulation in the Northern Hemisphere and the number of haze-fog days in northern China is studied, and the influencing mechanism of the EU on haze-fog frequency is explored at the interannual scale and the daily time scale.
The EU at the 500 hPa isostatic surface is the most important pattern affecting haze-fog in northern China, and its contribution rate is 45%. This study selected three main activity centers, which are located in the Europe (10 °E, 55 °N), Siberia (80 °E, 60 °N), and Shandong, China (120 °E, 40 °N), and redefined an EU index, which is similar to but not completely coincident with the index that was defined by Wallace and Gutzler [17].
When the EU is in the negative phase, the 500 hPa geopotential height is increased in West Siberia and decreased in Western Europe and the East Asian coastal regions. In addition, the polar wave activity flux propagates from the west to the east along the latitude and is less affected by the high latitude regions. Less cold air and a weaker sinking motion from the high latitudes weakened the Siberian High. As a result, the occurrence of haze-fog is increased.
The EU pattern activity period is approximately two weeks, which starts to cause a vital decrease in visibility over northern China at about a lag of −2 days of the EU index’s negative peak. The positive geopotential height anomaly moved eastward to the northeast China areas at a lag of −2 days, which caused a weak northerly wind and decreased visibility. The vertical distribution of the geopotential height anomaly also shows that the positive barotropic instability plays an important role in the development and maintenance of the EU mode anomaly after a lag of −2 days.

Author Contributions

Methodology, Y.L. and C.L.; Software, Y.L.; Data Curation, Y.L.; Formal Analysis, Y.L.; Project Administration, L.S.; Supervision, L.S.; Writing—Original Draft, Y.L.; Writing—Review & Editing, C.L., Y.W., and L.S.

Funding

This work was supported by the National Natural Science Foundation of China under grant number 41675146.

Acknowledgments

This work was supported by the National Natural Science Foundation of China under Grant 41675146. The authors are thankful to the China Meteorological Administration and NCEP/NCAR for providing the observational data and reanalysis data. We also appreciate the anonymous reviewers for their constructive comments that have helped to improve this paper.

Conflicts of Interest

The authors declare no conflicts of interest. The founding sponsors had no role in the design of the study; in the collection, analyses, or interpretation of data; in the writing of the manuscript; or in the decision to publish the results.

References

  1. World Meteorology Organization. Aerodrome Reports and Forecasts; World Meteorology Organization: Geneva, Switzerland, 2014; pp. 71–72. [Google Scholar]
  2. Ding, Y.H.; Liu, Y.J. Analysis of long-term variations of fog and haze in China in recent 50 years and their relations with atmospheric humidity. Sci. China-Earth Sci. 2014, 57, 36–46. [Google Scholar] [CrossRef]
  3. Mu, M.; Zhang, R.H. Addressing the issue of fog and haze: A promising perspective from meteorological science and technology. Sci. China 2014, 57, 1–2. [Google Scholar] [CrossRef] [Green Version]
  4. Gao, G. The Climatic Characteristics and Change of Haze Days over China during 1961–2005. Acta Geogr. Sin. 2008, 63, 761–768. [Google Scholar]
  5. Fu, C.B.; Dan, L. Spatiotemporal characteristics of haze days under heavy pollution over central and eastern China during 1960–2010. Clim. Environ. Res. 2014, 19, 219–226, (In Chinese with English Abstract). [Google Scholar]
  6. Song, L.C.; Gao, R.; Li, Y.; Wang, G.-F. Analysis of China’s Haze Days in the Winter Half-Year and the Climatic Background during 1961–2012. Adv. Clim. Chang. Res. 2014, 5, 1–6. [Google Scholar] [CrossRef]
  7. Wu, D. Temporal and spatial variation of haze during 1951-2005 in Chinese mainland. Acta Meteorol. Sin. 2010, 68, 680–688. (In Chinese) [Google Scholar]
  8. Zhang, R.H.; Qiang, L.; Zhang, R.N. Meteorological conditions for the persistent severe fog and haze event over eastern China in January 2013. Sci. China D Earth Sci. 2014, 57, 26–35. [Google Scholar]
  9. Cao, Z.; Sheng, L.; Liu, Q.; Yao, X.; Wang, W. Interannual increase of regional haze-fog in North China Plain in summer by intensified easterly winds and orographic forcing. Atmos. Environ. 2015, 122, 154–162. [Google Scholar] [CrossRef]
  10. Liu, Q.; Sheng, L.; Cao, Z.; Diao, Y.; Wang, W.; Zhou, Y. Dual Effects of the Winter Monsoon on Haze-Fog Variations in Eastern China. J. Geophys. Res.-Atmos. 2017, 122, 5857–5869. [Google Scholar] [CrossRef]
  11. Yang, Y.; Liao, H.; Lou, S. Increase in winter haze over eastern China in recent decades: Roles of variations in meteorological parameters and anthropogenic emissions. J. Geophys. Res.-Atmos. 2016, 121, 13050–13065. [Google Scholar] [CrossRef]
  12. Lou, S.; Liao, H.; Yang, Y.; Mu, Q. Simulation of the interannual variations of tropospheric ozone over China: Roles of variations in meteorological parameters and anthropogenic emissions. Atmos. Environ. 2015, 122, 839–851. [Google Scholar] [CrossRef]
  13. Lai, F.F.; Ma, X.K. Analysis of the January 2014 Atmospheric Circulation and Weather. Meteorol. Mon. 2014, 40, 515–520, (In Chinese with English Abstract). [Google Scholar]
  14. Zhao, G.X.; Li, D.U.; Wei, L.P. Comprehensive Analysis on a Durative Regional Haze and Fog. Arid Zone Res. 2011, 28, 871–878. (In Chinese) [Google Scholar]
  15. Wang, L.; Chen, W.; Zhou, W.; Chan, J.C.; Barriopedro, D.; Huang, R. Effect of the climate shift around mid 1970s on the relationship between wintertime Ural blocking circulation and East Asian climate. Int. J. Climatol. 2010, 30, 153–158. [Google Scholar] [CrossRef]
  16. Yang, S.Y.; Wu, B.Y.; Zhang, R.H.; Zhou, S.W. Propagation of Low-Frequency Oscillation over Eurasian Mid–High Latitude in Winter and Its Association with the Eurasian Teleconnection Pattern. Chin. J. Atmos. Sci. 2014, 38, 121–132, (In Chinese with English Abstract). [Google Scholar]
  17. Wallace, J.M.; Gutzler, D.S. Teleconnections in the Geopotential Height Field during the Northern Hemisphere Winter. Mon. Weather Rev. 1981, 109, 784–812. [Google Scholar] [CrossRef] [Green Version]
  18. Watanabe, M.; Nitta, T. Decadal Changes in the Atmospheric Circulation and Associated Surface Climate Variations in the Northern Hemisphere Winter. J. Clim. 1999, 12, 494–510. [Google Scholar] [CrossRef]
  19. Ohhashi, Y.; Yamazaki, K. Variability of the Eurasian Pattern and Its Interpretation by Wave Activity Flux. J. Meteorol. Soc. Jpn. Ser. II 1999, 77, 495–511. [Google Scholar] [CrossRef] [Green Version]
  20. Sung, M.; Lim, G.; Kwon, W.T.; Boo, K.O.; Kug, J.S. Short-term variation of Eurasian pattern and its relation to winter weather over East Asia. Int. J. Climatol. 2009, 29, 771–775. [Google Scholar] [CrossRef] [Green Version]
  21. Liu, Y.; Chen, W. Variability of the Eurasian Teleconnection Pattern in the Northern Hemisphere Winter and Its influences on the Climate in China. Chin. J. Atmos. Sci. 2012, 36, 423–432, (In Chinese with English Abstract). [Google Scholar]
  22. Zhai, P.; Yu, R.; Guo, Y.; Li, Q.; Ren, X.; Wang, Y.; Xu, W.; Liu, Y.; Ding, Y. The Strong El Ni(n)o of 2015/16 and Its Dominant Impacts on Global and China’s Climate. Acta Meteorol. Sin. 2016, 74, 309–321. [Google Scholar]
  23. Li, Q.; Zhang, R.; Wang, Y. Interannual variation of the wintertime fog–haze days across central and eastern China and its relation with East Asian winter monsoon. Int. J. Climatol. 2016, 36, 346–354. [Google Scholar] [CrossRef]
  24. Cheng, X.; Zhao, T.; Gong, S.; Xu, X.; Han, Y.; Yin, Y.; Tang, L.; He, H.; He, J. Implications of East Asian summer and winter monsoons for interannual aerosol variations over central-eastern China. Atmos. Environ. 2016, 129, 218–228. [Google Scholar] [CrossRef]
  25. Wu, G.; Li, Z.; Fu, C.; Zhang, X.; Zhang, R.; Zhang, R.; Zhou, T.; Li, J.; Li, J.; Zhou, D.; et al. Advances in studying interactions between aerosols and monsoon in China. Sci. China-Earth Sci. 2016, 59, 1–16. [Google Scholar] [CrossRef]
  26. Liu, Q. The Climatological Intraseasonal Variation of Haze-Fog in Eastern China during Summer and Winter Monsoon Periods. Ph.D. Thesis, Ocean University of China, Qingdao, China, 2017. (In Chinese with English Abstract). [Google Scholar]
  27. Lim, Y.K.; Kim, H.D. Comparison of the impact of the Arctic Oscillation and Eurasian teleconnection on interannual variation in East Asian winter temperatures and monsoon. Theor. Appl. Climatol. 2016, 124, 267–279. [Google Scholar] [CrossRef]
  28. Han, S.Q.; Hao, T.Y.; Zhang, Y.F.; Li, P.Y.; Cai, Z.Y.; Zhang, M.; Wang, Q.L.; Zhang, H. Vertical observation and analysis on rapid formation and evolutionary mechanisms of a prolonged haze episode over central-eastern China. Sci. Total Environ. 2017, 616–617, 135–146. [Google Scholar] [CrossRef] [PubMed]
  29. Zhao, N.; Liu, X.; Guo, R.; Guo, W.; Li, E.; Li, Y. Comparative Analysis of Air Pollution between January in 2013 and 2014 of Hebei Province. J. Green Sci. Technol. 2016, 10, 1–7, (In Chinese with English Abstract). [Google Scholar]
  30. Ma, X.H.; Gan, L.; Zhang, A.Y.; Li, N.J.; Zhang, M.Y. Cause Analysis on Durative Fog and Haze in January 2013 over Beijing Area. Adv. Environ. Prot. 2013, 3, 29–33, (In Chinese with English Abstract). [Google Scholar] [CrossRef]
  31. Bjornsson, H.; Venega, S.A. A Manual for EOF and SVD Analysis of Climatic Data; McGill University: Montreal, QC, Canada, 1997; CCGCR No. 97-1. [Google Scholar]
  32. Shi, C.; Cai, W.; Jin, X. Modulation by transient waves of atmospheric longwave anomalies: Dynamic mechanism of the super cold wave in South China in the extremely strong El Niño of 2015/2016. Trans. Sci. 2016, 39, 827–834, (In Chinese with English Abstract). [Google Scholar]
  33. Plumb, R.A. On the three-dimensional propagation of stationary waves. J. Atmos. Sci. 1985, 42, 217–229. [Google Scholar] [CrossRef]
  34. Liao, H.; Chang, W.; Yang, Y. Climatic effects of air pollutants over china: A review. Adv. Atmos. Sci. 2015, 32, 115–139. [Google Scholar] [CrossRef]
  35. Xie, Z.X.; Han, Z.W. Investigation of interannual variations in anthropogenic emission in China based on several emission inventories. J. Univ. Chin. Acad. Sci. 2014, 31, 289–296, (In Chinese with English Abstract). [Google Scholar]
  36. Guohua, Z.H.; Panxing, W.A.; Ning, S.H.; Qiaoping, L.I.; Gaojie, S.H. Analysis of Stationary-Wave Nonstationarity in the Northern Hemisphere 500-hPa Height Field. Acta Meteor. Sin. 2010, 24, 287–296. [Google Scholar]
  37. Ding, Y.; Krishnamurti, T.N. Heat Budget of the Siberian High and the Winter Monsoon. Mon. Weather Rev. 1987, 115, 2428. [Google Scholar] [CrossRef]
  38. Zhang, Y.; Sperber, K.R.; Boyle, J.S. Climatology and Interannual Variation of the East Asian Winter Monsoon: Results from the 1979 95 NCEP/NCAR Reanalysis. Mon. Weather Rev. 1997, 125, 2605–2619. [Google Scholar] [CrossRef]
  39. Wang, N.; Zhang, Y. Evolution of Eurasian teleconnection pattern and its relationship to climate anomalies in China. Clin. Linguist. Phon. 2014, 44, 1017–1028. [Google Scholar] [CrossRef] [Green Version]
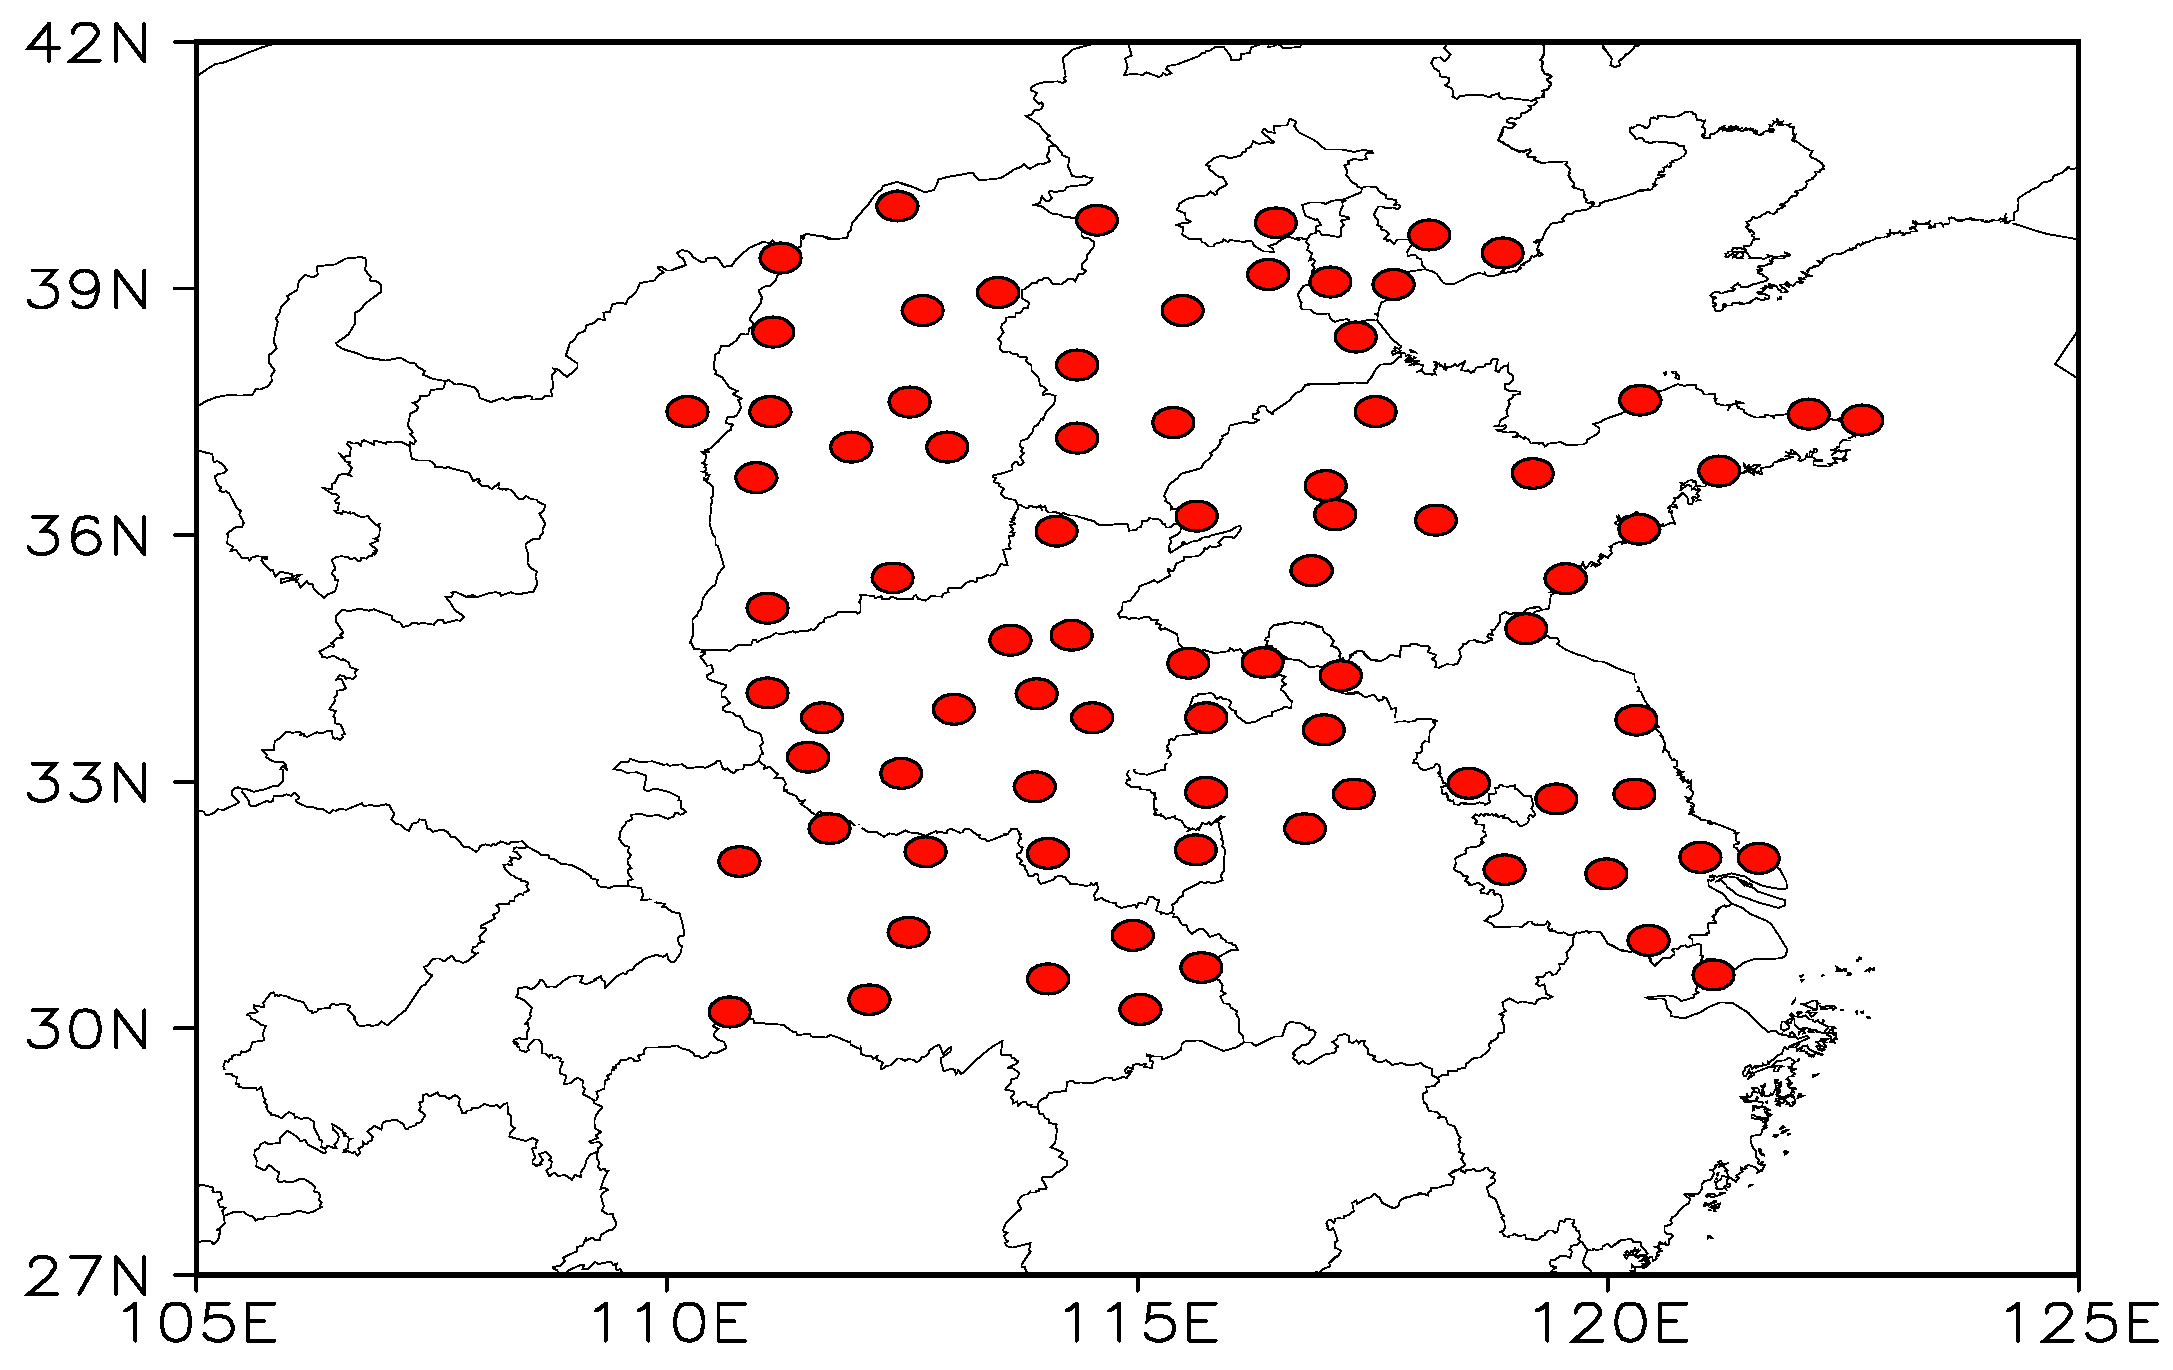
Figure 1. Locations of the selected stations.
Atmosphere 10 00113 g001
Figure 2. The number of haze-fog days in January from 1980 to 2015 (blue bar) and its trend (red line).
Atmosphere 10 00113 g002
Figure 3. Correlation coefficient between the 500 hPa geopotential height and the number of haze-fog days in January from 1980 to 2015. The heavy shaded area denotes that the 99% confidence level is exceeded, and the light area indicates that it exceeds the 95% confidence level.
Atmosphere 10 00113 g003
Figure 4. The heterocorrelation of the first mode of the SVD between the number of haze-fog days (a) and the 500 hPa geopotential height (b) in January from 1980 to 2015 (the shaded area denotes that the 99% confidence level is exceeded).
Atmosphere 10 00113 g004
Figure 5. The detrended number of haze-fog days (red, units: days) and the EU index (blue) in January from 1980 to 2012.
Atmosphere 10 00113 g005
Figure 6. Standardized number of haze-fog days from 1980 to 2012.
Atmosphere 10 00113 g006
Figure 7. Composite field of the geopotential height anomaly at 500 hPa (shading, units: dgpm) in January of the higher haze-fog years (a) and lower haze-fog years (b).
Atmosphere 10 00113 g007
Figure 8. The 500 hPa horizontal wave activity flux (vectors), vertical wave activity flux (contour, 103), and geopotential height anomaly (shading, units: dgpm) in January in higher haze-fog years (a) and lower haze-fog years (b).
Atmosphere 10 00113 g008
Figure 9. Compound field of the January geopotential height anomaly (shading, units: gpm) and wind (vector, units:m/s) of 850 hPa in January of the higher haze-fog years (a) and lower haze-fog years (b).
Atmosphere 10 00113 g009
Figure 10. Composite of the EU index from a lag of −10 to 10 days. A lag of 0 day denotes the peak phase. The red line denotes the positive phase and the black line is the negative phase.
Atmosphere 10 00113 g010
Figure 11. Average standardized visibility anomalies in Northern China around the peak phase of the EU pattern from a lag of −6 days to a lag of 6 days. The red line is the positive phase and the black line is the negative phase.
Atmosphere 10 00113 g011
Figure 12. The 500 hPa geopotential height anomaly field in the negative EU phase at a lag of −6 days, 4 days, −3 days, −1 day, 0 days, 1 day, 3 days, 4 days, and 6 days, respectively.
Atmosphere 10 00113 g012
Figure 13. Vertical cross sections of the geopotential height anomaly along the center of each anomaly for the negative EU phase at a lag of −6 days, −4 days, −3 days, −2 days, 0 days, 2 days, 4 days, and 6 days, respectively.
Atmosphere 10 00113 g013