1. Introduction
Across the planet, both natural and modified ecosystems are in the grip of climate change, subject to dramatic shifts in weather patterns, resource availability, and global temperature. Among the many pressing concerns related to climate change is a surge in powerful, long-lasting heat waves, a phenomenon that is projected to intensify in the future [
1,
2]. While some areas experience more intense heat than others, this is a widespread issue; for example, cities all across the United States are projected to see an increase in the number of extremely hot days over this century [
3]. Extreme heat events of the past few decades have created major disturbances including infrastructure damage, economic loss, and human illness and death [
4,
5,
6,
7,
8], the latter two of which have been shown to disproportionately impact vulnerable populations, such as the elderly, low-income, and those with pre-existing health conditions [
9,
10,
11,
12]. Considering the current and expected future influence of extreme heat on public health, social welfare and urban resilience, local decision makers have a duty to identify and mitigate sources of excess heat within their cities.
Urban areas are uniquely susceptible to extreme heat events, owing to a phenomenon known as the urban heat island effect (UHI) [
13]. Emerging studies in the physical sciences help to explain the relationship between UHI and urban thermodynamics [
14,
15,
16,
17], and these provide a foundation for understanding how changes in the physical environment affect microclimates. Cityscapes are dominated by grey infrastructure: hard, impervious surfaces such as roads and buildings which trap heat; many feature relatively little green or blue infrastructure such as waterways, trees and other vegetation, which offer cooling via shade or evapotranspiration [
18,
19,
20]. Occasionally, tall buildings can be protective, for example, by shading streets in the central business district during the afternoon [
21]. However, grey elements of the built environment trap heat and contribute considerably to rising temperatures in the city. The UHI phenomenon and its relationship with rising temperatures is increasingly relevant across the planet, as 54% of the global population currently lives in urban areas [
22].
A growing body of literature emphasizes the role of built environment alteration as a strategy for heat mitigation [
23,
24,
25,
26,
27]. This is based largely upon previous studies which show intra-urban variation in UHI intensity, and indicate that differences in the built environment amount to temperature variation [
21,
28,
29]. Commonly proposed interventions include tree planting, use of green roofs and an overall increase in green spaces [
30,
31,
32], as well as lightening roads, roofs, and buildings to increase albedo [
33,
34], all of which have been shown effective in combating extreme heat. While such studies are helpful in guiding initial heat mitigation efforts, they are quite general and face several challenges which make them not wholly useful in practice. For example, areas vary in the composition and configuration of landscape features, and recommending greening in an industrial area that contains little planting spaces may prove moot. Similarly, effectiveness of a particular cooling strategy is sometimes given as an average value, not specific to a unique city, location, or climate [
26]. Those case studies that do refer to a specific location typically do not offer models that can be simply reproduced in other locations [
24]. Studies of heat mitigation in the built environment often refer to urban areas as homogeneous units, with limited differentiation between intra-urban land cover types [
25], making the application of mitigation techniques difficult or ineffective at best. We attempt to address these shortcomings and to guide effective urban heat mitigation efforts by using a model that (1) is adaptable to distinct cities and land uses, providing thresholds of mitigation potential; and (2) describes various land-cover types within the city and thus indicates a range of best intervention strategies, rather than one generalized approach.
This study aims to provide local governments and planners with accurate, practicable information which may inform best practices for urban heat mitigation and adaptation. Our analysis identifies those land-use and land-cover types that contribute most to the formation of urban heat islands, as well as interventions that can best ameliorate extreme heat stress. We address the following questions: (1) what built environment characteristics are associated with high temperatures at the scale of a city-block? and (2) to what extent are alternative physical designs expected to reduce ambient temperatures in UHI? We address these questions through a thorough assessment of Portland, Oregon using a complex fluid dynamics model called ENVI-met
®; this microclimate modeling system simulates the temperature effects of alternative buildings scenarios. Ali Toudert’s [
35] review of numerical models at the micro-scale with fine temporal resolutions concludes that ENVI-met is currently the only micro-scale computational fluid dynamic model that is capable of analyzing the thermal comfort regime at fine resolutions. Additionally, Skelhorn [
36] reviewed a number of models and selected ENVI-met for its capability for modeling surface-plant-air interactions in the urban environment. Other advantages of applying ENVI-Met are the high level of detail in handling multilayer vegetation, and its inclusion of latent heat and soil moisture.
Our study considers a promising field of research which aims to address urban climate adaptation to extreme heat: nature-based solutions (NBS) [
37,
38,
39]. NBS emphasize human–nature relationships, planning for adaptation, and resilience in a way that benefits humans and enhances biodiversity [
40]. Such solutions cover a wide range of intervention approaches, including strictly green or combined green-grey infrastructure, ecosystem-based adaptation, and ecosystem-based risk management [
39]. The NBS approach is relatively new in practice, and remains largely conceptual, with limited empirical applications or proven effectiveness. Early studies do strongly indicate that NBS approaches successfully mitigate environmental threats, promote resilience, and offer social, economic, and biotic rewards [
37]. In the context of heat mitigation, NBS may be applied in either altering the existing built environment, or planning for future developments, both of which are achieved through the use of green infrastructure. The use of NBS interventions and analysis of the resulting microclimates offers a means for identifying specific applications at city-block scales, which provides evidence about the strengths/weaknesses of alternative development scenarios.
2. Materials and Methods
2.1. Study Area
The city of Portland is located in the Pacific Northwest region of the United States, and features a temperate, Mediterranean climate; summers are warm and dry, winters are mild and wet [
41]. Historically, summer temperatures in Portland have been lower than those of typical Mediterranean climates (causing some to refer to the area as Cool-Mediterranean), although summer highs have been increasing each year since 2010. In 2017, a new record was set for days over 80 degrees Fahrenheit [26.7 °C] in the month of August (27 days), bypassing the previous record set just one year earlier. Also in 2017, the city experienced 24 days at or above 90 degrees Fahrenheit [32.2 °C], twice the normal value of 12 days per year [
42]. Studying and preparing for changes in Portland’s urban microclimate will be essential to maintaining resilience. Although the city has not had to contend much with urban heat in the past, conditions are shifting, and adaptive action will determine how well communities and infrastructure respond. Microclimate scenario modeling is a key first step in informing such action, and we draw on the specific climatic and physical characteristics of Portland, Oregon.
2.2. Cluster Analysis
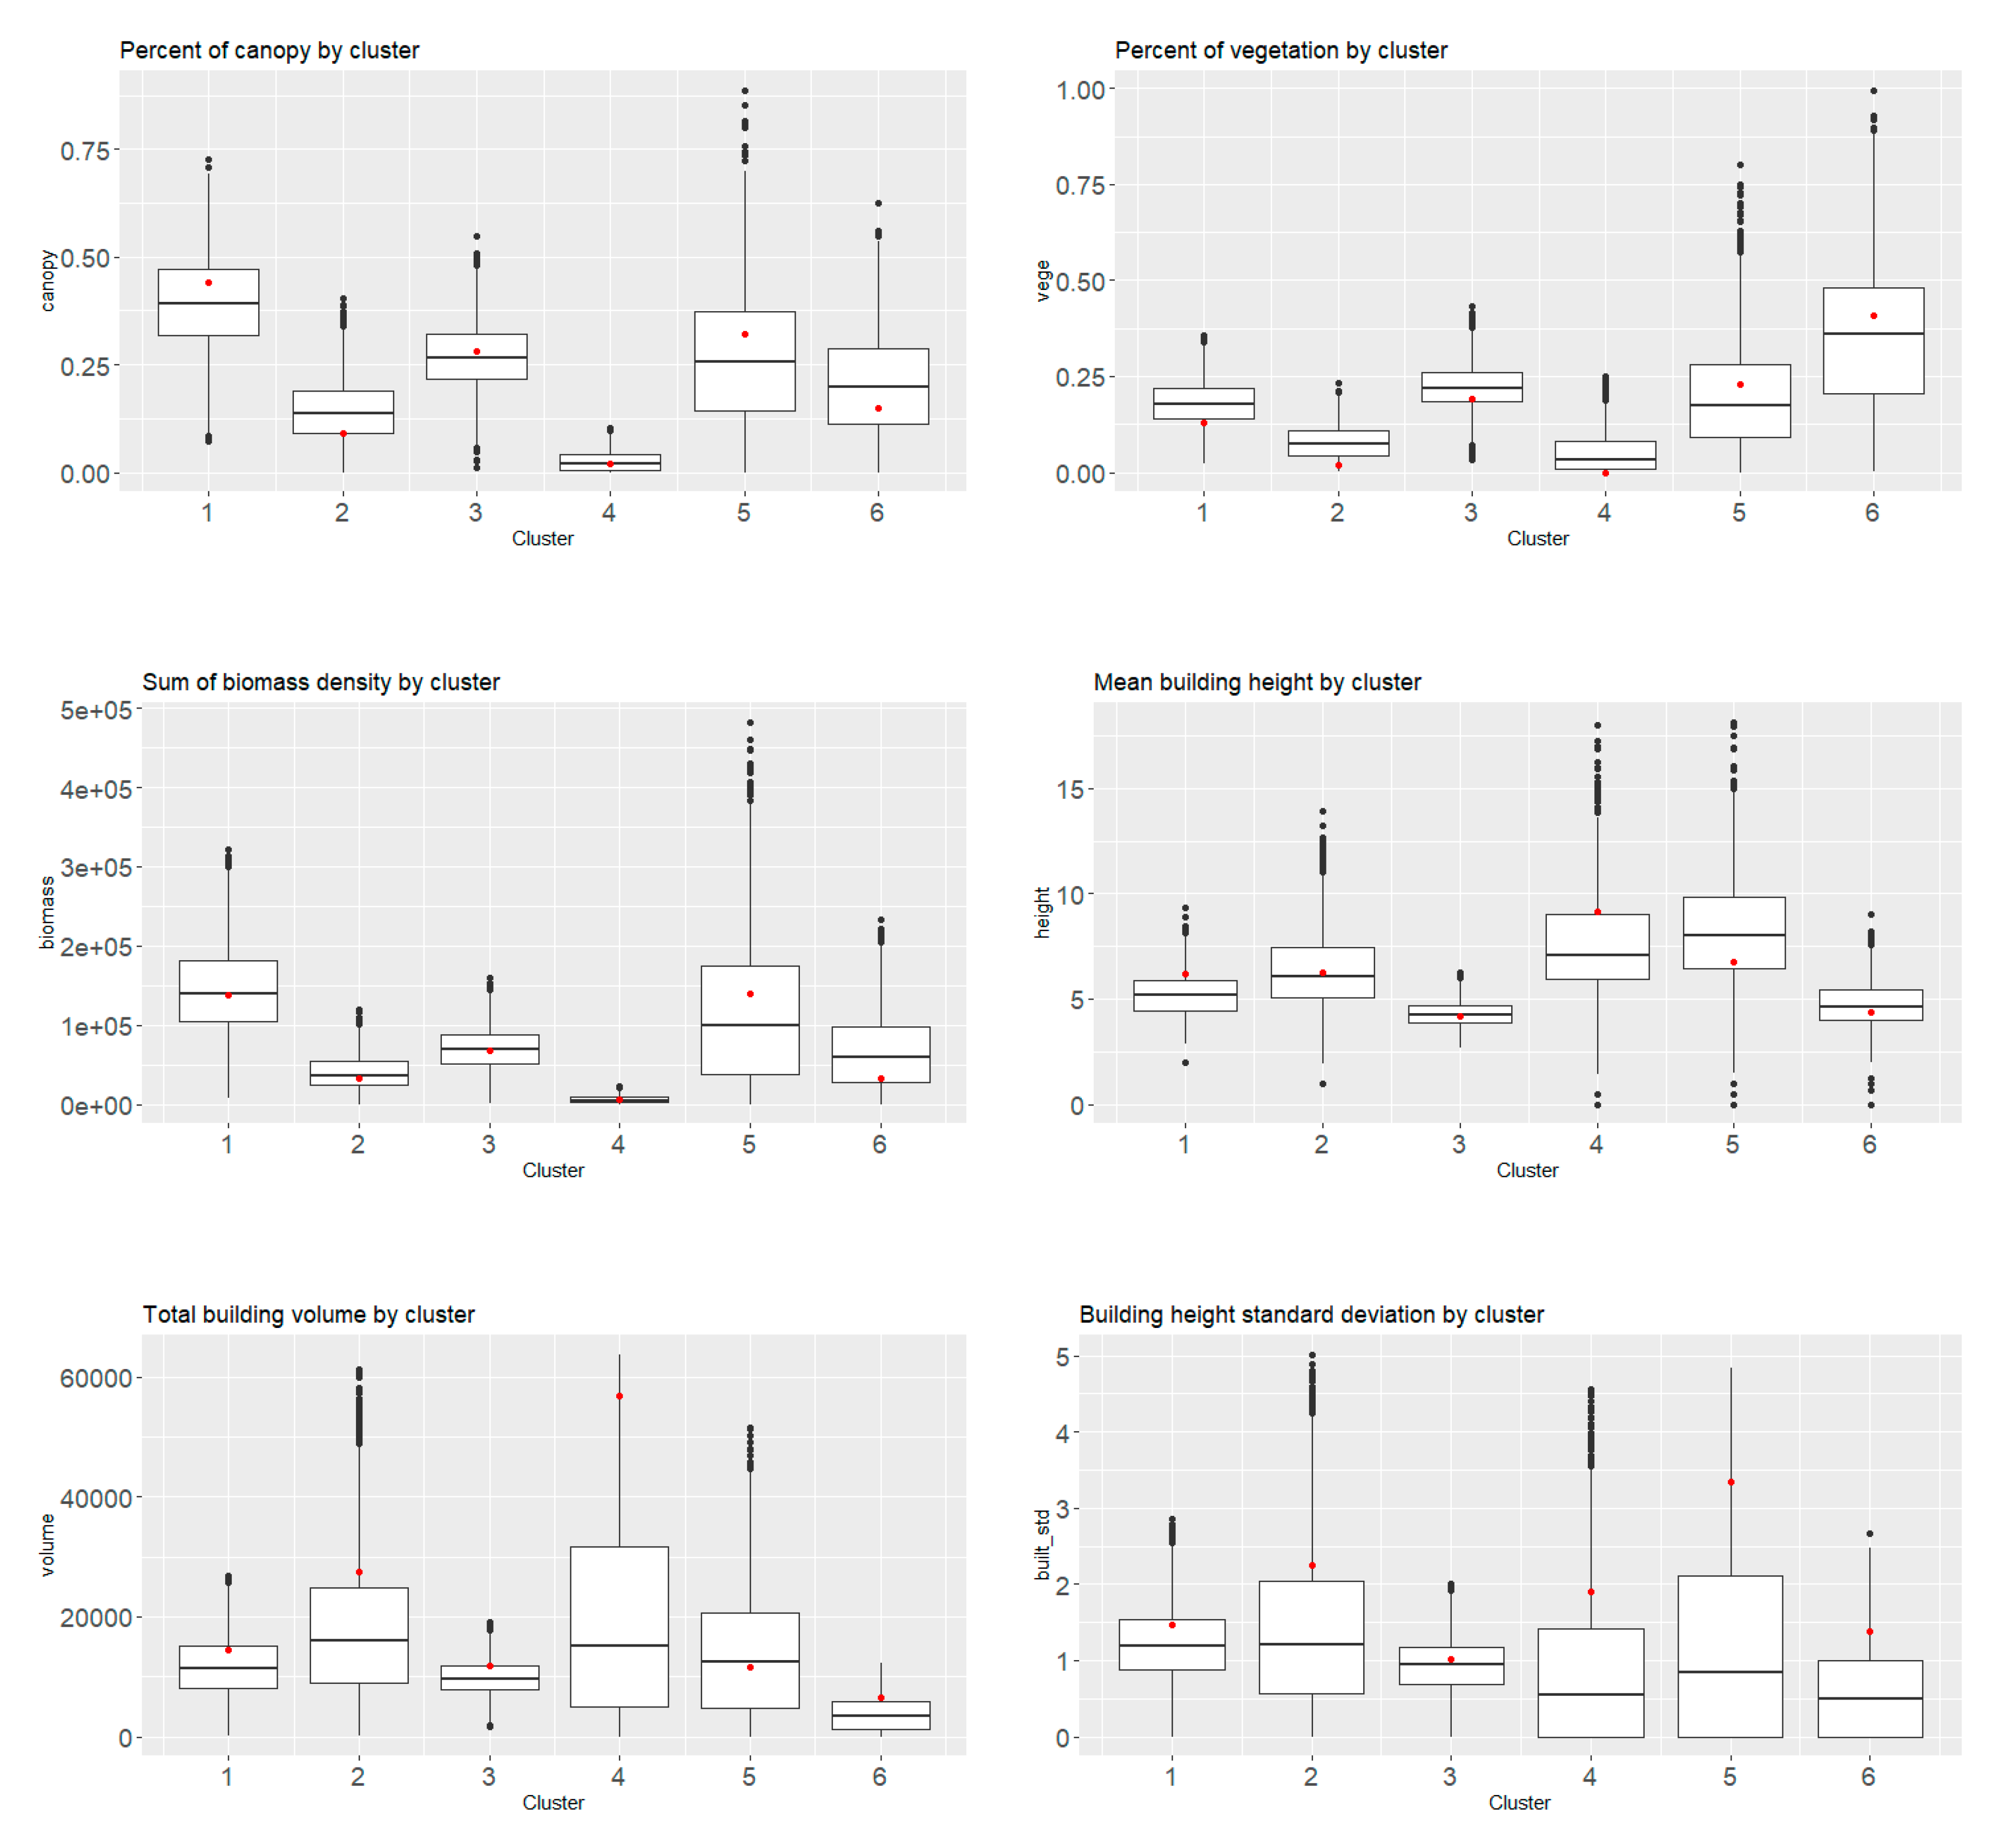
Our initial assumption was that land-cover characteristics impact the success of urban heat mitigation strategies. A previous study of near surface air temperature in Portland, OR, examined various landscape features and their influence on summertime heat distribution [
21]. Results of that study indicated that six variables could predict over 90% of the local variation in urban heat. For this study, the Portland metropolitan area was divided into groups based on those six land-cover variables: (1) percent of canopy, (2) percent of vegetation, (3) sum of biomass density, (4) mean building height, (5) total building volume, and (6) building height standard deviation.
Using these six variables, we divided the study area into grid cells and conducted a cluster analysis to delineate the landscape characteristics which help to explain the presence of UHI. Cluster analysis has been widely used for classification of digital images and allows us to reduce a large number of observations to a small set of similar groups to better understand the nature of landscape characteristics [
43]. The clustering enables us to examine the effectiveness of mitigation strategies at distinct landscape features. Normal (Gaussian) mixture modeling is often used for cluster analysis [
44], and was performed in the statistical programming environment R using customized functions available from the MCLUST package [
44]. MCLUST allows us to specify an integer vector specifying the numbers of mixture components (clusters) for which the Bayesian information criterion (BIC) [
45] is to be calculated. Connors [
46] claims that magnitude and pattern of land uses and covers may significantly influence urban heat, especially at micro(~100 m
2) to macro(~1 km
2) scales. Since our study focuses on neighborhood scale modeling, and average city block size in Portland (OR) ranges from 80–110 m [
47], we selected 100 m grid size for this study. Based on preliminary studies, we selected seven clusters that distinguished residential areas from other landscape features, and eliminated three clusters: protected forest, water, and central business district. The eliminated areas reflect areas that are protected from development changes, and represent anomalies of urban land cover and land use. Non-eliminated portions of the study area were further divided into seven clusters by re-applying mixture modeling (
Table 1).
Based on the seven cluster types, six study sites were ultimately selected for microclimate modeling; no site was selected for cluster 7, hillside forest, since no such area met the selection criteria. Criteria for site selection were as follows: (1) characteristics of the specified cluster type were represented; and (2) the site had been identified as an area of interest by local authorities. The study sites varied by cluster number, and represented a combination of several land-use and land-cover types, specifically those that were described by the city’s Bureau of Planning and Sustainability as likely to undergo significant change in the coming years [
48].
2.3. Description of Simulation Tools
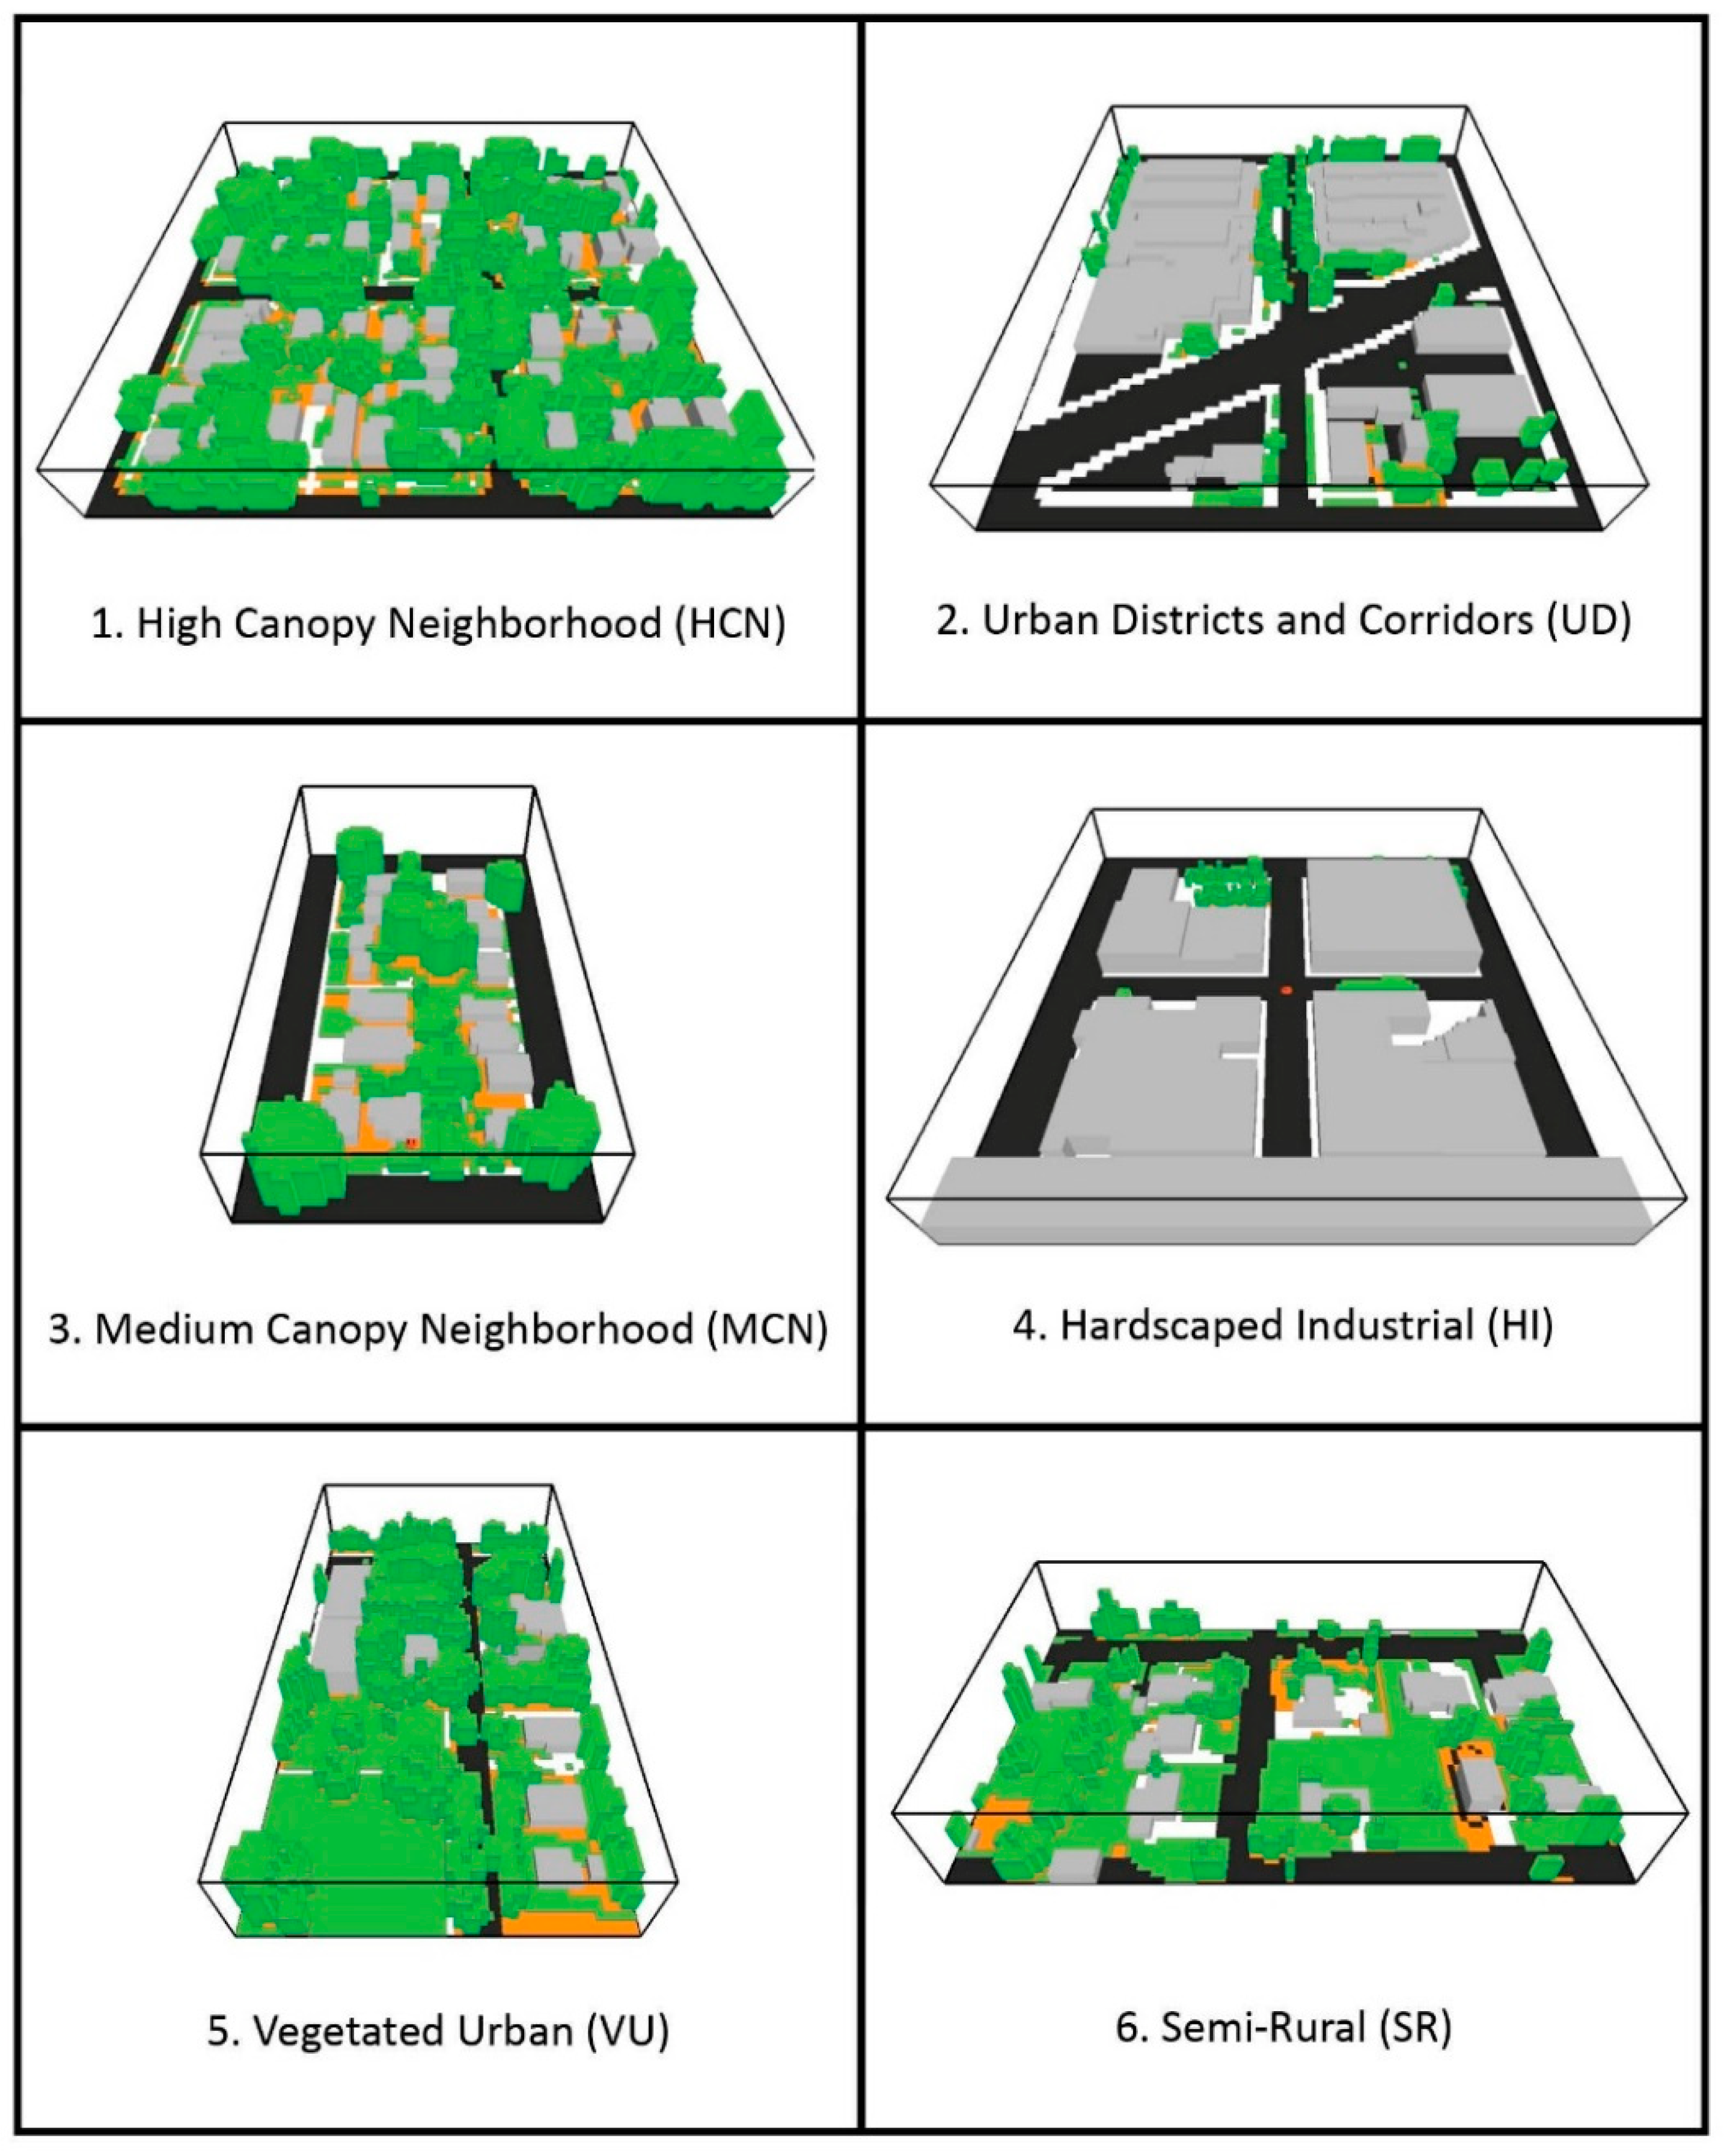
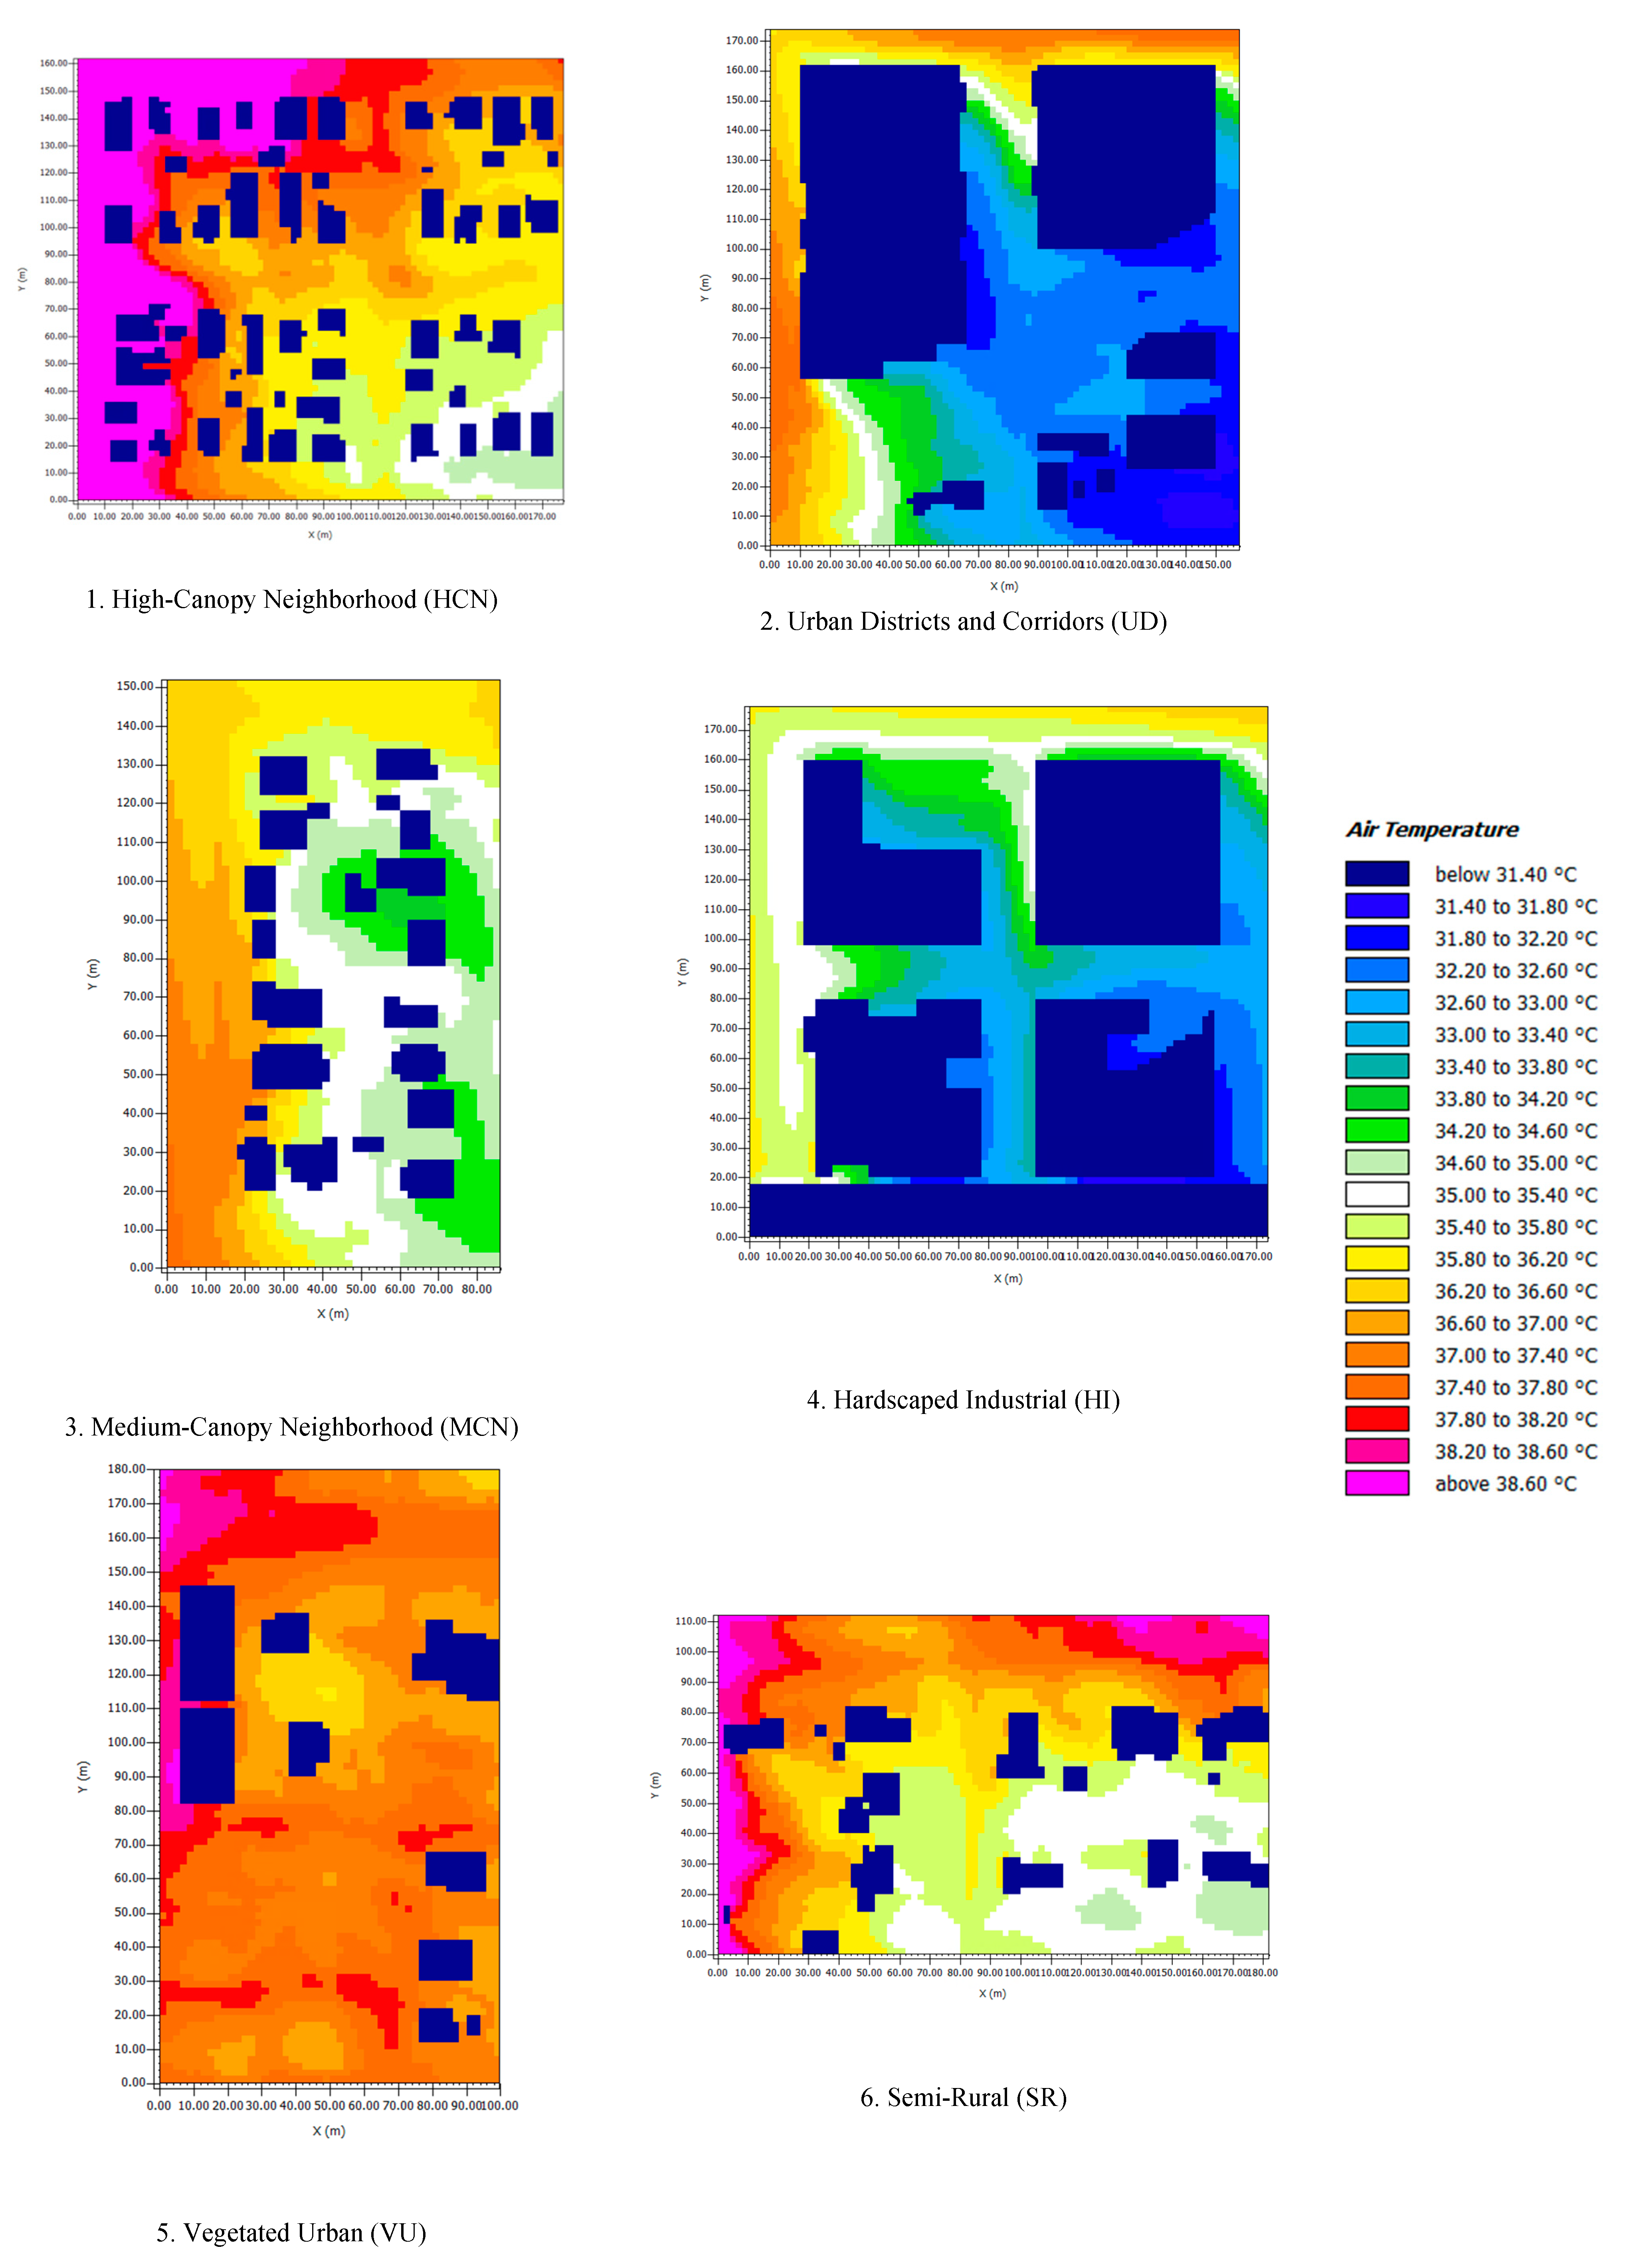
For each of the six study sites, we used ENVI-met microclimate modeling to evaluate how different development patterns, including varying amounts of paving and vegetation, impact localized temperatures. ENVI-met (version 4.2.0), a computational fluid dynamics (CFD) model developed by Bruse [
49], was used to simulate near-surface air temperature for six clusters in the study region. ENVI-met simulates the microclimatic dynamics within a daily cycle in complex urban structures, and its high spatial and temporal resolution enables a fine understanding of the microclimate at street level [
35]. ENVI-met requires two input files: a configuration file, which specifies a setting for initialization values and timings, and an area input file, which specifies geometry of the model environment. Each of the aforementioned clusters was digitized as input for the model (
Figure 1). The digitized imagery is represented by a color key as follows: grey = buildings, green = canopy and grass, black = asphalt pavement, white = concrete pavement, and brown = loamy soils (
Table 2). Within each modeling site, we located five receptor points for close examination: center, east, west, north, and south. The results of these receptor points were used for model calibration, which is described in more detail at the following section. Average air temperature was calculated as the mean of air temperature of the whole domain. For the present study, heights of all buildings and trees were extracted from 2014 LiDAR data, which were available for the study region. The spatial resolution of ENVI-met ranges from 0.5 to 10 m, with a maximum size of 100 × 100 grids for the basic version. We chose to employ 2 m horizontal resolution since the size of our largest study site (Cluster 4: Hardscaped Industrial) is approximately 180 × 180 m (90 × 90 grids), making 2 m the highest possible resolution within software limitations. The vertical resolution was also set to 2 m with higher resolution of lower grids.
While the model has a large number of output parameters (e.g., wind speed, relative humidity, mean radiant temperature, etc.), air temperature is the one parameter that was investigated in this research. ENVI-met professional version offers an add-on post-processing tool, BioMet, to calculate several thermal comfort indices such as physiologically equivalent temperature (PET) and standard effective temperature (SET*). PET is a thermal index derived from the human energy balance and is well suited to the evaluation of the thermal component of different climates [
50]. SET* is a comfort index, developed based on a dynamic two-node model of the human temperature regulation [
51]. Although these indices are valid indicators of thermal comfort, we did not include them in our study and chose instead to examine only air temperature. Our goal was to compare differing greenspace configurations and surface materials for heat reduction potential, and air temperature is an appropriate indicator for that purpose. Furthermore, air temperature can be monitored easily at many locations throughout the year.
The model date was set for 18 August 2016, which was one of the warmest days of summer 2016. The model was digitized in ENVI-met with the current configuration of buildings and vegetation, and the initial climatic parameters were determined based on data from the nearest weather stations [
52]. The 2016 weather data for Portland were obtained from the Weather Underground network. While the National Oceanic and Atmospheric Administration (NOAA) is believed to provide more reliable weather information, available data sets contain information only on daily maximum temperature, minimum temperature, and precipitation. The Weather Underground network, used for this study, provides hourly accounts of temperature, precipitation, humidity and wind speed, and it has been extensively used by researchers for examining the impacts of weather on transit activities [
53,
54,
55,
56].
We calibrated the model using air temperature at the height of 1.4 m as that is the height of the nearest weather station, and approximates potential exposure to people at ground level. The distance between the study sites and the nearest weather stations varied from 35 m to 800 m. Input parameters such as initial temperature, wind speed, and humidity were adjusted for each run until graphs of the modeled temperatures and measured temperatures become comparable (
Table 3). Many parameters were chosen based on ENVI-Met default values and weather station data, though these were subsequently refined to establish the most accurate parameters for the study area. Pearson’s correlation coefficients between measured temperatures and modeled temperatures were calculated, and the results for clusters 1 through 6 were 0.76, 0.66, 0.93, 0.68, 0.81, and 0.75, respectively. For further validation, we extracted 1.4 m air temperature from ENVI-met simulation results at 7:00 and 15:00 PST.
Table 4 shows the difference between simulated and measured mean air temperature for each scenario. Although the model tends to overestimate the air temperature in the morning, the error in the afternoon is between −0.6 and 1.7 degrees Celsius (
Table 4). Since we are more interested in the temperature difference between scenarios, these errors do not affect our calculations of temperature difference.
2.4. Scenario Development
Once the model was calibrated, we simulated diverse scenarios to evaluate how different landscape features affect ambient temperature. The scenarios (also referred to as heat mitigating interventions) used for this research were developed with input from urban planners at the City of Portland, as well as previously published studies [
36,
57,
58,
59,
60,
61,
62]. While the urban planners offered insights about the plausibility of scenarios (what city codes would allow), the published research helped to calibrate specifics of the ENVI-Met model. For example, the City of Portland recently passed a resolution requiring green roofs on all new developments, which helped us identify relevant literature. Taleghani et al. [
60] examined the effect of cool roofs, cool pavement, green roofs and trees on pedestrian thermal comfort using micrometeorological simulations. In addition to “cool” materials, Taleghani et al. simulated an increase in roof and asphalt albedo of 0.3 (Roof: 0.1 → 0.4, Asphalt pavement: 0.2 → 0.5), representing the upper bound values for what is currently technologically feasible. Al-hafiz et al. [
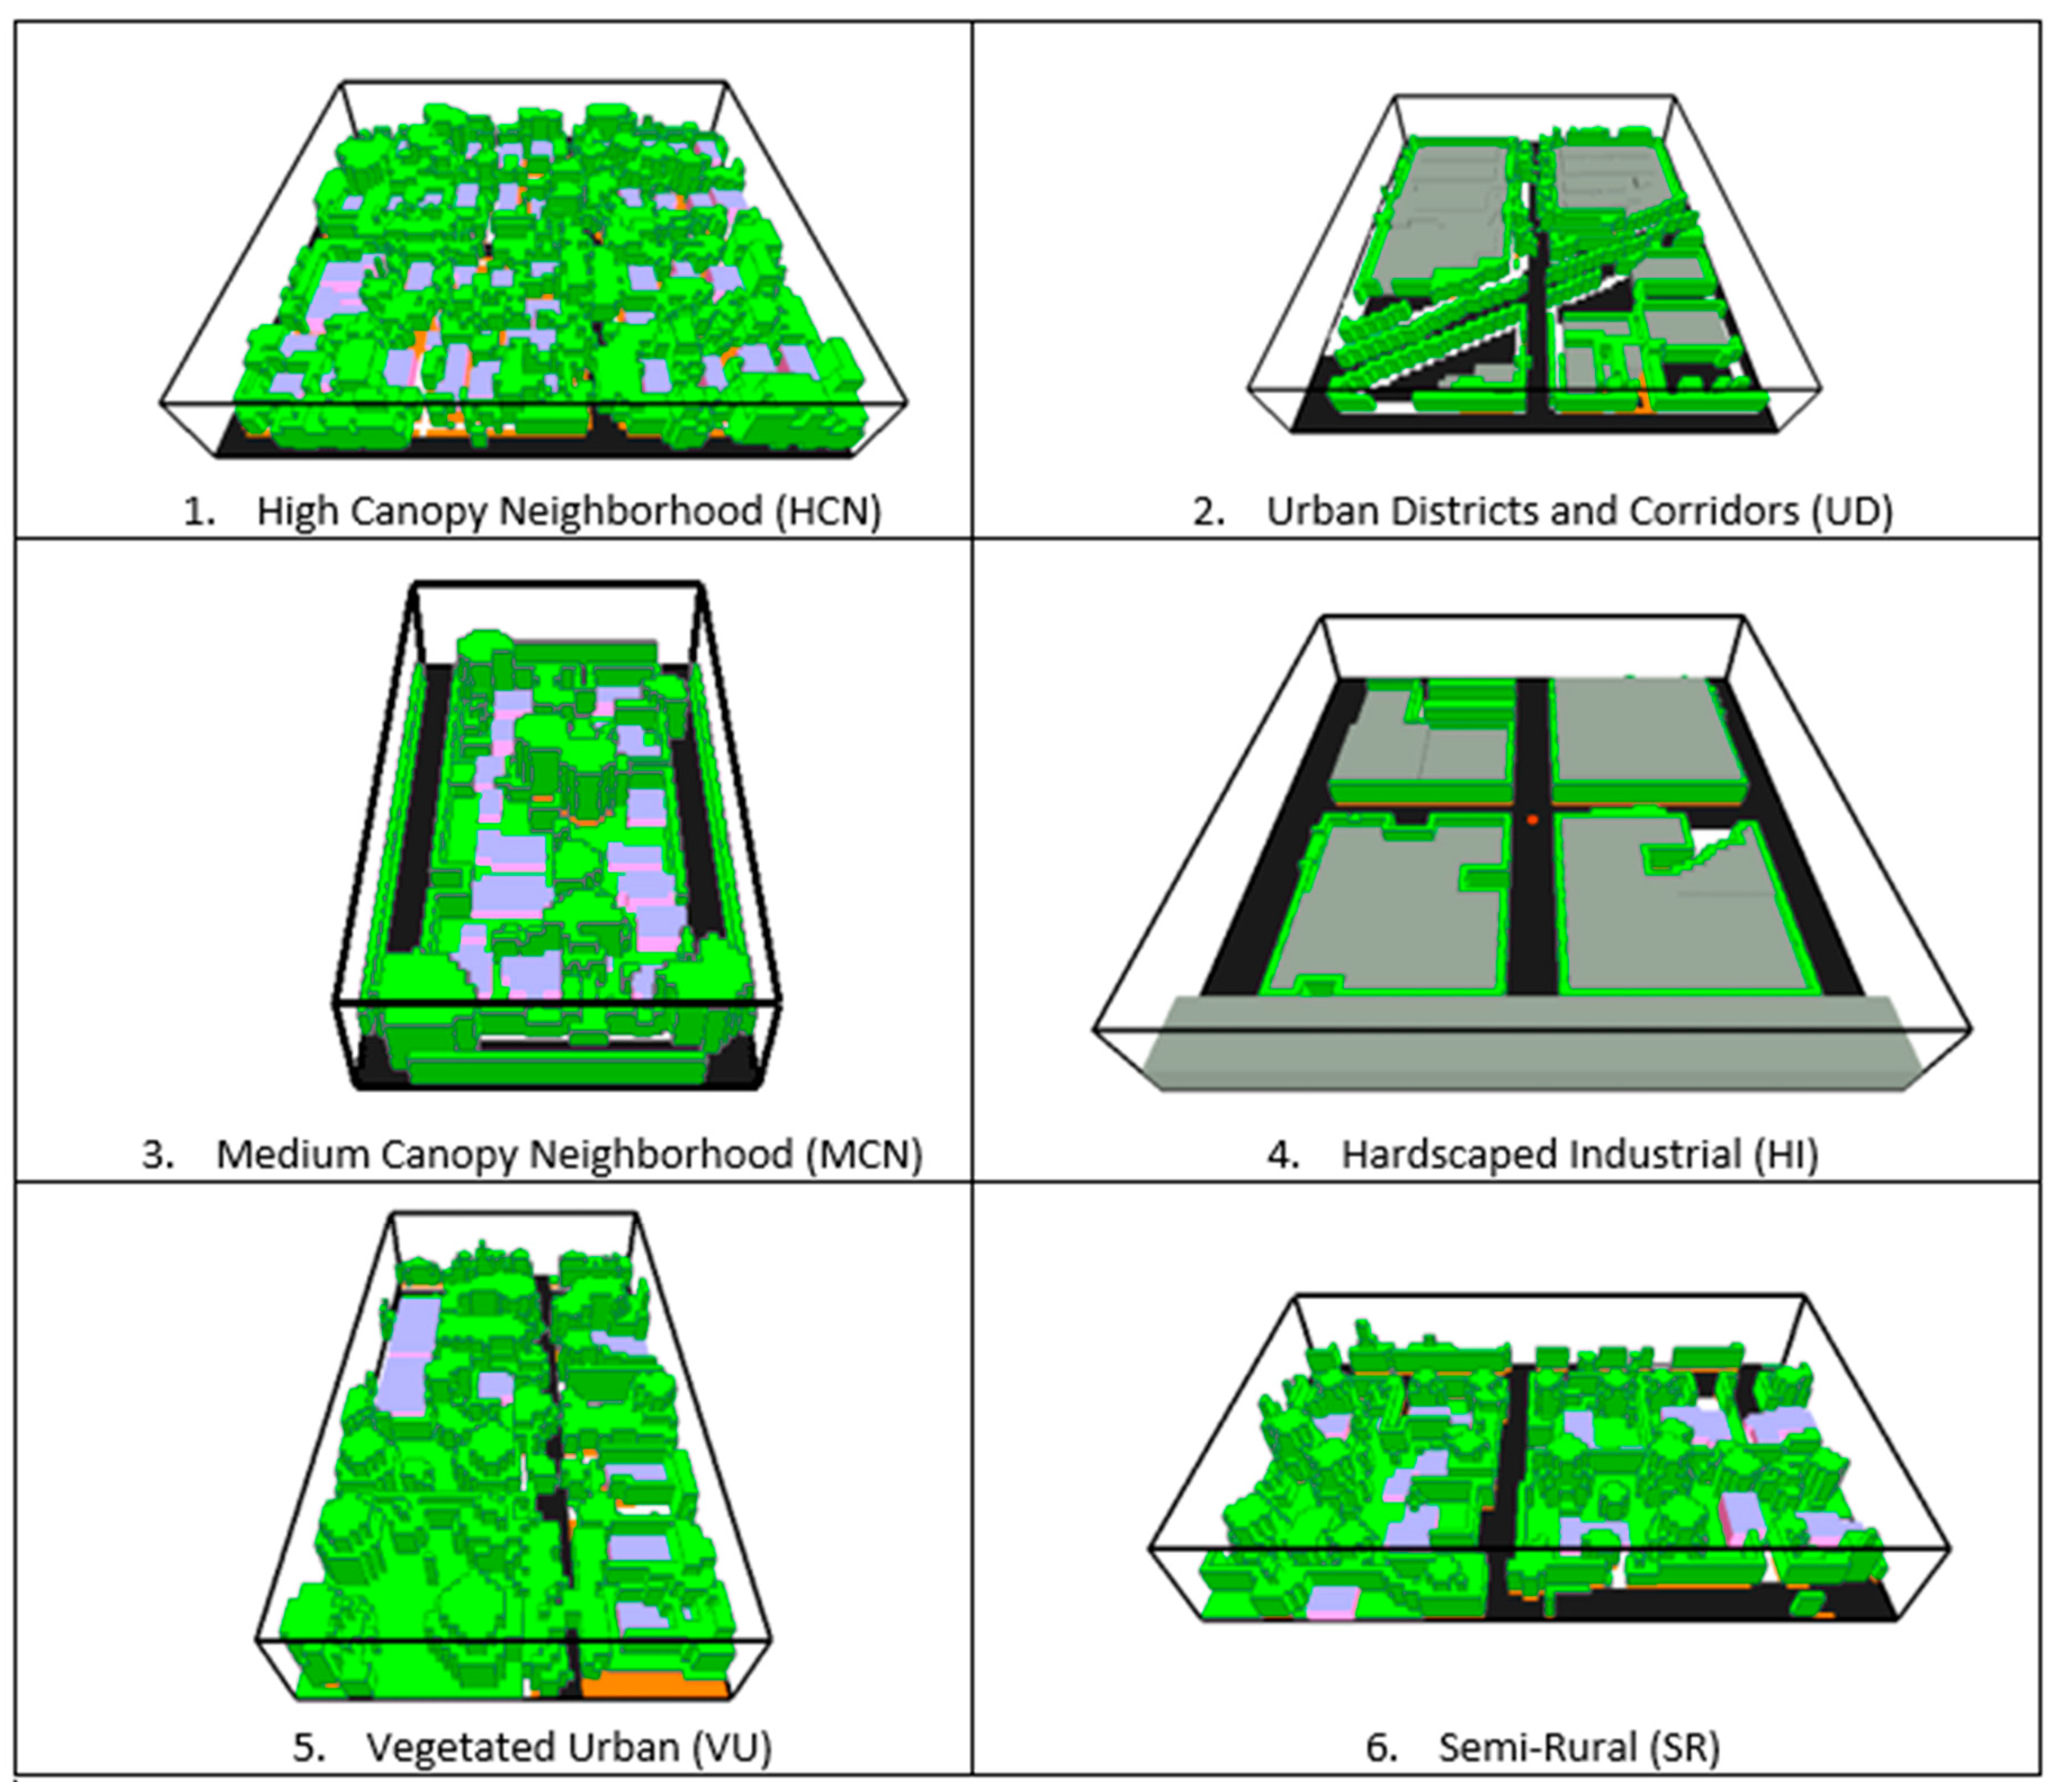
63] examined the impact of changes in albedo on surface and air temperatures, simulating an increase in rooftop albedo from 0.25 to 0.8. Following the model used by Taleghani et al. in this study, we chose to simulate an increase in albedo of 0.3 for both roofs and pavement, resulting in the following values: asphalt shingle (roof) = 0.5, concrete with filled block (roof) = 0.6, and asphalt pavement = 0.5. We simulated the addition of green roofs, modeling 100% coverage with 50 cm grasses. The AddGreen scenario simulated trees in areas where adequate space was available, and grasses in areas where it was not; an example of this modeled scenario is available in
Figure 2. A total of six simulated interventions were developed (
Table 5), and each was applied to the six development type clusters, resulting in a total of 36 possible effects on temperatures.
3. Results
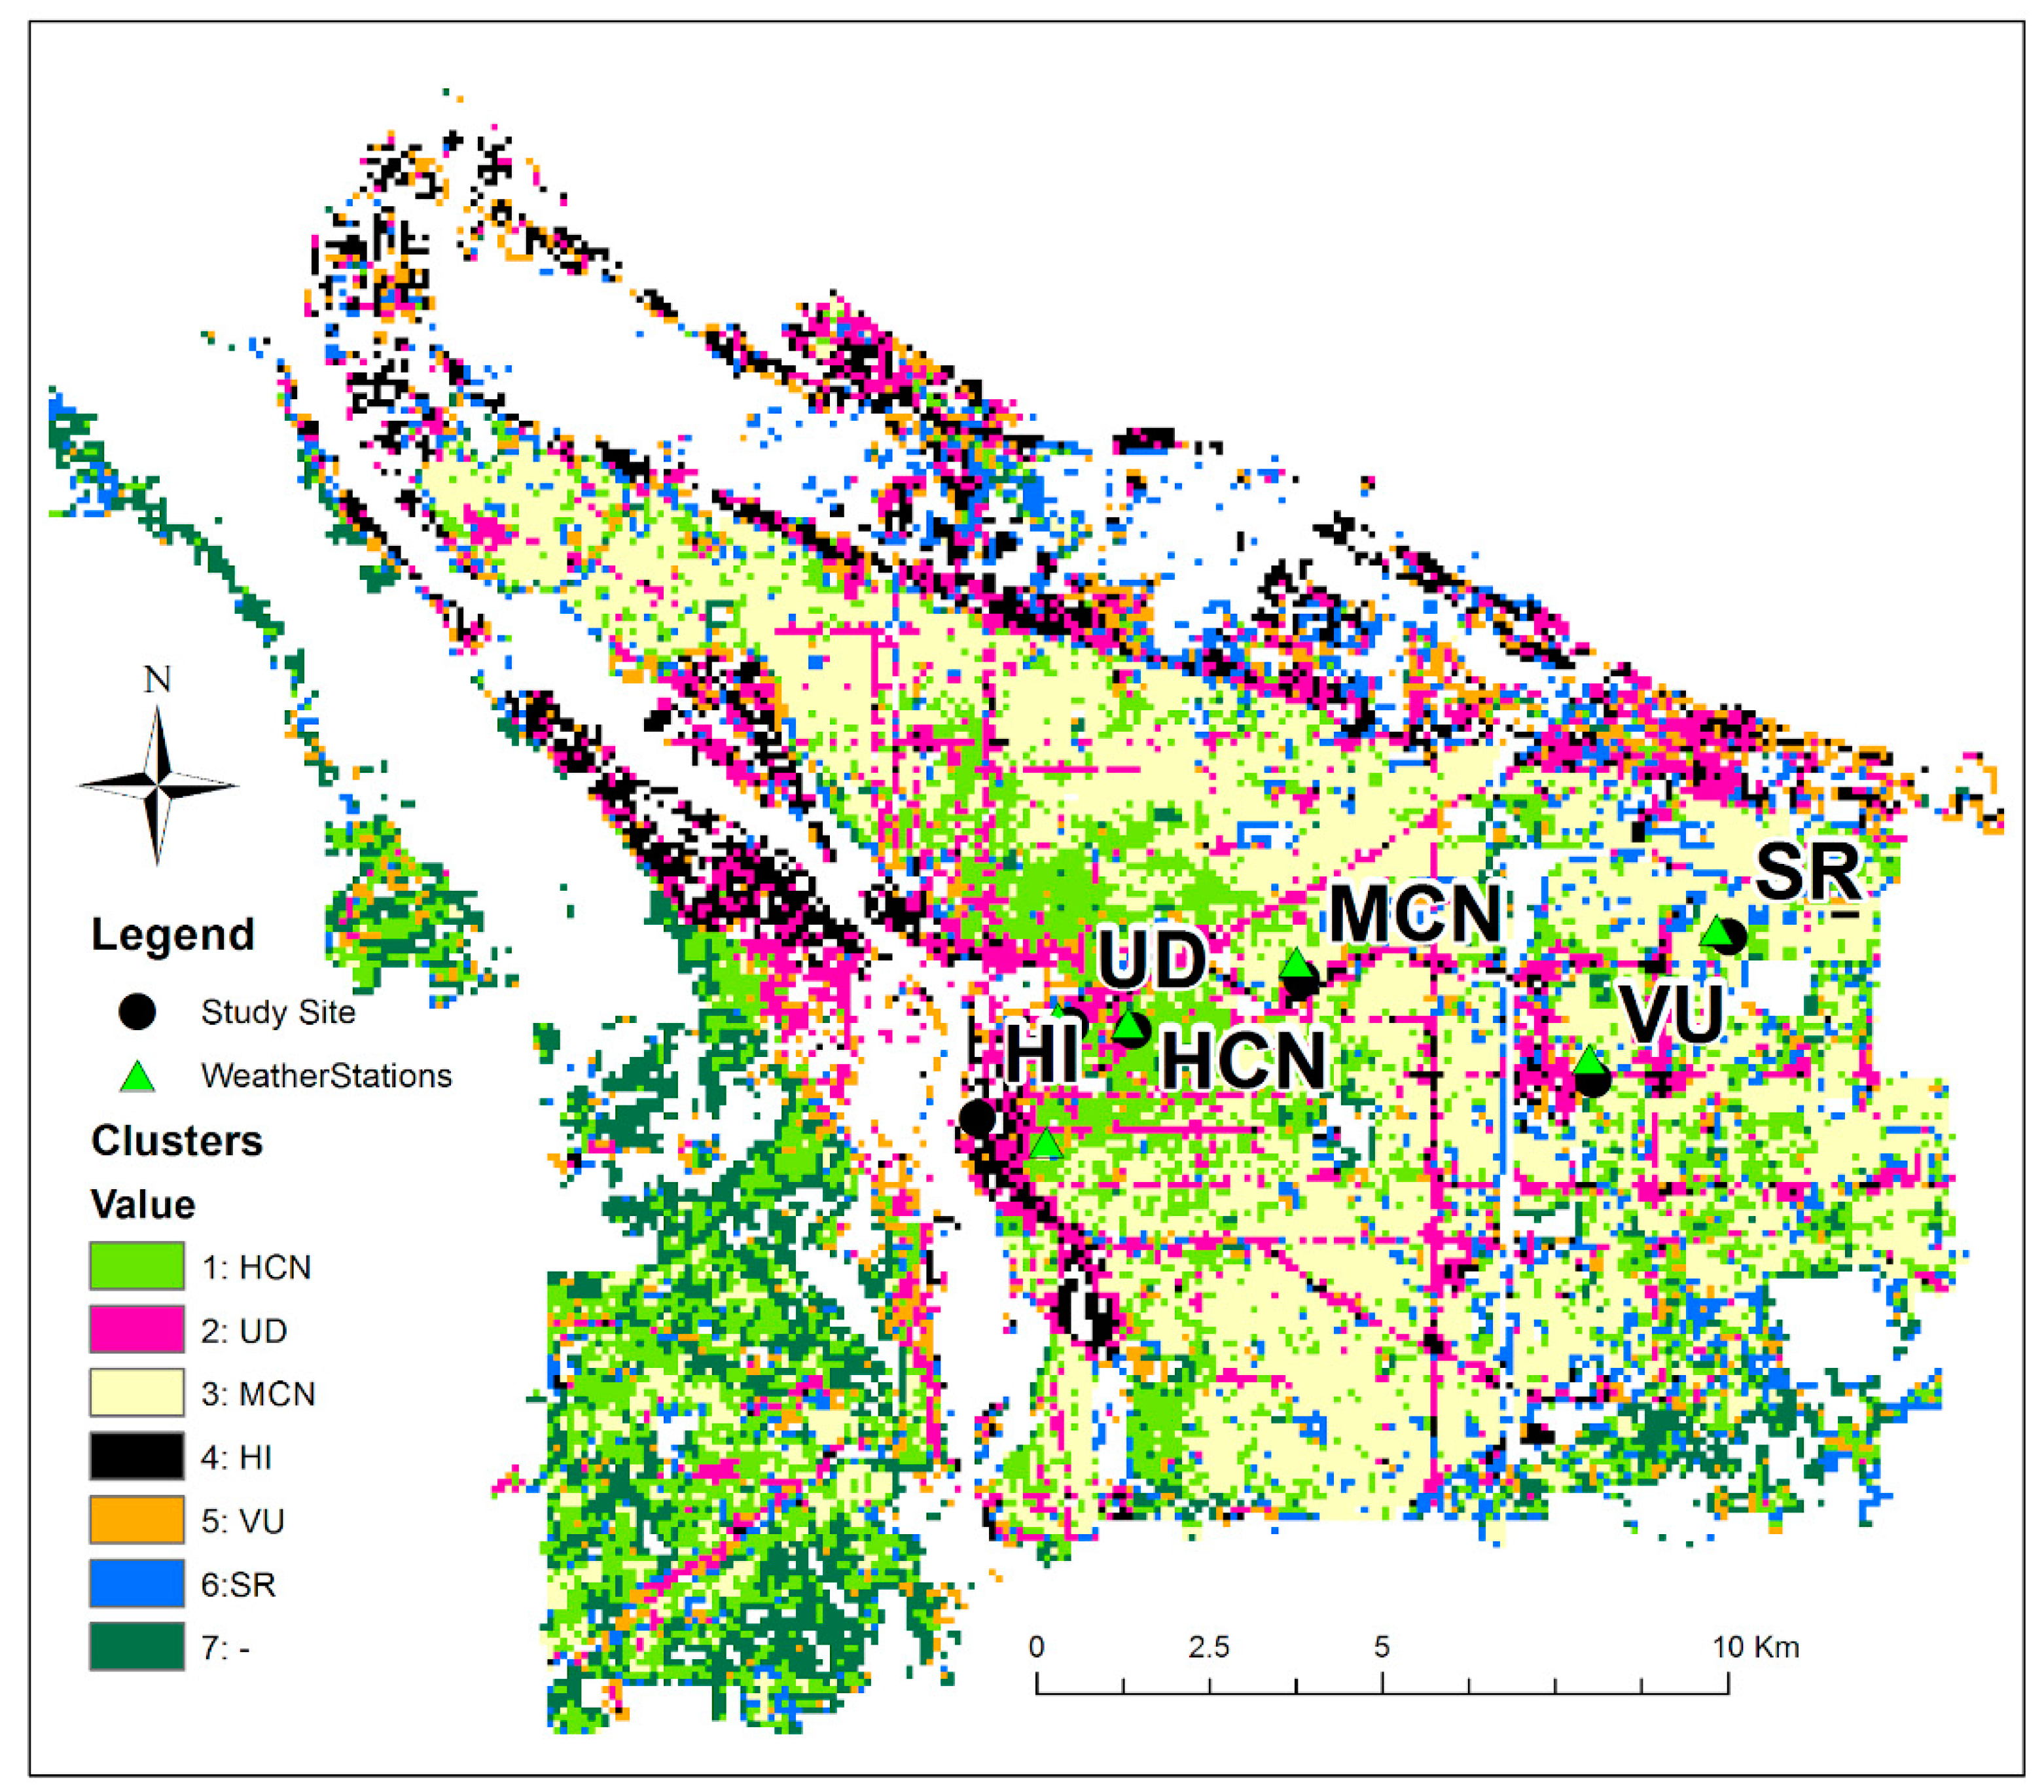
A map of all clusters was developed to identify potential locations of interest to this study; final site selections are marked with black dots and labeled on the map (
Figure 3). There is considerable mixing of cluster types across the city, although for the purpose of modeling scenarios we sought out study sites that contain primarily one cluster type. Data ranges for all input variables, for the six final cluster selections, are available below (
Figure 4). Emphasizing the effects of heat-ameliorating scenarios on specific cluster types, we created a generalizable model that may be applied to those land cover types throughout the city.
By simulating these different scenarios on the six clusters, we determined the extent to which landscape changes are expected to alter ambient temperature. The results of all six scenario simulations, within the context of the six cluster areas, are analyzed in contrast to the base scenario, in which no green infrastructural changes were considered. Based on our results, maximum temperatures were observed around 3 PM for the study region, and this time was used for comparison across all the scenarios. Temperature changes for each scenario reflect positive, neutral, and negative changes for each (
Table 6,
Figure 5).
The NoGreen scenario increased temperature significantly for HCN (+6.9 °C) and VU (+6.6 °C), but had a lesser impact for SR (+3.9 °C), MCN (+3.4 °C), UD (+1.6 °C) and HI (+0.5 °C). The most significant increases were in land use categories that already had a lot of vegetation, and the least increase were in those locations with least. These results may suggest the importance of tree preservation programs, which we will discuss further in the Discussion section below.
The AddGreen scenario showed cooling capability in all cluster types, with the greatest cooling effect for SR (−2.6 °C), and least for HCN (−0.5 °C). Not surprisingly, areas of the city with lots of vegetation do not change in temperature when adding more trees, in part because available space for tree planting is limited and/or already taken by other vegetation.
The RoofAlbedo scenario was shown to be most effective in UD (−1.2 °C) and HI (−1.4 °C), while RoadAlbedo had the greatest cooling effects in MCN (−0.8 °C), VU (−0.5 °C), and RF (−0.8 °C). Both interventions showed a measurable decrease in temperature within all cluster types.
Overall, the GreenRoof scenario had the lowest impact on ambient temperature, in some cases having no effect at all (VU) or decreasing temperature only a meager amount (HCN, MCN, SR). UD and HI are the only cluster types in which this type of green roof appears successful as a tool for heat mitigation, with results of −0.5 °C and −0.4 °C, respectively.
Across all cluster types, the Combination scenario was by far the most effective at reducing ambient temperature, when compared to the use of any single solution. However, as with all scenarios tested, changes in temperature varied significantly from cluster to cluster. While in UD, HI and SR, the Combination scenario resulted in an impressive average temperature decrease of over 3 °C, the results for HCN were a relatively small −0.7 °C.
These results suggest that increasing vegetation, decreasing the amount of asphalt pavement, and heightening albedo of both roof and paved surfaces have the potential to reduce ambient temperature; however, the effectiveness of each strategy varies depending on the land-cover cluster type to which it is applied. Furthermore, these results suggest that removing vegetation (the NoGreen scenario) is expected to result in measurable temperature increases in all cluster types; these increases can be dramatic, as shown in the cases of HCN and VU. This particular result indicates not only the cooling effect of vegetation, but also the heating effect of asphalt, a material which we associate with the presence of UHI in Portland, OR.
4. Discussion
This study aimed to identify which built environment characteristics are associated with high urban temperatures, as well as the extent to which alternative, and/or green designs might reduce temperatures and the UHI effect. Microclimate modeling was performed for six land-cover cluster types within the city of Portland, OR, referencing the unique climatic and physical environmental characteristics of the region. Results show that asphalt is a material highly associated with an increase in ambient temperature, while all green and green-grey infrastructure interventions, including green roofs, heightened road and roof albedo, and ground-level vegetation exhibit potential to mitigate that effect. Although all intervention scenarios modeled suggested a positive impact on urban cooling, particularly the Combination scenario, they were also shown to be inconsistently effective across land-cover cluster types.
Given that each cluster type is assumed to offer a unique baseline of vegetation, it is unsurprising that the different scenarios exhibit varying degrees of influence. For example, the NoGreen scenario produced a dramatic change in the VU cluster (+6.6 °C), but a comparatively negligible change in HI (+0.5 °C). This difference is likely to do with the amount of vegetation present in each cluster type prior to scenario modeling. VU areas are well vegetated and, thus, may be drastically affected by the loss of that vegetation; by contrast, HI areas are largely unvegetated to begin with, and thus unsusceptible to major changes under the same modeled conditions. Differences in baseline vegetation or green infrastructure may similarly explain variation in the effectiveness of cooling strategies. Adding ground-level vegetation (AddGreen) in a UD cluster is shown to be more cooling than the same intervention in VU (+1.5 °C and +1.1 °C, respectively). Again, as the VU cluster is already well-vegetated, there is less benefit to be gained by adding vegetation; conversely, the UD cluster is not especially green to begin with, and allows more room for improvement. There does appear to be a limit to the cooling potential of vegetation, however, namely in the HI cluster. While UD, the second most grey infrastructural environment, seems to respond well to increased vegetation, the HI landscape is less affected; we speculate that this is due to the overwhelming domination of grey infrastructure in HI clusters, the heating power of which is not correctable by ground-level vegetation alone.
The HCN land cover cluster represents neighborhoods with dense tree cover already present, and exhibited some of the most severe results in modeling. The NoGreen scenario proved most impactful for HCN, increasing ambient temperature by an average 6.9 °C, while all other scenarios (AddGreen, GreenRoof, RoadAlbedo, RoofAlbedo) were only minimally successful. Indeed, the Combination scenario was nearly five times more effective in UD than in HI, which indicated the smallest cooling result for that scenario. As with the previous examples given, these results are unsurprising considering the thick baseline vegetation available in HCN. However, what is unique to HCN are recommendations for future planning. For other cluster types, we recommend the implementation of additional vegetation, green roofs, or high albedo surfaces, all of which are expected to offer significant cooling benefits. In HCN areas, existing vegetation offers more such benefits than any other modeled scenario; therefore, we recommend an emphasis on canopy maintenance for these areas, and policies that protect degradation of existing vegetation.
The MCN cluster type is of particular interest to this study because it accounts for the largest portion of the urban study area, at 33%. Results show that these neighborhoods can be cooled most effectively by adding trees and heightening road albedo. This kind of landscape provides a special challenge in terms of future development, given that these areas are expected to increase in size and density within Portland [
44]. As a direction for future research, it would be helpful to conduct additional microclimate modeling that considers changes in building density; this will allow researchers to determine whether pre-development temperatures can be maintained in spite of growing density, and the extent to which green solutions would need to be employed to offset any increases in heat. While this additional research would be enlightening across all land-cover cluster types, MCN represents an area deserving more urgent attention, as it is both fast-growing and serves as home to many residents.
Green roofs are a much-discussed strategy for heat mitigation, although our results show that they are only convincingly effective in highly built-out areas, particularly those with large amounts of roof space, as well as grey infrastructure, such as HI and UD. This does not mean that green roofs could not offer heat-mitigating potential in other land-cover areas, but does suggest that this strategy would be most successful in these particular settings. However, the results also show that in all cluster types, the benefits offered by heightening roof albedo are more effective than installing green roofs. As this is likely to be a less expensive intervention and require less maintenance over time [
64], practitioners may wish to prioritize lightened roofs over green roofs, achieving the same heat-reduction benefits at a lower cost. An argument in favor of green roofs is the fact that they fill environmental roles beyond heat mitigation, such as stormwater retention, pollution control, and habitat for wildlife [
65]. It will be up to planners to set priorities and reconcile tradeoffs accordingly when choosing between these two types of roof design.
4.1. Relationship to Previous Studies
According to Liu et al. [
66], key elements thought to reduce land-surface temperature differ by “climatic regions, seasons and spatial scales, and also vary according to the statistical methods used for analysis.” Liu et al.’s conclusion supports the notion, central to this study, that all green designs or alterations to the built environment are not consistently effective, and that intra-urban variations make a difference to temperature outcomes. That said, there are some recurring themes throughout the literature on this topic that are generally supported by our results in Portland, Oregon.
Many studies of land surface temperature in urban areas have revealed the apparent cooling effects of green spaces and vegetation [
67,
68,
69,
70,
71], as found in the present study. Taleghani et al.’s studies in both Los Angeles [
60] and Portland [
62] show that adding vegetation and increasing the albedo of the pavement can decrease air temperature at 1.5 m. The Los Angeles study [
60] shows that green roofs specifically (as opposed to ground-level vegetation) have little cooling effect at 1.5 m height, but mainly provide cooling effects at heights above the pedestrian level (rooftop level). Similarly, Skelhorn et al. [
36] found that air temperature decreased slightly, by up to 0.17 °C, only at roof level (4 m) when applying the green roof scenario in Manchester, UK. By contrast, Peng and Jim [
72] suggest that extensive implementation of green roofs does reduce pedestrian-level air temperature by 0.4–0.7 °C in Hong Kong. The present study aligns more closely with conclusions by Taleghani et al. and others who suggest that green roofs have minimal impact at the pedestrian level. In our study, the GreenRoof intervention is consistently the least effective in all modeled scenarios (at 1.4 m height), although we did not model its effects at roof level. Differences in expected effectiveness of green roofs may have much to do with variation in regional climates, as suggested by Morakinyo et al. [
61].
Other studies have focused specifically on apparent relationships between urban temperature and the configuration of green space. For example, Naeem [
73] argues that green spaces with a square shape, less fragmentation, and a greater percentage of vegetation contribute to reducing the surface temperature in Beijing, China, and Islamabad, Pakistan. While configuration was not a central focus of this study, results from the HI cluster do show that adding vegetation in a predominantly linear pattern has minimal cooling effect. However, the Combination scenario of cooling interventions (rather than AddGreen alone) showed the most dramatic effects in the HI and UD clusters. This outcome supports a claim by Peng [
74] that built-up areas and non-vegetated land will be most significantly affected by cooling measures. Finally, our results support those from previous research [
75,
76] which find high-albedo surfaces to be viable cooling options. While our results do generally echo broad thematic findings of previous studies, they advance research on the topic by showing specific temperature changes, by intervention type, for various intra-urban land cover clusters.
4.2. Nature-Based Designs
Increasingly, environmental researchers and practitioners are approaching natural resource management, climate resiliency, and adaptation with an eye toward solutions that work with, rather than against or separately from, natural processes. Nature-based solutions can take many forms, in many environments, although the underlying goals include social and biotic resilience, equitable adaptation, and functional human-nature relationships [
39,
40]. The use of green infrastructure interventions as a solution to the UHI effect has the power to hit all of the aforementioned marks, while correcting existing imbalances in the built environment. Previous studies of Portland have shown the built environment to be highly variable, and heat distribution inconsistent across space [
21,
77]. While some neighborhoods, mainly those with higher-income residents, reap the benefits of copious tree cover, the city’s lower income and non-white residents are exposed to disproportionately high temperatures [
77]. The use of vegetation to cool these hottest areas may provide other benefits such as air quality improvement and aesthetic benefits, economic value, increased habitat for birds and other wildlife, increased biodiversity (assuming diverse tree and grass species are selected), and overall human and biotic resilience in the age of climate change and global warming [
78,
79]. Even nature-based interventions which do not involve the use of vegetation, such as roof and road lightening, can offer an improved quality of human life via citywide cooling, while preventing the loss of sensitive species to extreme heat stress. It is in the best interest of humanity to conserve and bolster the capacity of our environments to offer the ecosystem services on which we depend for survival, and this ethic certainly applies in the struggle for cool, healthy, resilient urban areas.
4.3. Transferability of the Study
As the results of this study have shown, green and nature-based interventions are not equal across a city, and different land-cover types significantly alter the usefulness of different strategies. The local value of this study to City of Portland officials and planning practitioners is that it reveals those differences, and can guide informed action at a level more granular than the typical citywide scale. Just as we see differences in the efficacy of these interventions across one city, we would expect to see differences across multiple cities and various climates. As such, we do not recommend that these results be applied as they are to any city other than Portland, OR. However, a benefit of this ENVI-met modeling approach is that the same steps outlined here may be followed and replicated anywhere, made specific to any location by inputting the relevant climate and land-use data. There are numerous studies available which report on the average cooling capacity of various interventions discussed here, though these notably do not account for the unique intra-urban climate or physical environment of a particular place. Rather than rely on generalized averages, we recommend any practitioners with an interest in urban heat reduction to model proposed scenarios at this intra-urban scale for the most relevant results.
5. Conclusions
This study examined the impact of vegetation and building materials on ambient air temperature using ENVI-met microclimate modeling. The results indicate that decreasing paved surfaces, increasing vegetation, and heightening road and roof albedo can maintain or reduce temperatures in any of the areas studied. We observed that different areas of the city require site-specific applications for reducing temperatures. Areas mostly covered by buildings and pavement, such as Urban Districts and Hardscape Industrial, will be cooled by increasing the albedo of roofs and roads. On the other hand, for the areas that already feature abundant tree cover, such as High-Canopy Neighborhoods and Vegetated Urban, planning efforts should focus on maintaining the status quo rather than adding vegetation or increasing albedo. In areas with large open spaces of soils or grasses, such as Semi-Rural, temperature may be successfully reduced by simply adding more trees. Medium-Canopy Neighborhoods, which occupy the largest portion of the study area, would benefit by adding trees in open spaces and increasing the albedo of roads. No matter the intervention recommended for each cluster type, this study has offered compelling evidence that nature-based, green solutions to the UHI effect are both practical and promising. Green infrastructure is not only cooling, but offers social and biotic rewards far beyond what is currently offered by many areas of the built urban environment. Local leaders, planners and policymakers have an imperative to look ahead, consider the limits of adaptation, and make responsible choices that will promote human and environmental resilience as we all face a warming world.


