Abstract
In this study, we used the positive matrix factorization (PMF) model to evaluate the sources of ambient coarse particulate matter (PM) and their temporal variations in two sampling sites, i.e., a school dormitory and a retirement home, located in central Tehran. 24-h ambient PM samples were collected using low-volume air samplers from May 2012 to June 2013. The collected filters were analyzed for their chemical components, including water-soluble ions, metals, and trace elements, which were used as the input to the PMF model. Our results indicated annual averages of 45.7 ± 3.8 µg/m3 and 36.2. ± 4.0 µg/m3 for coarse PM at the School dormitory and Tohid retirement home, respectively. Moreover, higher ambient coarse PM mass concentrations were observed in the warm season (53.3 ± 5.8 µg/m3 for school dormitory and 43.1 ± 6.1 µg/m3 for Tohid retirement home) as opposed to the cold season (41.4 ± 4.7 µg/m3 for school dormitory and 28.7 ± 4.6 µg/m3 for Tohid retirement home). Our PMF analysis also identified road dust, soil, and industry, and atmospherically processed coarse PM as the three sources of ambient coarse PM in central Tehran. Road dust, soil, and industry were the major sources of ambient coarse PM, contributing respectively to 74 ± 9% and 19 ± 2% of the total coarse PM mass concentration, while atmospherically aged aerosols had a rather minimal contribution of 7 ± 1% to total coarse PM mass concentration. The temporal trends of the resolved factors also revealed higher contributions of road dust to total ambient coarse PM during warm season as opposed to cold season, due to the increased resuspension rate from road surfaces as a result of higher wind speeds, and temperatures, combined with lower relative humidity. Similarly, higher resuspension rate of mechanically originated particulates resulted in higher warm-season time contributions of the soil factor. Results of this study clearly revealed the key role of road dust and non-tail pipe emissions on ambient coarse PM mass concentrations in crowded areas of central Tehran, and have important implications on the potential health impacts that can be caused by these difficult to mitigate sources of coarse PM.
1. Introduction
Particulate matter (PM) has been recognized as a critical air pollutant in many metropolitan areas, particularly in developing countries, as a result of rapid increase in population, industrialization, biomass burning activities, and often enhanced by occasional dust storm episodes [1,2]. Exposure to ambient PM can lead to serious health effects, including respiratory and cardiovascular diseases, neurodegenerative disorders, lung cancer, and mortality [3,4,5,6]. Additionally, PM can cause economical losses (i.e., labor loss as a result of work days lost and extra medical expenditure) as well as environmental impacts, such as climate change and visibility degradation [7,8,9]. Previous studies have revealed that different size ranges of PM can be emitted from various sources with different fingerprints [10,11]. PM from different sources might have different toxicological characteristics as well as different impacts on visibility, and radiative forcing, supporting the postulation that PM mass concentration is not the most appropriate metric to investigate the adverse effects of PM [12,13]. Therefore, source apportionment studies are quite beneficial in identifying different sources of PM, their corresponding chemical compositions and their link with toxicity, which can further be used by health authorities to develop policies to mitigate the detrimental health impacts of exposure to ambient PM.
In addition to the world-wide research regarding the health effects of fine and ultrafine PM (particles with aerodynamic diameter of ≤2.5 µm, and <0.10 µm, respectively), several studies have also evaluated the toxicity and health impacts of coarse PM (particles with aerodynamic diameter within 2.5 µm and 10 µm) exposure, including lower birth weight and increased rate of hospital admissions due to cardiovascular diseases and respiratory complications [14,15,16]. In particular, coarse PM contains several redox-active metals, including Fe, Cu, Cr, Ni, and Mn, which can induce the generation of reactive oxygen species (ROS) within cells, leading to oxidative stress, inflammation, and as a result produce adverse health effects [17,18,19,20,21]. Moreover, some studies have investigated coarse PM effects on visibility, which induces haze events and visibility impairment [22,23]. Coarse particles consisted of crustal elements as well as vehicular tire and brake wear products [22,24]. These particles might have originated from suburban backgrounds and can be carried out to urban areas depending on the particle transport pattern (i.e., proximity to the source of pollution and prevailing wind speed and direction) [25,26]. According to the literature, soil and mineral dust, road dust, vehicle wear, sea salt, and sea spray are among the potential sources of coarse PM in different urban environments around the globe [22,24,27].
Although these particles are difficult to mitigate since they are not products of tailpipe emissions, there are different control mechanisms that could be used to effectively reduce the airborne dust emissions as well as the suspended dust on the paved/unpaved roadside [28,29,30,31,32,33,34]. Among all, one of the most effective, but expensive, methods to remove the non-tailpipe emissions from the vehicles in roadways is the automatic mist-generating systems (i.e., water sprinkling), in which spraying of water via pressurized nozzles prevents the formation of airborne dust particles [29,30]. In addition, there are mechanical and chemical methods to remove the suspended dust from roadside, including the use of dust suppressants, water flushing, and street sweeping, which are mostly used by municipalities [28]. For instance, chemical suppressants (i.e., surfactants, salts, and polymers) have been reported to significantly mitigate the suspended dust from paved and unpaved roadsides by facilitating the particle aggregation with the existing moisture in the air [28,31,32]. A more traditional approach to clean the dust load from the roadside surface layer is the combination of water flushing and street sweeping, which increases the mass and surface tension of the particles and decreases the likelihood of their resuspension [17,28,34,35].
Tehran, the capital of Iran with a population of nearly 9 million residents [36], has experienced several severe episodes of air pollution during the past few decades [37]. The large number of mobile sources (more than 4 million vehicles) in that megacity, as well as its proximity to a large number of industrial units have led to serious air pollution challenges in Tehran [38,39]. This situation is further exacerbated by the topography of the area, being surrounded by Alborz mountains to the north and east. These terrains are consisted of sedimentary rocks dating from Upper Devonian to Oligocene, prevalently Jurassic limestone over a granite core. Consequently, Alborz terrains act as barriers between the Caspian Sea and Iranian Plateau with width of 60–130 km [40], limiting the horizontal dispersion of southerly and westerly southerly wind-driven pollutants in those directions [41]. Previous studies in Tehran have documented the lowest air quality during the cold season as a result of lower mixing height, stable meteorological conditions, and temperature inversions [42,43]. Moreover, vehicular emissions and industrial activities are found to be two of the dominant sources impacting the air pollution in this mega city [37,44]. Mobile sources have been identified as dominant contributors to CO (98%), volatile organic compounds (VOCs) (88%), and NOx (46%), while energy conversion processes (i.e., power plants and petrochemical facilities) have been found to be responsible for the majority (i.e., more than 90%) of SOx emissions [45].
Previous source apportionment studies have identified vehicular emissions, secondary aerosol, and industrial emissions as the dominant sources of PM2.5 in Tehran with minimum contributions from road dust, biomass burning, soil, oil combustion, and sea salt to PM2.5 mass [46,47,48]. Furthermore, residential oil combustion, gasoline, and diesel-powered vehicles had moderate to high correlations with the PM2.5 associated oxidative potential in Tehran, measured by means of the Dichlorofluorescin (DCFH) in vitro assay [49]. More recently, carcinogenic PM2.5-bound polycyclic aromatic hydrocarbons (PAHs) were found to mostly originate from various sources including petroleum residue, residential heating and biomass burning, industry, diesel, and gasoline exhaust, with approximately equal contributions of each factor to the total PAHs concentrations [50]. Despite the abovementioned studies on PM2.5 source apportionment in Tehran, to the best of our knowledge, no coarse PM source apportionment studies have been conducted in this city.
Therefore, the scope of this work was to evaluate the temporal variations in the sources of coarse PM and its chemical composition in two sampling sites located at central Tehran during May 2012 to June 2013. We employed USEPA’s positive matrix factorization (PMF), a receptor model that has been widely used in source apportionment studies around the world [20,51,52,53,54], to identify the sources of ambient coarse PM mass concentration and determine their relative contribution at the study sites, using water soluble ions and trace metals as inputs to the model. Finally, temporal variations in the contributions of the resolved factors to total coarse PM mass concentrations were investigated in the study areas. Findings of this study are of great importance to determine the dominant role of the major sources of coarse PM in central Tehran, and can be used in follow-up risk assessment studies to characterize the health risks caused by exposure to source-specific coarse PM concentrations in the study area.
2. Methodology
2.1. Sampling Sites Description
Ambient PM sampling was performed at two residential sampling locations in central Tehran. The first sampling site, Tohid retirement home (35°42′20.30″ N, 51°22′14.41″ E), was located about 650 m away from Chamran freeway while the other site, School dormitory (35°42′40.33″ N, 51°22′49.75″ E), had a distance of 200 m from the similar freeway. Previous studies in the area have indicated that central Tehran is highly polluted as a result of abundant vehicular, household, and commercial activities [39,41,45]. Therefore, both of the sampling sites of this study are exposed to all of the abovementioned sources, as identified by our previous PM2.5 source apportionment study [46,50] at the same sampling sites. In addition, considering that the vast majority of the Tehran population lives in/near the city center [39], it can be argued that our sampling sites properly represent the population exposure to major sources of air pollution in the metropolitan area of Tehran. Figure 1 illustrates the map of the study area with the locations of our sampling sites. More detailed information about the location and characteristics of each sampling site can be found in Hassanvand et al. [55,56]. Figure 1 also indicates the corresponding wind rose pattern (using WRPLOT View version 7.0 [57]) of our sampling sites, based on the 8-h weighted average wind speeds and wind directions during the sampling campaign. Based on the figure, prevailing southerly and westerly wind directions were observed for the whole sampling campaign. Investigating the seasonal wind rose plots (Figure S1) also depicted the predominance of westerly wind directions as well as the presence of minor southerly winds during both seasons.
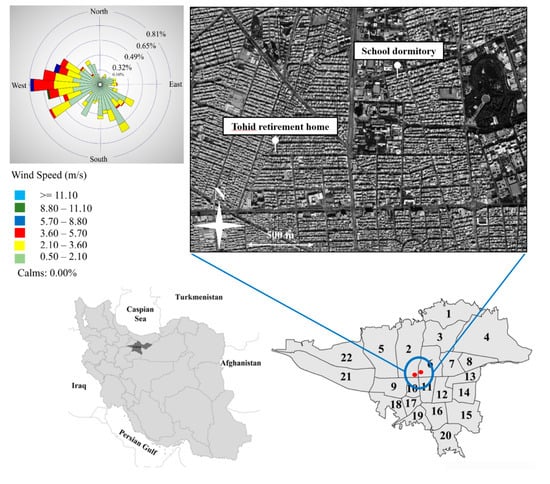
Figure 1.
Location of the sampling sites and the average wind rose during the sampling period.
Table S1 presents the seasonal averages for important meteorological parameters in central Tehran. The average (±SD) ambient temperature, relative humidity, and wind speed were 18.6 ± 9.1 °C, 40 ± 17.1%, and 3.0 ± 0.7 m/s, respectively. As presented in the table, wind speeds, relative humidity, and temperatures were quite comparable between the spring and summer seasons. Similarly, the seasonal averages of wind speed, temperature, and relative humidity were similar across the fall and winter seasons. Therefore, we decided to present the results of this study in two seasons; the cold season spanning fall and winter (i.e., April–September), and the warm season (i.e., Octomber–March) encompassing spring and summer.
2.2. Sampling Schedule and Analysis
Twenty-four-hour PM2.5 and PM10 samples were collected at both sampling sites from May 2012 to June 2013. Sampling took place from 1st to 6th and from 16th to 21st of each month at the school dormitory site, while the corresponding sampling schedule was from 7th to 12th and from day 23rd to 28th of each month at the Tohid retirement home. PM samples were collected on Polytetrafluoroethylene (PTFE) (47 µm diameter, SKC Inc., Covington, GA, USA) filters by the means of low-volume air samplers (FRM OMNUTM air sampler, multi-cut inlet; BGI Inc, Bridgeview, IL, USA). In order to achieve sufficient mass loadings for the planned chemical analyses, depending on the mass loadings collected on the filters, we composited samples collected over 3–4 consecutive days. Concentrations of water-soluble ions as well as metals and trace elements were determined via ion chromatography (IC) and Inductively Coupled Plasma Optical Emission Spectrometry (ICP-OES), respectively. Samples for which the concentrations of the measured chemical species were below the detection limit (BDL) were excluded, and a total of 60 samples for the two sites combined were used as input to the PMF model (as described in Section 2.3). Further details regarding the sampling methodology, applied instrumentation, and the corresponding chemical analysis can be found in Hassanvand et al. [55,56].
Overall, PM2.5 and PM10 collected samples were analyzed for their chemical components at school dormitory and Tohid retirement home. Coarse PM concentrations were determined by subtracting PM2.5 concentrations from the corresponding PM10 values for both of the sampling sites.
2.3. Positive Matrix Factorization (PMF) Receptor Model
The PMF multivariate receptor model has been used to identify sources and their corresponding contributions to target variables including PM mass concentration, PM number concentration, and PM-bound PAHs [24,58,59,60,61]. This model solves the following chemical mass balance (CMB) equation to decompose a matrix of chemically or physically-speciated data into source profiles and their contributions [62,63,64]:
where p is the number of factors; Xij indicates the concentration of ith sample for the jth species. Moreover, gik and fkj refer to the amount of mass contributed by kth factor to ith sample, and the contribution of kth factor to jth species, respectively. Finally, eij is the associated residual for jth species in the ith sample.
In order to determine source profiles and their contributions, PMF minimizes the objective function (Q) by the means of the least-squares method.
where n and m represent the number of samples and species, respectively. Additionally, uij indicates the estimated uncertainty associated with the concentration of ith sample in the jth species. It should be noted that minimizing Q is performed by setting constraint of non-negative values for factor profiles and their contributions [65,66].
Moreover, since the uncertainty values were not reported during the experimental sampling and analysis, the following uncertainty method suggested by Ito et al. [67] was employed for estimating the input uncertainty matrix:
where is the uncertainty of ith sample for jth species; Xij indicates the jth species concentration in ith sample; and Dj refers to the limit of detection for jth species.
In this study, USEPA’s PMF model version 5.0 was implemented for coarse PM mass concentration source apportionment. Since the two sampling sites were relatively close to each other with the distance of 1.1 km [55,56], PMF input concentration matrix for both sites were considered as a unit combined matrix. This approach strengthened the statistical power of the implemented model by means of increasing the number of samples to 60 data points. We assumed that source factor profiles remain consistent across the two sampling sites, as reported for PM2.5 in the same locations [46]. Although this argument might be more valid for PM2.5 which is homogeneously dispersed across the city in comparison to coarse PM [68], the results of independent sample t-tests indicated that, with few exceptions, the concentrations of individual components of coarse PM were not statistically significantly different (p values ranged from 0.11 to 0.93) across the two sampling sites (Table 1), further corroborating the assumed consistency in source profiles of coarse PM at the two sites.

Table 1.
Summary statistics of coarse PM and its chemical components for Tohid retirement home, School dormitory, and the combined dataset.
The signal–to–noise ratio values were also determined to investigate the source of variability in data. S/N ratio > 1 is considered strong while S/N < 1 refers to a weak species [66]. Moreover, geometric mean was used for replacing missing values and, subsequently, their corresponding uncertainty values were tripled to decrease their impacts on the resolved PMF solutions statistics [66,69]. Finally, no extra modeling uncertainty was considered in our PMF runs. The uncertainty associated with the PMF-resolved solutions was estimated by statistical tools, using displacement (DISP) and bootstrap (BS) analyses [64]. In DISP analysis, PMF outputs were considered acceptable in terms of rotational ambiguity, as long as no factor swaps were observed for dQmax = 4 while drop of Q was < 0.1%. In the case of BS analysis, 100 runs were conducted with a minimum R2 value of 0.60, and PMF solutions were reliable when more than 80% of the factors were mapped [65,66].
3. Results and Discussion
3.1. Data Overview
Summary statistics of the measured species, including minimum (min), median, maximum (max), average and signal-to-noise (S/N) ratio of the ambient coarse PM, and its chemical components for the combined dataset are indicated in Table 1. This table also includes the average concentration and standard error (SE) of the chemical species as well as coarse PM levels for each of the sampling sites. As can be seen in the table, the average coarse PM levels were 36.2 ± 4.0 µg/m3 and 45.7 ± 3.8 µg/m3 at Tohid retirement home and School dormitory, respectively. These values are perfectly consistent with the 44 µg/m3 as the Tehran coarse PM annual mean concentration reported by world health organization (WHO) [70], corroborating the use of these sampling sites as representatives of central Tehran area. It should also be noted that S/N > 1 were reported for all of the species, indicating strong signals for input variables of PMF.
Figure 2 shows an overview of coarse PM concentration and its seasonal variability at the two sampling locations. As can be seen in the graph, a higher concentration of coarse PM is observed during the warm season, as opposed to the cold season, due to the increase in particle concentration originating from dust and crustal elements in hot and dry days [47,48,71,72].
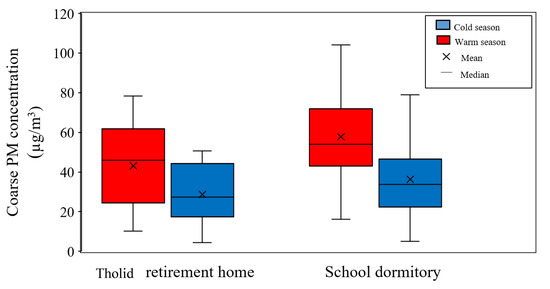
Figure 2.
Seasonal variations of coarse PM concentrations at Tohid retirement home and School dormitory. The boxes represent inter-quartile range (25th to 75th percentile), while whiskers demonstrate the 5th and 95th percentiles.
Figure 3 also illustrates the seasonal variations in the concentrations of selected metals at both of the sampling sites. The selected metals (i.e., Al, Ti, Ba, Se, Li, As, Fe, Zn, Cu, Mn, and Si) in coarse PM can be emitted by a wide range of sources including soil, road dust, brake and tire wear, and industrial emissions [22,27,73,74]. As shown in the figure, the concentrations of Al, Si, and Fe, as tracers of soil dust [27,75], were significantly higher in the warm season compared to the colder season at the Tohid retirement home (p value < 0.05). This is due mainly to the higher wind speeds and lower relative humidity’s in the warm seasons that facilitate the resuspension of soil particles [59,76]. Similarly, these crustal elements had relatively higher concentrations during the warm season at the school dormitory, although the differences were not statistically significant (p values ranging from 0.14–0.62). Al, Fe, and Si were the dominant metal elements in the coarse PM chemical composition, contributing to 82% and 94% of total coarse PM-bound metals at school dormitory and Tohid retirement home, respectively.
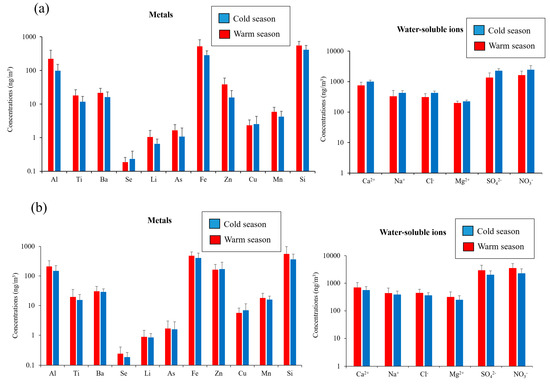
Figure 3.
Seasonal variations in the concentrations of selected metals and water-soluble ions at: (a) Tohid retirement home; (b) school dormitory. Error bars correspond to one standard deviation (SD).
Similar trends were also observed for tracers of road dust, including Ba, Zn, and Mn [73,74,77,78]. Ba, Zn, and Mn concentrations were significantly higher (p value < 0.05) in the warm season compared to the cold season at the Tohid retirement home. At the school dormitory site, the concentrations of these species were also higher on average in the warmer season, but the differences were not statistically significant (p value = 0.53–0.72) across seasons. The higher concentrations of these species in the warm season can be justified by drier (i.e., lower relative humidity) and more unstable (i.e., higher wind speed) meteorological conditions during that season. For Cu, the seasonal variations indicated comparable (p value = 0.47–0.55) concentrations across the warm and cold seasons at both sampling locations. The similarity in the seasonal concentrations of this species could be due to the fact that the higher road dust resuspension rate (a result of higher wind speed and lower relative humidity) in the warm season is counterbalanced by the more stable meteorological conditions (i.e., lower mixing height) in the cold season, which limit the horizontal and vertical dispersion of its emissions.
The seasonal variations of the abovementioned tracers of road dust are in line with the results of previous studies in the literature. For example, the higher concentrations of Ba in the warm season is consistent with the results of Galindo et al. [79], reporting higher Ba concentrations in the summer time due to higher dust resuspension rate and lower precipitation. Similar results have also been observed by several other studies regarding the seasonal variations of other road dust tracers, including Zn, Mn, and Cu [54,80,81,82,83]. We should, however, note that the reported seasonal trends for road dust tracers are not entirely consistent in the literature; while some studies report higher concentrations of these species in the summer [54,80,81], other studies report higher concentrations of the same tracers in the colder season [79,84,85], which, as argued earlier, could be attributed to the more stable meteorological conditions in the colder season that confine the emissions of these species within a lower mixing height.
Since As and Se (tracers of industrial emissions [86,87]) are mostly emitted by anthropogenic local sources, their concentrations were comparable between the two seasons (p value = 0.1–0.7) at both sampling locations. This trend is in agreement with the results of other studies [82], in which the authors reported comparable concentrations of heavy metals in both seasons. Analyzing the seasonal trends of marine ions (i.e., Na+, Cl−, and Mg2+) also revealed comparable concentrations during the cold and warm seasons at the school dormitory (p values ranging from 0.15 to 0.41) and the Tohid retirement home (p values ranging from 0.15 to 0.20). The presence of marine ions in Tehran’s coarse PM is probably attributed to the two salt lakes (i.e., Qom namak lake, and Hoz-e-soltan desert lake) which are located to the south of Tehran. These ions are transported to our sampling sites by the prevailing southerly and southwesterly winds. The frequency of these prevailing winds was comparable (p value = 0.79) between the warm and cold seasons, leading to similar seasonal concentrations of these marine ions for both sites. Our results did not indicate significant differences in the seasonal variations of NO3− and SO42− concentrations during the cold and warm seasons (p value > 0.05) at both sampling sites. As will be discussed in “Factor 3: Atmospherically Processed Coarse PM”, the coarse PM-bound sulfate and nitrate are formed via heterogeneous chemical reactions of airborne coarse PM (e.g., water-soluble calcium (Ca2+) as well as marine ions) with sulfuric and nitric acids. Therefore, similar seasonal concentrations of these secondary inorganic ions were observed due to the comparable concentration of the said species in the warm and cold seasons.
3.2. PMF Results
3.2.1. Number of Factors
The optimum number of factors (i.e., 3) was determined based on the PMF resolved source profiles and contributions after trying different number of factors and extra modeling uncertainties. Finally, the best PMF solution was obtained based on the following criteria: (1) The correlation between modeled versus measured coarse PM mass concentrations (Figure 4a); (2) physical interpretation of the resolved factor profiles and their corresponding seasonal contributions; (3) variation of the Qtrue versus number of factors (Figure 4b); and (4) results of uncertainty analysis (i.e., displacement (DISP), and bootstrap (BS)). It should be noted that Qtrue (i.e., the true objective function) illustrates the ability of PMF model in fitting all of the input data points [66,88]. To further support the validity of our selected number of factors, results of the 4 factor PMF analysis, along with the pertinent discussion, are included in the Supplementary Information (SI) file. The correlation between the modeled and measured coarse PM mass concentrations is shown in Figure 4a. Based on the figure, there is a high correlation between the measured and predicted total coarse PM mass concentrations (slope = 0.98 and R2 = 0.96), indicating that the PMF model has effectively estimated the contribution of each source to the total coarse PM mass concentrations.
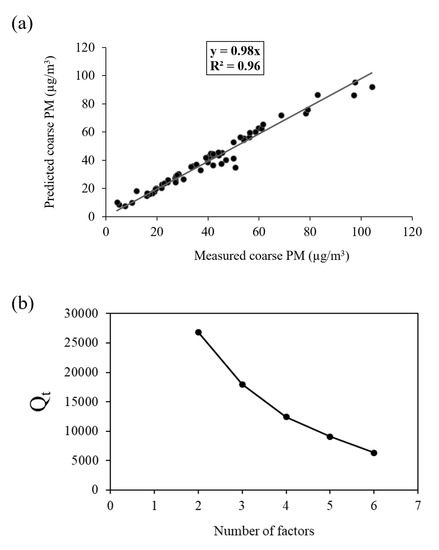
Figure 4.
(a) Correlation between measured and predicted coarse PM; and (b) Qt (true objective function) versus number of factors.
Figure 4b also shows the Qtrue values for runs with different number of factors. As can be seen in the figure, a major drop of 33% in Qtrue was observed when increasing the number of factors from 2 to 3. Therefore, considering the abovementioned criteria, the 3-factor solution was elected as the final optimum PMF output. Figure 5 demonstrates the three PMF-resolved (i.e., road dust, soil and industry, and atmospherically aged coarse PM) factor profiles. The overall relative contributions of the PMF-resolved factors to coarse PM mass concentrations are also presented in Figure 6. Finally, Figure 7 indicates the seasonal variations in the absolute concentrations of the identified factors to total coarse PM mass concentration.
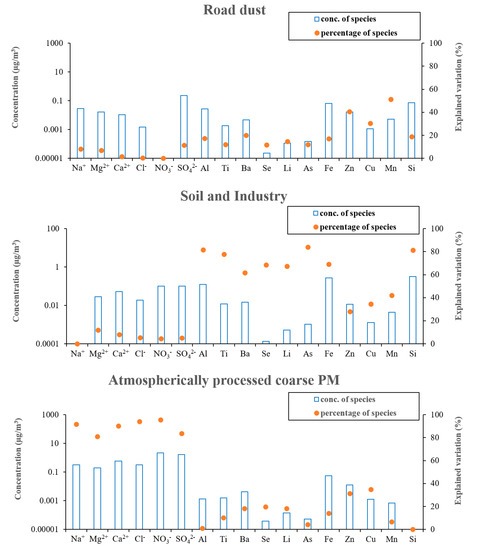
Figure 5.
PMF resolved factor profiles.
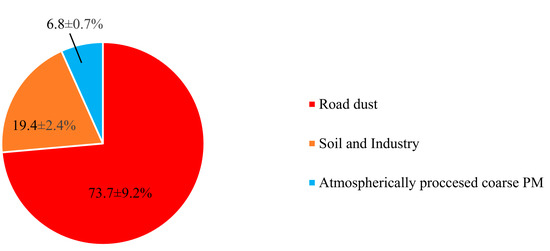
Figure 6.
Relative contributions of different sources to coarse PM for the whole sampling campaign.
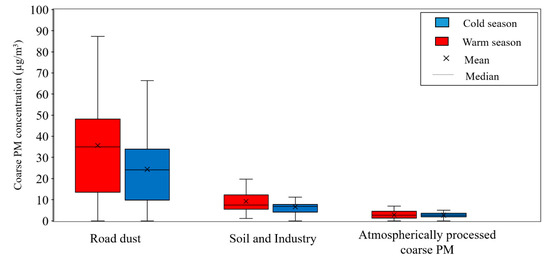
Figure 7.
Seasonal concentrations of resolved factors to total coarse PM. The boxes indicate inter-quartile range (25th to 75th percentile) while whiskers represent the 5th and 95th percentiles.
3.2.2. Factor Identification
Factor 1: Road Dust
The first factor was identified based on high loadings of Cu, Zn, Mn, and, to some extent, Ba (Figure 5). This factor was the dominant contributor (74 ± 9%) to total coarse PM mass concentration (Figure 6). Previous studies have indicated that Cu, Zn, and Mn are chemical tracers of road dust resuspension, brake and tire wear particles, and road surface abrasion [73,77,78]. Furthermore, Ba is also a well-known marker of brake wear [74]. There is also substantive evidence suggesting that road dust and tire wear particles can mostly be represented within the coarse PM particle size range (2.5–10 µm) [89,90]. Particularly, Harrison et al. [74] found that these particles are most abundant at 3 µm. Therefore, factor one was entitled “road dust”.
Investigating the temporal trend of this factor reveals higher contribution (p value = 0.009) to total coarse PM during warm season (35.7 ± 5.0 µg/m3) as opposed to cold season (24.4 ± 3.3 µg/m3) (Figure 7). The observed temporal trend can be justified as a result of more unstable meteorological conditions due to the combined effects of higher wind speed and mixing height with lower relative humidity in the warm season [59,91]. In addition, higher temperature and lower relative humidity increase the deposition rate of the dispersed dust on the road surface, which eventually leads to an increase in the resuspension rate of the coarse particulates by means of vehicles movement [92,93]. The meteorological data of our sampling sites also confirms such seasonal patterns in wind speed and relative humidity. More importantly, while PM2.5 is mainly emitted from combustion sources, the coarse PM particles are resulted from mechanical processes such as surface soil and dust resuspension. Therefore, it is expected to see higher contributions of wind-driven resuspension processes (i.e., road dust emissions) in warm season, as opposed to cold season [94]. While Taghvaee et al. [46] reported traffic emissions as the major contributor (50–60%) to the PM2.5 mass concentrations in Tehran, with minimal road dust contributions (1–5%), road dust is playing a major role in the coarse PM size range [95,96].
Factor 2: Soil and Industry
This factor was associated with significantly high loadings of Al, Ti, Ba, Se, Li, As, Fe, and Si (Figure 5) and contributes on average to 19 ± 2% of the total coarse PM mass concentration (Figure 6). According to the literature, crustal elements such as Al, Ti, Li, Fe, and Si are well-known tracers of mineral dust and soil emissions [22,27], while Se, and As are markers of industrial (i.e., electronics, plastic, glass, coal and heavy oil combustion, metal smelting, and paints industry) emissions [46,86,87]. Therefore, factor 2 can be considered a mixture of soil and industrial emissions. The major role of industrial activities in Tehran’s air pollution was previously noted by Shahbazi et al. [45], who reported the existence of around 3100 industrial units in the city. This factor was also impacted to a lesser degree by road dust emissions, due to the presence of Ba, Cu, Mn, and Zn, which is in agreement with the results of previous studies [22,46,96].
Evaluation of the temporal trends for soil and industry emissions indicated relatively higher contribution (p value = 0.025) of this factor to coarse PM mass during warm season (9.2 ± 1.4 µg/m3) rather than cold season (6.6 ± 0.8 µg/m3) (Figure 7), due to the prevailing unstable meteorological conditions noted earlier, leading to a higher resuspension of mechanically derived particulates [94,97]. Previous coarse PM source apportionment studies have also reported a similar trend of higher mineral dust contributions during the warm season [98,99]. The seasonal trends of this factor further substantiate the dominance of soil origin rather than industry, since industrial emissions have higher contributions during cold season due to the more stable atmosphere and limited atmospheric dispersion that prevail during that season [50].
Factor 3: Atmospherically Processed Coarse PM
Factor 3 showed very high loadings of Ca2+, Na+, Mg2+, Cl−, NO3−, and SO42−. Typically, in ammonia-rich environments, ammonia reacts with sulfuric and nitric acids to form ammonium sulfate and ammonium nitrate, respectively [100,101,102]. Ammonia can only neutralize nitric acid after having fully neutralized sulfuric acid to form ammonium sulfate [100,101,102]. However, in the case of our study, the ambient molar ratio of NH4+/SO42− was < 2 (i.e., 1.6), indicating an ammonia-poor environment which prevents complete neutralization of sulfuric and nitric acids [101,102]. The excess concentrations of these acids (especially nitric acid) will then react with airborne coarse particles (including Ca2+ as well as marine ions) through a series of heterogeneous chemical reactions, leading to the formation of atmospherically aged coarse particles [100,101,103,104]. These mechanisms in the coarse PM size range have also been observed by several previous studies, which have documented the formation of aged coarse PM due to the reactions of sulfuric and nitric acids with ambient coarse particles, leading to the production of calcium nitrate, sodium nitrate, magnesium nitrate, and sodium sulfate [24,103,104,105], which justifies the high loadings of Ca2+, Na+, Mg2+, Cl−, NO3−, and SO42− in the 3rd factor profile. Thus, this factor was labeled “atmospherically processed coarse PM” with the corresponding contribution of 7 ± 1% to the total coarse PM mass concentration. It should be noted that several previous studies have also identified a similar factor (i.e., aged aerosol) in the source apportionment of coarse PM [24,96,98,106]. For instance, Titos et al. [98] resolved an “aged regional” factor as a source of ambient coarse PM in Southeastern Spain, representing high loadings of SO42−, NO3−, Na+, and Cl− in the PMF-resolved factor profile.
As can be seen in the profile of factor 3, although Cu is not a chemical marker of aged aerosols, it has a relatively high (i.e., 30%) loading in this factor. The partial portioning of this species in the 3rd factor can be attributed to model artifacts, and does not reflect an actual loading of Cu in this factor. Analyzing the temporal trends of contributions of this factor also reveals comparable levels (p value = 0.80) during warm (2.8 ± 0.4 µg/m3) and cold (2.7 ± 0.2 µg/m3) seasons (Figure 7). The observed temporal trend for this factor can be explained by the comparable seasonal concentrations of Ca2+, marine ions (Na+, Mg2+, Cl−), NO3−, and SO42−, as the species with high loadings in this factor.
4. Summary and Conclusions
In this study we aimed to evaluate the temporal trends and major sources of ambient coarse PM mass concentrations in central Tehran. Our findings revealed higher coarse PM mass concentrations in the warm season (43.1 ± 6.1 µg/m3) as opposed to the cold season (28.7 ± 4.6 µg/m3) for Tohid retirement home; while similar trends were observed for warm (53.3 ± 5.8 µg/m3) and cold season (41.4 ± 4.7 µg/m3) coarse PM mass concentration in school dormitory. The PMF model resolved road dust, soil and industry, and atmospherically aged coarse PM as the three sources of ambient coarse PM in Tehran. Road dust was the dominant contributor (74 ± 9%) to ambient coarse PM mass concentration, followed by soil and industry (19 ± 2%), and atmospherically aged aerosols (7 ± 1%). Investigating the temporal trends for the resolved factors also indicated higher contributions of road dust and soil to total ambient coarse PM during warm season as a result of lower relative humidity, higher wind speed and, therefore, higher rate of dust resuspension in the warm season. Our findings have important public health implications, as we found high concentrations of several redox-active metals, including Cr, Cu, Mn, and Ni, in the ambient coarse PM collected in this study, which are known to be toxic and have the potential to induce cell inflammation, and subsequently, health effects. The results of this study also highlight the significance of non-tail pipe emissions and soil dust as major sources of ambient coarse PM in Tehran despite the widespread efforts and mitigation strategies for reducing tailpipe emissions during the past few years. Therefore, we recommend the application of chemical/mechanical mitigation techniques (e.g., water sprinkling, street cleaning, and chemical suppressants) that have proven effective for mitigating coarse PM concentrations by minimizing the resuspension of dust from paved and unpaved roadsides.
Supplementary Materials
The following are available online at https://www.mdpi.com/2073-4433/10/5/291/s1, Figure S1: Seasonal wind rose plots for cold and warm seasons. Figure S2: 4-factor PMF resolved profiles and their corresponding contributions to coarse PM. Table S1: Metrological parameters for central Tehran. Table S2: Concentration of species not used in PMF analysis.
Author Contributions
Conceptualization: S.T., A.M., M.H.S., M.Y., K.N. and C.S. Data curation: E.S., S.T. and M.S.H. Formal analysis: E.S., A.M. and M.H.S. Investigation: M.H.S. Methodology: E.S., S.T., A.M. and M.H.S. Resources: M.S.H. Software: E.S. Supervision: M.S.H., M.Y., K.N. and C.S. Validation: E.S., S.T., A.M., M.H.S., M.S.H., M.Y., K.N. and C.S. Visualization: E.S. and A.M. Writing—original draft: E.S., S.T., A.M. and M.H.S. Writing—review & editing: E.S., S.T., A.M., M.H.S., M.S.H., M.Y., K.N. and C.S.
Funding
This research was funded by Institute for Environmental Research (IER) of Tehran University of Medical Science, grant number 90-03-46-15705.
Acknowledgments
In this study, all of the experimental measurements and analysis were performed as part of the Health Effects of Air Pollution Panel Study (HEAPPS). We would also thank for the support from USC Viterbi School of Engineering’s PhD. fellowship award.
Conflicts of Interest
The authors of this paper declare that there is no conflict of interest. I am signing this letter on behalf of the other co-authors of this paper.
References
- Mannucci, P.M.; Franchini, M. Health effects of ambient air pollution in developing countries. Int. J. Environ. Res. Public Health 2017, 14, 1048. [Google Scholar] [CrossRef] [PubMed]
- Tsiouri, V.; Kakosimos, K.E.; Kumar, P. Concentrations, sources and exposure risks associated with particulate matter in the Middle East Area—a review. Air Qual. Atmos. Heal. 2015, 8, 67–80. [Google Scholar] [CrossRef]
- Kim, K.-H.; Kabir, E.; Kabir, S. A review on the human health impact of airborne particulate matter. Environ. Int. 2015, 74, 136–143. [Google Scholar] [CrossRef] [PubMed]
- Weichenthal, S. Selected physiological effects of ultrafine particles in acute cardiovascular morbidity. Environ. Res. 2012, 115, 26–36. [Google Scholar] [CrossRef]
- Jiménez, E.; Linares, C.; Rodríguez, L.F.; Bleda, M.J.; Díaz, J. Short-term impact of particulate matter (PM2.5) on daily mortality among the over-75 age group in Madrid (Spain). Sci. Total Environ. 2009, 407, 5486–5492. [Google Scholar] [CrossRef] [PubMed]
- Burnett, R.; Chen, H.; Szyszkowicz, M.; Fann, N.; Hubbell, B.; Pope, C.A.; Apte, J.S.; Brauer, M.; Cohen, A.; Weichenthal, S.; et al. Global estimates of mortality associated with long-term exposure to outdoor fine particulate matter. Proc. Natl. Acad. Sci. USA 2018, 115, 9592–9597. [Google Scholar] [CrossRef] [PubMed]
- Pan, Y.P.; Wang, Y.S.; Tang, G.Q.; Wu, D. Spatial distribution and temporal variations of atmospheric sulfur deposition in Northern China: Insights into the potential acidification risks. Atmos. Chem. Phys. 2013, 13, 1675–1688. [Google Scholar] [CrossRef]
- Wang, Q.; Liu, M.; Yu, Y.; Li, Y. Characterization and source apportionment of PM2.5-bound polycyclic aromatic hydrocarbons from Shanghai city, China. Environ. Pollut. 2016, 218, 118–128. [Google Scholar] [CrossRef] [PubMed]
- Zhao, H.; Che, H.; Ma, Y.; Xia, X.; Wang, Y.; Wang, P.; Wu, X. Temporal variability of the visibility, particulate matter mass concentration and aerosol optical properties over an urban site in Northeast China. Atmos. Res. 2015, 166, 204–212. [Google Scholar] [CrossRef]
- Chen, D.; Zhao, N.; Lang, J.; Zhou, Y.; Wang, X.; Li, Y.; Zhao, Y.; Guo, X. Contribution of ship emissions to the concentration of PM2.5: A comprehensive study using AIS data and WRF/Chem model in Bohai Rim Region, China. Sci. Total Environ. 2018, 610–611, 1476–1486. [Google Scholar] [CrossRef]
- Gugamsetty, B.; Wei, H.; Liu, C.N.; Awasthi, A.; Tsai, C.J.; Roam, G.D.; Wu, Y.C.; Chen, C.F. Source Characterization and Apportionment of PM10, PM2.5 and PM0.1 by Using Positive Matrix Factorization. Aerosol Air Qual. Res. 2012, 12, 476–491. [Google Scholar] [CrossRef]
- Crobeddu, B.; Aragao-Santiago, L.; Bui, L.C.; Boland, S.; Baeza Squiban, A. Oxidative potential of particulate matter 2.5 as predictive indicator of cellular stress. Environ. Pollut. 2017, 230, 125–133. [Google Scholar] [CrossRef]
- Zhang, X.; Staimer, N.; Tjoa, T.; Gillen, D.L.; Schauer, J.J.; Shafer, M.M.; Hasheminassab, S.; Pakbin, P.; Longhurst, J.; Sioutas, C.; et al. Associations between microvascular function and short-term exposure to traffic-related air pollution and particulate matter oxidative potential. Environ. Heal. 2016, 15, 81. [Google Scholar] [CrossRef]
- Brunekreef, B.; Forsberg, B. Epidemiological evidence of effects of coarse airborne particles on health. Eur. Respir. J. 2005, 26, 309–318. [Google Scholar] [CrossRef]
- Chen, Y.C.; Weng, Y.H.; Chiu, Y.W.; Yang, C.Y. Short-Term Effects of Coarse Particulate Matter on Hospital Admissions for Cardiovascular Diseases: A Case-Crossover Study in a Tropical City. J. Toxicol. Environ. Health 2015, 78, 1241–1253. [Google Scholar] [CrossRef]
- Ebisu, K.; Berman, J.D.; Bell, M.L. Exposure to coarse particulate matter during gestation and birth weight in the U.S. Environ. Int. 2016, 94, 519–524. [Google Scholar] [CrossRef] [PubMed]
- Shirmohammadi, F.; Hasheminassab, S.; Wang, D.; Saffari, A.; Schauer, J.J.; Shafer, M.M.; Delfino, R.J.; Sioutas, C. Oxidative potential of coarse particulate matter (PM10–2.5) and its relation to water solubility and sources of trace elements and metals in the Los Angeles Basin. Environ. Sci. Process. Impacts 2015, 17, 2110–2121. [Google Scholar] [CrossRef]
- Cheung, K.; Shafer, M.M.; Schauer, J.J.; Sioutas, C. Diurnal trends in oxidative potential of coarse particulate matter in the Los Angeles basin and their relation to sources and chemical composition. Environ. Sci. Technol. 2012, 46, 3779–3787. [Google Scholar] [CrossRef]
- Shen, H.; Anastasio, C. A comparison of hydroxyl radical and hydrogen peroxide generation in ambient particle extracts and laboratory metal solutions. Atmos. Environ. 2012, 46, 665–668. [Google Scholar] [CrossRef] [PubMed]
- Mousavi, A.; Sowlat, M.H.; Sioutas, C. Diurnal and seasonal trends and source apportionment of redox-active metals in Los Angeles using a novel online metal monitor and Positive Matrix Factorization (PMF). Atmos. Environ. 2018, 174, 15–24. [Google Scholar] [CrossRef]
- Schoonen, M.A.A.; Cohn, C.A.; Roemer, E.; Laffers, R.; Simon, S.R.; O’Riordan, T. Mineral-Induced Formation of Reactive Oxygen Species. Rev. Mineral. Geochem. 2006, 64, 179–221. [Google Scholar] [CrossRef]
- Tian, S.L.; Pan, Y.P.; Wang, Y.S. Size-resolved source apportionment of particulate matter in urban Beijing during haze and non-haze episodes. Atmos. Chem. Phys. 2016, 16, 1–19. [Google Scholar] [CrossRef]
- Cheng, Y.; Lee, S.; Gu, Z.; Ho, K.; Zhang, Y.; Huang, Y.; Chow, J.C.; Watson, J.G.; Cao, J.; Zhang, R. PM2.5 and PM10-2.5 chemical composition and source apportionment near a Hong Kong roadway. Particuology 2013, 18, 96–104. [Google Scholar] [CrossRef]
- Crilley, L.R.; Lucarelli, F.; Bloss, W.J.; Harrison, R.M.; Beddows, D.C.; Calzolai, G.; Nava, S.; Valli, G.; Bernardoni, V.; Vecchi, R. Source apportionment of fine and coarse particles at a roadside and urban background site in London during the 2012 summer ClearfLo campaign. Environ. Pollut. 2017, 220, 766–778. [Google Scholar] [CrossRef] [PubMed]
- Minguillón, M.C.; Querol, X.; Baltensperger, U.; Prévôt, A.S.H. Fine and coarse PM composition and sources in rural and urban sites in Switzerland: Local or regional pollution? Sci. Total Environ. 2012, 427–428, 191–202. [Google Scholar] [CrossRef] [PubMed]
- Rodríguez, S.; Querol, X.; Alastuey, A.; Kallos, G.; Kakaliagou, O. Saharan dust contributions to PM10 and TSP levels in Southern and Eastern Spain. Atmos. Environ. 2001, 35, 2433–2447. [Google Scholar] [CrossRef]
- Almeida, S.M.; Pio, C.A.; Freitas, M.C.; Reis, M.A.; Trancoso, M.A. Source apportionment of fine and coarse particulate matter in a sub-urban area at the Western European Coast. Atmos. Environ. 2005, 39, 3127–3138. [Google Scholar] [CrossRef]
- Amato, F.; Querol, X.; Johansson, C.; Nagl, C.; Alastuey, A. A review on the effectiveness of street sweeping, washing and dust suppressants as urban PM control methods. Sci. Total Environ. 2010, 408, 3070–3084. [Google Scholar] [CrossRef]
- Liu, S.; Triantis, K.; Zhang, L. The Design of an Urban Roadside Automatic Sprinkling System: Mitigation of PM2.5-10 in Ambient Air in Megacities. Chinese J. Eng. 2014, 12, 29–34. [Google Scholar] [CrossRef]
- Prostański, D. Use of Air-and-Water Spraying Systems for Improving Dust Control in Mines. J. Sustain. Min. 2013, 12, 29–34. [Google Scholar] [CrossRef]
- Norman, M.; Johansson, C. Studies of some measures to reduce road dust emissions from paved roads in Scandinavia. Atmos. Environ. 2006, 40, 6154–6164. [Google Scholar] [CrossRef]
- Gillies, J.A.; Watson, J.G.; Rogers, C.F.; Dubois, D.; Chow, J.C.; Langston, R.; Sweet, J. Long-term efficiencies of dust suppressants to reduce PM10 emissions from unpaved roads. J. Air Waste Manag. Assoc. 1999, 49, 3–16. [Google Scholar] [CrossRef]
- Amato, F.; Querol, X.; Alastuey, A.; Pandolfi, M.; Moreno, T.; Gracia, J.; Rodriguez, P. Evaluating urban PM10 pollution benefit induced by street cleaning activities. Atmos. Environ. 2009, 43, 4472–4480. [Google Scholar] [CrossRef]
- Chang, Y.M.; Chou, C.M.; Su, K.T.; Tseng, C.H. Effectiveness of street sweeping and washing for controlling ambient TSP. Atmos. Environ. 2005, 39, 1891–1902. [Google Scholar] [CrossRef]
- Gromaire, M.; Garnaud, S.; Ahyerre, M.; Chebbo, G. The quality of street cleaning waters: Comparison with dry and wet weather flows in a Parisian combined sewer system. Urban Water 2003, 2, 39–46. [Google Scholar] [CrossRef]
- Iran Census Selected Findings of the 2016 National Population and Housing Census. Statistical Centre of Iran Web Site. 2016. Available online: www.amar.org.ir/english/Population-and-Housing-Censuses (accessed on 24 May 2019).
- Kamali, N.; Zare Shahne, M.; Arhami, M. Implementing Spectral Decomposition of Time Series Data in Artificial Neural Networks to Predict Air Pollutant Concentrations. Environ. Eng. Sci. 2015, 32, 379–388. [Google Scholar] [CrossRef]
- Hosseini, V.; Shahbazi, H. Urban Air Pollution in Iran. Iran. Stud. 2016, 49, 1029–1046. [Google Scholar] [CrossRef]
- Shahbazi, H.; Reyhanian, M.; Hosseini, V.; Afshin, H. The Relative Contributions of Mobile Sources to Air Pollutant Emissions in Tehran, Iran: An Emission Inventory Approach. Emiss. Control Sci. Technol. 2016, 2, 44–56. [Google Scholar] [CrossRef]
- Zanchi, A.; Berra, F.; Mattei, M.; Ghassemi, M.R.; Sabouri, J. Inversion tectonics in central Alborz, Iran. J. Struct. Geol. 2006, 28, 2023–2037. [Google Scholar] [CrossRef]
- Atash, F. The deterioration of urban environments in developing countries: Mitigating the air pollution crisis in Tehran, Iran. Cities 2007, 24, 399–409. [Google Scholar] [CrossRef]
- AQCC Air Quality Control Company. [WWW Document]. URL. 2013. Available online: www.air.tehran.ir/Portals/0/EkadWebsiteResources/News/attachments/14867-Tehran_WEB_updated.pdf (accessed on 24 May 2019).
- Alizadeh-Choobari, O.; Bidokhti, A.A.; Ghafarian, P.; Najafi, M.S. Temporal and spatial variations of particulate matter and gaseous pollutants in the urban area of Tehran. Atmos. Environ. 2016, 141, 443–453. [Google Scholar] [CrossRef]
- Naddafi, K.; Hassanvand, M.S.; Yunesian, M.; Momeniha, F.; Nabizadeh, R.; Faridi, S.; Gholampour, A. Health impact assessment of air pollution in megacity of Tehran, Iran. Iran. J. Environ. Heal. Sci. Eng. 2012, 9, 28. [Google Scholar] [CrossRef] [PubMed]
- Shahbazi, H.; Taghvaee, S.; Hosseini, V.; Afshin, H. A GIS based emission inventory development for Tehran. Urban Clim. 2016, 17, 216–229. [Google Scholar] [CrossRef]
- Taghvaee, S.; Sowlat, M.H.; Mousavi, A.; Hassanvand, M.S.; Yunesian, M.; Naddafi, K.; Sioutas, C. Source apportionment of ambient PM2.5 in two locations in central Tehran using the Positive Matrix Factorization (PMF) model. Sci. Total Environ. 2018, 628–629, 672–686. [Google Scholar] [CrossRef] [PubMed]
- Arhami, M.; Zare Shahne, M.; Hosseini, V.; Roufigar Haghighat, N.; Lai, A.M.; Schauer, J.J. Seasonal trends in the composition and sources of PM2.5 and carbonaceous aerosol in Tehran, Iran. Environ. Pollut. 2018, 239, 69–81. [Google Scholar] [CrossRef]
- Arhami, M.; Hosseini, V.; Zare Shahne, M.; Bigdeli, M.; Lai, A.; Schauer, J.J. Seasonal trends, chemical speciation and source apportionment of fine PM in Tehran. Atmos. Environ. 2017, 153, 70–82. [Google Scholar] [CrossRef]
- Al Hanai, A.H.; Antkiewicz, D.S.; Hemming, J.D.C.; Shafer, M.M.; Lai, A.M.; Arhami, M.; Hosseini, V.; Schauer, J.J. Seasonal variations in the oxidative stress and inflammatory potential of PM2.5 in Tehran using an alveolar macrophage model; The role of chemical composition and sources. Environ. Int. 2019, 123, 417–427. [Google Scholar] [CrossRef] [PubMed]
- Taghvaee, S.; Sowlat, M.H.; Hassanvand, M.S.; Yunesian, M.; Naddafi, K.; Sioutas, C. Source-specific lung cancer risk assessment of ambient PM2.5-bound polycyclic aromatic hydrocarbons (PAHs) in central Tehran. Environ. Int. 2018, 120, 321–332. [Google Scholar] [CrossRef] [PubMed]
- Tan, J.H.; Duan, J.C.; Chai, F.H.; He, K.B.; Hao, J.M. Source apportionment of size segregated fine/ultrafine particle by PMF in Beijing. Atmos. Res. 2014, 139, 90–100. [Google Scholar] [CrossRef]
- Callén, M.S.; Iturmendi, A.; López, J.M. Source apportionment of atmospheric PM2.5-bound polycyclic aromatic hydrocarbons by a PMF receptor model. Assessment of potential risk for human health. Environ. Pollut. 2014, 195, 167–177. [Google Scholar] [CrossRef]
- Hopke, P.K. Review of receptor modeling methods for source apportionment. J. Air Waste Manag. Assoc. 2016, 66, 237–259. [Google Scholar] [CrossRef]
- Tecer, L.H.; Tuncel, G.; Karaca, F.; Alagha, O.; Süren, P.; Zararsiz, A.; Kırmaz, R. Metallic composition and source apportionment of fine and coarse particles using positive matrix factorization in the southern Black Sea atmosphere. Atmos. Res. 2012, 118, 153–169. [Google Scholar] [CrossRef]
- Hassanvand, M.S.; Naddafi, K.; Faridi, S.; Arhami, M.; Nabizadeh, R.; Sowlat, M.H.; Pourpak, Z.; Rastkari, N.; Momeniha, F.; Kashani, H.; et al. Indoor/outdoor relationships of PM10, PM2.5, and PM1 mass concentrations and their water-soluble ions in a retirement home and a school dormitory. Atmos. Environ. 2014, 82, 375–382. [Google Scholar] [CrossRef]
- Hassanvand, M.S.; Naddafi, K.; Faridi, S.; Nabizadeh, R.; Sowlat, M.H.; Momeniha, F.; Gholampour, A.; Arhami, M.; Kashani, H.; Zare, A.; et al. Characterization of PAHs and metals in indoor/outdoor PM10/PM2.5/PM1 in a retirement home and a school dormitory. Sci. Total Environ. 2015, 527–528, 100–110. [Google Scholar] [CrossRef] [PubMed]
- Environmental Lakes. WRPLOT View Version 7.0: Wind Rose Plots for Meteorological Data. Available online: www.weblakes.com (accessed on 24 May 2019).
- Masiol, M.; Hopke, P.K.; Felton, H.D.; Frank, B.P.; Rattigan, O.V.; Wurth, M.J.; LaDuke, G.H. Source apportionment of PM2.5 chemically speciated mass and particle number concentrations in New York City. Atmos. Environ. 2017, 148, 215–229. [Google Scholar] [CrossRef]
- Sowlat, M.H.; Hasheminassab, S.; Sioutas, C. Source apportionment of ambient particle number concentrations in central Los Angeles using positive matrix factorization (PMF). Atmos. Chem. Phys. 2016, 16, 4849–4866. [Google Scholar] [CrossRef]
- Wang, G.; Gu, S.J.; Chen, J.; Wu, X.; Yu, J. Assessment of health and economic effects by PM2.5 pollution in Beijing: A combined exposure–response and computable general equilibrium analysis. Environ. Technol. 2016, 37, 3131–3138. [Google Scholar] [CrossRef] [PubMed]
- Chen, P.; Li, C.; Kang, S.; Yan, F.; Zhang, Q.; Ji, Z.; Tripathee, L.; Rupakheti, D.; Rupakheti, M.; Qu, B.; et al. Source apportionment of particle-bound polycyclic aromatic hydrocarbons in Lumbini, Nepal by using the positive matrix factorization receptor model. Atmos. Res. 2016, 182, 46–53. [Google Scholar] [CrossRef]
- Paatero, P.; Tapper, U. Positive matrix factorization: A non-negative factor model with optimal utilization of error estimates of data values. Environmetrics 1994, 5, 111–126. [Google Scholar] [CrossRef]
- Paatero, P. Least squares formulation of robust non-negative factor analysis. Chemom. Intell. Lab. Syst. 1997, 37, 23–35. [Google Scholar] [CrossRef]
- Paatero, P.; Eberly, S.; Brown, S.G.; Norris, G.A. Methods for estimating uncertainty in factor analytic solutions. Atmos. Meas. Tech. 2014, 7, 781–797. [Google Scholar] [CrossRef]
- Reff, A.; Eberly, S.I.; Bhave, P.V. Receptor modeling of ambient particulate matter data using positive matrix factorization: Review of existing methods. J. Air Waste Manag. Assoc. 2007, 57, 146–154. [Google Scholar] [CrossRef] [PubMed]
- Norris, G.; Duvall, R.; Brown, S.; Bai, S. EPA Positive M Atrix Factorization (PMF) 5.0 Fundamentals and User Guide. 2014. Available online: www.epa.gov/sites/production/files/2015-02/documents/pmf_5.0_user_guide.pdf (accessed on 24 May 2019).
- Ito, K.; Xue, N.; Thurston, G. Spatial variation of PM2.5 chemical species and source-apportioned mass concentrations in New York City. Atmos. Environ. 2004, 38, 5269–5282. [Google Scholar] [CrossRef]
- Harrison, R.M.; Hester, R.E. Air pollution and health; Royal Society of Chemistry: London, UK, 2007. [Google Scholar]
- Brown, S.G.; Eberly, S.; Paatero, P.; Norris, G.A. Methods for estimating uncertainty in PMF solutions: Examples with ambient air and water quality data and guidance on reporting PMF results. Sci. Total Environ. 2015, 518–519, 626–635. [Google Scholar] [CrossRef] [PubMed]
- WHO. WHO Global Urban Ambient Air Pollution Database. 2018. Available online: www.who.int/airpollution/data/cities/en/ (accessed on 24 May 2019).
- Jalava, P.I.; Happo, M.S.; Huttunen, K.; Sillanpää, M.; Hillamo, R.; Salonen, R.O.; Hirvonen, M.-R. Chemical and microbial components of urban air PM cause seasonal variation of toxicological activity. Environ. Toxicol. Pharmacol. 2015, 40, 375–387. [Google Scholar] [CrossRef]
- Lim, C.C.; Thurston, G.D.; Shamy, M.; Alghamdi, M.; Khoder, M.; Mohorjy, A.M.; Alkhalaf, A.K.; Brocato, J.; Chen, L.C.; Costa, M. Temporal variations of fine and coarse particulate matter sources in Jeddah, Saudi Arabia. J. Air Waste Manag. Assoc. 2018, 68, 123–138. [Google Scholar] [CrossRef]
- Almeida, S.M.; Pio, C.A.; Freitas, M.C.; Reis, M.A.; Trancoso, M.A. Source apportionment of atmospheric urban aerosol based on weekdays/weekend variability: Evaluation of road re-suspended dust contribution. Atmos. Environ. 2006, 40, 2058–2067. [Google Scholar] [CrossRef]
- Harrison, R.M.; Jones, A.M.; Gietl, J.; Yin, J.; Green, D.C. Estimation of the contributions of brake dust, tire wear, and resuspension to nonexhaust traffic particles derived from atmospheric measurements. Environ. Sci. Technol. 2012, 46, 6523–6529. [Google Scholar] [CrossRef]
- Cardoso, J.; Almeida, S.M.; Nunes, T.; Almeida-Silva, M.; Cerqueira, M.; Alves, C.; Rocha, F.; Chaves, P.; Reis, M.; Salvador, P.; et al. Source apportionment of atmospheric aerosol in a marine dusty environment by ionic/composition mass balance (IMB). Atmos. Chem. Phys. 2018, 18, 13215–13230. [Google Scholar] [CrossRef]
- Laidlaw, M.A.S.; Filippelli, G.M. Resuspension of urban soils as a persistent source of lead poisoning in children: A review and new directions. Appl. Geochemistry 2008, 23, 2021–2039. [Google Scholar] [CrossRef]
- Dall’Osto, M.; Booth, M.J.; Smith, W.; Fisher, R.; Harrison, R.M. A study of the size distributions and the chemical characterization of airborne particles in the vicinity of a large integrated steelworks. Aerosol Sci. Technol. 2008, 42, 981–991. [Google Scholar] [CrossRef]
- Pant, P.; Harrison, R.M. Estimation of the contribution of road traffic emissions to particulate matter concentrations from field measurements: A review. Atmos. Environ. 2013, 77, 78–97. [Google Scholar] [CrossRef]
- Galindo, N.; Yubero, E.; Nicolás, J.F.; Varea, M.; Crespo, J. Characterization of metals in PM1 and PM10 and health risk evaluation at an urban site in the western Mediterranean. Chemosphere 2018, 201, 243–250. [Google Scholar] [CrossRef] [PubMed]
- Alharbi, B.; Shareef, M.M.; Husain, T. Study of chemical characteristics of particulate matter concentrations in Riyadh, Saudi Arabia. Atmos. Pollut. Res. 2015, 6, 88–98. [Google Scholar] [CrossRef]
- Yatkin, S.; Bayram, A. Elemental composition and sources of particulate matter in the ambient air of a Metropolitan City. Atmos. Res. 2007, 85, 126–139. [Google Scholar] [CrossRef]
- Lee, C.S.L.; Li, X.D.; Zhang, G.; Li, J.; Ding, A.J.; Wang, T. Heavy metals and Pb isotopic composition of aerosols in urban and suburban areas of Hong Kong and Guangzhou, South China-Evidence of the long-range transport of air contaminants. Atmos. Environ. 2007, 41, 432–447. [Google Scholar] [CrossRef]
- López, J.M.; Callén, M.S.; Murillo, R.; Garcia, T.; Navarro, M.V.; De la Cruz, M.T.; Mastral, A.M. Levels of selected metals in ambient air PM10 in an urban site of Zaragoza (Spain). Environ. Res. 2005, 99, 58–67. [Google Scholar] [CrossRef]
- Pekey, B.; Bozkurt, Z.B.; Pekey, H.; Doĝan, G.; Zararsiz, A.; Efe, N.; Tuncel, G. Indoor/outdoor concentrations and elemental composition of PM10/PM2.5 in urban/industrial areas of Kocaeli City, Turkey. Indoor Air 2010, 20, 112–125. [Google Scholar] [CrossRef]
- Karar, K.; Gupta, A.K. Seasonal variations and chemical characterization of ambient PM10 at residential and industrial sites of an urban region of Kolkata (Calcutta), India. Atmos. Res. 2006, 81, 36–53. [Google Scholar] [CrossRef]
- Risher, J. Toxicological Profile for Selenium (Update); DIANE Publishing: Collingdale, PA, USA, 2011. [Google Scholar]
- Lim, J.M.; Lee, J.H.; Moon, J.H.; Chung, Y.S.; Kim, K.H. Source apportionment of PM10 at a small industrial area using Positive Matrix Factorization. Atmos. Res. 2010, 95, 88–100. [Google Scholar] [CrossRef]
- Norris, G.; Vedantham, R.; Wade, K.; Brown, S.; Prouty, J.; Foley, C. EPA Positive Matrix Factorization (PMF) 3.0 Fundamentals & User Guide. 2008. Available online: www.nepis.epa.gov/Exe/ZyPURL.cgi?Dockey=P100GDUM.TXT (accessed on 24 May 2019).
- Penkała, M.; Ogrodnik, P.; Rogula-Kozłowska, W. Particulate Matter from the Road Surface Abrasion as a Problem of Non-Exhaust Emission Control. Environments 2018, 5, 9. [Google Scholar] [CrossRef]
- Kwak, J.H.; Kim, H.; Lee, J.; Lee, S. Characterization of non-exhaust coarse and fine particles from on-road driving and laboratory measurements. Sci. Total Environ. 2013, 458–460, 273–282. [Google Scholar] [CrossRef]
- Hasheminassab, S.; Daher, N.; Schauer, J.J.; Sioutas, C. Source apportionment and organic compound characterization of ambient ultrafine particulate matter (PM) in the Los Angeles Basin. Atmos. Environ. 2013, 79, 529–539. [Google Scholar] [CrossRef]
- Branis, M.; Safranek, J. Characterization of coarse particulate matter in school gyms. Environ. Res. 2011, 111, 485–491. [Google Scholar] [CrossRef] [PubMed]
- Charron, A.; Harrison, R.M. Fine (PM2.5) and Coarse (PM2.5-10) Particulate Matter on A Heavily Trafficked London Highway: Sources and Processes. Environ. Sci. Technol. 2005, 39, 7768–7776. [Google Scholar] [CrossRef] [PubMed]
- Harrison, R.M.; Yin, J.; Mark, D.; Stedman, J.; Appleby, R.S.; Booker, J.; Moorcroft, S. Studies of the coarse particle (2.5-10μm) component in UK urban atmospheres. Atmos. Environ. 2001, 35, 3667–3679. [Google Scholar] [CrossRef]
- Kalaiarasan, G.; Balakrishnan, R.M.; Sethunath, N.A.; Manoharan, S. Source apportionment studies on particulate matter (PM10 and PM2.5) in ambient air of urban Mangalore, India. J. Environ. Manag. 2018, 217, 815–824. [Google Scholar] [CrossRef]
- Grivas, G.; Cheristanidis, S.; Chaloulakou, A.; Koutrakis, P.; Mihalopoulos, N. Elemental Composition and Source Apportionment of Fine and Coarse Particles at Traffic and Urban Background Locations in Athens, Greece. Aerosol Air Qual. Res. 2018, 18, 1642–1659. [Google Scholar] [CrossRef]
- Klejnowski, K.; Pastuszka, J.S.; Rogula-Kozłowska, W.; Talik, E.; Krasa, A. Mass size distribution and chemical composition of the surface layer of summer and winter airborne particles in Zabrze, Poland. Bull. Environ. Contam. Toxicol. 2012, 88, 255–259. [Google Scholar] [CrossRef]
- Titos, G.; Lyamani, H.; Pandolfi, M.; Alastuey, A.; Alados-Arboledas, L. Identification of fine (PM1) and coarse (PM10-1) sources of particulate matter in an urban environment. Atmos. Environ. 2014, 89, 593–602. [Google Scholar] [CrossRef]
- Srivastava, A.; Jain, V.K. Seasonal trends in coarse and fine particle sources in Delhi by the chemical mass balance receptor model. J. Hazard. Mater. 2007, 144, 283–291. [Google Scholar]
- Seinfeld, H.H.; Pandis, S.N. Atmosphere Chemistry and Physics: From Air Pollution to Climate Change; John Wiley & Sons: Hoboken, NJ, USA, 2016. [Google Scholar]
- Kouyoumdjian, H.; Saliba, N.A. Mass concentration and ion composition of coarse and fine particles in an urban area in Beirut: Effect of calcium carbonate on the absorption of nitric and sulfuric acids and the depletion of chloride. Atmos. Chem. Phys. 2006, 6, 1865–1877. [Google Scholar] [CrossRef]
- Pathak, R.K.; Louie, P.K.K.; Chan, C.K. Characteristics of aerosol acidity in Hong Kong. Atmos. Environ. 2004, 38, 2965–2974. [Google Scholar] [CrossRef]
- Querol, X.; Alastuey, A.; De La Rosa, J.; Sánchez-De-La-Campa, A.; Plana, F.; Ruiz, C.R. Source apportionment analysis of atmospheric particulates in an industrialised urban site in southwestern Spain. Atmos. Environ. 2002, 36, 3113–3125. [Google Scholar] [CrossRef]
- Querol, X.; Alastuey, A.; Rodriguez, S.; Plana, F.; Ruiz, C.R.; Cots, N.; Massagué, G.; Puig, O. PM10 and PM2.5 source apportionment in the Barcelona Metropolitan area, Catalonia, Spain. Atmos. Environ. 2001, 35, 6407–6419. [Google Scholar]
- Rodríguez, S.; Alastuey, A.; Alonso-Pérez, S.; Querol, X.; Cuevas, E.; Abreu-Afonso, J.; Viana, M.; Pérez, N.; Pandolfi, M.; De La Rosa, J. Transport of desert dust mixed with North African industrial pollutants in the subtropical Saharan Air Layer. Atmos. Chem. Phys. 2011, 11, 6663–6685. [Google Scholar] [CrossRef]
- Wang, H.; David, S. Source apportionment of fine and coarse atmospheric particles in Auckland, New Zealand. Sci. Total Environ. 2005, 340, 189–198. [Google Scholar] [CrossRef]


© 2019 by the authors. Licensee MDPI, Basel, Switzerland. This article is an open access article distributed under the terms and conditions of the Creative Commons Attribution (CC BY) license (http://creativecommons.org/licenses/by/4.0/).