Article

Sources and Geographical Origins of PM10 in Metz (France) Using Oxalate as a Marker of Secondary Organic Aerosols by Positive Matrix Factorization Analysis

1
Atmo Grand-Est, 5 rue de Madrid, 67300 Schiltigheim, France
2
Laboratoire des Sciences du Climat et l’Environnement, CEA/Orme des Merisiers, 91191 Gif-sur-Yvette, France
3
Institut National de l’Environnement Industriel et des Risques (INERIS), 60550 Verneuil-en-Halatte, France
4
Laboratoire Central de Surveillance de la Qualité de l’Air (LCSQA), 60550 Verneuil-en-Halatte, France
5
Département Sciences de l’Atmosphère et Génie de l’Environnement-SAGE, IMT Lille Douai, Université de Lille, 59000 Lille, France
*
Author to whom correspondence should be addressed.
Atmosphere 2019, 10(7), 370; https://doi.org/10.3390/atmos10070370
Submission received: 31 May 2019 / Revised: 24 June 2019 / Accepted: 1 July 2019 / Published: 3 July 2019
(This article belongs to the Special Issue Air Quality and Sources Apportionment)

Abstract

:
An original source apportionment study was conducted on atmospheric particles (PM10) collected in Metz, one of the largest cities of Eastern France. A Positive matrix factorization (PMF) analysis was applied to a sampling filter-based chemical dataset obtained for the April 2015 to January 2017 period. Nine factors were clearly identified, showing mainly contributions from anthropogenic sources of primary PM (19.2% and 16.1% for traffic and biomass burning, respectively) as well as secondary aerosols (12.3%, 14.5%, 21.8% for sulfate-, nitrate-, and oxalate-rich factors, respectively). Wood-burning aerosols exhibited strong temporal variations and contributed up to 30% of the PM mass fraction during winter, while primary traffic concentrations remained relatively constant throughout the year. These two sources are also the main contributors during observed PM10 pollution episodes. Furthermore, the dominance of the oxalate-rich factor among other secondary aerosol factors underlines the role of atmospheric processing to secondary organic aerosol loadings which are still poorly characterized in this region. Finally, Concentration-Weighted Trajectory (CWT) analysis were performed to investigate the geographical origins of the apportioned sources, notably illustrating a significant transport of both nitrate-rich and sulfate-rich factors from Northeastern Europe but also from the Balkan region.

1. Introduction

Atmospheric particulate matter (PM) has become over the years a major concern for our modern societies. Indeed, aerosol pollution can be associated with substantiated health effects (e.g., Reference [1]), such as the development of pulmonary or cardiovascular diseases [2,3,4]. These sanitary impacts are exacerbated in urban areas, and recent epidemiological projections report an increase of premature mortality, linked to growing urbanization and exposure to a large variety of emission sources [5]. In this context, the World Health Organization State Members have recently recommended to limit the number of premature deaths related to air pollution. Achieving this goal is closely linked to the identification of effective levers towards a better air quality, which is related to a comprehensive knowledge of the various pollution sources and their geographical origins.
During the past decade, the development of receptor models, especially Positive Matrix Factorization (PMF, [6]), has enabled the identification and quantification of PM pollution sources in many locations and different site typologies worldwide (e.g., References [7,8]). They have recently been proven to provide statistically robust outputs for the major pollution sources, and therefore essential information towards improved air quality management [9]. However, the large spatial variability observed in terms of source distribution highlights the need of a spatially-resolved knowledge of PM pollution sources. Moreover, PMF filter-based analyses have been commonly conducted using datasets which include major chemical species, such as Organic Carbon (OC), Elemental Carbon (EC), water-soluble inorganics, and metals, but only a few organic molecular markers. This makes it difficult to directly link the obtained PMF factors with different organic aerosol (OA) sources and/or (trans-)formation processes leading to secondary organic aerosol (SOA), which may represent up to 40–50% of the PM mass in some areas (e.g., Reference [10]). Recently, a growing number of studies are proposing the use of additional markers to better identify and quantify various primary OA sources, such as fungal spores or plant debris, and/or different SOA fractions [8,11,12,13]. In the present study, we notably attempted to use oxalate as a generic marker for SOA. Indeed, as one of the end-product of atmospheric aging mechanisms, oxalic acid is the most abundant dicarboxylic acid in the atmosphere [14]. It is also known as a marker of in-cloud processing [15], which represents crucial information regarding SOA and cloud condensation nuclei formation processes [16].
Although France is the second most populated country in Europe and regularly exposed to persistent pollution episodes, source apportionment studies were still scarce until recently. Nevertheless, a harmonized receptor model program conducted at the national level (so-called SOURCES project) provided a first glimpse of the spatial distribution of PM10 sources in different French urban areas, based on 15 chemically-resolved datasets obtained in the last six years [17]. Primary anthropogenic sources such as traffic and wood-burning were commonly identified, respectively contributing to 15 and 16% of PM10 on average, with a significant spatial variability. Secondary pollution, notably ammonium nitrate and sulfate, was found to be the main contributor to PM10, with however, high SOA contribution emphasized in these factors. Previous source apportionment studies in Paris (e.g., Reference [18]) and Lens [11] have also highlighted the role of transboundary advection from Eastern Europe. Moreover, studying pollution episodes in Paris, [19] have very recently stated that emissions from the East of France may substantially influence, during pollution events, the air quality in Paris. Inversely, Paris region emissions may also significantly influence the air quality in Eastern France during high pressure systems (with predominant western winds). This region of France is also close to the Rhur Valley, one of the most industrialized regions of Western Europe. Eastern France, and especially the Lorraine area, is then at a critical crossroads in order to comprehensively characterize PM sources in Western Europe.
In this context, the present study aims at identifying and quantifying the sources of PM10 in the urban background of Metz, the most populated metropolitan area in Lorraine. Chemical analyses were carried out on daily filter samples collected every three days over an 18-month period. The PMF receptor model has subsequently been used to apportion PM10 mass fractions into different sources. In addition, air mass trajectory analyses gave first insights into the geographical origins of the identified sources.

2. Materials and Methods

2.1. Measurement Site and Instrumentation

The Greater urban area of Metz (49.22° N, 6.11° E) has a total population of over 400,000 inhabitants. It is influenced by a temperate oceanic climate (Cfb), following Köppen–Geiger classification [20]. However, colder mean temperatures (by 1 or 2 degrees) are generally observed in winter compared to the Paris region, 300 km west of Metz. Dispersion conditions are also less favorable, due to the topography of the area, since Metz is located within the Moselle valley.
Twenty-four-hour high-volume sampling (DA-80, Digitel, Volketswil, Switzerland) of PM10 particles was carried out every third day from April 2015 to January 2017 in a sampling station representative of urban background pollution of the metropolitan area of Metz, being part of the regional monitoring network of Atmo Grand-Est (www.atmo-grandest.eu). The PM10 sizecut was chosen mainly to fit the European regulation, largely based on this fraction. Quartz filters of 150-mm diameter (Pall-Gelmann 2500 QAT-UP) were pre-heated at 500 °C for 12 h before exposure to limit the contamination of adsorbed volatile organic compounds. After sampling, filters were stored at −20 °C until one punch of 1.5 cm2 and two punches of 17.35 cm2 were sampled respectively for the analysis of Organic and Elemental Carbon, anions/cations and sugars, and metallic elements. In details, Elemental Carbon (EC) and Organic Carbon (OC) were determined by thermo-optical transmission (Sunset Lab, [21]), with the EUSAAR-2 protocol [22]. Water-soluble cations (Na+, NH4+, K+, Mg2+, Ca2+) and anions (methylsulfonic acid (MSA), oxalate, Cl, NO3, SO42−) were analyzed by ionic chromatography [23]. Concentrations of sugar anhydrides (levoglucosan, mannosan, galactosan) and alcohols (arabitol, mannitol, glucose, mannose) were determined by ionic chromatography equipped with a pulsed-amperometric detector [24]. Finally, two major (Al and Fe) and seventeen trace elements (As, Cd, Ce, Cs, Cu, La, Li, Mn, Pb, Rb, Se, Sb, Sn, Th, U, Zn and V) were analyzed after total acid digestion (HNO3/H2O2) in a microwave oven at 220 °C, by ICP-MS (NexIon 300x, Perkin Elmer), as detailed in [25].

2.2. Source Apportionment

In order to apportion the sources of PM10 in Metz, Positive Matrix Factorization has been applied to the chemically-resolved dataset. PMF can be summarized in the deconvolution of an input data matrix X into chemical profiles G and temporal contributions F:
X = G · F + E
where E is the residual matrix.
Uncertainties associated with each sample and each compound were calculated following the methodology proposed by References [11,26].
σ ij = { ( u j · x ij ) 2 + ( LoD j ) 2 + ( x ij · a j ) 2   if   x ij > LoD j 5 6 · LoD j   if   x ij LoD j 4 · Geo . Mean   if   missing   data
where xij is the concentration of specie j at ti; LODj the limit of detection of specie j; uj, the extented uncertainty for specie j; and aj, an additional error coefficient for each jth specie. Missing concentrations were replaced with the median value, and their corresponding uncertainties calculated with the geometric mean, multiplied by 4. The authors of Reference [17] have determined optimized aj values depending on the analytical procedure for each compound, and these are summarized in Table 1. The same values were applied because the same analytical procedures were used. The classification of “weak” and “bad” variables was based on signal-to-noise ratios, provided by the software; their calculation differs from EPA PMF v3 (Environmental Protection Agency, Durham, NC, USA), as it handles data below uncertainty more robustly. PM10 was used as the total variable. OC*, used as input data, refers to OC concentrations subtracted by the carbon concentration of all organic markers (in ngC/m3) of the database.
EPA PMF v5.0 software package was used to control the PMF algorithm. Scaled residuals were found to be most well-shaped (centered around 0 between ±4) for the 9-factor solution. The 8-factor solution consists in a mixing of an oxalate and ammonium sulfate-dominated factor. Although bootstrapping exhibited satisfactory results, indicating a good stability, these 2 factors should have specific temporal variabilities as well as geographical origins. That is why the 9-factor solution is believed to have a higher atmospheric relevance, including the following sources: primary traffic, wood-burning, nitrate-rich, sulfate-rich, oxalate-rich, secondary sea salt, dust, primary biogenic and secondary marine biogenic aerosols.
In order to explore rotational ambiguities, a minimum number of soft pulling equations were implemented. For instance, since (i) levoglucosan and its isomers are specific tracers of biomass burning [27], and (ii) only one factor is related to this source; the contribution of this factor to levoglucosan and mannosan was pulled up maximally (dQ = 0.5%). This resulted in consistent timeseries (Table S1), but more specific profiles, as the contribution of biomass burning to levoglucosan logically increased from 78% to 99% (Table 2). Similar constraints on arabitol (for primary biogenic aerosols, dQ = 0.5%) and MSA (for secondary marine biogenic aerosols, dQ = 0.5%) have provided more specificity to the corresponding sources. Moreover, these soft constraints have unambiguously increased the stability of the solution. Indeed, mapping results of bootstrap analysis have clearly improved with the applied constraints, as all factors were correctly mapped at least 94 times out of 100 runs, instead of 79 out of 100 runs for the unconstrained bootstrap (Table S2).
Co-located multi-wavelength Aethalometer (AE33 model, Magee Scientific, Ljubjana, Slovenia) data was also available, providing complementary information on carbonaceous aerosols sources. The AE33 measurement principle is fully described in [28]. Briefly, light attenuation caused by particle accumulation onto a filter tape is determined at seven wavelengths (370, 470, 520, 590, 660, 880 and 950 nm). This advanced Aethalometer version allows automatic compensation of the filter-loading effect using two simultaneous samplings at different flowrates. The mass concentration of equivalent black carbon (eBC) is also estimated from absorption coefficient at 880 nm. It is further discriminated between its two main combustion sources, i.e., fossil fuel combustion (eBCff) and biomass burning emissions (eBCbb) using light absorption coefficient at 470 and 950 nm, and default Angström absorption exponents respectively of 1 (αff) and 2 (αbb) [29]. In this study, a correction factor of 1.64 was applied, as recommended within the ACTRIS infrastructure.
Based on this AE33 dataset and filter-based offline OC/EC measurements, we also applied a source apportionment approach to carbonaceous material (CM), where total CM (CMtotal) could be primarily considered as the sum of brown carbon containing material (CMbb), non-brown carbon containing material originating from fossil fuel combustion (CMff) and non-combustion OA (CMnon-comb.), as follows:
CM total = EC + OM = CM ff + CM bb + CM non   comb .
where CM ff = C 1 · b abs ,   ff ,   950 nm and CM bb = C 2 · b abs ,   bb ,   470 nm
babs, ff, 950nm and babs, bb, 470nm respectively represents the absorption coefficient of CMff at 950 nm, and CMbb at 470 nm; C1 and C2 relate to the light absorption of the particulate mass of both sources. This CM source apportionment model was applied following the procedures fully described in References [29,30]. Importantly, CMnon-comb. is considered to only contain organic matter, so that CMnon-comb. = OMnon-comb..
Finally, OMnon-comb. could also be determined using the so-called EC-tracer method [8]. The main advantage of this method is to use only OC and EC measurements. In this approach, EC and primary OC are hypothesized to be emitted by the same combustion sources, and EC is used as a tracer for primary OC related to those sources (OCprim-comb.), while measured OC/EC ratios depend on the contribution of combustion and non-combustion OC sources. By subtraction to total OC concentrations, known OC/EC ratios for fossil fuel and biomass burning allow the estimation of OC concentrations from non-combustion.
OC non-comb . = OC ( EC ff · [ OC EC ] ff + EC bb · [ OC EC ] bb )
where ECff and ECbb are calculated based on EC measurements, and eBCff-to-eBCbb ratio determined by the AE33, and [ OC EC ] ff and [ OC EC ] bb were set to 1.2 and 5, respectively [17,31]. These ratios may differ, sometimes significantly, from one site to another and also depending on the type of wood burnt, but Metz is relatively close to the areas of study of References [16,30]. These were purposefully set from the literature rather than from our PMF results, in order to have a strictly independent approach.

2.3. Geographical Origins

PMF time series were coupled with back trajectories through Concentration-Weighted Trajectory (CWT, [32]).
CWT ij = 1 τ ij · k = 1 N C k · τ ijk
where τijk is the residence time of trajectory k in each cell (i, j). 72-h back trajectories were calculated each 3 h from the HYSPLIT model [33], using 1° × 1° weekly Global Data Assimilation System (GDAS) files. An ending altitude of 100 m above ground level (agl) was chosen so that the back trajectories ended within the mixing layer. To increase the representativeness of daily measurements [34], each daily concentration value was associated to 8 back trajectories each day (0 h, 3 h, 6 h, 9 h, 12 h, 15 h, 18 h and 21 h). Wet deposition was estimated by “cutting” the trajectory where significant precipitation occurred (endpoint with associated rainfall higher than 1 mm/h). Similarly to the work of Reference [35], an altitude threshold was set at 2000 m agl.
To estimate uncertainties in the geographical position of the back trajectories, a Gaussian noise was implemented within the CWT analysis. It consisted of the release of 1000 “particles” at each trajectory endpoint with a normal distribution noise in both longitude and latitude dimensions. The width of this distribution was set to increase with time, at an empirical rate of 0.015/h (un = 0.015 n, u0 = 1), which allowed to simulate the decrease of performance of the model over time. Nevertheless, this estimation does not take the atmospheric turbulence at each endpoint into account, which may lead to an overestimation of the Gaussian width, especially towards the end of the back trajectories.
Given that the coupling between sources of local origins and back trajectories is ambiguous, CWT was applied to factors presenting a rather advected pattern. This selection was performed with a preliminary Non-parametric Wind Regression (NWR, [36]), detailed and presented in Figure S1. Designated local sources, i.e., primary traffic and wood burning, were not considered for the CWT analysis.
This entire work was performed with ZeFir v3.7 [34].

3. Results and Discussion

Figure 1 presents the chemical profiles of the nine factors identified by the constrained PMF analysis. From the results of the bootstrap analysis, concentrations are presented in terms of InterQuartile Range (IQR) distribution; the contribution of each factor to each specie is presented as the median value. In the following, each factor is classified as naturally-driven, primary combustion or secondary sources, and discussed for its chemical signature, timeseries and geographical origins.

3.1. Naturally-Driven Sources

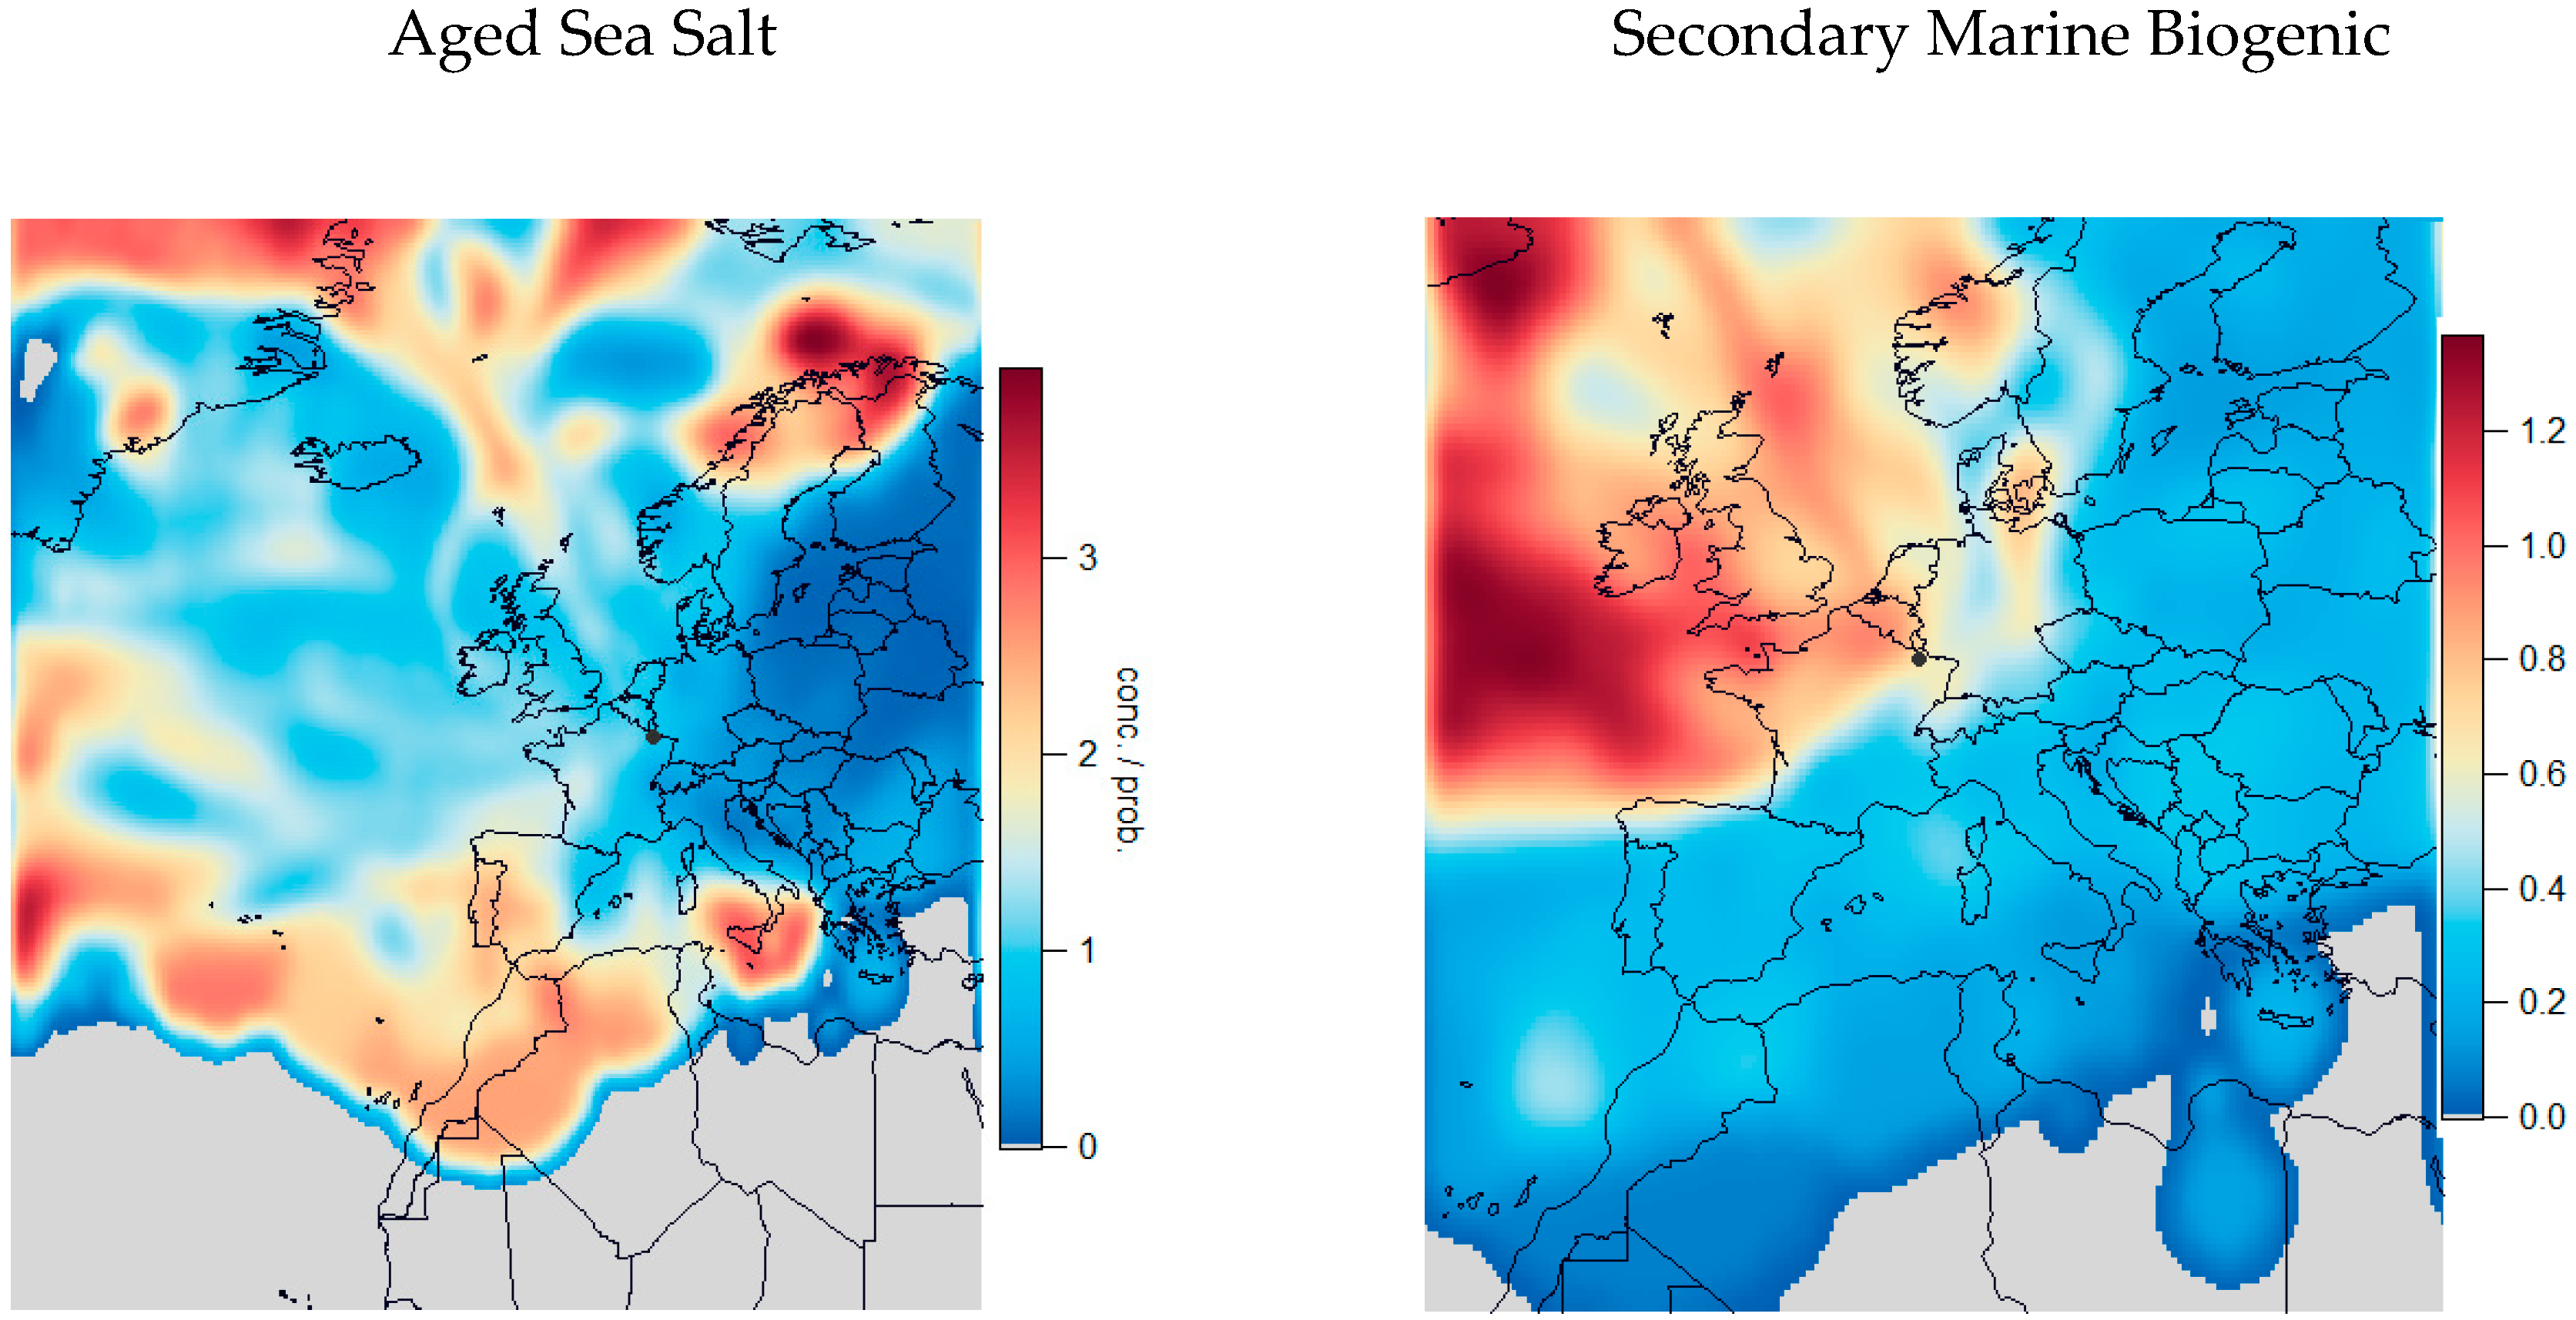
The Aged Sea Salt factor is characterized by a typical dominance of ions related to sea salt, such as Na, Cl and Mg. Although Mg/Na ratio of 0.11 is very close to the expected value from the composition of sea water (0.12; [37]), the observed Cl/Na ratio of 0.63 ± 0.17 contrasts with the expected value of 1.8 for fresh sea salt. This depletion of chloride, which has been clearly highlighted in Northern France by [17,38], could reflect the distance to the coast, conferring to this factor a secondary feature mainly resulting from acid-base interactions with anthropogenic pollutants, such as nitric and sulfuric acid. High SO4/Na and NO3/Na ratios respectively of 0.36 ± 0.09 (0.06 in seawater) and 0.65 ± 0.53 clearly support this assumption. This factor contributes on average to 7% of total PM10 concentrations in Metz, which falls in line with what has been previously estimated throughout Europe [7]. Slightly higher concentrations are obtained during winter compared to summer (Figure 2 and Figure S2), which may reflect the seasonality of air mass origins rather than a possible impact of road salting. This latter assumption is supported by a very low correlation with the traffic factor at wintertime (r2 = 0.1). The CWT analysis (Figure 3) highlights many of the marine areas of the Atlantic Ocean, although hotspots in, e.g., North Africa were not expected. The NWR calculation showed highest concentrations for a wind sector between W and SW, at wind speeds above 10 km/h, confirming the marine origin of this factor.
The Secondary Marine Biogenic factor is characterized by a high proportion of MSA, which is a secondary product from the oxidation of dimethylsulfide, and is usually associated with marine SOA [39,40]). The Mg/Na ratio of 0.12 ± 0.01—close to the value obtained for the sea salt-related factor—confirms this marine origin. As for the aged sea salt factor, the presence of sulfate in significant amount (SO4/Na ratio of 3.11) suggests that this factor may contain an anthropogenic signature, such as heavy industrial activities. Unfortunately, the low concentrations of metallic markers like V and Ni do not allow to confirm this assumption. Assuming that all SO4 in this factor originates from this kind of source, it would be responsible of at most 10.2% of total sulfate measured in Metz. The temporal variability is opposite to aged sea salt, with higher concentrations during summer. Although sea salt can be measured at the receptor site each time air masses are of marine origin (which is consistent with the presence of Na), secondary marine biogenic aerosol concentrations are conditioned by (i) the emission of gaseous precursors (e.g., during phytoplanctonic blooms), and (ii) photochemistry which is enhanced in warm months. The CWT analysis (Figure 3) clearly reveals its oceanic origin. Moreover, as shown in Figure S3, the highest concentrations are associated with oceanic air masses travelling over hotspots of phytoplantonic activities (spotted by MODIS detection of Chlorophyll-a, http://modis.gsfc.nasa.gov/data/dataprod/chlor_a.php)
Another natural-related factor is mainly characterized by a high proportion of arabitol, which is commonly described as a marker for primary biogenic emissions and more specifically with fungal spores [41,42]. This primary biogenic factor contributes to 4.5% to OC*, which is on annual average, lower than what was found in Lens, France (16%, [11]). Although maximum arabitol concentrations are comparable to what has been measured in France [43], the resulting primary biogenic organic aerosols (PBOA) contribution to PM10 is 4% during summer (3% on annual average), which is lower than the average values of around 10% found in Reference [17] for other French urban areas in summertime. The observed seasonality is consistent with warmer temperatures notably enabling the release of spores within the atmosphere. A secondary fraction from primary biogenic emissions could be steered to the oxalate-rich factor, since it has a similar temporality. As a matter of fact, Reference [11] also hypothesized that some secondary organics may be present within their PBOA factor, due to the temporal resolution of the sampling (24 h). Consequently, our PBOA factor might be essentially of primary origin, explaining the differences observed with other sampling sites. This could suggest the interest of adding oxalate within PMF analyses, although this should be confirmed with additional organic tracers. Additionally, the authors of Reference [44] have recently found a primary biogenic factor in Venice (Italy) with a similar contribution of around 3% in PM10, which is consistent with our result, but no knowledge of the comparability of these two sites regarding primary biogenic emissions is available. A recent study [45] in Saclay (Paris region) highlighted a similar seasonality of bioaerosols, and also pointed out that wind (speed and direction) may be a predominant meteorological parameter, suggesting potential transport over various geographical scales. CWT result exhibits specific hotspots over Egypt and Sicilia (Figure 3), which are unlikely the sources of bioaerosols impacting Metz. Additionally, the NWR clearly shows the highest concentrations for SE winds at almost any wind speeds (Figure S1). Large natural areas, such as the Vosges mountain range in France and the Black Forest in Germany, might be more plausible point sources, although an influence of local emissions should not be totally excluded.
Finally, a dust factor is identifiable from the significant amounts of major elements, such as Ca, Al and Fe, which are mainly explained by this factor (50.5%, 74.3% and 28% respectively). Fe/Ca and Al/Fe ratios respectively of 0.95 ± 0.27 and 0.88 ± 0.12 are in the range of recorded values in Saharan dust [46], although these ratios may not be strictly constraining considering the distance between Metz and Sahara desert, in addition to several industrial facilities in the region which may influence Fe concentrations. Dust have a small seasonal variation, with the highest concentrations between April and September, although its contribution to PM10 remains fairly low on an annual and seasonal basis (between 2 and 3%). It however reached up to 18% during sporadic episodes, making it one of the most predominant PM sources during those particular days. The daily temporal variability is rather large, which could be due to the variability of wind conditions. The use of 240-h (10-day) back trajectories reveals the Saharan origin of the dust sampled in Metz, and where continental transport from Eastern Europe may also occur (Figure 3).

3.2. Primary Combustion Sources

A primary traffic factor could be identified unambiguously thanks to a high share of EC (representing 44.3% of total EC). This composition is consistent with traffic-related sources resolved in other urban areas (e.g., References [7,47]). The OC/EC ratio of 1.43 ± 0.53 is close to values found in other urban areas, such as Paris (1.2, [18]) and Milan (1.3, [48]) for instance, although a large variability can be obtained at the European scale (Specieurope database, [49]). The presence of nitrate in the profile may suggest a slight secondary feature (12.5% of total NO3), but the concomitant absence of ammonium advocates that nitrate is not in the ammonium nitrate form, but more probably associated with other mineral cations. This is consistent with specific studies, allocating nitrate within road dust and/or vehicle exhaust and wear factors (e.g., Reference [50]). This factor also significantly contributes to some metallic elements. Indeed, high proportions of Cu (58%), Fe (40.1%) and Zn (34.9%) are related to the abrasive emission from brakes [51]. Primary traffic concentrations are significant all year-long, although higher concentrations are found during September and December. Overall, this factor contributes to 19.2% of PM10 on an annual basis, even though it does not account for the secondary components produced from these emissions. Indeed, primary traffic contributes to the formation of secondary organic and inorganic aerosols through the emission of precursor gases, but the absence of specific tracers (e.g., organic tracers or nitrogen isotopes) does not allow a precise assessment of this contribution, included de facto within the secondary factors presented below. The primary contribution is greater to what has been found in Paris (14%, [18]) or Lens (6%, [11]) and elsewhere in France (15% in urban background), but lower than the median contribution of 23% on the European scale [7]. This may be linked to a major urban highway, in addition to regular local commuting, dense heavy-duty vehicles traffic, since this North-to-South highway is a central crossroad for international road freight. This seems to be confirmed from the NWR analysis (Figure S1), with high concentrations associated with N winds at moderate speeds.
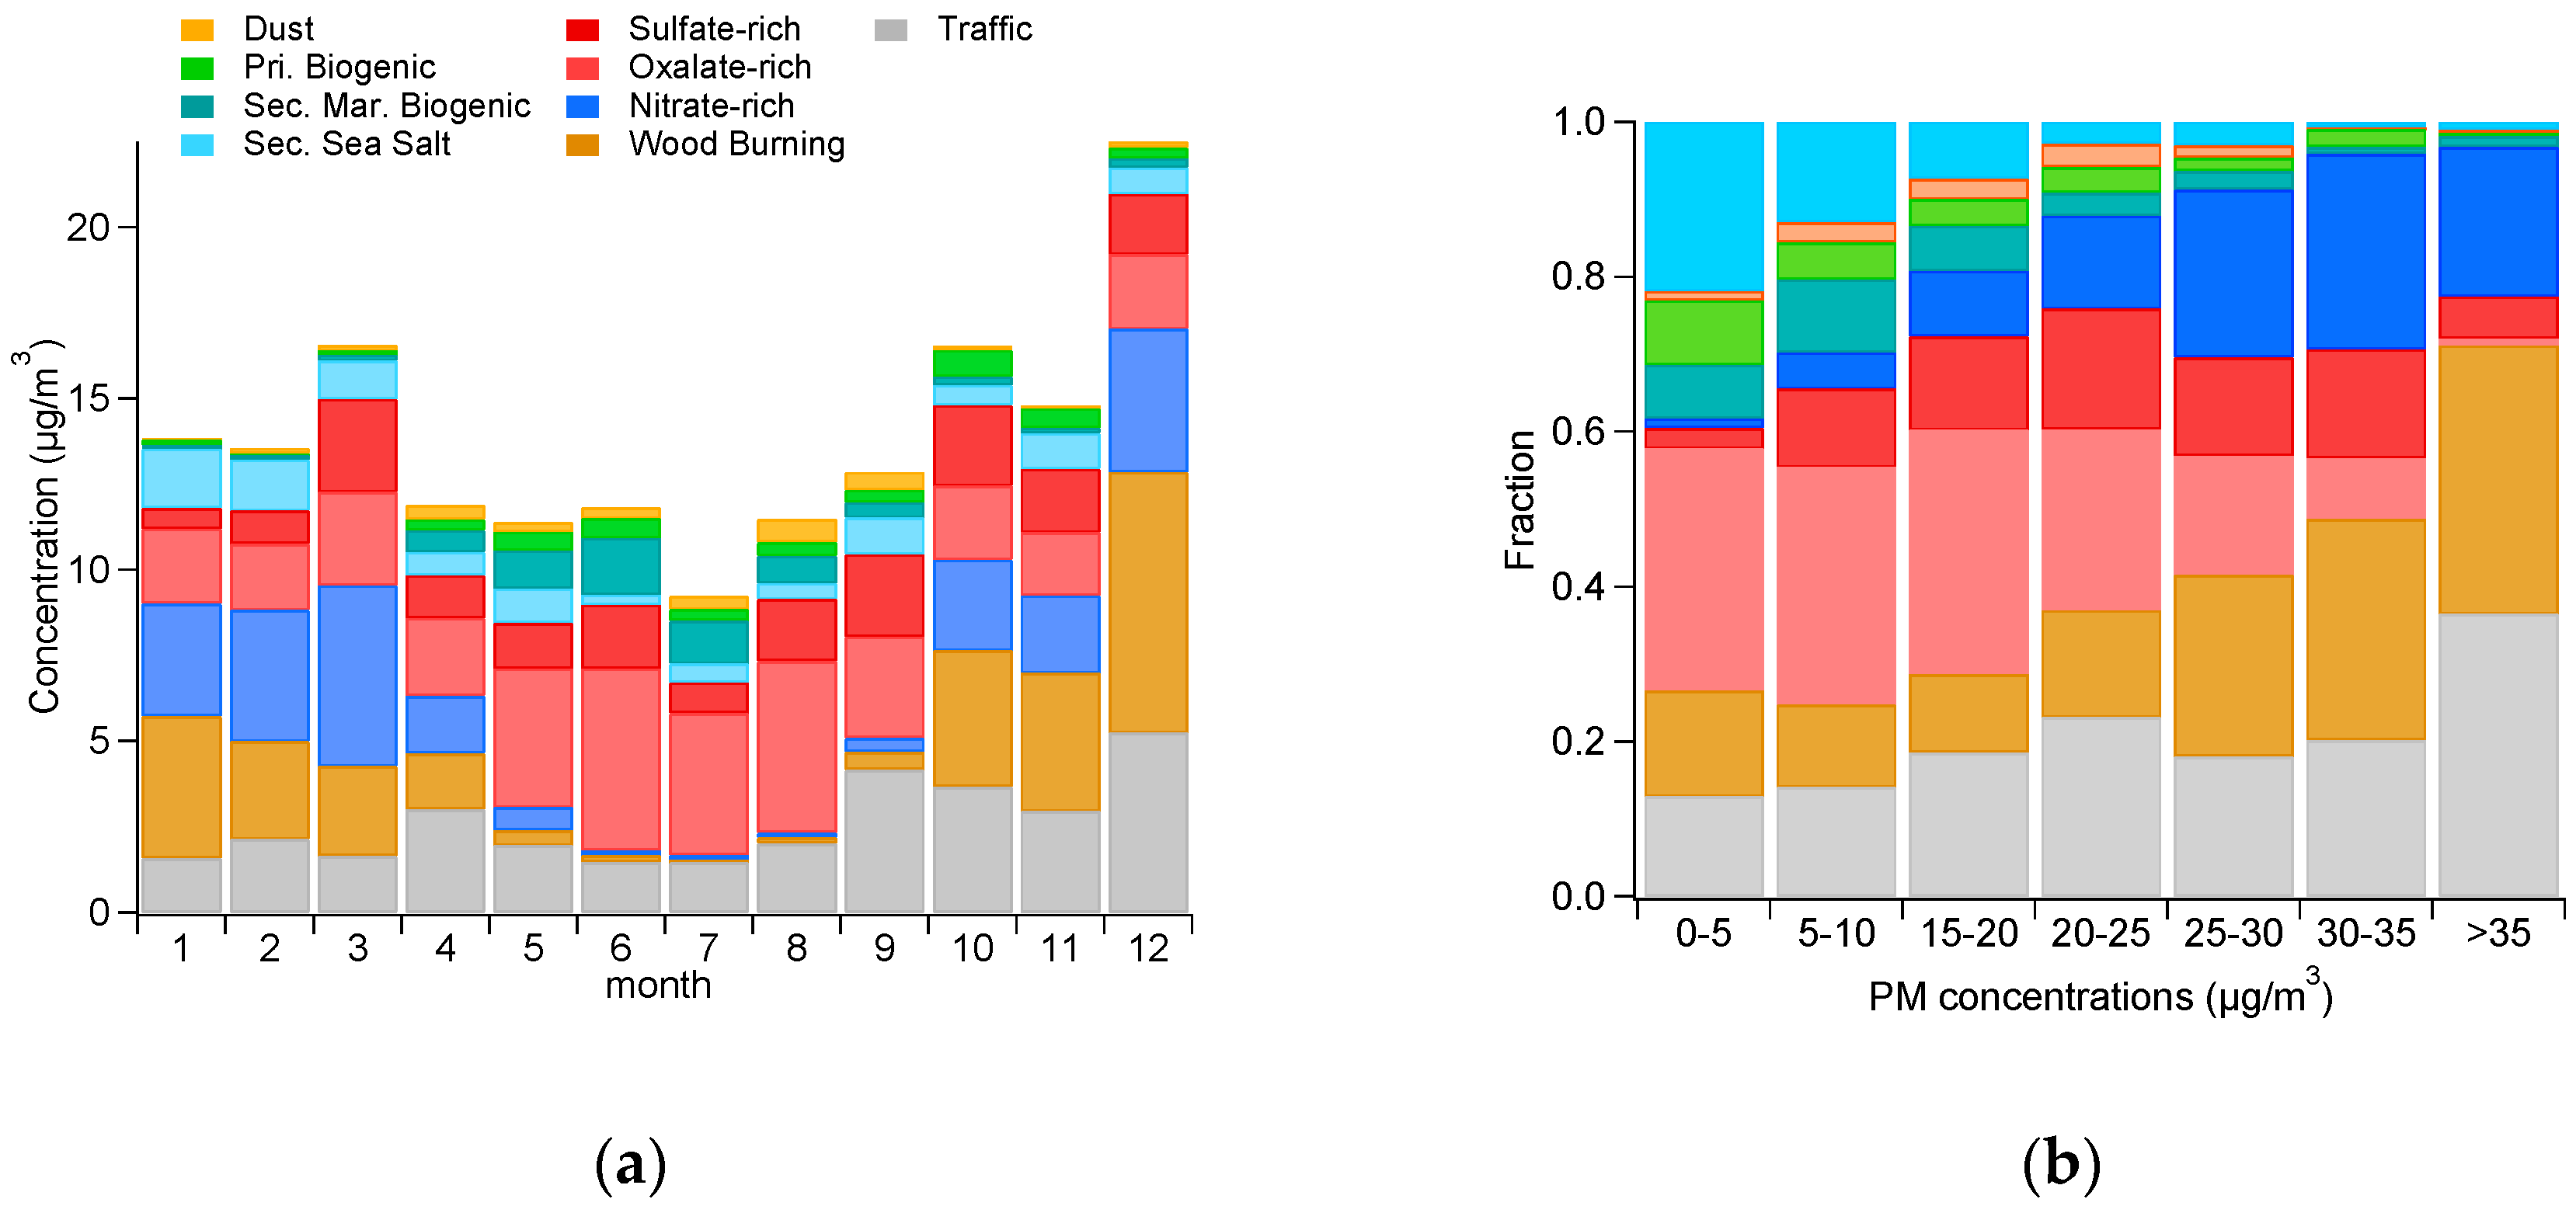
A biomass burning factor is easily resolved thanks to levoglucosan, a compound which is formed through the pyrolysis of cellulose and is commonly used as a specific marker of such emissions [27]. The profile is mainly composed of carbonaceous matter, since OC + EC represents 75% of its total mass. Consequently, wood-burning significantly contributes to OC and EC (29.7 and 19% respectively), as well as potassium (40.8%). Our potassium-to-levoglucosan ratio of 0.21 ± 0.06 is very consistent to the highlighted value in Paris (0.24, [18]) and lies in the expected range of 0.03–0.90 proposed by [27]. In addition, the OC/Levoglucosan ratio of 5.18 ± 1.08 is close to the reported values of 5.38 [52], and 5.0 for spruce combustion [53]. Small amount of Rb is found in this profile (21.8% of total Rb), which can also be associated to biomass burning [54]. The biomass burning factor exhibits a strong seasonal variability (Figure 2a and Figure S2), with the highest concentrations during cold months (from October to April), suggesting that this factor is primarily related to wood burning for residential heating. The wind analysis (Figure S1) clearly highlights a local pattern, given that the highest concentrations are related to relatively low wind speeds.
Timeseries of both combustion sources are compared to the outputs of the apportioned eBC concentrations (BCff and BCbb), as an independent source apportionment approach (Figure 4). The moderate r2 value for primary traffic (0.50) may be related to the choice of the Angström exponent, but also to the fact that our primary traffic factor contains non-exhaust emissions. It is however, comparable with the values commonly obtained when comparing Hydrocarbon-like Organic Aerosols (HOA) from mass spectrometry measurements with BCff (e.g., [55]).
The striking feature of our PMF results lies in the fact that these two combustion sources are the most contributing sources to the highest PM10 concentrations (Figure 2b). Indeed, they represent up to 70% of PM10 concentrations above the 35 µg/m3 threshold. Wood-burning exhibits a more specific feature, notably due to its seasonality. While its annual contribution is about 16%, it contributes up to 30% during winter, which is very similar to what is commonly observed in urban environments in the northern part of France [38,56]. Moreover, day-to-day contributions show that wood burning can contribute up to more than 50% of PM10, which was the case in 8 December 2016, corresponding to a major pollution episode occurring in the region.

3.3. Main Secondary Factors

Three main secondary factors were identified, presenting different characteristics which may be related to formation pathways and processes.
One is mainly composed of ammonium nitrate, and another one of ammonium sulfate. These two compounds are quite often associated with secondary factors in Europe [47], and are usually connected to regional background or transboundary advection. The presence of metallic elements such as Mn, Pb, Se and Zn underlines emissions from industrial activities, e.g., smelters [57] or coal combustion. The fact that these elements are present in both factors suggests a common influence of industrial sources, but these latest may not be the main contributor to ammonium nitrate given local/regional NOx emissions from traffic and significant NH3 concentrations from agriculture near Metz, as highlighted by satellite measurements [58]. Indeed, [56] have shown in Metz that ammonium nitrate has a more local feature than ammonium sulfate, especially during pollution episodes.
One of the originalities of the present study relies on the identification of a factor which is assumed to be mainly made of secondary organics (more than 60% of the profile’s mass). This factor is dominated by oxalate, which is the most abundant dicarboxylic acid in the atmosphere and thus significantly contributes to SOA, with hygroscopic properties being of importance regarding Cloud Condensation Nuclei notably. About one third of total OC (33.7% ± 5.2%) is included in this oxalate-rich factor. The significant proportion of SO4 (Oxalate-to-SO4 ratio of 0.33) is in line with previous observations, since these two components can be closely related through similar transformation processes [59]. Moreover, the substantial proportion of EC (27.4% of total EC) could suggest some SOA coating on carbon aggregates, although no mixing information are available within this study. This could also suggest that part of this factor may be influenced by additional combustion sources.
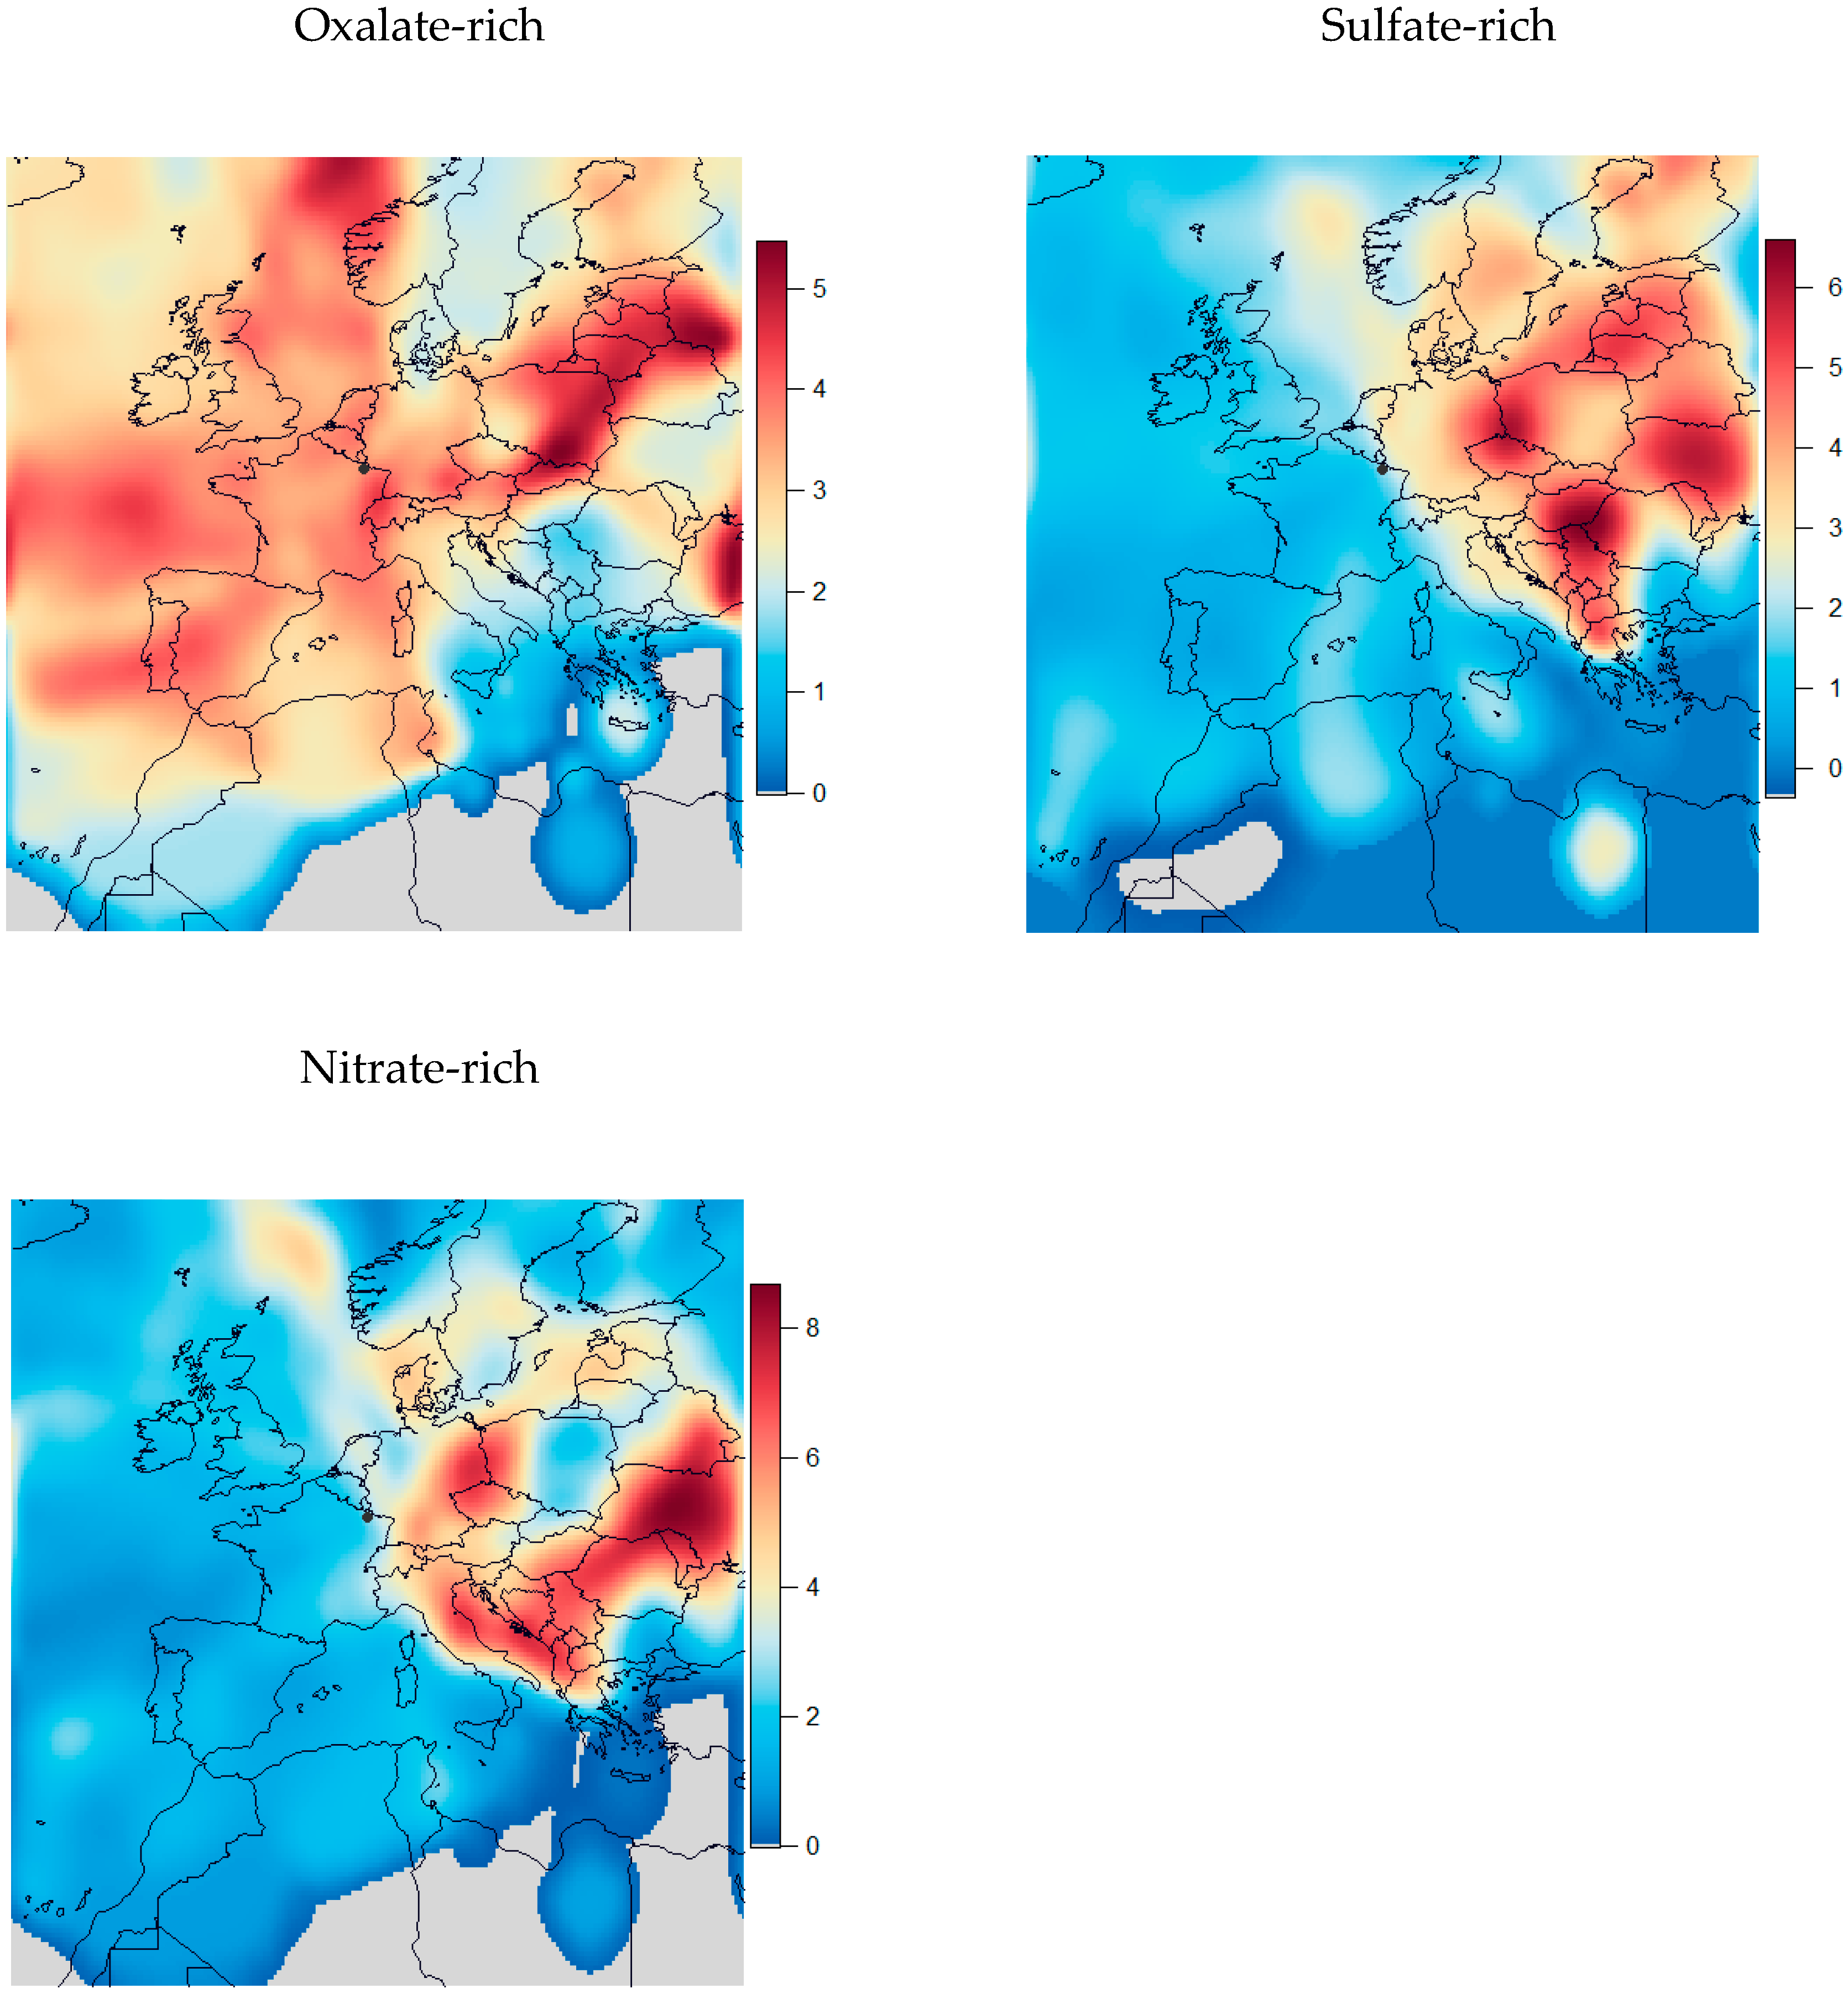
These three secondary factors make almost half (48.5%) of the PM10 sources. However, each of them exhibits a different seasonality (Figure S2). Nitrate and Sulfate-rich factors display the highest concentrations in spring, especially in March (when nitrate-rich factor is the predominant source), a period usually associated with PM pollution episodes in Western Europe dominated by secondary aerosols. Indeed, the contribution of both factors increases with PM10, except for the highest bin (higher than 35 µg/m3). While ammonium nitrate shows a clear decrease during warmer months due to gas partitioning, ammonium sulfate, more thermally stable, stays relatively constant. Both factors show similar geographical origins (Figure 5), with higher correlation values between the two maps (Pearson coefficient of 0.85). Main hotspots are located (i) over Eastern Germany and Western Poland, and (ii) in the Balkan region. These areas are known to be a strong emitter of SO2 [60], underlining long-range transport influencing the Lorraine area. These hotspots are consistent with the location of some Eastern Europe coal-powered power plants (Figure S4a). The Balkan region is scarcely highlighted in trajectory analysis in Western Europe, and is highlighted thanks to the Gaussian noise implemented within CWT. This may be an edge effect of the model, but this region is, according to the European emission database, one of the most emitting of SO2 in Europe, and exhibits, like Serbia, no decreasing trend over the years, as opposed to Poland and Germany (Figure S4b). The result for the NO3-rich factor is consistent with what has been observed in Paris or Lens for instance, highlighting higher ammonium nitrate concentrations associated with continental air masses. This transport feature does not however carry off local/regional formation of ammonium nitrate, as shown in [56]. To this respect, the use of Chemistry-Transport Models (CTM) should provide more insights into the contribution of this region to secondary aerosols measured in France.
Finally, the oxalate-rich factor has a significantly different seasonality, characterized by a strong increase during summer. The fact that (i) it mainly contributes to moderate PM10 concentrations, and (ii) its geographical origin is dispersed (Figure 5 and Figure S1), suggests that this factor may be somewhat representative of highly oxidized background pollution. Although oxalate is a tracer of in-cloud processing, this clear increase during summer also emphasizes photochemical pathways. The corresponding precursor’s sources cannot be identified from this dataset and should be a mixture of biogenic and anthropogenic emissions. However, as suggested above, a primary contribution from fuel combustion may not be excluded. This factor is the main contributor to PM10 on average (21.7%), which clearly highlight the role of SOA in this region, a particulate fraction that should be better characterized in the future. Moreover, the authors of Reference [61] have shown that SOA contributed to the enhancement of light absorption of black carbon particles through a lensing effect occurring during summer. Given the seasonality of this factor, as well as the presence of OC, EC and SO42- in the factor profile, Metz would thus be an interesting case study.

3.4. Focus on Non-Combustion Organic Aerosols

Since oxalate-rich factors are rarely documented in PMF studies, our result is quite unique, making a comparison with literature fairly impossible. However, the oxalate-rich factor in Metz is a significant contributor to PM10, and Metz also contains the highest share of OC. In order to investigate the consistency of our results, we compared the timeseries of non-combustion OA—defined as SOA and primary naturally-driven OA—with results obtained from the EC-tracer and AE33-based approaches described in Section 2.2. This comparison is presented in Figure 6. The three approaches provided very comparable results from spring to fall, although some peaks are not documented in the PMF results (especially during June 2016 and July 2017). During colder months, higher discrepancies are observed which should be related to the potential role of combustion sources to SOA, and also to [ OC EC ] bb value that may not be totally representative of the Metz area. Still, during warm months, the slopes from linear regression are 0.99 for the EC-tracer approach and 1.04 with the AE33 method. Given that each of these two methodologies are independent from our PMF, this good agreement confirms the robustness of our PMF outputs, notably regarding SOA source apportionment, and thus reinforces the benefit of using oxalate within PMF analyses.

4. Conclusions

The present study aims at characterizing, for the first time, the sources of PM10 in an urban area of the Eastern part of France. Regular 24-h high-volume filter sampling was carried out from April 2015 to January 2017 every third day. A comprehensive set of chemical analyses was performed allowing the use of PMF to estimate the relative contribution of the main sources of PM10. The PMF outputs point out to a robust nine-factor solution, including primary traffic and wood-burning emissions, dust, aged sea salt, secondary marine biogenic aerosols, primary biogenic aerosols, nitrate-rich, sulfate-rich and oxalate-rich secondary aerosols. On average, the three secondary factors are the dominant sources, representing 48.5% of PM10, followed by primary traffic (19.2%), wood-burning (16.1%), aged sea salt (6.9%), secondary marine biogenic (4.2%), primary biogenic (2.8%) and dust (2.3%).
This study notably highlights the role of natural sources and their aging. Marine aerosols (sea salt and marine biogenic) are indeed particularly influenced along their atmospheric transport and reflect the impact of anthropogenic pollution. Metz can sporadically be influenced by Saharan dust outbreaks despite being far from emission sources, and can also encounter high concentrations of biogenic aerosols during summer. For combustion particles, wood burning is shown as the main source of PM10 during winter and can contribute up to 51% during specific episodes. Together with traffic, both factors are the main emission sources during the highest PM10 concentrations periods (>35 µg/m3). Moreover, since the CWT analysis showed a rather local influence, these two sources should therefore represent an efficient leverage at a local scale in order to prevent extreme concentrations. Finally, substantial contributions of secondary factors are investigated. In particular, the nitrate-rich factor displays a sharp increase during spring and a clear decrease during summer due to its semi-volatile characteristic when a specific SOA factor is becoming predominant. Furthermore, oxalate-rich factor is one of the most original features of our study, underlining the role of atmospheric processes in this area of France. Its geographical origin is rather diffuse, which is consistent with highly oxidized background pollution.
In its current form, this dataset is however unable to comprehensively characterize these secondary fractions or their precise geographical origins. Complementary chemical analyses for the quantification of specific organic tracers may provide more precise information. Furthermore, simulations using Chemistry-Transport Models, owing to precise emission inventories, would provide useful additional information for mitigation policies by, for example, shutting down specific sources and quantifying their impact on PM10 concentrations.

Supplementary Materials

The following are available online at https://www.mdpi.com/2073-4433/10/7/370/s1, Figure S1: Non-parametric Wind Regression analysis applied to the PMF timeseries. Radial axis is relative to the wind speed (km/h), color to the concentrations (µg/m3), Figure S2: Monthly box and whiskers distribution (10th, 25th, 50th, 75th and 90th have been used) of the 9 PMF factors. Triangle markers correspond to the monthly mean values, Figure S3: Mean Chlorophyll-a concentrations (mg/m3) over May and June 2015 from MODIS observations; corresponding back trajectories during the same period, color-coded by Secondary Marine Biogenic Aerosol concentration (µg/m3), Figure S4: (a) CWT analysis for the SO4-rich factor, with locations of selected coal-powered power plants in Eastern Europe, with energy production higher than 2000 MWh. (b) SO2 emissions (in ton) for Poland, Serbia, Germany and France from 2008 to 2016 (data available at https://ec.europa.eu/eurostat/data/database), Table S1: Time series comparison of PMF factors before and after constraints. Correlation coefficient (r2) for all profiles are higher than 0.96, intercepts were all 0, Table S2: Mapping results of the bootstrap analysis after constraints implementation, in comparison with the unconstrained bootstrap run (in parenthesis). F1: Traffic, F2: Wood-burning, F3: Dust, F4: Primary Biogenic, F5: Secondary Marine Biogenic, F6: Oxalate-rich, F7: Sulfate-rich, F8: Nitrate-rich, F9: Aged Sea Salt.

Author Contributions

Conceptualization, J.-E.P.; methodology, J.-E.P.; validation, J.-E.P., N.B. and O.F.; chemical analyses, N.B. and L.A.; investigation, J.-E.P.; writing—original draft preparation, J.-E.P.; writing—review and editing, O.F., E.R., L.A.; supervision, C.P., A.O. and E.R.

Funding

This research received partial funding from the French ministry of environment in the frame of the CARA led by the national reference laboratory for air quality monitoring (LCSQA).

Acknowledgments

David Missler and Jean-René Fays, Atmo Grand-Est, are greatly acknowledged for the technical support of filter sampling.

Conflicts of Interest

The authors declare no conflicts of interest.

References

  1. Ramgolam, K.; Favez, O.; Cachier, H.; Gaudichet, A.; Marano, F.; Martinon, L.; Baeza-Squiban, A. Size-partitioning of an urban aerosol to identify particle determinants involved in the proinflammatory response induced in airway epithelial cells. Part. Fibre Toxicol. 2009, 6, 10. [Google Scholar] [CrossRef] [PubMed]
  2. Silbajoris, R.; Osornio-Vargas, A.R.; Simmons, S.O.; Reed, W.; Bromberg, P.A.; Dailey, L.A.; Samet, J.M. Ambient Particulate Matter Induces Interleukin-8 Expression through an Alternative NF-κB (Nuclear Factor-Kappa B) Mechanism in Human Airway Epithelial Cells. Environ. Health Perspect. 2011, 119, 1379–1383. [Google Scholar] [CrossRef] [PubMed]
  3. Wennberg, P.; Wensley, F.; Di Angelantonio, E.; Johansson, L.; Boman, K.; Rumley, A.; Lowe, G.; Hallmans, G.; Danesh, J.; Jansson, J.-H. Haemostatic and inflammatory markers are independently associated with myocardial infarction in men and women. Thromb. Res. 2012, 129, 68–73. [Google Scholar] [CrossRef] [PubMed]
  4. Anderson, J.O.; Thundiyil, J.G.; Stolbach, A. Clearing the Air: A Review of the Effects of Particulate Matter Air Pollution on Human Health. J. Med. Toxicol. 2012, 8, 166–175. [Google Scholar] [CrossRef] [PubMed]
  5. Lelieveld, J.; Evans, J.S.; Fnais, M.; Giannadaki, D.; Pozzer, A. The contribution of outdoor air pollution sources to premature mortality on a global scale. Nature 2015, 525, 367–371. [Google Scholar] [CrossRef] [PubMed]
  6. Paatero, P.; Tapper, U. Positive matrix factorization: A non-negative factor model with optimal utilization of error estimates of data values. Environmetrics 1994, 5, 111–126. [Google Scholar] [CrossRef]
  7. Belis, C.A.; Karagulian, F.; Larsen, B.R.; Hopke, P.K. Critical review and meta-analysis of ambient particulate matter source apportionment using receptor models in Europe. Atmos. Environ. 2013, 69, 94–108. [Google Scholar] [CrossRef]
  8. Srivastava, D.; Favez, O.; Perraudin, E.; Villenave, E.; Albinet, A. Comparison of Measurement-Based Methodologies to Apportion Secondary Organic Carbon (SOC) in PM2.5: A Review of Recent Studies. Atmosphere 2018, 9, 452. [Google Scholar] [CrossRef]
  9. Belis, C.A.; Karagulian, F.; Amato, F.; Almeida, M.; Artaxo, P.; Beddows, D.C.S.; Bernardoni, V.; Bove, M.C.; Carbone, S.; Cesari, D.; et al. A new methodology to assess the performance and uncertainty of source apportionment models II: The results of two European intercomparison exercises. Atmos. Environ. 2015, 123, 240–250. [Google Scholar] [CrossRef]
  10. Zhang, Q.; Jimenez, J.L.; Canagaratna, M.R.; Allan, J.D.; Coe, H.; Ulbrich, I.; Alfarra, M.R.; Takami, A.; Middlebrook, A.M.; Sun, Y.L.; et al. Ubiquity and dominance of oxygenated species in organic aerosols in anthropogenically-influenced Northern Hemisphere midlatitudes. Geophys. Res. Lett. 2007, 34. [Google Scholar] [CrossRef] [Green Version]
  11. Waked, A.; Favez, O.; Alleman, L.Y.; Piot, C.; Petit, J.-E.; Delaunay, T.; Verlinden, E.; Golly, B.; Besombes, J.-L.; Jaffrezo, J.-L.; et al. Source apportionment of PM10 in a north-western Europe regional urban background site (Lens, France) using positive matrix factorization and including primary biogenic emissions. Atmos. Chem. Phys. 2014, 14, 3325–3346. [Google Scholar] [CrossRef] [Green Version]
  12. Srivastava, D.; Favez, O.; Bonnaire, N.; Lucarelli, F.; Haeffelin, M.; Perraudin, E.; Gros, V.; Villenave, E.; Albinet, A. Speciation of organic fractions does matter for aerosol source apportionment. Part 2: Intensive short-term campaign in the Paris area (France). Sci. Total Environ. 2018, 634, 267–278. [Google Scholar] [CrossRef] [PubMed]
  13. Kang, M.; Fu, P.; Kawamura, K.; Yang, F.; Zhang, H.; Zang, Z.; Ren, H.; Ren, L.; Zhao, Y.; Sun, Y.; et al. Characterization of biogenic primary and secondary organic aerosols in the marine atmosphere over the East China Sea. Atmos. Chem. Phys. 2018, 18, 13947–13967. [Google Scholar] [CrossRef] [Green Version]
  14. Kawamura, K.; Bikkina, S. A review of dicarboxylic acids and related compounds in atmospheric aerosols: Molecular distributions, sources and transformation. Atmos. Res. 2016, 170, 140–160. [Google Scholar] [CrossRef]
  15. Ervens, B.; Turpin, B.J.; Weber, R.J. Secondary organic aerosol formation in cloud droplets and aqueous particles (aqSOA): A review of laboratory, field and model studies. Atmos. Chem. Phys. 2011, 11, 11069–11102. [Google Scholar] [CrossRef]
  16. Sorooshian, A.; Wang, Z.; Coggon, M.M.; Jonsson, H.H.; Ervens, B. Observations of Sharp Oxalate Reductions in Stratocumulus Clouds at Variable Altitudes: Organic Acid and Metal Measurements During the 2011 E-PEACE Campaign. Environ. Sci. Technol. 2013, 47, 7747–7756. [Google Scholar] [CrossRef] [PubMed] [Green Version]
  17. Weber, S.; Salameh, D.; Albinet, A.; Alleman, L.Y.; Waked, A.; Besombes, J.-L.; Jacob, V.; Guillaud, G.; Meshbah, B.; Rocq, B.; et al. Comparison of PM10 Sources Profiles at 15 French Sites Using a Harmonized Constrained Positive Matrix Factorization Approach. Atmosphere 2019, 10, 310. [Google Scholar] [CrossRef]
  18. Bressi, M.; Sciare, J.; Ghersi, V.; Mihalopoulos, N.; Petit, J.-E.; Nicolas, J.B.; Moukhtar, S.; Rosso, A.; Féron, A.; Bonnaire, N.; et al. Sources and geographical origins of fine aerosols in Paris (France). Atmos. Chem. Phys. 2014, 14, 8813–8839. [Google Scholar] [CrossRef] [Green Version]
  19. Chazette, P.; Royer, P. Springtime major pollution events by aerosol over Paris Area: From a case study to a multiannual analysis: Springtime Major Pollution by Aerosol. J. Geophys. Res. Atmos. 2017, 122, 8101–8119. [Google Scholar] [CrossRef]
  20. Kottek, M.; Grieser, J.; Beck, C.; Rudolf, B.; Rubel, F. World Map of the Köppen-Geiger climate classification updated. Meteorol. Z. 2006, 15, 259–263. [Google Scholar] [CrossRef]
  21. Birch, M.E.; Cary, R.A. Elemental Carbon-Based Method for Monitoring Occupational Exposures to Particulate Diesel Exhaust. Aerosol Sci. Technol. 1996, 25, 221–241. [Google Scholar] [CrossRef]
  22. Cavalli, F.; Viana, M.; Yttri, K.E.; Genberg, J.; Putaud, J.-P. Toward a standardised thermal-optical protocol for measuring atmospheric organic and elemental carbon: The EUSAAR protocol. Atmos. Meas. Tech. 2010, 3, 79–89. [Google Scholar] [CrossRef]
  23. Bressi, M.; Sciare, J.; Ghersi, V.; Bonnaire, N.; Nicolas, J.B.; Petit, J.-E.; Moukhtar, S.; Rosso, A.; Mihalopoulos, N.; Féron, A. A one-year comprehensive chemical characterisation of fine aerosol (PM2.5) at urban, suburban and rural background sites in the region of Paris (France). Atmos. Chem. Phys. 2013, 13, 7825–7844. [Google Scholar] [CrossRef] [Green Version]
  24. Iinuma, Y.; Engling, G.; Puxbaum, H.; Herrmann, H. A highly resolved anion-exchange chromatographic method for determination of saccharidic tracers for biomass combustion and primary bio-particles in atmospheric aerosol. Atmos. Environ. 2009, 43, 1367–1371. [Google Scholar] [CrossRef]
  25. Mbengue, S.; Alleman, L.Y.; Flament, P. Size-distributed metallic elements in submicronic and ultrafine atmospheric particles from urban and industrial areas in northern France. Atmos. Res. 2014, 135–136, 35–47. [Google Scholar] [CrossRef]
  26. Gianini, M.F.D.; Fischer, A.; Gehrig, R.; Ulrich, A.; Wichser, A.; Piot, C.; Besombes, J.-L.; Hueglin, C. Comparative source apportionment of PM10 in Switzerland for 2008/2009 and 1998/1999 by Positive Matrix Factorisation. Atmos. Environ. 2012, 54, 149–158. [Google Scholar] [CrossRef]
  27. Puxbaum, H.; Caseiro, A.; Sanchez-Ochoa, A.; Kasper-Giebl, A.; Claeys, M.; Gelencser, A.; Legrand, M.; Preunkert, S.; Pio, C. Levoglucosan levels at background sites in Europe for assessing the impact of biomass combustion on the European aerosol background. J. Geophys. Res. 2007, 112, S05. [Google Scholar] [CrossRef]
  28. Drinovec, L.; Močnik, G.; Zotter, P.; Prévôt, A.S.H.; Ruckstuhl, C.; Coz, E.; Rupakheti, M.; Sciare, J.; Müller, T.; Wiedensohler, A.; et al. The “dual-spot” Aethalometer: An improved measurement of aerosol black carbon with real-time loading compensation. Atmos. Meas. Tech. 2015, 8, 1965–1979. [Google Scholar] [CrossRef]
  29. Sandradewi, J.; Prévôt, A.S.H.; Szidat, S.; Perron, N.; Alfarra, M.R.; Lanz, V.A.; Weingartner, E.; Baltensperger, U. Using Aerosol Light Absorption Measurements for the Quantitative Determination of Wood Burning and Traffic Emission Contributions to Particulate Matter. Environ. Sci. Technol. 2008, 42, 3316–3323. [Google Scholar] [CrossRef]
  30. Favez, O.; El Haddad, I.; Piot, C.; Boréave, A.; Abidi, E.; Marchand, N.; Jaffrezo, J.L.; Besombes, J.L.; Personnaz, M.B.; Sciare, J.; et al. Inter-comparison of source apportionment models for the estimation of wood burning aerosols during wintertime in an Alpine city (Grenoble, France). Atmos. Chem. Phys. 2010, 10, 5295–5314. [Google Scholar] [CrossRef] [Green Version]
  31. Maenhaut, W.; Vermeylen, R.; Claeys, M.; Vercauteren, J.; Roekens, E. Sources of the PM10 aerosol in Flanders, Belgium, and re-assessment of the contribution from wood burning. Sci. Total Environ. 2016, 562, 550–560. [Google Scholar] [CrossRef] [PubMed]
  32. Cheng, I.; Zhang, L.; Blanchard, P.; Dalziel, J.; Tordon, R. Concentration-weighted trajectory approach to identifying potential sources of speciated atmospheric mercury at an urban coastal site in Nova Scotia, Canada. Atmos. Chem. Phys. 2013, 13, 6031–6048. [Google Scholar] [CrossRef] [Green Version]
  33. Stein, A.F.; Draxler, R.R.; Rolph, G.D.; Stunder, B.J.B.; Cohen, M.D.; Ngan, F. NOAA’s HYSPLIT Atmospheric Transport and Dispersion Modeling System. Bull. Am. Meteorol. Soc. 2015, 96, 2059–2077. [Google Scholar] [CrossRef]
  34. Petit, J.-E.; Favez, O.; Albinet, A.; Canonaco, F. A user-friendly tool for comprehensive evaluation of the geographical origins of atmospheric pollution: Wind and trajectory analyses. Environ. Model. Softw. 2017, 88, 183–187. [Google Scholar] [CrossRef] [Green Version]
  35. Kim, I.S.; Wee, D.; Kim, Y.P.; Lee, J.Y. Development and application of three-dimensional potential source contribution function (3D-PSCF). Environ. Sci. Pollut. Res. 2016, 23, 16946–16954. [Google Scholar] [CrossRef] [PubMed]
  36. Henry, R.; Norris, G.A.; Vedantham, R.; Turner, J.R. Source Region Identification Using Kernel Smoothing. Environ. Sci. Technol. 2009, 43, 4090–4097. [Google Scholar] [CrossRef] [PubMed]
  37. Seinfeld, J.H.; Pandis, S.N. Atmospheric Chemistry and Physics: From Air Pollution to Climate Change, 3rd ed.; John Wiley & Sons, Inc.: Hoboken, NJ, USA, 2016; ISBN 978-1-118-94740-1. [Google Scholar]
  38. Oliveira, D.M. Identification of the Main Sources and Geographical Origins of PM10 in the Northern Part of France. Ph.D. Thesis, University of Lille, Lille, France, 2017. [Google Scholar]
  39. Crippa, M.; El Haddad, I.; Slowik, J.G.; DeCarlo, P.F.; Mohr, C.; Heringa, M.F.; Chirico, R.; Marchand, N.; Sciare, J.; Baltensperger, U.; et al. Identification of marine and continental aerosol sources in Paris using high resolution aerosol mass spectrometry. J. Geophys. Res. Atmos. 2013, 118, 1950–1963. [Google Scholar] [CrossRef] [Green Version]
  40. Ovadnevaite, J.; Ceburnis, D.; Leinert, S.; Dall’Osto, M.; Canagaratna, M.; O’Doherty, S.; Berresheim, H.; O’Dowd, C. Submicron NE Atlantic marine aerosol chemical composition and abundance: Seasonal trends and air mass categorization: Seasonal Trends of Marine Aerosol. J. Geophys. Res. Atmos. 2014, 119, 11850–11863. [Google Scholar] [CrossRef]
  41. Yttri, K.E.; Myhre, C.L.; Torseth, K. The carbonaceous aerosol–A remaining challenge. World Meteorol. Organ. WMO Bull. 2009, 58, 54. [Google Scholar]
  42. Bauer, H.; Claeys, M.; Vermeylen, R.; Schueller, E.; Weinke, G.; Berger, A.; Puxbaum, H. Arabitol and mannitol as tracers for the quantification of airborne fungal spores. Atmos. Environ. 2008, 42, 588–593. [Google Scholar] [CrossRef]
  43. Samake, A.; Jaffrezo, J.-L.; Favez, O.; Weber, S.; Jacob, V.; Albinet, A.; Riffault, V.; Perdrix, E.; Waked, A.; Golly, B.; et al. Polyols and glucose particulate species as tracers of primary biogenic organic aerosols at 28 French sites. Atmos. Chem. Phys. Discuss. 2019, 19, 3357–3374. [Google Scholar] [CrossRef] [Green Version]
  44. Barbaro, E.; Feltracco, M.; Cesari, D.; Padoan, S.; Zangrando, R.; Contini, D.; Barbante, C.; Gambaro, A. Characterization of the water soluble fraction in ultrafine, fine, and coarse atmospheric aerosol. Sci. Total Environ. 2019, 658, 1423–1439. [Google Scholar] [CrossRef] [PubMed]
  45. Sarda-Estève, R.; Baisnée, D.; Guinot, B.; Petit, J.-E.; Sodeau, J.; O’Connor, D.; Besancenot, J.-P.; Thibaudon, M.; Gros, V. Temporal Variability and Geographical Origins of Airborne Pollen Grains Concentrations from 2015 to 2018 at Saclay, France. Remote Sens. 2018, 10, 1932. [Google Scholar] [CrossRef]
  46. Formenti, P.; Schütz, L.; Balkanski, Y.; Desboeufs, K.; Ebert, M.; Kandler, K.; Petzold, A.; Scheuvens, D.; Weinbruch, S.; Zhang, D. Recent progress in understanding physical and chemical properties of African and Asian mineral dust. Atmos. Chem. Phys. 2011, 11, 8231–8256. [Google Scholar] [CrossRef] [Green Version]
  47. Viana, M.; Kuhlbusch, T.A.J.; Querol, X.; Alastuey, A.; Harrison, R.M.; Hopke, P.K.; Winiwarter, W.; Vallius, M.; Szidat, S.; Prévôt, A.S.H.; et al. Source apportionment of particulate matter in Europe: A review of methods and results. J. Aerosol Sci. 2008, 39, 827–849. [Google Scholar] [CrossRef]
  48. Giugliano, M.; Lonati, G.; Butelli, P.; Romele, L.; Tardivo, R.; Grosso, M. Fine particulate (PM2.5–PM1) at urban sites with different traffic exposure. Atmos. Environ. 2005, 39, 2421–2431. [Google Scholar] [CrossRef]
  49. Pernigotti, D.; Belis, C.A.; Spanò, L. SPECIEUROPE: The European data base for PM source profiles. Atmos. Pollut. Res. 2016, 7, 307–314. [Google Scholar] [CrossRef]
  50. Amato, F.; Favez, O.; Pandolfi, M.; Alastuey, A.; Querol, X.; Moukhtar, S.; Bruge, B.; Verlhac, S.; Orza, J.A.G.; Bonnaire, N.; et al. Traffic induced particle resuspension in Paris: Emission factors and source contributions. Atmos. Environ. 2016, 129, 114–124. [Google Scholar] [CrossRef]
  51. Johansson, C.; Norman, M.; Burman, L. Road traffic emission factors for heavy metals. Atmos. Environ. 2009, 43, 4681–4688. [Google Scholar] [CrossRef]
  52. Bernardoni, V.; Vecchi, R.; Valli, G.; Piazzalunga, A.; Fermo, P. PM10 source apportionment in Milan (Italy) using time-resolved data. Sci. Total Environ. 2011, 409, 4788–4795. [Google Scholar] [CrossRef] [PubMed]
  53. Schmidl, C.; Marr, I.L.; Caseiro, A.; Kotianová, P.; Berner, A.; Bauer, H.; Kasper-Giebl, A.; Puxbaum, H. Chemical characterisation of fine particle emissions from wood stove combustion of common woods growing in mid-European Alpine regions. Atmos. Environ. 2008, 42, 126–141. [Google Scholar] [CrossRef]
  54. Godoy, M.L.D.P.; Godoy, J.M.; Artaxo, P. Aerosol source apportionment around a large coal fired power plant—Thermoelectric Complex Jorge Lacerda, Santa Catarina, Brazil. Atmos. Environ. 2005, 39, 5307–5324. [Google Scholar] [CrossRef]
  55. Zhang, Y. Estimation Multi-Annuelle Des Sources D’aérosols Organiques et de Leurs Propriétés D’absorption de la Lumière en Région Parisienne. Ph.D. Thesis, Université de Versailles-Saint-Quentin-en-Yvelines, Versailles, France, 2019. [Google Scholar]
  56. Petit, J.-E.; Amodeo, T.; Meleux, F.; Bessagnet, B.; Menut, L.; Grenier, D.; Pellan, Y.; Ockler, A.; Rocq, B.; Gros, V.; et al. Characterising an intense PM pollution episode in March 2015 in France from multi-site approach and near real time data: Climatology, variabilities, geographical origins and model evaluation. Atmos. Environ. 2017, 155, 68–84. [Google Scholar] [CrossRef]
  57. Amato, F.; Pandolfi, M.; Viana, M.; Querol, X.; Alastuey, A.; Moreno, T. Spatial and chemical patterns of PM10 in road dust deposited in urban environment. Atmos. Environ. 2009, 43, 1650–1659. [Google Scholar] [CrossRef]
  58. Fortems-Cheiney, A.; Dufour, G.; Hamaoui-Laguel, L.; Foret, G.; Siour, G.; Van Damme, M.; Meleux, F.; Coheur, P.-F.; Clerbaux, C.; Clarisse, L.; et al. Unaccounted variability in NH3 agricultural sources detected by IASI contributing to European spring haze episode: Agricultural NH3 Detected by IASI. Geophys. Res. Lett. 2016, 43, 5475–5482. [Google Scholar] [CrossRef]
  59. Yu, J.Z.; Huang, X.-F.; Xu, J.; Hu, M. When Aerosol Sulfate Goes Up, So Does Oxalate: Implication for the Formation Mechanisms of Oxalate. Environ. Sci. Technol. 2005, 39, 128–133. [Google Scholar] [CrossRef] [PubMed]
  60. Pay, M.T.; Jiménez-Guerrero, P.; Baldasano, J.M. Assessing sensitivity regimes of secondary inorganic aerosol formation in Europe with the CALIOPE-EU modeling system. Atmos. Environ. 2012, 51, 146–164. [Google Scholar] [CrossRef] [Green Version]
  61. Zhang, Y.; Favez, O.; Canonaco, F.; Liu, D.; Močnik, G.; Amodeo, T.; Sciare, J.; Prévôt, A.S.H.; Gros, V.; Albinet, A. Evidence of major secondary organic aerosol contribution to lensing effect black carbon absorption enhancement. NPJ Clim. Atmos. Sci. 2018, 1, 47. [Google Scholar] [CrossRef] [Green Version]
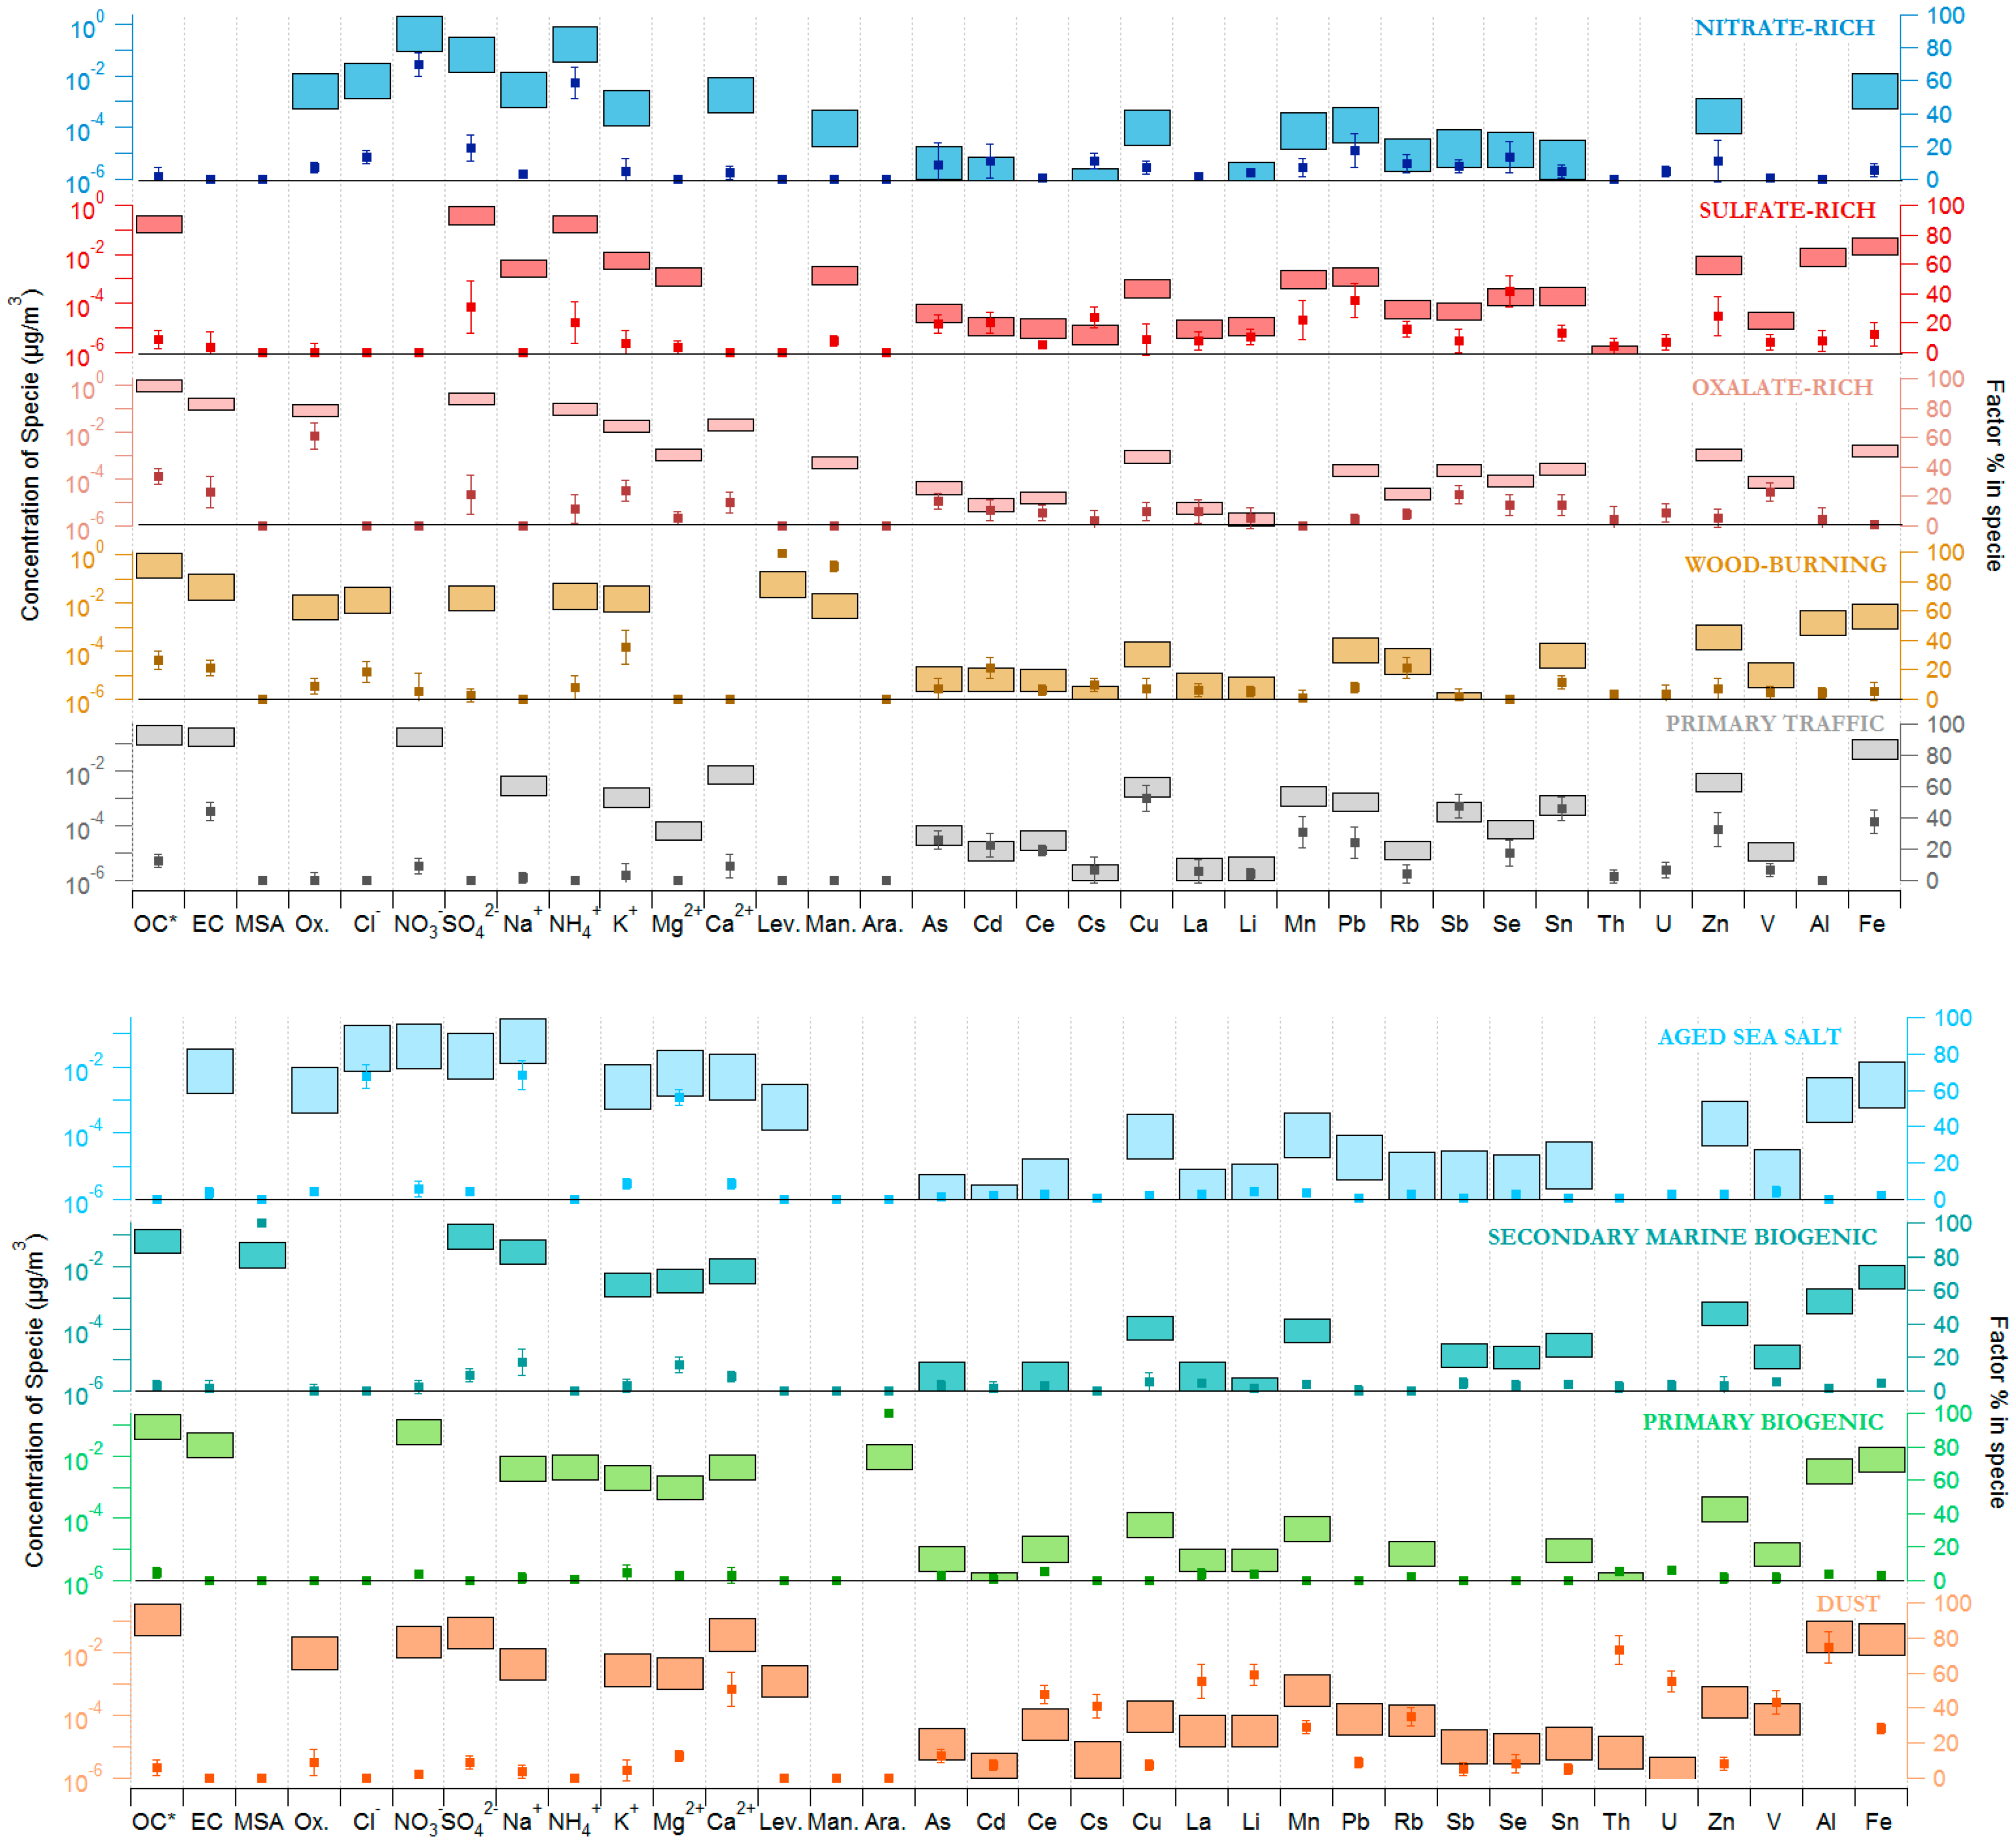
Figure 1. Chemical profiles of the PMF (Positive Matrix Factorization) factors obtained from the constrained bootstrap analysis. Bars (left axis) correspond to the InterQuartile Range (defined as p25 and p75) of concentration values in the profile; markers with error sticks correspond to the median (±IQR) of factor percentage in each specie.
Atmosphere 10 00370 g001
Figure 2. (a) Monthly average of the 9 PMF factors over the whole campaign; (b) Mean contribution of each PMF factor for different PM10 loadings (from 0 to 35 µg/m3, with a step of 5 µg/m3).
Atmosphere 10 00370 g002
Figure 3. CWT result map for natural-related PMF factors (Aged Sea Salt, Secondary Marine Biogenic, Dust and Primary Biogenic). Red colors highlight potential emission zones. Scales are in µg/m3. Note that 10-day back trajectories were used for the Dust factor.
Atmosphere 10 00370 g003aAtmosphere 10 00370 g003b
Figure 4. Scatter plot of the timeseries of primary traffic (grey) and wood burning (brown) factors versus the concentrations of BCff and BCbb, respectively. Intercept for both fits was set to 0.
Atmosphere 10 00370 g004
Figure 5. CWT analysis of oxalate-rich, sulfate-rich and nitrate-rich factors. Red colors highlight potential emission zones. Scales are in µg/m3.
Atmosphere 10 00370 g005
Figure 6. Timeseries of the non-combustion sources to OA from the PMF factors (stacked filled colors), and the two independent approaches (AE33-based and EC-tracer) described in Section 2.2.
Atmosphere 10 00370 g006
Table 1. Additional error coefficients used in Equation (1) for each variable.
Variableaj Value
Carbonaceous fraction (OC*/EC)0.03
Inorganic ions0.05
Sugar anhydrides and alcohols0.1
Metals0.14
Table 2. List of constraints applied from the base run (PuM: Pull up Maximally; PdM: Pull down Maximally; SZ: Set to 0), and contribution (%) of factor in the constrain solution, compared with the unconstrained run (in parenthesis).
Wood-BurningPrimary Bio.Secondary Marine Bio.
Type of ConstrainContrib. (%)Type of ConstrainContrib. (%)Type of ConstrainContrib. (%)
LevoglucosanPuM99 (78)--SZ0 (0.9)
MannosanPuM90 (66)--SZ0 (0.68)
Arabitol--PuM100 (81)--
MSA----PuM100 (85)
EC--PdM0.17 (10)--