1. Introduction
Recent studies concluded that over 60% of European citizens live in urban areas. They share the same space and means of transport to move around. However, they also share the harmful effects of their mobility patterns and account for 40% of total CO
2 emissions from road transport and up to 70% of atmospheric pollutants [
1].
Public authorities may try to reduce CO
2 emissions by banning the use of private vehicles. However, certain individual driving techniques have proven to be effective [
2,
3,
4].
Driving style greatly influences how much fuel a car consumes. The aim of “efficient driving” is to achieve low fuel consumption while reducing environmental pollution [
5]. This simple concept includes a series of techniques, which depend on the level of the decision under consideration [
6].
Strategic decisions: Includes vehicle selection and maintenance (tyres, engine, brakes, etc.) [
7].
Operational decisions (eco-driving): Reduces fuel consumption by making gear changes at low revolutions, maintaining a constant speed, reducing accelerations and braking, and anticipating traffic by reducing the number of stops [
8].
Tactical decisions (eco-routing): Consists of choosing the itinerary with the least environmental impact. Different road types with different sections and slopes may produce different values of emissions and pollutants [
9].
This research revolves around an analysis of tactical driving decisions, i.e., eco-routing. Ericsson et al. [
10] achieved an 8.2% decrease in emissions by selecting eco-routes. Other authors [
11,
12,
13,
14] estimated that using eco-routes can reduce emissions by around 10%, although they may not save time.
Bandeira et al. [
15] and Mensing et al. [
16] had reservations about how good efficient driving techniques are, since in some cases, the reduction in fuel consumption leads to an increase in pollutants, such as NOx, CO, and particulate matter (PM).
At present global positioning system (GPS) can find the shortest routes in distance or time, but not in terms of fuel consumption or pollutants emitted. Moreover, most of the research carried out to date has been determined through theoretical models and laboratory research in large cities with congestion problems [
17,
18,
19]. Therefore, the objective of this research was to perform a test in a real-life scenario in a small city with different road types to ascertain which factors may have influenced the selection of the eco-route and in turn, to define useful environmental strategies for the authorities and road users. In particular, the influence the following factors had on several road types was studied:
Different traffic intensity.
Road characteristics (number of lanes, lane separation, pavement, etc.).
Powertrain type: Diesel and petrol.
In this research, different road types were analyzed to find the most ecological itineraries for urban mobility in a small city (eco-routes), where distances are rather short but car dependence is really high. A real life citywide survey was carried out in the city of Caceres (Spain) at different times of the day and under different traffic and weather conditions.
After the introduction,
Section 2 describes the methodology used to perform the eco-routing in Caceres.
Section 3 describes the results and
Section 4 includes a discussion comparing them with other previous studies and describes the conclusions and the policy recommendations derived from these results.
2. Methodology
For the purpose of this research, a real eco-routing test was carried out with different engines (diesel and petrol) and route types (urban roads and bypass) under different traffic conditions. The phases followed are described below:
2.1. Case Study: City of Caceres, Spain
Caceres is a city located in the southwest of Spain, where 95,000 inhabitants live in an area of 1750 km
2. It has a unique medieval old town, which was named a World Heritage site by The United Nations Educational, Scientific and Cultural Organization (UNESCO) in 1986 [
24].
Although the old town is pedestrianized, 55% of all trips are made in privately-owned cars, 33% are made on foot and only 10% by public transport. It is a hilly city, therefore, bicycles are only used for recreation and not as a means of transport [
25].
The city of Caceres excessively depends on private cars, thus new ways of persuading people to use public transport and to walk are needed. The pedestrianization of the historic center and limited-time parking areas in the center have proved to be insufficient measures for counteracting this tendency.
2.2. Routes Selection
Four different itineraries with different levels of traffic intensity were researched, all of which started at the University Campus (School of Technology) and finished at the train station (
Figure 1).
The routes selected have different characteristics but corresponded to a general classification of roads and could be applied to similar cities and traffic contexts [
26]. They have been ordered by Annual Average Daily Traffic (AADT) decrease. Route 1 (local street) was an urban street that ran through the city center. Route 2 (urban collector) was the main avenue that gave access to the conference and exhibition center, hospital, and bus station. Route 3 (perimeter) was an urban road that surrounded the city. Route 4 (arterial road) was an urban motorway (level intersections with roundabouts) recently built as a city bypass. The first 3 routes were urban roads and the last one was a bypass.
Table 1 shows the main characteristics of each of the selected routes.
Figure 2 represents a comparison of driving styles on each route, highlighting maximum speeds and the number of stops.
2.3. Driver and Car Selection. Scheduling
The campaign was organized with 12 drivers of different gender, age, and driving styles. The chosen sample consisted of a total of 8 men and 4 women between 21 and 44 years old, which accounts for over 51% of drivers in the Caceres census [
27].
The cars used in the experiment were an Opel Astra 1.6 l diesel and a Fiat 500 1.2 l petrol. They represented the small and medium-sized segments, respectively, and accounted for approximately 70% of the fleet in Caceres [
28]. Technical information on both vehicles is shown in
Table 2.
Testing was carried out from the 2 May to 7 May 2017. Three driving turns of 4 h were established for each car in which two different drivers took turns every hour to avoid fatigue. Drivers travelled the 4 routes continuously and randomly for 12 h a day in order to drive in different traffic situations (free flow, moderate, and congestion). Weather conditions also varied as one day it rained, 2 days were cloudy, and the rest were rather sunny.
Caceres mobility data [
30] was used to adjust driving turns and cover peak hours. In Caceres, there are 3 peak hours related to the main movements of traffic in the city. Between 8 a.m–9 a.m: Dropping off at schools and arrivals at places of work (10% higher than the average), 2 p.m: Lunch (28% above the average) and between 6 p.m–7 p.m. returning home (15% above the average). In light of this, the following driving turns were selected:
1st period. Morning peak hour: 7:30–11:30 am
2nd period. Lunchtime: 12:00–4:00 pm
3rd period. Evening peak hour: 4:30–8:30 pm
2.4. Data Acquisition and Fuel Consumption
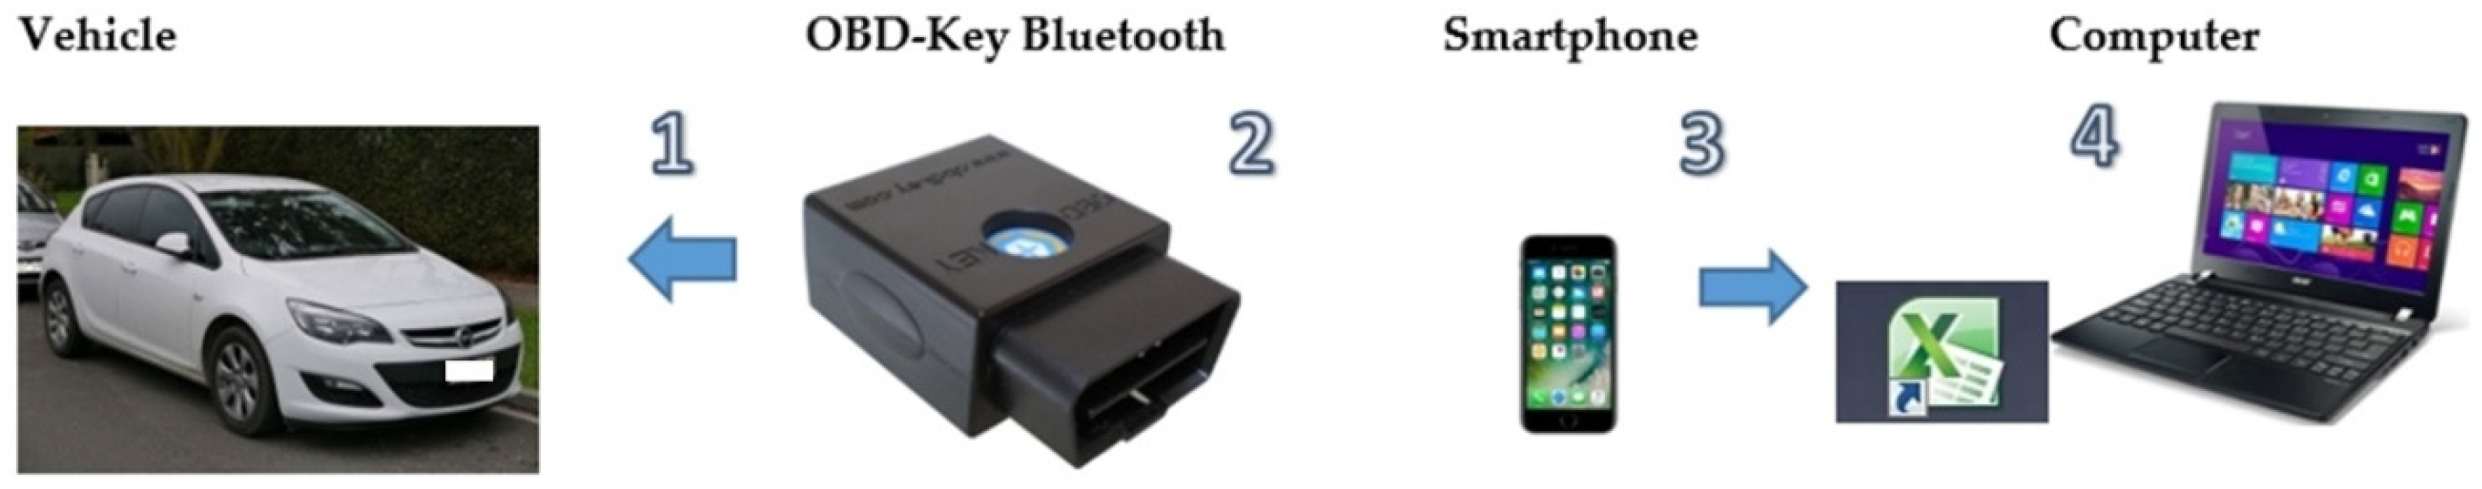
The study was based on an analysis of the driving parameters for each of the sample segments, which were measured using an OBD-key device installed on board (
Figure 3).
The OBD-key [
21] was a device used for measuring vehicle performance and it could monitor 128 variables by the second, including GPS position, travel time, revolutions per minute (rpm), speed, and fuel consumption. A mobile application was used to send this information to a smart phone, with which all the data could be managed on a standard spreadsheet.
In previous research [
31,
32], it was concluded that the most influential fuel consumption factors were the number of stops, rpm, and acceleration/deceleration. Therefore, these parameters were analyzed as well.
2.5. Pollutants Estimation
COPERT 5.2.2 [
22] was used to estimate pollutants emitted by both types of cars. COPERT is a program created as a European tool for calculating emissions from the road transport sector. It uses vehicle type, mileage, speed, and other data such as ambient temperature, and calculates emissions and energy consumption for a specific country or region. This program was developed to compile national emission inventories and has some limitations, especially in urban areas. Therefore, in this research, COPERT was used for comparing emissions on different routes but not for calculating an accurate pollutant value. Research input data are included in
Table 3. The emissions equations are valid for Spain, even though they were customized for Caceres and the vehicles used in the experiment.
With this methodology, the study produced the following outputs: Fuel consumption, CO2, and regulated pollutants emissions (NOx, CO, VOC, PM) for different types of vehicle, routes, and drivers.
4. Discussion and Conclusions
In this paper different factors that influenced the choice of eco-routes in a small city such as Caceres in Spain were studied. For this purpose, two cars (petrol and diesel) were monitored and 12 people drove for a week along with four different route types.
The results showed that on the local street route (the shortest) there were the fewest CO2 emissions and lowest pollution. This meant that consumption and emissions in cities like Caceres mostly depend on the distance travelled and not on other factors like time spent or the number of stops.
Slopes are rather similar and lower than 3% on average, therefore, we cannot measure their influence [
34]. The R1-local street had the highest slope but it was also the one with the lowest consumption.
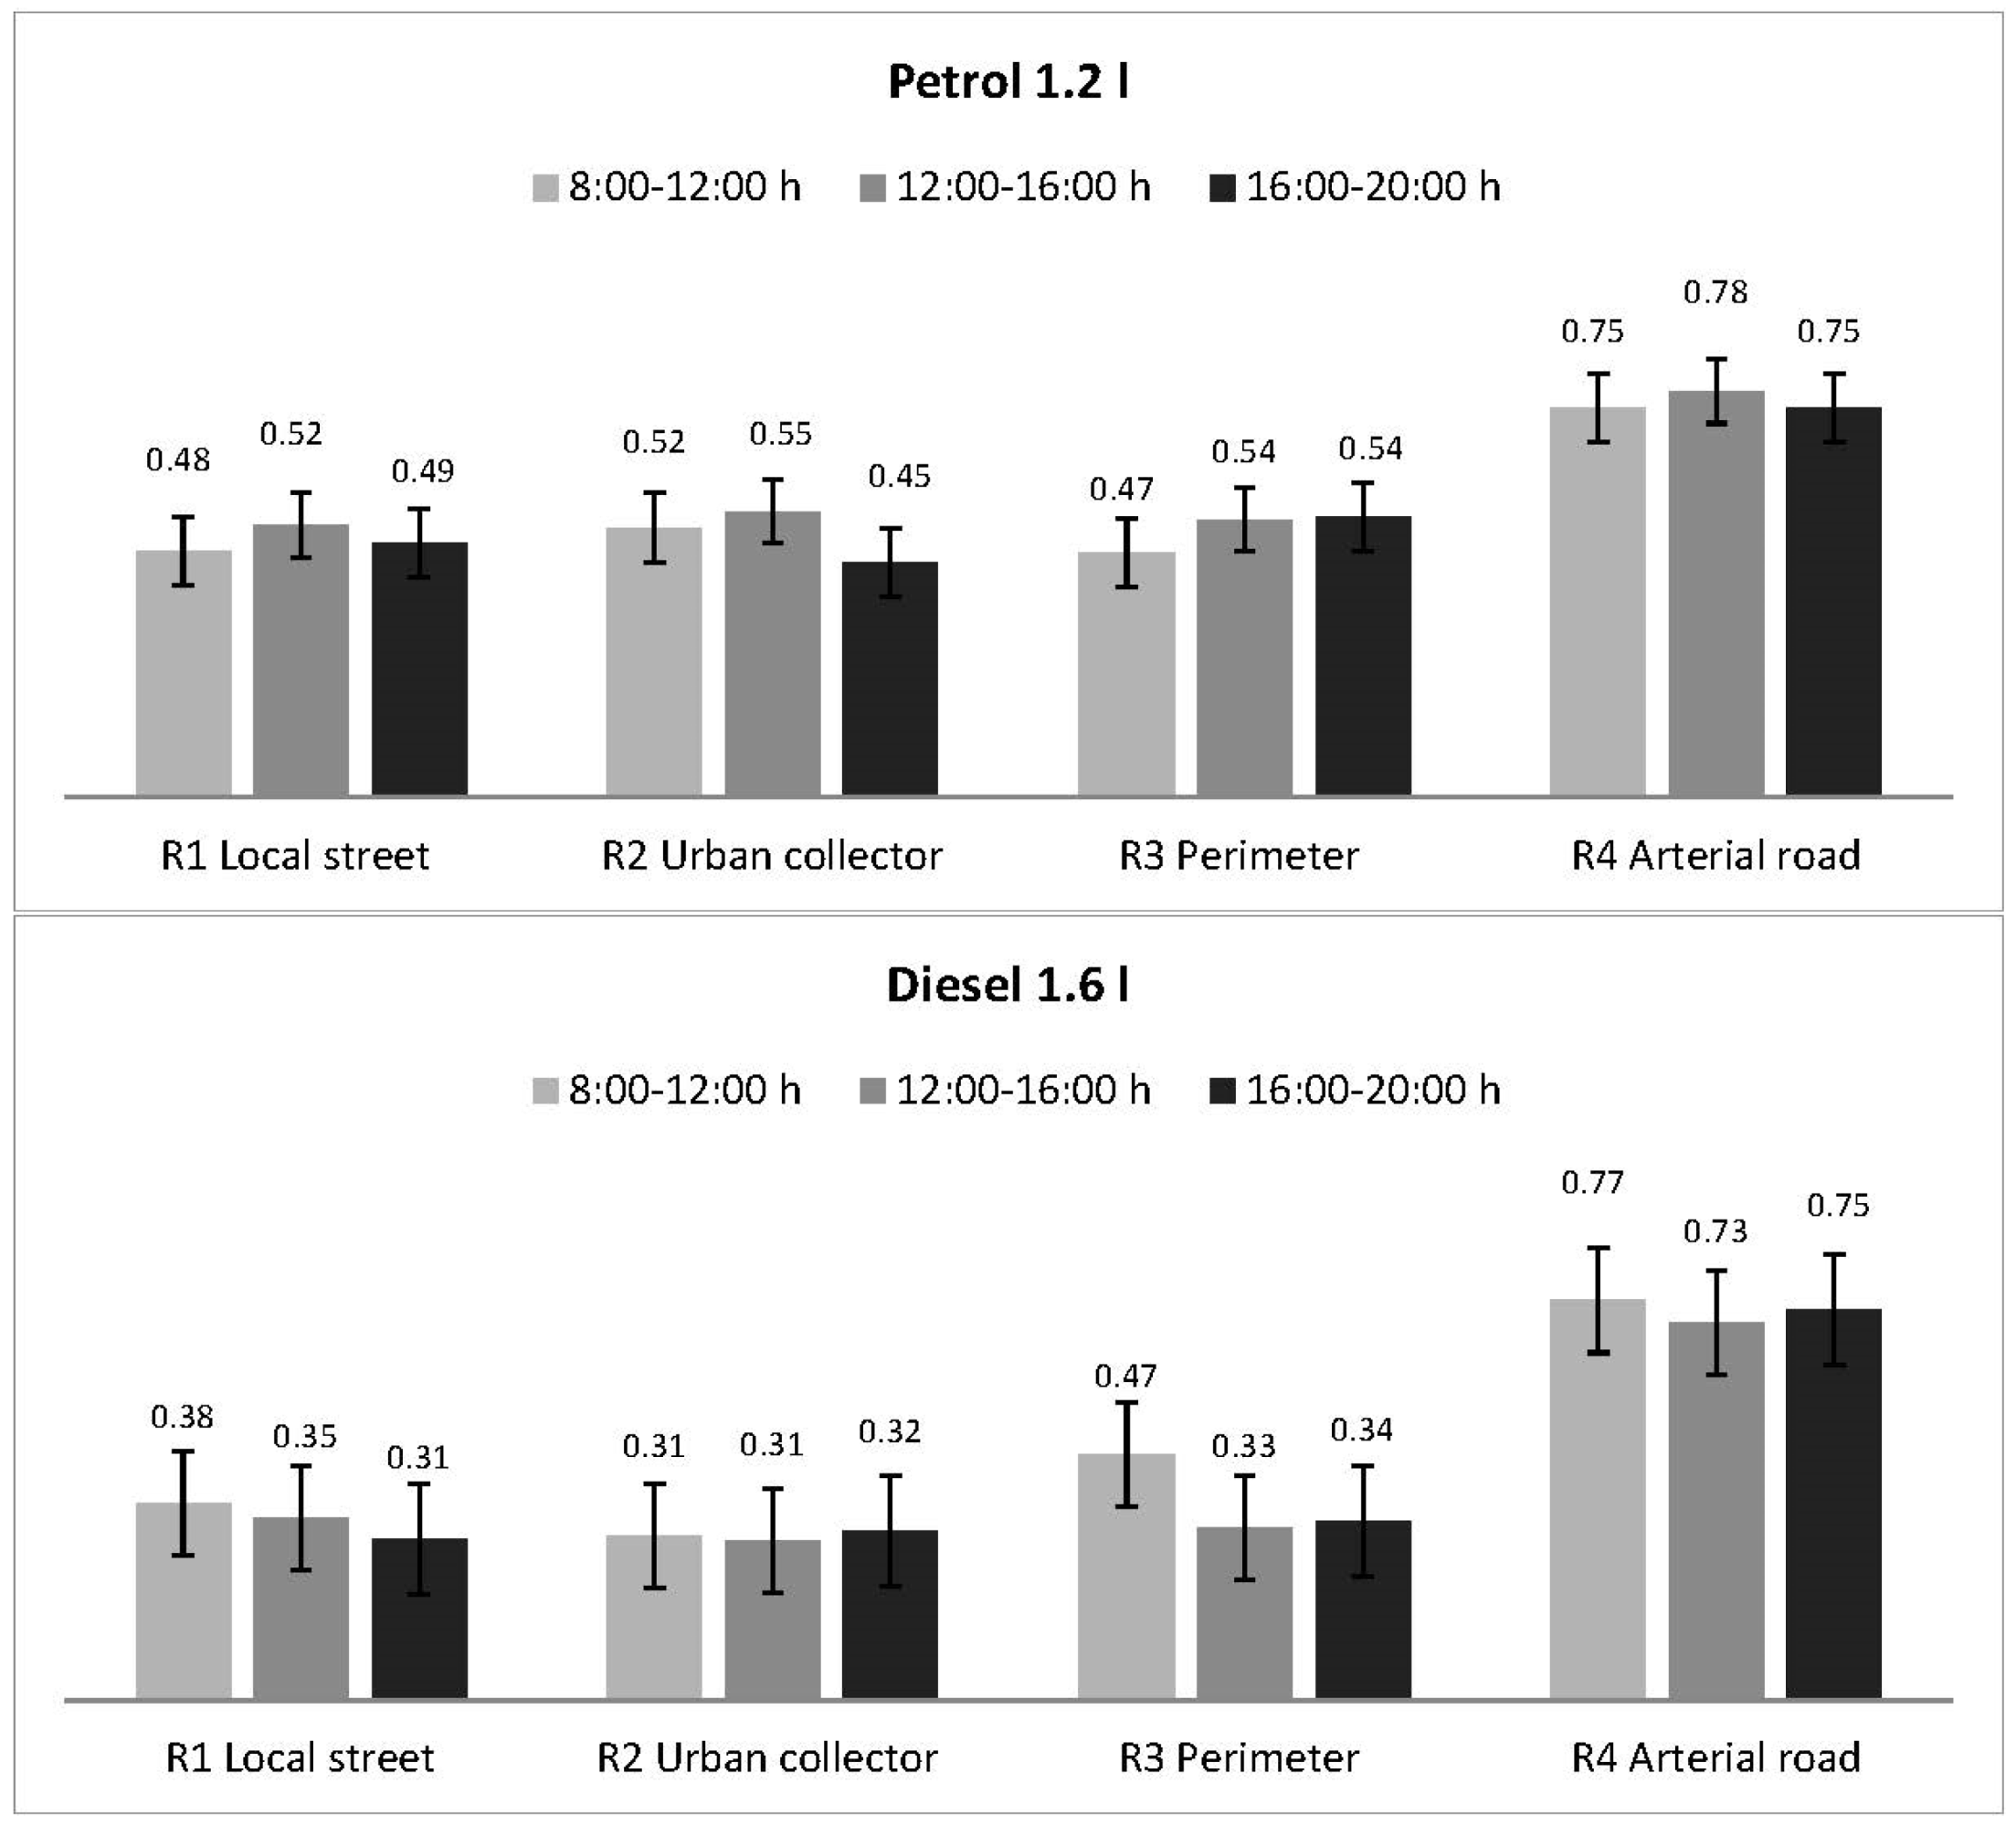
When choosing urban routes (local street, urban collector, and perimeter) as opposed to the bypass (arterial road) there was a decrease in total fuel consumption/CO
2 emissions of 34% in petrol engines and 54% in diesel ones. In the studies mentioned in the introduction [
10,
11,
12,
13,
14], savings of only around 10% were reported. However, in other studies savings from 15% to 33% [
15,
35,
36,
37] were found, which are similar to those in this research. Consumption on the eco-route is always the lowest due to the difference in the length of the route. In Caceres, urban routes are 6.7 km long and the arterial road is 10.3 km.
As for air pollution, pollutant emissions were reduced on urban routes by 35% on average. This result was higher than the savings reached in other green driving experiments, where in situations without important congestion levels, there were reductions of 13.8% and 20% [
38,
39]. However, if there is very high congestion, air pollutants could increase a lot, as reported by Bandeira et al. [
15] for CO (150%) and NOx (46%).
Drivers using the arterial road (bypass) reduced their travel time but were responsible for more CO
2 emissions and air pollutants. However, by transferring traffic to external itineraries there was less congestion and emissions on the urban roads. Therefore, there needs to be a balance among the different itineraries in order to obtain the best overview: To reduce overall emissions and particularly pollution levels in denser areas, thereby reducing the exposure of pedestrian and cyclists to black carbon [
40].
All in all, choosing urban routes in a small city reduces CO
2 emissions and pollutants but increases emissions for the population that mostly live in the city center.
Table 6 shows the advantages and disadvantages of choosing different itineraries.
These results obtained for a small city (Caceres) are similar to those obtained in a large city such as Madrid [
38].
Policy Recommendation and Future Research
This research shows that on the urban routes tested, there is less consumption, CO2 emissions, and pollutants. The consumption and emission values for the urban routes are very similar although their characteristics change, e.g., one-lane local streets have similar consumption and emissions to urban collector with 2+2 lane roads. Therefore, whenever less traffic congestion in small cities is needed, in light of this research, duplicating lanes (changing local streets to urban collectors) is preferable to building new city bypasses, which would mean higher construction costs and greater environmental damage.
A problem may arise if all drivers used the urban routes, which would lead to increased congestion. Future research should model these effects as done in big cities [
38,
41]. Moreover, how emissions are dispersed and how citizens inhale emitted pollutants would be highly important research. In addition, knowledge must be gained on how users accept eco-routes when that means a higher trip duration in order to reduce environmental harmful effects.
COPERT has been used to compare pollutants on different itineraries. However, COPERT shows problems to explain how speed varies with congestion, leading to under-estimations in pollutant emissions and fuel consumption in urban areas. The Passenger Car and Heavy Duty Emission Model (PHEM) for modelling on a small spatial scale [
42] could be used in future research.
Results of this research indicate diesel vehicles behaved very similarly on urban and suburban routes. However, petrol cars had the same consumption values on the bypass but produced greater consumption on urban roads (total and unitary per kilometre). Therefore, traffic conditions had more influence on fuel consumption in petrol vehicles than diesel ones.
Promotional activities for selecting eco-routes in addition to other measures such as speed control, pedestrianization of the historic center, and limited-time parking are recommended for changing behavior in order to achieve sustainable city targets.


