Article

Wintertime Variations of Gaseous Atmospheric Constituents in Bucharest Peri-Urban Area

by
Cristina Antonia Marin
1,2,
Luminiţa Mărmureanu
1,*,
Cristian Radu
1,
Alexandru Dandocsi
1,2,
Cristina Stan
2,
Flori Ţoancă
1,
Liliana Preda
2 and
Bogdan Antonescu
1,3
1
National Institute of Research and Development for Optoelectronics INOE 2000, Str. Atomiştilor 409, Măgurele, RO077125 Ilfov, Romania
2
Department of Physics, Politehnica University of Bucharest, Str. Spl. Independenţei 313, RO060042 Bucureşti, Romania
3
Faculty of Physics, University of Bucharest, RO077125 Bucureşti, Romania
*
Author to whom correspondence should be addressed.
Atmosphere 2019, 10(8), 478; https://doi.org/10.3390/atmos10080478
Submission received: 11 July 2019 / Revised: 6 August 2019 / Accepted: 16 August 2019 / Published: 20 August 2019
(This article belongs to the Special Issue Atmospheric Composition and Cloud Cover Observations)

Abstract

:
An intensive winter campaign was organized for measuring the surface air pollutants in southeastern Europe. For a three months period, the gas concentrations of NO x , SO 2 , CO, O 3 , and CH 4 as well as meteorological parameters were simultaneously sampled to evaluate the variations and characteristic reactions between the gases during winter at the measuring site. The photochemical production of the ozone was observed through the diurnal variation of ozone and the solar radiation, the maximum concentration for ozone being reached one hour after the maximum value for solar radiation. A non-parametric wind regression method was used to highlight the sources of the air pollutants. The long-range transport of SO 2 and two hotspots for CO from traffic and from residential heating emissions were emphasized. The traffic hotspot situated north of the measuring site, close to the city ring road, is also a hotspot for NO x . The air quality during the cold season was evaluated by comparing the measured gas concentration with the European limits. During the measuring period, the values for NO 2 , CO, and SO 2 concentration were at least two times lower than the European Union pollution limits. Only twice during the study period was the concentration of O 3 higher than the established limits.

1. Introduction

The atmospheric constituents, gases and aerosols have been intensely studied in the past decades [1,2,3] due to their dramatic influence the human life. The gases and aerosols are produced by natural and anthropological processes. According to the latest Intergovernmental Panel for Climate Change (IPCC) report [3] and United Nations Framework Convention on Climate (COP24) report [4], the predominant sources for greenhouse gases are 35% from energy industry for electricity and heat generation, 24% from agriculture, 21% from industry, 14% transport and 6% from buildings. The sources for aerosols, and especially for fine particles, are 25% from traffic, 15% from industries including the electricity generation sector, 20% from domestic fuel combustion, 22% from other human origin activities and only 18% from natural sources. Consequently, for both gases and aerosols, the anthropogenic sources account for approximately 70–80%.
Recent studies focused on the direct and indirect effect of gases and aerosols on radiative budget [1,3], human health [4], as well on biogeochemical cycles [3]. Atmospheric constituents can change the radiative balance of the Earth through cooling or heating the atmosphere. In recent years, not only the greenhouse gases (i.e., carbon dioxide (CO 2 ), methane (CH 4 ), ozone (O 3 ), nitrous oxide (N 2 O), and fluorinated gases), which have a warming effect [5], but also the effect of minor gases are investigated [3]. It has been shown that volatile organic compounds (VOC) have a warming effect, sulfur dioxide (SO 2 ) has a cooling effect, while nitrogen oxides (NO x ) and aerosols can generate both effects [4]. In addition, it has been shown [2,6] that the indirect effect of atmospheric compounds (organic aerosol, nitrate, and sulfate) is influencing the cloud formation (i.e., atmospheric compound are acting as cloud condensation nuclei).
The impact of gases (carbon monoxide (CO), O 3 , NO x , abd VOC) and aerosols (e.g., brown carbon and organic aerosols including polyaromatic hydrocarbons) on health represent is a topic of high interest [4,7] because they can generate mainly respiratory and cardiovascular problems. The statistics [4] show that deaths related to air pollution are caused by ischemic heart disease (26%), strokes (24%), chronic obstructive pulmonary disease (43%) and lung cancer (29%). Recent studies are focused mainly on atmospheric evolution of gases composition based on global emission inventory and biogenic models [8]. The anthropogenic emissions, which are insufficiently characterized (e.g., those that are produced by residential heating) in some areas, are estimated to increase. Thus, they will have a high impact on human health if no regulations are adopted [2].
Due to this great impact, reducing atmospheric pollution represents a priority for society [3], requiring a deep understanding of the chemical and physical processes that lead to the formation or depletion of atmospheric compounds. The continuous interactions between gases and aerosols facilitated by meteorological parameters represent an important issue in reducing the concentration of air pollutants. For example, in the presence of OH radicals, VOC can oxidize nitric oxide (NO) to NO x , thus increasing the O 3 production during the day. O 3 increases with the VOC concentration, while increasing the NO x concentration may generate an increase or decrease of the O 3 level, depending on the existing ratio between VOC and NO x [9].
The importance of the studies on atmospheric gases evolution was worldwide recognized in the last century [8,10]. In Europe, the majority of studies on atmospheric gas evolution focus on Northern, Southern, and Western Europe [10,11,12] and, to a lesser extent, on Eastern Europe [13,14,15,16]. The aim of this study was to provide, for the first time to the authors’ knowledge, a comprehensive study of the gaseous atmospheric constituents in a peri-urban area in Romania, a country situated in Eastern Europe. In this study, gas reactions were evaluated during the cold season (1 December 2017–4 March 2018). The analysis for the three months period was focused on the temporal variation of NO x , SO 2 , O 3 , CO, NO 2 , NO, and CH 4 , together with meteorological parameters.
This article is structured as follows. Section 2 describes the methodology, the data treatment, and processing. The diurnal behavior and the chemical reactions (as nighttime or daytime chemistry) dominant during winter together with the spatial source origin of the measured air pollutants are described in Section 3. Finally, Section 4 summarizes the results of the study.

2. Methodology

2.1. Measurement Site

The measurement site is located at the Romanian Atmospheric 3D Observatory (RADO) placed at Măgurele, a small residential city, situated 10 km south from Bucharest, the capital city of Romania, and approximately 2 km from the ring road of Bucharest. Măgurele is located in a peri-urban area influenced by urban sources and by agriculture activities from the neighboring areas [17,18,19,20,21]. The measurements were organized over a three months period from 1 December 2017 to 4 March 2018 as a part of the EMEP (European Monitoring and Evaluation Programme)/ACTRIS (Aerosol, Clouds and Trace Gases Research Infrastructure)/COLOSSAL(Chemical On-Line cOmpoSition and Source Apportionment of fine aerosoL-Cost action) international campaign that involved 57 sites in 24 countries all over Europe. The aim of this wintertime intensive measurement campaign was to evaluate the gases concentration used as tracers for the emission sources.

2.2. Measurements

The gases sampled during campaign were: NO, NO 2 , NO x , O 3 , SO 2 , CH 4 , and CO. In addition, the meteorological parameters were also measured (i.e., temperature, wind speed, wind direction, relative humidity, solar radiation, and rainfall). For gases sampling, Horiba monitors (370 Horiba) with standard measurement principles (SR EN 14212, SR EN 14211, SR EN 14625, SR EN 14626, and SR EN 12619) were used. The CO monitor uses a non-dispersive infrared absorption with cross flow modulation technology. The SO 2 is measured using UV fluorescence: a Xe lamp is used to excite the molecules which emit a characteristic fluorescent signal in the range 220–420 nm. The NO x monitor is based on a cross flow modulation chemiluminescence method, using the reaction between NO and O 3 to form excited molecules of NO 2 * . Returning to the ground state, the chemoluminscence signal, emitted is in the range 600–3000 nm, is proportional to the concentration of the NO. For NO 2 measurements, a converter is used to transform NO 2 to NO. The CH 4 monitor uses a flame ionization detection method with selective combustion.
The Horiba analyzers were calibrated before the start of the campaign using the recommended procedures by the manufacturer. Every measured point was selected for the analysis after passing the validity and error status flags implemented in the data acquisition software. Outliers (defined as points that were measured for a period less than ten minutes with an increased concentration by a factor of 3 relative to the ten-minute average of the measured neighbor points) were manually removed. The gas data were sampled every 3 min and were averaged to the same time stamp as the meteorological parameters at each 10 min or at different time intervals (i.e., 1, 8 or 24 h) to compare with the European limits. The gases data matrix was re-gridded using the time from the meteorological measurements as data stamp. For every three gases samples, 1 min data were obtained through linear interpolation and then averaged at 10 min to obtain the same data stamp as meteorological parameters.
Meteorological data were sampled with a 10 min resolution, at 15 m above the ground, using the meteorological sensors (temperature, wind direction, relative humidity, solar radiation, and rainfall) integrated in the Environmental data Compact Weather Data Recording System. The wind speed data were provided by the National Environmental Agency, from the sampling site in Măgurele, situated 100 m from the RADO site.

2.3. Data Treatment and Processing

The diurnal trend and weekday variation were computed for NO, NO 2 , NO x , O 3 , SO 2 , CH 4 , and CO to highlight the specific variations and the local sources. The non-parametric wind regression (NWR) method was used to evaluate the spatial distribution of the pollutants’ concentration [22] and to assess the local and long range transported sources. This technique uses wind data and concentration of measured chemical species to identify wind speed and direction that are associated with high concentrations, thus indicating the presence of a source. As described by Henry et al. [23], for every angle θ (wind direction) and v (wind speed), an expected concentration is calculated by weighting the measured concentration with the following Kernel functions
K 1 x = 1 2 π e 0.5 · x 2 < x <
K 2 x = 0.75 1 x 2 , 1 < x < 1 0 , otherwise .
The expected concentration for every pair, E C | θ , v is calculated using the following relation
E C | θ , v = i = 1 N K 1 θ w k σ K 2 v s j u C i i = 1 N K 1 θ w i σ K 2 v s i u
where w i and s i are the measured wind direction and speed, respectively; C i is the concentration of the pollutant; N is the total number of data points; and σ and u are smoothing parameters. Then, the expected concentration for every pair is weighted by the frequency of the wind parameters and the final mean concentration, S θ , U , associated with the wind speed in the interval V = v 1 , v 2 and the wind direction in the interval W = θ 1 , θ 2 , is
S θ , U = Δ v Δ θ N σ u θ k = θ 1 θ 2 v j = v 1 v 2 i = 1 N K 1 θ w i σ K 2 v s i u C i
For the NWR method, ZeFir [22] was used. The software is freely available at https://sites.google.com/site/zefirproject/home (accessed on 1 May 2019). In our study, the smoothing parameters used were: angle smooth of 22.98 and radial smooth of 3, as automatically estimated by the Zefir software.

3. Results

3.1. The Diurnal Behavior and Chemical Reactions

The campaign period was characterized by an average temperature of 2.7 C, typical for a warm winter, with the temperature ranging from −15 to 17.5 C. The negative values for temperature represented only 22.5% of all measured values. The diurnal pattern of the temperature highlights the minimum value (0.33 C) at 05:00 UTC, while the highest value (15.7 C) was recorded around 13:00 UTC. The relative humidity during the measurements period was high, the average for the entire period being 91%, while the diurnal trend varying 78–98%. During the entire campaign, the wind speed had an average value of 1 m s 1 , which is characteristic for calm conditions, and varied between 0 and 4.9 m s 1 .
The diurnal trend of solar radiation showed a maximum peak of 44 W m 2 at 11:00 UTC having an average for the entire period of 10 W m 2 . The solar radiation represents an important factor that modulates the O 3 formation. The time series of the solar radiation was well correlated with the O 3 concentration (Figure 1). The highest concentration for O 3 (i.e., 76 ppb) was reached 2 h after the maximum value of the solar radiation of 126 W m 2 on 1 March 2018 at 11:20 UTC. In Figure 1, the anti-correlation between NO x and O 3 can also be observed, the direct reactions between these two gases being responsible for this behavior.
The reactions in troposphere that describe the relations between NO x and O 3 are [11,24,25]
NO 2 + h ν λ < 0.424 μ m NO + O *
O * + O 2 O 3 + M
O 3 + NO NO 2 + O 2
where M is a molecule (N 2 or O 2 ) that absorbs the vibrational energy in excess. The reactions represent a null cycle, the total mixing ratio of NO x and OX (NO 2 + O 3 ) remain unchanged, but allows the partitioning between their components (NO and NO 2 for NO x , and NO 2 and O 3 for OX). During daytime, NO 2 , NO, and O 3 are in equilibrium for a few moments forming a photo-stationary state. For the stationary state, the components are linked through the following relation
NO × O 3 = J 2 k 1 × NO 2
where J 2 is the rate for NO 2 photolysis and k 1 is the rate coefficient for the reaction of NO with O 3 and it depends exponentially on the temperature [26]
k 1 ppm 1 min 1 = 3.23 × 10 3 exp 1430 T
These chemical pathways lead to the in situ O 3 production in the troposphere through the NO x reactions, thus O 3 can be considered secondary pollutant. NO and NO 2 concentrations had a peak in the morning, corresponding to the morning traffic hour and when a minimum in O 3 concentration was observed (Figure 2). During daytime, NO decreased with the increase of solar radiation, reaching a minimum value around 13:00 UTC. The oxidation of NO to form NO 2 , according to (7), was also observed in the measured data, the NO 2 concentrations being higher than the NO concentrations all day, except the morning hour peak, when the emission of NO occurred. The NO x emissions from combustion processes were formed mainly (90%) from nitric oxide and the rest was nitrogen dioxide [27]. Thus, NO was the primary pollutant and NO 2 and O 3 were secondary products. The Pearson correlation coefficients between NO x and NO 2 was 0.8, while for NO x and NO was 0.98.
Using the NWR model, the NO source was identified as situated north of the sampling site, where the Bucharest ring road represents the main contributor (Figure 2). NO 2 had a similar pattern to NO, the concentration being more widely distributed in space, due to a longer residence time compared with NO, and it was transported longer distances before producing O 3 . The NO x source plot (Figure S2) emphasizes the sources for NO and NO 2 in the northern part.
The maximum value in solar radiation corresponded to a minimum in NO 2 concentration, while the maximum O 3 concentration was reached 1 h after the peak in solar radiation. Starting from 06:00 UTC, the photochemical reactions were enhanced, since the solar radiation started to increase. A negative correlation between O 3 and NO x was observed, the Pearson coefficient being −0.44, as ozone diminished while NO x increased [9].
The weekly diurnal (Figure S3) of NO, NO 2 and NO x showed an increasing trend during the week, the maximum concentration being reach on Friday, while the minimum concentration for NO x being on Sunday, corresponding with the maximum concentration for O 3 . The authors speculate that Friday represents the start of the weekend with usually more intense traffic on the Bucharest ring road and Saturday is also characterized by high traffic, more related with recreational activities (e.g., shopping), unlike Sunday when traffic is reduced and the activities are mainly indoors.
Ozone presented an opposite weekly variation compared with NO x . The minimum O 3 concentration (17 ppb) was reached on Friday, corresponding to the maximum concentration for NO x (25 ppb). The maximum concentration for O 3 (23 ppb) was on Sunday, corresponding to a minimum NO x (7 ppb). This behavior explains the correlation and chemical reaction between NO x and O 3 , which was also underlined by the diurnal pattern.
CH 4 and CO sources are diverse, being associated with combustion (fossil fuel or biomass burning) or with microbiological activity (e.g., from waste deposition for methane) [28]. In our case, one of the main sources for CH 4 and CO was represented by exhaust engines. The diurnal patterns of CH 4 and CO showed similar trends as the NO x diurnal variation, with higher concentration during the morning (05:00–06:00 UTC) and evening (around 19:00 UTC) (Figure 3). The diurnal pattern of CO presented a peak at 06:00 UTC of 0.42 ppm, but this value was lower than the midnight concentration, which was around 0.45 ppm. After 15:00 UTC, the CO concentration started to increase up to 0.51 ppm, the maximum evening peak. This behavior for CO can be explained by the diurnal planetary boundary layer (PBL) evolution and the presence of two main sources, traffic and residential heating. The peak in the morning was more influenced by the traffic, while, in the evening, besides the traffic, residential heating contributed as well. This explains why the peak concentration in the second part of the day appeared at a later hour. These sources for CO were highlighted also by the NWR model, the estimated concentration for CO being higher in the northern part, but other minor sources contributed as well in the surrounding zone of the measuring site (Figure 3), probably produced by residential heating. This hypothesis is reinforced by the large number of houses in that area. According to the 2011 Annual Census (Ilfov Annual Census, 2011, http://www.prefecturailfov.ro/Biroul-de-Presa/Comunicat%20-%20DATE%20PROVIZORII%20RPL%202011_JUDET_Ilfov.pdf, accessed on 5 August 2019), in Măgurele, 3376 housing units are distributed over 45 km 2 .
For CH 4 , the diurnal analysis emphasized higher concentration in the first part of the day, with a morning peak of 2.72 ppm at 05:00 UTC. An evening peak could also be identified, the concentration being around 2.62 ppm at 19:00–20:00 UTC. This behavior with higher concentrations in the morning and in the evening were similar to the NO x diurnal pattern, indicating a traffic source for CH 4 as well [29]. The source for CH 4 in our case, derived from the NWR model (Figure 3), emphasized higher concentrations in N and the ESE part, possibly due to traffic to the N and a landfill situated 7 km from the sampling site to the SE. This landfill is one of the largest landfills in the southeast of the country with a total surface of 38.6 ha. The capacity of this landfill is 486,384.68 t year 1 , with a daily flow of 2400 t of waste. The frequency of waste disposal is one garbage truck every 5 min. This information was obtained from an online resource (https://ecosud.ro/en/depozitul-ecologic-vidra-bucuresti/, accessed on 31 July 2019). The emission of CH 4 from the solid waste disposal has been previously described [28,30].
The minimum concentration for CO and CH 4 occurred at noon, corresponding to maximum values for solar radiation and PBL height. These patterns can be explained by the OH oxidation described by the following equations [24].
OH + CO CO 2 + H
OH + CH 4 CH 3 + H 2 O
In the atmosphere, OH is produced from the photooxidation of the ozone and followed by the reaction with water. The OH diurnal trend, with a maximum value at noon [31,32] and the diurnal trend of CO and CH 4 support the OH oxidation and the formation of CO 2 and CH 3 . The pathway for methane oxidation continues and produces water vapor and CO that is oxidized to CO 2 , thus the oxidation of CH 4 generates other greenhouse gases (CO 2 , stratospheric water vapor, and O 3 ) and important atmospheric oxidants (O 3 and OH) [33]. In addition, CH 4 is the second most important greenhouse gas after CO 2 , and its lifetime is 8–10 years [33]. Most CH 4 is removed through OH oxidation and only a small fraction is removed through surface deposition [33]. Thus, CH 4 oxidation represents a method for OH loss and any increase in the CH 4 concentrations will suppress OH and increase the CH 4 lifetime and concentration [33].
CO and CH 4 can also contribute to O 3 formation through photochemical processes that could be more important during summer. The correlations between O 3 and CO could explain the production or consumption of O 3 [34] depending on the intensity of photochemical processes. The negative correlation suggests O 3 destruction through photochemical reactions or CO production. The moderate correlations and small slopes showed the incomplete photooxidation of fresh emitted plumes, which did not reach the O 3 production potential. In our study, the Pearson coefficient for O 3 and CO had a negative value of −0.47, similar to other winter measurements [35], possibly due to the O 3 destruction through the NO x titration. CO did not directly affect the O 3 concentration but was emitted together with NO x (the Pearson coefficient of CO and NO x was 0.73). Thus, the negative correlation between O 3 and CO could be explained by the NO x -O 3 chemistry [36]. The minimum concentration for CO, 0.3 ppm during 11:00–13:00 UTC, coincided with the maximum value for ozone, approximately 28 ppb.
Weekly variation of CO concentrations (Figure S4) did not show a specific pattern, except for a slight increase on Friday, with a mean concentration of 0.48 ppm and a minimum concentration of 0.36 ppm on Sunday. This trend, with higher concentrations on Friday, which had the same appearance as NO x as well as the Pearson coefficient between CO and NO x of 0.73, suggest that they can be produced by same source.
Another tracer used in our study was SO 2 , which can be emitted by biomass burning as a minor source [37], volcanoes emissions and anthropogenic activities such as fossil fuel combustion [24]. In addition, it can be formed by the oxidation of other sulfur gases such as H 2 S, DMS, COS, and CS 2 produced by soils, plants, marshlands and oceans due to phytoplankton activity [24]. The reactions in the atmosphere, which involve the oxidation of SO 2 mainly by the OH radical and only in aqueous phase, are as follow [24]:
SO 2 + OH + M HSO 3 + M
HSO 3 + O 3 HO 2 + SO 3
SO 3 + H 2 O H 2 SO 4
The measured SO 2 diurnal variation during the winter campaign had a peak at noon, the maximum concentration being recorded at 12:00 UTC with a value of 2.6 ppb (Figure 4). The diurnal pattern of SO 2 in Figure 4 cannot be explained by the OH oxidation reactions, but could be explained by the multi-step reaction of H 2 S with the OH radical [24]. In the atmosphere, H 2 S is produced by marshlands and reactions in soil [24].
OH HS , H 2 O SO 2
In our case, the location of the sampling site, surrounded by agricultural areas, could be insufficient to explain this pattern due the lack of agriculture activities during the cold season. Several other cases with noontime peaks of the SO 2 diurnal pattern have been observed around the world. Adame et al. [11] observed occasionally maximum values of SO 2 concentration during noontime in central Spain attributed to transport from industrial areas. In the North China Plain, the case of noontime SO 2 peak is more often, with an occurrence of 50–75% at four different sites during more than a year measurements data [38]. The authors attributed this pattern to four possible cases: down-mixing of high concentrations in the planetary boundary layer, influence from the mountain–valley breezes, severe fog and haze events, and transport of plumes. In our case, the influence of mountain or valley winds does not apply as the measuring site is situated on a plain (i.e., Bărăgan Plain) and the mountains are approximately 100 km away from the measuring site. The hypothesis of mixing in the PBL and the influence of severe fog or haze events would have caused different behavior in other gases measured during the intensive measurement campaign as well. The only possible cause could be transport from different regions. This hypothesis was validated by the source identification, the model showing a hotspot in the W–SW associated with wind speeds higher that 2 m s 1 , suggesting the transport of SO 2 from other regions (Figure 4).
The weekly variation of SO 2 (Figure S4) showed the maximum value (2.2 ppb) on Friday, similar to NO x and CO, while the minimum concentration was about 1.5 ppb on Wednesday.

3.2. Assessment of Time Series Concentrations Relative to the European Regulations

The average, maximum and minimum values for all parameters measured during the cold season campaign are shown in Table 1. The O 3 mean concentration had a value of 19.45 ppb, lower that the annual mean concentration reported in the United Kingdom in 2017 (25.7 ppb) [39]. The highest concentration for O 3 reported in Bucharest was 0.958 ppm in an urban area with intense traffic, while in the rural area the maximum value measured was 0.250 ppm [13].
The SO 2 mean value for the winter campaign was 1.71 ppb and the maximum was 23 ppb. The mean value was lower than the previous values reported in a traffic area in Bucharest, 12 ppb [13], or in other cities in Europe: 3 ppb in Spain [11], and around 2 ppb, as the lowest value report during a two-week winter campaign in Prague [10]. For nitrogen oxides, the mean value was 16.3 ppb, of which the higher proportion was NO 2 (60%) with an average of 9.7 ppb. However, the maximum value recorded was higher for NO, 237 ppb, because it had a greater proportion during primary emission. In the literature, the NO x values reported are 70 ppb for Bucharest traffic area [13], and from 34 to 52 ppb monthly average during winter in China [40]. The CO measured in the present study had an average concentration of 0.4 ppm, while the maximum value during the campaign was 11 ppm, higher than the maximum measured previously in Bucharest (1.54 ppm) [13].
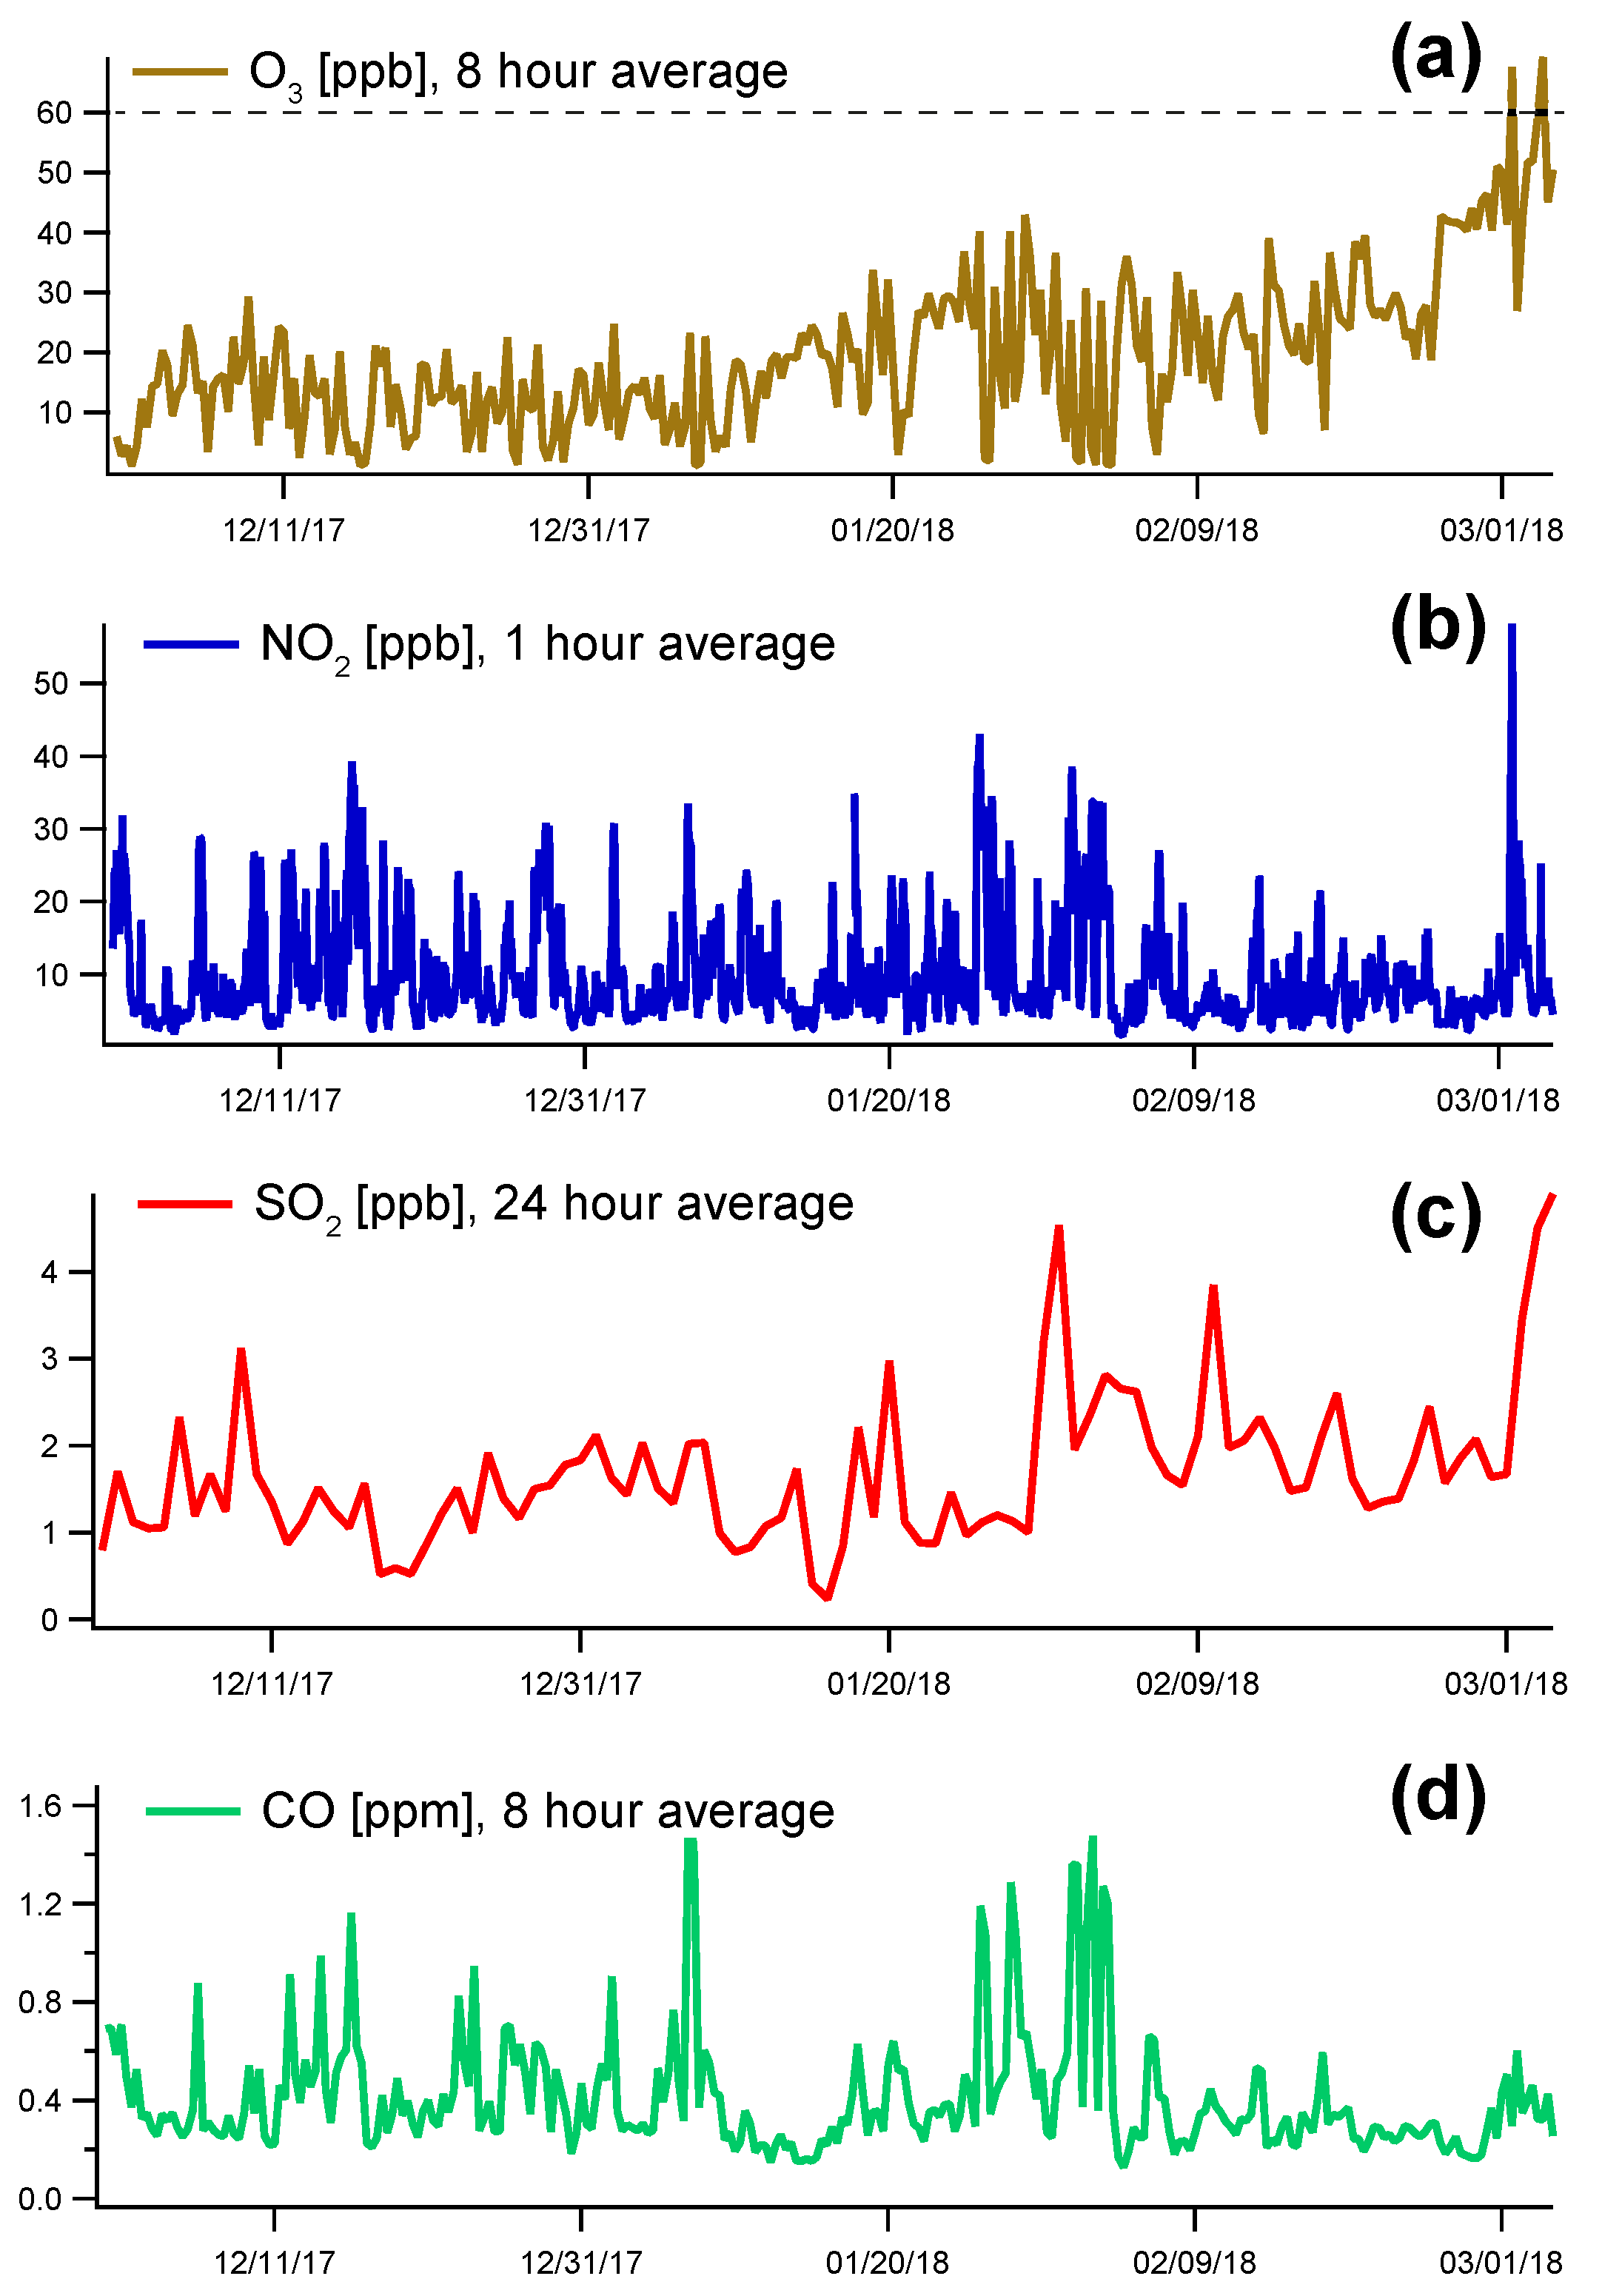
The great impact that air pollutants have on human heath require implementation of a legislation framework that which establishes limits for accepted air pollution concentration. These standards are adopted on global and/or regional scale and include temporal maximum concentration values for different pollutants. At European level, the limits are established through European Directives, being implemented in national legislation. In this study, an important task was the comparison of the measured values with the existent European limits, transposed in national legislation, for air pollutants. The limits are set for an averaging period of 1, 8 or 24 h and in some cases this limit can be exceeded for only a limited number of times per year (Table 2). For these three-month measurements, only ozone exceeded the limit (Figure 5), having two values higher than 60 ppb on 1 March and 3 March 2018 and one value close to the limit, 59.3 ppb, also on 3 March 2018. The exceeding of the allowed ozone concentration limit was correlated with solar radiation increases. On these two days, solar radiation reached the maximum values of 126 and 119 W m 2 , respectively, recorded over entire period of measurements. The maximum NO 2 average value, 58 ppb, was almost two times lower than the established limit, while the maximum CO average was almost five times lower and the maximum SO 2 value was ten times lower than the specified limits in the legislation. In conclusion, the average concentrations of these parameters were in accordance with the site location. According to the National Environmental Agency, the sampling site in Măgurele is defined as a rural location (http://www.calitateaer.ro/, accessed on 9 July 2019), with expected lower concentrations.

4. Conclusions

The winter campaign was deployed over three months between December 2017 and March 2018, being characterized by mainly positive temperatures, representing 77.5% of the total recorded values. Solar radiation represented the driving force in gases chemistry, especially for O 3 and NO x formation and depletion.
Different behaviors during weekend and weekdays were observed for gases produced by exhaust engines. The highest concentration for NO x was recorded on Friday, while the maximum concentration for O 3 was recorded on Sunday, explained by the chemical reactions between NO x and O 3 .
The average concentrations of the measured gases were at least two times lower than legal limits established by European commission: NO 2 maximum of 58 ppb was almost two times lower than the required limit; the maximum CO average was almost five times lower; and the maximum SO 2 value was ten times lower than the specified limits in the legislation. Only ozone concentration exceeded the 60 ppb EU limit on two different days (i.e., 1 March 2018 and 3 March 2018).
The influence of different sources was evidenced using the NWR model. The main contributor for our sampling site is the Bucharest ring road, as clear evidenced in the NO x model distribution and CO concentrations. Other sources found were related to residential heating, highlighted by CO estimated concentration distribution. The CO model indicated the influence mainly of the northern part, where the ring road of Bucharest is located, and the influence of surrounding living areas was evidenced as well. The presence of a landfill that services Bucharest city located in the E–SE part was highlighted by CH 4 estimated concentration. Another source was related to the long-range transport: the SO 2 concentration increased mainly with the wind speed.
This work presents the gases constituents behavior during the cold season at the measuring site in Măgurele. Future work is required to describe the diurnal patterns and reactions of gases during warm season, as photooxidation processes are more important during summer. In addition, the source estimation during other seasons would represent a great interest as the measuring site could be influenced by different sources resulted from agriculture activities (during spring and autumn) or by long range transport pollution from wild fires (during summer).
An important objective of the present study was the evaluation of the air quality compared with the European limits for the measured pollutants. The lacking information about the air quality in Romania could be covered by a future study for evaluating the pollutants’ concentrations in different environments (i.e., urban, regional, and background). In addition, multi-annual statistics would show the effect of national legislation on emissions rates and if further actions are required in order to fulfill the European Union recommendations.

Supplementary Materials

The following are available online at https://www.mdpi.com/2073-4433/10/8/478/s1, Figure S1: Diurnal trend for ozone, nitrogen dioxide, nitric oxide, nitrogen oxides and solar radiation; Figure S2: Source estimation for NOx; Figure S3: Weekly variation for ozone, nitrogen dioxide, nitric oxide, and nitrogen oxides; Figure S4: Weekly variation for sulfur dioxide, carbon monoxide and methane.

Author Contributions

Conceptualization, C.A.M. and L.M.; Methodology, C.A.M., L.M., C.R., A.D. and F.T. Formal Analysis, C.A.M. and L.M.; Investigation, all authors; Writing—Original Draft Preparation, C.A.M.; Writing—Review and Editing, all authors; Visualization, C.A.M. and B.A.; and Supervision, L.M. and C.S.

Funding

This research was funded by the Ministry of Research and Innovation through Program I—Development of the national research-development system, Subprogram 1.2—Institutional Performance—Projects of Excellence Financing in RDI, Contract No.19PFE/17.10.2018; by the Romanian National Core Program Contract No.18N/2019; and by ROSA-STAR Ctr. 162/20.07.2017, Ctr. 136/20.07.2017.

Acknowledgments

The authors gratefully acknowledge the Zefir software and the Romanian National Environmental Agency for providing data. We thank Jeni Vasilescu and Dragoş Ene from the National Institute of Research and Development for Optoelectronics INOE 2000 for their comments on an early version of the manuscript.

Conflicts of Interest

The authors declare no conflict of interest.

References

  1. Solomon, S.; Qin, D.; Manning, M.; Chen, Z.; Marquis, M.; Averyt, K.B.; Tignor, M.; Miller, H.L. (Eds.) Climate Change 2007: The Physical Science Basis. Contribution of Working Group I to the Fourth Assessment Report of the Intergovernmental Panel on Climate Change; Cambridge University Press: Cambridge, UK; New York, NY, USA, 2007. [Google Scholar]
  2. Stocker, T.F.; Qin, D.; Plattner, G.-K.; Tignor, M.; Allen, S.K.; Boschung, J.; Nauels, A.; Xia, Y.; Bex, V.; Midgley, P.M. (Eds.) Climate Change 2013: The Physical Science Basis. Contribution of Working Group I to the Fifth Assessment Report of the Intergovernmental Panel on Climate Change; Cambridge University Press: Cambridge, UK; New York, NY, USA, 2013; p. 1535. [Google Scholar]
  3. IPCC. Global Warming of 1.5 °C. An IPCC Special Report on the Impacts of Global Warming of 1.5 °C Above Pre-Industrial Levels and Related Global Greenhouse Gas Emission Pathways, in the Context of Strengthening the Global Response to the Threat of Climate Change, Sustainable Development, and Efforts to Eradicate Poverty; Masson-Delmotte, V., Zhai, P., Pörtner, H.O., Roberts, D., Skea, J., Shukla, P.R., Pirani, A., Moufouma-Okia, W., Péan, C., Pidcock, R., et al., Eds.; IPCC: Geneva, Switzerland, 2018; in Press. [Google Scholar]
  4. COP24 Special Report. Health and Climate Change. In Proceedings of the 24th Conference of the Parties to the United Nations Framework Convention on Climate Change (COP24), Katowice, Poland, 2–15 December 2018. [Google Scholar]
  5. Montzka, S.A.; Dlugokencky, E.J.; Butler, J.H. Non-CO2 greenhouse gases and climate change. Nature 2011, 476, 43–50. [Google Scholar] [CrossRef] [PubMed]
  6. Boucher, O.; Randall, D.; Artaxo, P.; Bretherton, C.; Feingold, G.; Forster, P.; Kerminen, V.-M.; Kondo, Y.; Liao, H.; Lohmann, U.; et al. Clouds and Aerosols. In Climate Change 2013: The Physical Science Basis. Contribution of Working Group I to the Fifth Assessment Report of the Intergovernmental Panel on Climate Change; Stocker, T.F., Qin, D., Plattner, G.-K., Tignor, M., Allen, S.K., Boschung, J., Nauels, A., Xia, Y., Bex, V., Midgley, P.M., Eds.; Cambridge University Press: Cambridge, UK; New York, NY, USA, 2013. [Google Scholar]
  7. Crippa, M.; Janssens-Maenhout, G.; Guizzardi, D.; Van Dingenen, R.; Dentener, F. Contribution and uncertainty of sectorial and regional emissions to regional and global PM2.5 health impacts. Atmos. Chem. Phys. 2019, 19, 5165–5186. [Google Scholar] [CrossRef]
  8. Huszar, P.; Belda, M.; Halenka, T. On the long-term impact of emissions from central European cities on regional air quality. Atmos. Chem. Phys. 2016, 16, 1331–1352. [Google Scholar] [CrossRef] [Green Version]
  9. Pancholi, P.; Kumar, A.; Bikundia, D.S.; Chourasiya, S. An observation of seasonal and diurnal behavior of O3–NOx relationships and local/regional oxidant (OX = O3 + NO2) levels at a semi-arid urban site of western India. Sustain. Environ. Res. 2018, 28, 79–89. [Google Scholar] [CrossRef]
  10. Thimmaiah, D.; Hovorka, J.; Hopke, P.K. Source apportionment of winter submicron Prague aerosols from combined particle number size distribution and gaseous composition data. Aerosol. Air Qual. Res. 2009, 9, 209–236. [Google Scholar] [CrossRef]
  11. Adame, J.; Notario, A.; Villanueva, F.; Albaladejo, J. Application of cluster analysis to surface ozone, NO2 and SO2 daily patterns in an industrial area in Central-Southern Spain measured with a DOAS system. Sci. Total. Environ. 2012, 429, 281–291. [Google Scholar] [CrossRef]
  12. Clapp, L.J.; Jenkin, M.E. Analysis of the relationship between ambient levels of O3, NO2 and NO as a function of NOX in the UK. Atmos. Environ. 2001, 35, 6391–6405. [Google Scholar] [CrossRef]
  13. Apascariţei, M.; Popescu, F.; Ionel, I. Air pollution level in urban region of Bucharest and in rural region. In Proceedings of the 11th WSEAS International Conference on Sustainability in Science Engineering, Timişoara, Romania, 27–29 May 2009. [Google Scholar]
  14. Ionel, I.; Nicolae, D.; Popescu, F.; Talianu, C.; Belegante, L.; Apostol, G. Measuring air pollutants in an international Romanian airport with point and open path instruments. Rom. J. Phys. 2011, 56, 507–519. [Google Scholar]
  15. Popescu, F.; Ionel, I.; Lontis, N.; Calin, L.; Dungan, I.L. Air quality monitoring in an urban agglomeration. Rom. J. Phys. 2011, 56, 495–506. [Google Scholar]
  16. Antonescu, B.; Ştefan, S. The urban effect on the cloud-to-ground lightning activity in the Bucharest area. Rom. Rep. Phys. 2011, 63, 535–542. [Google Scholar]
  17. Mărmureanu, L.; Vasilescu, J.; Marin, C.; Ene, D. Aerosol source assessment based on organic chemical markers. Rev.Chim. 2017, 68, 853–857. [Google Scholar]
  18. Dandocsi, A.; Nemuc, A.; Marin, C.; Andrei, S. Measurements of aerosols and trace gases in southern Romania. Rev. Chim. 2017, 68, 873–878. [Google Scholar]
  19. Vasilescu, J.; Mărmureanu, L.; Nemuc, A.; Nicolae, D.; Talianu, C. Seasonal variation of the aerosol chemical composition in a Romanian peri-urban area. Environ. Eng. Manag. J. 2017, 16, 2491–2496. [Google Scholar]
  20. Mărmureanu, L.; Vasilescu, J.; Ştefănie, H.; Talianu, C. Chemical and optical characterization of submicronic aerosol sources. Environ. Eng. Manag. J. 2017, 16, 2165–2172. [Google Scholar] [CrossRef]
  21. Marin, C.; Stan, C.; Preda, L.; Marmureanu, L.; Belegante, L.; Cristescu, C.P. Multifractal cross correlation analysis between aerosols and meteorological data. Rom. J. Phys. 2018, 63, 805. [Google Scholar]
  22. Petit, J.-E.; Favez, O.; Albinet, A.; Canonaco, F. A user-friendly tool for comprehensive evaluation of the geographical origins of atmospheric pollution: Wind and trajectory analyses. Environ. Model. Softw. 2017, 88C, 183–187. [Google Scholar]
  23. Henry, R.; Norris, G.A.; Vedantham, R.; Turner, J.R. Source region identification using kernel smoothing. Environ. Sci. Technol. 2009, 43, 4090–4097. [Google Scholar] [CrossRef] [PubMed]
  24. Hobbs, P. Introduction to Atmospheric Chemistry; Cambridge University Press: Cambridge, UK, 2000; p. 262. [Google Scholar]
  25. Seinfeld, J.; Pandis, S. Atmospheric Chemistry and Physics: From Air Pollution to Climate Change, 2nd ed.; Wiley-Interscience: Hoboken, NJ, USA, 2006; p. 1152. [Google Scholar]
  26. Mazzeo, N.A.; Venegas, L.E.; Choren, H. Analysis of NO, NO2, O3 and NOx concentrations measured at a green area of Buenos Aires City during wintertime. Atmos. Environ. 2005, 39, 3055–3068. [Google Scholar] [CrossRef]
  27. WHO guidelines for indoor air quality: Selected pollutants. Geneva 2010 World Health Organization. Chapter 5–Nitrogen dioxide. In WHO Guidelines for Indoor Air Quality: Selected Pollutants; World Health Organization, Regional Office for Europe: Geneva, Switzerland, 2010; p. 484. [Google Scholar]
  28. Lee, U.; Han, J.; Wang, M. Evaluation of landfill gas emissions from municipal solid waste landfills for the life-cycle. J. Clean. Prod. 2017, 166, 335–342. [Google Scholar] [CrossRef]
  29. Lipman, T.; Delucchi, M.A. Emissions of nitrous oxide and methane from conventional and alternative fuel motor vehicle. Clim. Chang. 2002, 53, 477–516. [Google Scholar] [CrossRef]
  30. Bogner, J.; Spokas, K. Landfill CH4: Rates, fates, and role in global carbon cycle. Chemosphere 1993, 26, 369–386. [Google Scholar] [CrossRef]
  31. Zanis, P.; Monks, P.S.; Schuepbach, E.; Penkett, S.A. The role of in situ photochemistry in the control of ozone during Spring at the Jungfraujoch (3580 m asl)–Comparison of model results with measurements. J. Atmos. Chem. 2000, 37, 1–27. [Google Scholar] [CrossRef]
  32. Stone, D.; Whalley, L.K.; Heard, D.E. Tropospheric OH and HO2 radicals: Field measurements and model comparisons. Chem. Soc. Rev. 2012, 41, 6348–6404. [Google Scholar] [CrossRef] [PubMed]
  33. Isaksen, I.S.A.; Gauss, M.; Myhre, K.; Anthony, K.M.W.; Ruppel, C. Strong atmospheric chemistry feedback to climate warming from Arctic methane emissions. Glob. Biogeochem. Cycles. 2011, 25, GB2002. [Google Scholar] [CrossRef]
  34. Choi, H.D.; Liu, H.; Crawford, J.H.; Considine, D.B.; Allen, D.J.; Duncan, B.N.; Horowitz, L.W.; Rodriguez, J.M.; Strahan, S.E.; Zhang, L.; et al. Global O3—CO correlations in a chemistry and transport model. Atmos. Chem. Phys. 2017, 17, 8429–8452. [Google Scholar] [CrossRef]
  35. Voulgarakis, A.; Telford, P.J.; Aghedo, A.M.; Braesicke, P.; Faluvegi, G.; Abraham, N.L.; Bowman, K.W.; Pyle, J.A.; Shindell, D.T. Global multi-year O3-CO correlation patterns from models and TESsatellite observations. Atmos. Chem. Phys. 2011, 11, 5819–5838. [Google Scholar]
  36. Wang, Y.; Hao, J.; Mcelroy, M.B.; Munger, J.W.; Ma, H.; Nielsen, C.P.; Zhang, Y. Year round measurements of O3 and CO at a rural site near Beijing: Variations in their correlations. Tellus B 2010, 62, 228–241. [Google Scholar] [CrossRef]
  37. Reddy, M.S.; Venkataraman, C. Inventory of aerosol and sulphur dioxide emissions from India. Part II—Biomass combustion. Atmos. Environ. 2002, 36, 699–712. [Google Scholar] [CrossRef]
  38. Xu, W.Y.; Zhao, C.S.; Ran, L.; Lin, W.L.; Yan, P.; Xu, X.P. SO2 noontime-peak phenomenon in the North China Plain. Atmos. Chem. Phys. 2014, 14, 7757–7768. [Google Scholar] [CrossRef]
  39. Walker, H.L.; Heal, M.R.; Braban, C.F.; Ritchie, S.; Conolly, C.; Sanocka, A.; Dragosits, A.; Twig, G.M.M. Changing supersites: Assessing the impact of the southern UK EMEP supersite relocation on measured atmospheric composition. Environ. Res. Commun. 2019, 1, 041001. [Google Scholar] [CrossRef]
  40. Zou, Y.; Deng, X.J.; Zhu, D.; Gong, D.C.; Wang, H.; Li, F.; Tan, H.B.; Deng, T.; Mai, B.R.; Liu, X.T.; Wang, B.G. Characteristics of 1 year of observational data of VOCs, NOx and O3 at a suburban site in Guangzhou, China. Atmos. Chem. Phys. 2015, 15, 6625–6636. [Google Scholar] [CrossRef]
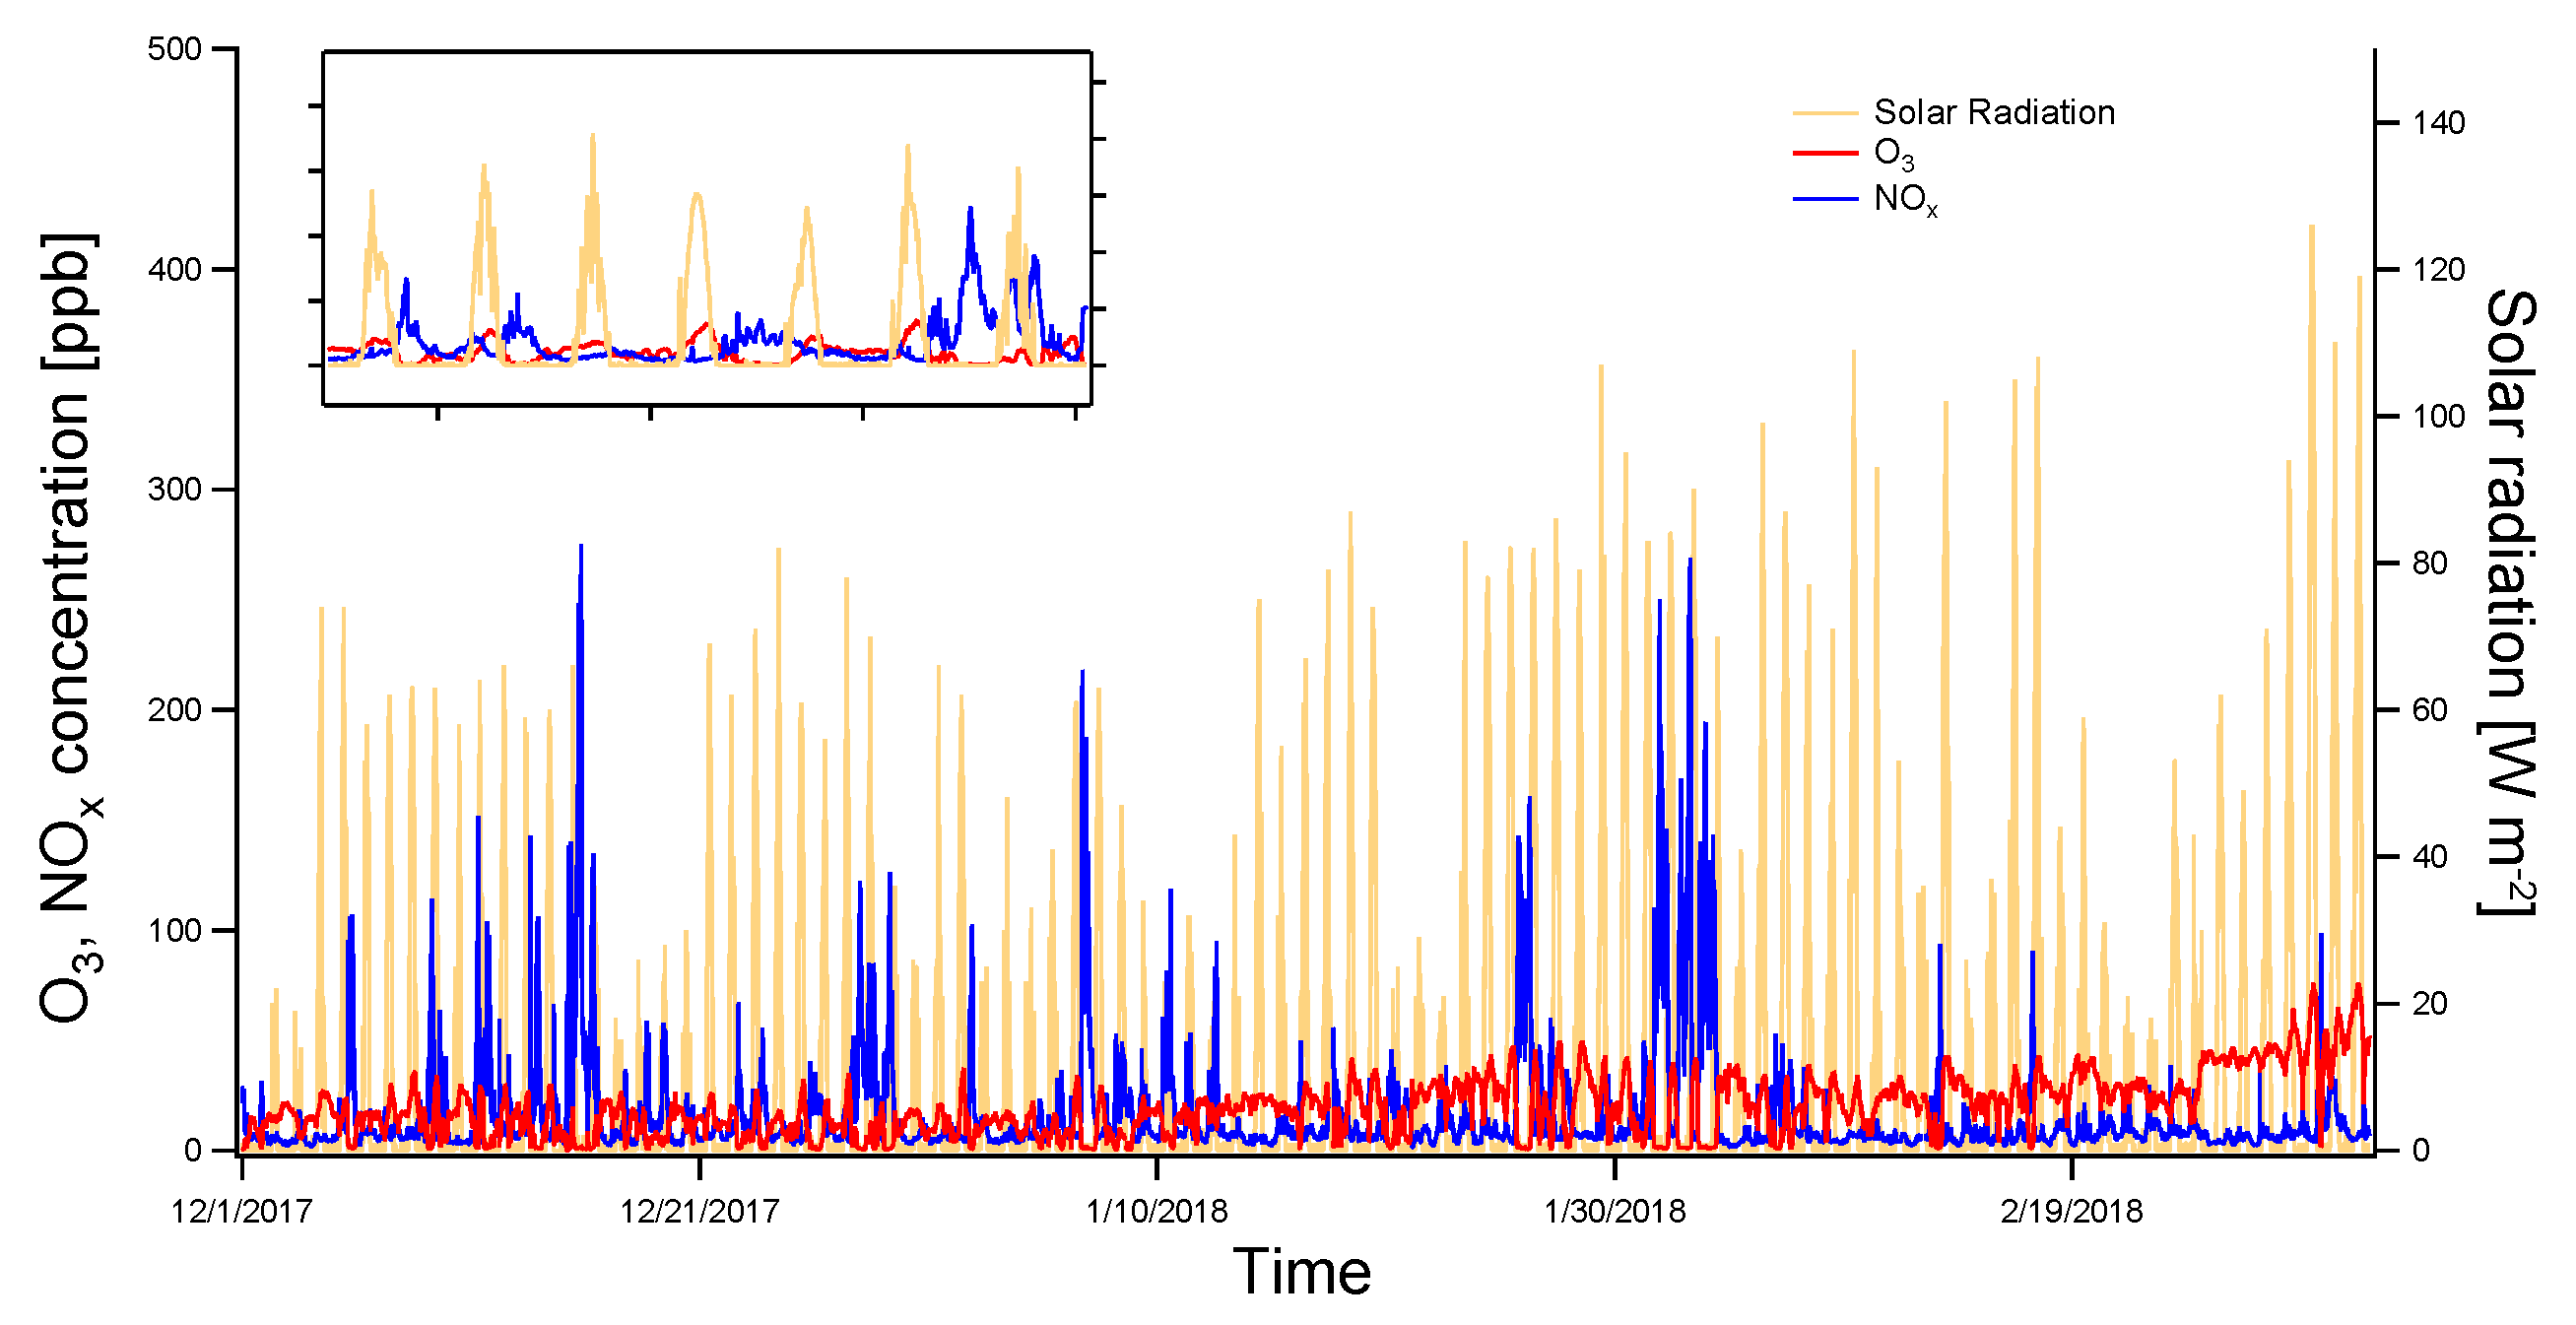
Figure 1. Time series of hourly average concentration for O 3 (red), NO x (blue) and solar radiation (yellow) during winter the period (1 December 2017–4 March 2018). The inset in the left corner emphasizes the correlations between solar radiation and O 3 and anti-correlation among solar radiation, O 3 and NO x .
Atmosphere 10 00478 g001
Figure 2. (a) Diurnal trend for ozone (red line), nitrogen dioxide (orange line), nitric oxide (green line), nitrogen oxides (blue line) and solar radiation (black line), computed for the cold season between 1 December 2017 and 4 March 2018. Source estimations for: (b) NO (ppb, shaded according to the scale); and (c) NO 2 (ppb, shaded according to the scale). For the source estimation plots, the inner white circles represent the wind speed in m s 1 .
Atmosphere 10 00478 g002
Figure 3. (a) Diurnal pattern computed for cold season between 1 December 2017 and 4 March 2018 of carbon monoxide (green line) and methane (yellow line) emphasizing peaks during morning and evening hours. The vertical error bars represent the standard deviation from the mean value. Source estimations are shown for: (b) CO; and (c) CH 4 . For the source estimation plots, the inner white circles represent the wind speed in m s 1 .
Atmosphere 10 00478 g003
Figure 4. (a) Diurnal pattern computed for cold season between 1 December 2017 and 4 March 2018 for sulfur dioxide. The vertical error bars represent the standard deviation from the mean value. (b) Long-range transport was highlighted by NWR model for source estimation; higher concentrations were correlated with higher wind speeds. For the source estimation plots, the inner white circles represent the wind speed in m s 1 .
Atmosphere 10 00478 g004
Figure 5. Time series air pollutants averaged according to the averaging period specified in the European Union legislation (indicated on each panel) for: (a) O 3 ; (b) NO 2 ; (c) SO 2 ; and (d) CO concentration. The horizontal line in (a) represents the limit value for O 3 according to the European Union legislation.
Atmosphere 10 00478 g005
Table 1. Average, minimum and maximum concentrations of the parameters derived.
Parameter Derived-UnitAverage Concentration for the Entire PeriodMinimum Concentration for the Entire PeriodMaximum Concentration for the Entire Period
O 3 (ppb)19.450.5 (detection limit)76
SO 2 (ppb)1.710.5 (detection limit)23
NO (ppb)6.60.5 (detection limit)237
NO 2 (ppb)9.71.3160
NO x (ppb)16.31274
CO (ppm)0.40.111
CH 4 (ppm)2.552.113
Table 2. European standards for air pollutants.
PollutantLimit ConcentrationAveraging PeriodAccepted Exceedances per Year
O 3 120 μ g m 3 (60 ppb)maximum daily 8 h mean25 days in 3 years
SO 2 125 μ g m 3 (47 ppb)24 h3
350 μ g m 3 (134 ppb)1 h24
CO10 mg m 3 (8 ppm)maximum daily 8 h meanN/A
NO 2 200 μ g m 3 (105 ppb)1 h18
40 μ g m 3 (21 ppb)1 yearN/A