Article

Comparison of Atmospheric Mercury Speciation at a Coastal and an Urban Site in Southeastern Texas, USA

1
Institute for Climate and Atmospheric Sciences, Department of Earth and Atmospheric Sciences, University of Houston, 3507 Cullen Boulevard, Houston, TX 77204, USA
2
Department of Physics, University of Toronto, 60 Saint George Street, Toronto, ON M5S 1A7, Canada
3
Earth System Research Laboratory, National Oceanic and Atmospheric Administration, 325 Broadway, Boulder, CO 80305, USA
*
Author to whom correspondence should be addressed.
Atmosphere 2020, 11(1), 73; https://doi.org/10.3390/atmos11010073
Submission received: 18 December 2019 / Revised: 31 December 2019 / Accepted: 4 January 2020 / Published: 8 January 2020
(This article belongs to the Section Air Quality)

Abstract

:
Sixteen months of continuous measurements and the analysis of atmospheric mercury (gaseous elemental mercury GEM, gaseous oxidized mercury GOM, and particulate bound mercury PBM) under urban and coastal settings were conducted in Southeastern Texas. At the urban site, the GEM mean mixing ratio was 185 ppqv, 5%–10% higher than the Northern Hemisphere GEM background level. GOM and PBM mixing ratios were as much as six times higher than their background level. The coastal site GEM mean mixing ratio was 165 ppqv, higher than other coastal sites located in the Northern Hemisphere. GOM and PBM mean mixing ratios at the coastal site were 0.75 ppqv and 0.58 ppqv. The urban site had a higher frequency of high mercury events (>300 ppqv) compared to the coastal site. The diurnal patterns were found for both sites: In the urban environment, GEM accumulated to the maximum mixing ratio just after sunrise and decreased to the minimum mixing ratio in late afternoon. In the coastal environment, GEM decreased at night reaching its minimum mixing ratio before sunrise. The relationship between atmospheric mercury species and meteorological parameters was investigated. An examination of the relationship between atmospheric mercury species and key trace gases was conducted as well, showing that the concurrence of GEM, CO2, CO, CH4, and SO2 maximum mixing ratios was notable and provided evidence they may originate from the same emission source. The coastal site was at times influenced by polluted air from urban Houston and the cleaner Gulf of Mexico marine air at other times.

1. Introduction

Mercury is a pervasive and toxic environmental pollutant that exists in several chemical and physical forms that are distributed widely on Earth. The atmosphere serves as the major transport pathway for mercury released from a variety of anthropogenic sources (e.g., coal combustion, waste treatment, cement production, smelting) and natural sources (e.g., volcanoes, wild fires) [1,2]. Mercury in the atmosphere is then deposited in terrestrial systems or water bodies where it is transformed into methylated mercury, a more toxic form that accumulates in fish and shellfish via uptake from plants and benthic feeding organisms, before it bioaccumulates up the food chain [3]. Humans are exposed to mercury mainly by consuming contaminated fish, which is damaging to the development of fetuses and young children. Thus, long term measurement of atmospheric mercury speciation is meaningful to reveal the behaviors of regional atmospheric mercury cycles and identify the contribution of local or regional emission sources.
Mercury exists in the atmosphere in three chemical forms, gaseous elemental mercury (GEM), gaseous oxidized mercury (GOM) and particle-bound mercury (PBM) [4]. The lifetime of GEM is 6–12 months, PBM is 2–5 days [5], and GOM, only 1–3 h [6]. GOM and PBM are removed rapidly from the atmosphere due to their water solubility and high rates of dry deposition [7]. GEM comprises >95% of the global atmospheric mercury pool [8] and can be transported over long distances. GEM has been proposed to oxidize to GOM under the presence of halogen radicals, hydroxyl radical, ozone, and other oxidants through various photo-chemical reactions [5,9,10,11]. Oxidation from halogen radicals is of importance in this study given the marine air source nearby. GOM may also be transformed to GEM by reactions with SO2 or SO32− [12].
Previous studies [13,14,15] have concluded that the Northern Hemisphere GEM background level is approximately 170 ppqv, GOM and PBM mean mixing ratios are between 3–5 ppqv and 3–35 ppqv, respectively. Local sources, meteorology, and topography impact mercury cycling as well [14,15,16,17]. Lan et al. reported the mercury species diurnal patterns in rural sites across the United States using the Atmospheric Mercury Network: the maximum mixing ratio typically occurred around solar noon and the minimum occurred just before sunrise [18]. Mao and Talbot [17] found this cycle is driven by re-volatilization of the mercury following nighttime deposition. In contrast, studies in urban areas of the United States found higher mixing ratios of GEM and GOM as well as more complex diurnal patterns. This results from local anthropogenic emissions, boundary layer dynamics, dry/wet deposition and photochemical reactions [19]. Additionally, the ocean is a significant source of reactive bromine, sea salt and other halogen radicals, which can oxidize GEM to GOM and PBM [15,20]. Thus, it is significant to research the impacts of marine air on atmospheric mercury cycling in coastal environments and contrast it with the mercury cycling from a large urban site in the region.
Understanding the atmospheric mercury budget in southeastern Texas is challenging due to the distinct industrial emissions and complex meteorological conditions [21,22,23]. Data from the National Atmospheric Deposition Program indicates that mercury concentrations in precipitation in the Gulf of Mexico area are the highest in the United States [24]. Atmospheric mercury studies have been conducted in Houston before [14,23], but those studies based their findings only on urban site data. This work focuses on the atmospheric mercury concentrations under both urban and coastal settings in southeastern Texas with sixteen months of continuous speciated atmospheric mercury measurements plus simultaneous meteorological and key trace gas measurements. The aim of the study is to improve the understanding of atmospheric mercury speciation under urban and coastal settings.

2. Experiments

2.1. Sampling Area

According to the 2017 United States Environmental Protection Agency (EPA) National Emissions Inventory (NEI), southeastern Texas encompasses an area which has amassed some of the largest industrial emission sources of atmospheric mercury in the United States. Sources include oil and gas refining facilities, fossil fuel electrical generation units, and waste management facilities. Figure 1 depicts mercury point sources identified by the EPA in the 2017 National Emissions Inventory. Several of the largest known emissions sources are located near the urban site, along the Houston Ship Channel. In total, nearly half of Texas mercury emitting facilities are in Southeastern Texas. This makes the region an ideal location for mercury measurements and research.
As shown in Figure 1, the continuous measurements of GEM, GOM, and PBM were conducted at two observatory sites: University of Houston Moody Tower (UH_MT) (29.71° N, 95.34° W, height 70 m) from 22 March 2012 to 6 June 2013 and University of Houston Coastal Center (UH_CC) (29.23° N, 95.15° W, height 1.5 m) from 26 July 2012 to 6 June 2013. The UH_MT site (urban site) is located in the southeast quadrant of the Houston downtown area, within 2 km of major freeways, 35 km west of the Galveston Bay, 70 km northwest of the Gulf of Mexico, and 25 km southwest of the Houston Ship Channel area, where over 400 chemical manufacturing facilities and two of the four largest chemical refineries in the USA reside [14]. The UH_CC site is a ground level coastal site located in central Galveston County, 22 km northwest of the Gulf of Mexico, 48 km southeast of the UH_MT site, 15 km west of the Texas City industrial refinery area, and 45 km south of the Houston Ship Channel area. Both sites, at times, are in a general downwind direction from major mercury emission sources based on the 2017 National Emission Inventory.

2.2. Measurements

The continuous 24 h per day, 7 days per week mercury measurements were conducted with 5-min time resolution of GEM and 2 h time resolution of GOM and PBM for both the urban and coastal sites. There were interruptions in data collection during April/May of 2013 at UH_MT and February/March of 2013 at UH_CC due to the instruments requiring maintenance. A Tekran 2537A-1130-1135 Atmospheric Mercury Speciation System was utilized at both air-monitoring facilities. This system is a combination of three separate units. Model 2537A is a mercury vapor analyzer, which can be used on its own to provide total gaseous mercury (TGM = GEM + GOM), however when in use as part of the speciation system it provides mixing ratios of GEM. The model 1130 Mercury Speciation Unit measures GOM mixing ratios and Model 1135 Particulate Mercury Unit measures PBM.
The Model 2537A employs a cold vapor atomic fluorescence spectrophotometry (CVAFS) for GEM detection with a detection limit of <0.1 ng/m3 and a range of 0.1–2000 ng/m3. Model 1130 Mercury Speciation Unit has an active sampling element made of a thermally coated potassium chloride re-generable quartz denuder. The denuder captures GOM while allowing GEM to pass through freely. When the sampling phase is complete, the sample is extracted through thermal desorption. Upon its release from the denuder surface, the 2537A measures the GOM released. The particulate mercury unit, Model 1135, provides mixing ratios of PBM for particulate matter (PM) <2.5 µm. The fine particles are then trapped on a quartz particulate filter and released with each thermal desorption cycle. As this particulate trap is heated to 900 °C, the PBM is desorbed allowing the 2537A to measure the GEM released.
The Tekran system employed an internal permeation tube calibration (±5% reproducibility) that was verified every six months using a manual syringe injection from the headspace of a thermoelectrically cooled GEM reservoir (Tekran model 2505). Standard additions of GEM were conducted using the internal permeation source in the Tekran. The Tekran 2537A-1130-1135 Atmospheric Mercury Speciation System outputs ng/m3 (10−9 g/m3) for GEM and pg/m3 (10−12 g/m3) for GOM and PBM, the overall precision of this instrument was ±10% and the accuracy was estimated to be ±5%.
Synchronous measurements of other trace gases (CO, CO2, O3, CH4, NOx, and SO2) and basic meteorology parameters (temperature, relative humidity, pressure, precipitation, wind speed, and wind direction) were conducted as well at the same sites, making it possible to identify mercury plume signatures from various sources. Carbon monoxide (CO) and ozone (O3) mixing ratios were measured at both sites by a Thermo Environmental (TE) CO analyzer (48C-TLE) and Thermo Ozone UV photometric analyzer (49C). At the UH_MT site, SO2 was measured with a Thermo 43C instrument. The CO, O3, and SO2 analyzers shared the same inlet with a 10–12 m long sample line. Nitric oxide and nitrogen dioxide (NOx) were measured by TE NO-NO2-NOx chemiluminescence analyzer (42C) with a 7.5 m long sample line, both inlets were 6 m away from the mercury inlet. These instruments were adjusted to zero and the span checked daily. Calibration was conducted every two weeks. The original resolution of the trace gases was 10 s but averaged to 5 min for analysis. A LICOR LI-7000 analyzer was employed to measure carbon dioxide from 22 March 2012~21 October 2012 and the PICARRO G2132-i instrument measured methane (CH4) mixing ratios from 4 June 2012~1 January 2013. The calibration of both instruments were checked monthly with Scott Marrin ±1% National Institute of Standards and Technology (NIST) certified standards. The original resolution of CO2 and CH4 was 60 s and 1.5 s respectively, then averaged to 5 min for analysis. The ambient temperature, pressure, wind speed, wind direction, relative humidity, and precipitation were measured with Campbell Scientific sensors with 10 s original resolution and averaged to 5 min for analysis. The planetary boundary layer height was monitored using a Vaisala CL31 Ceilometer with a 5-m height resolution located at a ground level site about 700 m away from the UH_MT site.

3. Results and Discussion

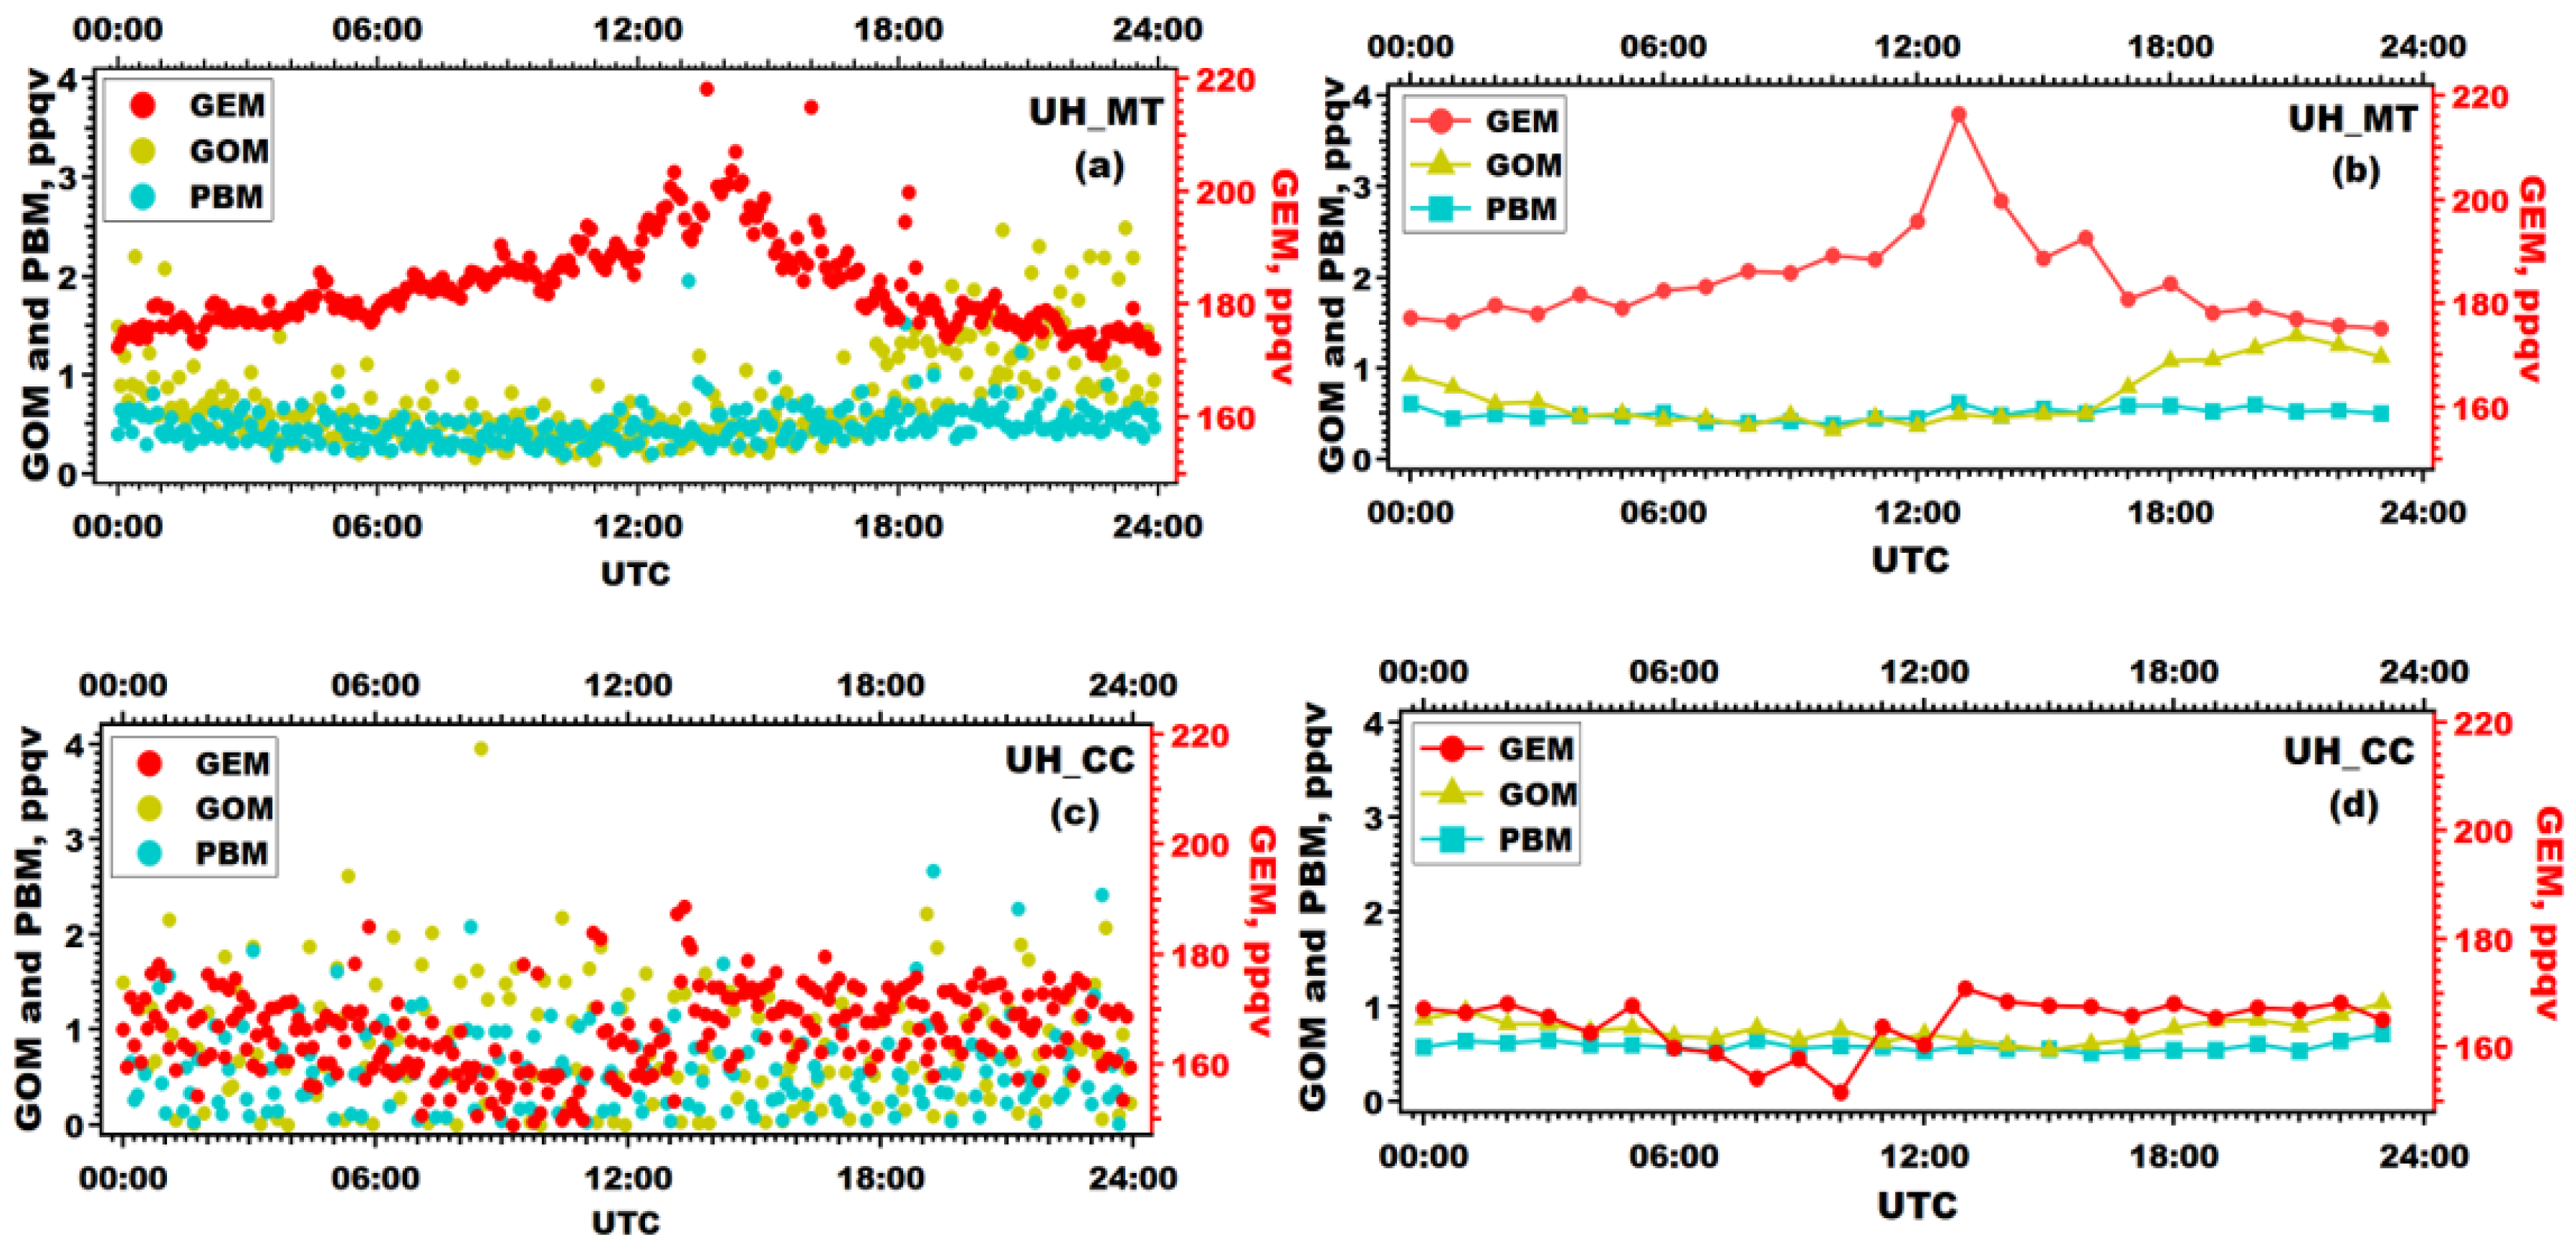
3.1. Time Series of Atmospheric Mercury

The time series of GEM, GOM, and PBM at the UH_MT and UH_CC sites are presented in Figure 2. In this work, atmospheric mercury was reported using mixing ratios in parts per quadrillion by volume (ppqv). The use of mixing ratios to present the data was chosen because it is the convention for reporting atmospheric trace gases and allows direct comparison to other trace gases. Under standard temperature and pressure conditions, 1 ng/m3 = 112 ppqv and 1 pg/m3 = 0.112 ppqv. The mixing ratios of GEM, GOM, and PBM at both sites showed significant variabilities during the sampling period. At the urban site (UH_MT), the GEM mean mixing ratio was 184 ppqv and median value was 178 ppqv (Table 1), 5%–10% higher than the Northern Hemisphere GEM background level. At the coastal site (UH_CC), the GEM mean mixing ratio was 164 ppqv and the median value was 162 ppqv, 15–20 ppqv lower than UH_MT, but higher than GEM measurements made at Northeastern United States coastal sites (139 ppqv) [25]. GEM mean mixing ratios ranged between 148 and 226 ppqv at 11 different United States Atmospheric Mercury Network sites [18], the GEM mean mixing ratios at UH_MT and UH_CC fall within this range, but the frequent occurrence of high GEM events (over 300 ppqv) is salient. At the UH_MT site plumes with GEM mixing ratios exceeding 1000 ppqv were detected in late August and October of 2012. In February and April of 2013, plumes were measured with GEM mixing ratios over 2000 and 4000 ppqv respectively. For UH_CC, GEM mixing ratios were detected as high as 2200 ppqv in September 2012 and 2800 ppqv in April 2013. The detailed analysis of the high mercury events at UH_MT and UH_CC follows in Section 3.6 “Case Study of High Mercury Events”.
The UH_MT GOM mean mixing ratio was 0.72 ppqv and PBM mean mixing ratio was 0.71 ppqv, roughly six times higher than the GOM and PBM Northern Hemisphere background level (0.112 ppqv). The UH_CC mean GOM mixing ratio was 0.75 ppqv and PBM mean mixing ratio was 0.58 ppqv, slightly lower than UH_MT. There were frequent high GOM and PBM events (over 5 ppqv) at both sites; some high GOM and PBM events occurred simultaneously at both locations. For the frequency of total gaseous mercury (TGM) mixing ratio intervals at UH_MT, 7.3% were between 80 and 150 ppqv, below the Northern hemisphere background level. Further, 75.4% of the TGM mixing ratios were distributed between 150 and 200 ppqv, while 16% of the TGM mixing ratios exceeded 200 ppqv. At UH_CC, 6.7% of the TGM mixing ratios were below 80 ppqv, 30% of TGM mixing ratios distributed in the range of 80~150 ppqv, over half of the TGM mixing ratios (51.4%) were between 150~200 ppqv and only 8% of the TGM mixing ratios were higher than 200 ppqv. The UH_MT site was characterized by more frequent high TGM events, which is often the case in urban and industrialized areas [10,26].

3.2. Monthly Variations of Atmospheric Mercury

GEM, GOM, and PBM mixing ratios at UH_MT and UH_CC demonstrated distinct monthly variations during the study period (Figure 3). For the monthly median GEM mixing ratios at UH_MT, they were approximately 200 ppqv in March and April of 2012, decreased to roughly 150 ppqv in May, then increased back to around 180 ppqv in the following months. For UH_CC, except for the extremely high GEM median value (260 ppqv) in September of 2012, the other GEM monthly median values were lower than the urban site. In Figure 3, GOM and PBM monthly median values showed variations at both sites. For GOM at UH_MT, the highest monthly median value was 1.6 ppqv in March of 2012, which decreased to 0.63 ppqv in April and showed a decreasing trend for the following months with slight variations. The monthly median GOM values at UH_CC were lower than the urban site, except for March and April 2013, when GOM was as high as 1.58 ppqv, possibly due to more active photochemical reactions from GEM to GOM during the spring season in the presence of abundant marine halogen compounds under the coastal environment [27]. The monthly median PBM mixing ratio at UH_MT ranged between 0.2 ppqv and 0.6 ppqv throughout the period, and ranged between 0.1 ppqv and 0.8 ppqv at UH_CC. The PBM fluctuation at UH_CC was more dramatic than the urban site and the average monthly median PBM value was 0.25 ppqv lower than UH_MT. This is likely due to the impact from local Hg emission sources considering the short lifetime of PBM.
Table 1 shows the seasonal statistics of GEM, GOM, and PBM at the UH_MT and UH_CC sites. The GEM mixing ratio at UH_MT ranged between 81 ppqv and 27,300 ppqv, its mean mixing ratio was 184 ppqv, and its median mixing ratio was 178 ppqv. At the UH_CC site, GEM mixing ratios show distinct variations between the seasons. The highest GEM mean value (197 ppqv) was in the fall of 2012, and the lowest mean value (113 ppqv) was in the spring of 2013. For GOM and PBM: the mean/median GOM value was highest (1.09 ppqv/0.89 ppqv) in spring 2013 at UH_CC relative to the other seasons, meanwhile, the mean/median GEM value (113 ppqv/124 ppqv) measured at the same site in the same season was 30% lower than the seasonal averaged values. This relationship is thought to be due to the increase in available halogen radicals from the intensified sea breeze which oxidize GEM to GOM. Higher PBM mixing ratios in winter and spring are attributed to the increased southerly flow wind speeds coupled with a more active period of agricultural biomass burning activities in Mexico and Central America [21]. The seasonal median values of GOM and PBM measured at UH_MT were higher than UH_CC, GOM, and PBM mixing ratios are heavily influenced by local mercury emissions due to their short lifetimes [27].

3.3. Seasonal and Diurnal Patterns of Atmospheric Mercury

GEM mixing ratios exhibited inversed diurnal patterns for UH_MT and UH_CC throughout all seasons, the magnitude of which was determined by meteorological patterns and local emissions. The 5 min resolution diurnal variations of GEM at UH_MT (Figure 4a) showed that GEM mixing ratios started increasing at approximately midnight (06:00 UTC), accumulated during the night when the maximum was reached just after the sunrise (13:00 UTC), followed by a decrease during the daytime. The daily minimum mixing ratio occurred in the evening (23:00 UTC). There are similar diurnal patterns in other urban cities: Detroit, United States [28], Nanjing, China [29], and Chongqing, China [30]. In the Houston urban area, GEM diurnal patterns are related with the lower nocturnal boundary height, stagnant airflow conditions and local emissions [21,22]. Mercury emitted from anthropogenic activities accumulated under the stable nocturnal boundary layer and reached a maximum just after the sunrise when the stable condition was broken by the increasing solar radiation and vertical mixing down of the residual layer occurred. The summer had the highest GEM mixing ratio followed by the spring and fall with the winter exhibiting the lowest mixing ratio at UH_MT. This pattern is somewhat different compared to further northern latitude sites [17,26] where the maximums were typically reached in winter although other works [10] have found similar seasonality. One explanation for this pattern in Houston is that the increase of power demands during summer and late spring/early fall increase the local source emissions [18]. Figure 4a,b show the GOM at UH_MT started to increase around noon (17:00 UTC), accumulated to its maximum in the late afternoon (22:00 UTC), then decreased during nighttime with a minimum (0.3 ppqv) reached in the morning; this diurnal cycle is comparable to other studies [10,15,24,26]. Considering its short lifetime, the increase of GOM in the afternoon is connected to local emissions and the increase of temperature and solar radiation which contributed to intensifying photochemical activity related to the oxidation of mercury. The lower GOM at night is likely also due to deposition mechanisms. The peak mixing ratio was observed in summer (0.5~2.4 ppqv), followed by spring (0.4~1.4 ppqv), fall (0.4~1.2 ppqv) and then winter (0.2~0.6 ppqv). This demonstrates that the temperature and solar radiation intensity also correlate with GOM cycling, both factors contributing to photochemistry and re-volatilization. The seasonal diurnal pattern of PBM at UH_MT (Figure 5e) did not show significant variations, and the PBM mixing ratios were generally smaller than GOM. The UH_CC GEM diurnal pattern showed a steady decrease at night and reached its minimum mixing ratio before the sunrise (11:00 UTC), then it slowly increased after sunrise and reached its maximum in the early afternoon (16:00 UTC), as seen in Figure 4c,d. This pattern is typical for rural areas [17,18,24] where deposition is dominant over emissions overnight. The GEM seasonal diurnal variation at UH_CC (Figure 5b) demonstrated lower mixing ratios and less diurnal variation compared to UH_MT. The GEM mixing ratio for spring 2013 at UH_CC was 30% lower than the other seasons, which is suspected to be due to an intensified (~25%) sea breeze that diluted the GEM mixing ratios and inhibited inflow of polluted urban air while also bringing in elevated levels of halogen radicals to react with the GEM. Figure 5d shows that at UH_CC, GOM in summer, fall and winter seasons increased during the day, reaching maximum values around 22:00 UTC (17:00 LST), then decreased overnight. However, during the spring 2013 high, the GOM accumulated overnight peaking at approximately 8:00 UTC (3:00 LST) then decreased throughout the day. The GOM peaked when urban air mixed with marine air at UH_CC. We hypothesize that the lower nocturnal boundary layer and sea breeze allowed halogen radicals to convert GEM to GOM. The coastal PBM diurnal pattern (Figure 5f) showed minimum seasonal variations except for lower PBM in summer. Overall, the UH_CC site GOM and PBM diurnal patterns showed smaller variations and lower GOM levels compared to UH_MT.

3.4. Relationship between Atmospheric Mercury and Meteorological Parameters

Seasonal diurnal analysis was conducted to study the relationship between meteorological parameters and GEM mixing ratios at UH_MT since more meteorological parameters were monitored at the UH_MT site. From Figure 6, for each season, GEM mixing ratios accumulated overnight, while the boundary layer height and the wind speed are typically at their minimum, which contributed to the maximum GEM mixing ratio. After the sunrise, solar radiation and temperature increase, leading to vertical turbulence and mixing, wind speed and boundary layer height increase as well. This generally dilutes the GEM concentrations, although the initial mixing down of the residual layer can increase the GEM concentrations, causing the peak mixing ratio to be observed 1–2 h after sunrise. The relationship depicted in Figure 6f identifies the anti-correlation between boundary layer height and GEM mixing ratios at UH_MT. Sometimes when the wind speed was higher, mercury mixing ratios increased as well. This is likely due to the site being in the downwind direction of mercury emission sources so that it is advected to the UH_MT site. The detailed analysis between mercury and winds follows.

Relationship between Atmospheric Mercury and Winds

Wind rose plots in Figure 7 and Figure 8 describe the relationship between wind and mercury mixing ratios during the measurement period. For UH_MT: Figure 7a shows that GEM mixing ratios above 250 ppqv are often associated with winds from the northeast and southeast, where there is an accumulation of industrial mercury emission sources based on the 2017 National Emission Inventory (Houston Ship-channel and Houston-Galveston refinery area). Figure 7b illustrates wind and GOM mixing ratios. GOM mixing ratios between 2–8 ppqv are predominantly associated with southeast winds and mixing ratios of 1.5–2 ppqv related with south to southeast winds. In Figure 7c PBM mixing ratios of 2–3 ppqv related to northeasterly winds, and the 1.5–2 ppqv range corresponded with east to southeasterly winds.
For the UH_CC site, as Figure 7d exhibits, winds that originated from the Gulf of Mexico are associated with lower GEM mixing ratios. GEM above 200 ppqv are predominantly impacted by north to northeasterly winds (downwind from mercury emission sources). Figure 7e,f describe the relationship between wind direction and GOM and PBM mixing ratios respectively. GOM mixing ratios between 1.5 and 4 ppqv are linked with winds from Gulf of Mexico, although high GOM and PBM mixing ratio levels (6–8 ppqv) were correlated with northeasterly winds. These findings agree with other works [10,15,24,26,31] that found observation sites that are downwind of urban/industrial sources are particularly sensitive to wind direction and speed variations because of the transport of mercury and the amount of vertical mixing occurring.
The distance between the UH_MT and UH_CC sites is only 48 km, but the different urban and coastal environmental settings and locations of mercury emission sources lead to significant differences of GEM mixing ratios at times. As previously noted, at UH_CC, an unusually high GEM monthly mean mixing ratio was detected in September 2012, but most months GEM values were lower than those measured at UH_MT, especially in April of 2013. The wind rose plots below were constructed for GEM at UH_CC in these two months. From Figure 8a, the low GEM period (April 2013) was related with southeasterly winds from the Gulf of Mexico which brought cleaner marine air with lower GEM background mixing ratio levels which diluted the GEM mixing ratios. Figure 8b shows that the high GEM period (September 2012) was correlated with northeasterly winds. This is the direction of the major accumulation of mercury emission sources according to the National Emission Inventory, particularly the Houston Ship channel area located in the north/northeast direction of UH_CC, which has over 400 oil and gas processing and refining facilities.

3.5. Relationship with Key Trace Gases

The UH_MT site carbon monoxide (CO) measurements have proven to be good indicators for transport of pollution and biomass burning emissions for southeastern Texas [32]. According to the National Emission Inventory, oil/petroleum/natural gas related facilities, coal-combustion power plants, steel mills, landfills, and waste treatment facilities are all major anthropogenic mercury emission sources. Stationary combustion source signatures are distinguishable by their high mixing ratios of SO2, NOx, and CO [23]. Coal-combustion power plant plumes show enhancements in NOy, SO2, and CO2, while CO will typically be small [33]. More substantial enhancements of SO2 are typically associated with coal- and oil-fired units and are not frequently seen in natural-gas-fired units, this difference can help distinguish power plant emission sources [33].
The diurnal variation analysis between mercury species and trace gases was conducted for both urban and coastal environmental settings as Figure 9 shows. The central feature is the co-occurrence of the GEM maximum mixing ratio and the CO2, CO, CH4, and SO2 maximum mixing ratios at the UH_MT site. Figure 9a exhibits the 2012 spring UH_MT measurements. GEM, CO and CO2 had similar diurnal patterns. Enhancements began overnight and accumulated to a maximum in the early morning, which was then followed by steady decreasing trends. Figure 9c depicts fall 2012 at UH_MT, GEM, CO, CH4, SO2 and CO2 had similar diurnal patterns: the mixing ratio increased and reached the maximum in the early morning. The peak time of SO2 was 1–2 h later than the other trace gases. Key trace gases together with GEM mixing ratios were highest during the fall. Seasonal diurnal patterns for the UH_MT site are shown in Figure 9b (2012 summer), Figure 9d (2012 winter), and Figure 9e (2013 spring) together with Figure 9f (2012 summer) for the UH_CC site. Due to the limited availability of trace gas measurements at UH_CC, only CO and O3 were analyzed concurrently with GEM, which did not reveal any interesting correlations between the gases. To summarize, although the meteorological variables affect the trace gases diurnal patterns, the GEM, CO, SO2, CH4, and CO2 maximum mixing ratios simultaneous occurrence suggest they may originate from the same emission sources. As vehicular emissions are believed to be the primary source of NOx in urban areas, the offset timing of the NOx peak with GEM show that vehicular emissions may not be a significant source of mercury species in the southeastern Texas area.

3.6. Case Study of High Mercury Mixing Ratio Events

Presented here is a case study of one of the highest mercury events which occurred in April 2013 at both the UH_MT and UH_CC sites. On 6 April 2013, starting at 14:00 UTC (9:00 LST), a plume lasting roughly 3 h was measured at UH_MT, the GEM mixing ratio peaked at 4631 ppqv during this event. Here, we focus on the measurements monitored between 5 April 2013 00:00 and 7 April 2013 00:00 UTC, combined with the simultaneously measured meteorological parameters and trace gases for analysis. As Figure 10b shows, at the UH_MT site, the highest mercury mixing ratio was recorded (4631 ppqv) when the wind direction was out of the southwest with a wind speed of 6 m/s. The suspected mercury emission sources include the WA Parish coal-fired power plant which is located in the southwest direction of UH_MT site, the petrochemical and refinery facilities located in Texas City (south/southeast of UH_MT site), or related with a plume that was measured at the UH_CC site (Figure 10a) 3 days prior and recirculated due to the sea breeze cycle. Figure 10c displays the time series of boundary layer height, GEM, CO, CO2, CH4 and SO2 mixing ratios measured at UH_MT from 5 April 2013 00:00 to 7 April 2013 00:00 UTC. The most important characteristic is the GEM, CO, CO2, CH4, and SO2 maximum mixing ratios transpiring at the same time (14:00 UTC, 6 April 2013): the enhancements began at ~12:00 UTC (7:00 LST) and accumulated to a maximum around 14:30 UTC (9:30 LST), these trace gases maximum mixing ratios were tens to hundreds of times higher than the background levels, meanwhile, the boundary layer height was as low as 100 m during the accumulation of the trace gases.
On 3 April 2013, three days prior to the peak at UH_MT, the GEM mixing ratio was observed as high as 2824 ppqv at the UH_CC site (Figure 10a). We analyzed the GEM mixing ratio together with the basic meteorological parameters measured at UH_CC during the time period 2 April 2013 00:00–5 April 2013 00:00, when this high mercury event occurred, the wind direction was between 10° and 50° degrees (north to northeasterly wind) with a wind speed of 4 m/s. This is the direction of the Houston ship channel (Port of Houston) where there is a conglomeration of industry and known emissions sources.

4. Conclusions

Continuous measurements and comprehensive analysis of GEM, GOM and PBM were conducted under urban and coastal settings in southeastern Texas. This study investigated speciated atmospheric mercury in an area where industrial facilities are highly concentrated. The urban setting’s GEM mixing ratios were 5%–10% higher than the Northern Hemisphere background level. GOM and PBM mean mixing ratios were approximately six times higher than the GOM and PBM background level. In the coastal environment (UH_CC), the mean mixing ratio of GEM was 165 ppqv, higher than the GEM measured at other coastal sites in the United States. The mean value of GOM measured at the UH_CC site was 0.75 ppqv, and PBM 0.58 ppqv. Both GOM and PBM mean mixing ratios were higher than the GOM and PBM Northern Hemisphere background level, however generally lower than the urban site (UH_MT). This is seemingly due to the coastal settings reduction of source emission strength by dilution with cleaner marine air from the Gulf of Mexico. Consequently, the coastal site has a lower frequency of high mercury events compared with the urban site.
Mercury mixing ratios exhibited distinct diurnal patterns. At the urban site, GEM started increasing around midnight and accumulated until reaching the maximum just after sunrise. This was followed by a steady decrease in the subsequent hours. The coastal site diurnal pattern was inverted, as GEM exhibited a steady decrease at night and reached its minimum mixing ratio before the sunrise. It then slowly increased after sunrise and reached the maximum mixing ratio a few hours later. Of special note, it was found that coastal GOM accumulated to a maximum mixing ratio under mixed conditions when urban air mixed with marine air. This is attributed to the intensified sea breeze and increase in halogen radical oxidation combined with elevated levels of GEM from the urban air. At the urban site, lower GEM mixing ratios were associated with cleaner air originating from the Gulf of Mexico. GEM levels above 250 ppqv correlated with winds which originated from the north or northeast, where established point sources of atmospheric mercury emissions are located according to the National Emissions Inventory. For the coastal site, higher GEM levels (above 200 ppqv) were associated with winds from the north or northeast, where industrial emissions sources are plentiful as well. The relationships between mercury species and key trace gases were examined and found to have similar trends. The maximum mixing ratios of GEM, CO2, CO, and CH4 occurred at the same time at the urban site, and the GEM and CO peaked at the same time at the coastal site. This provides evidence that GEM, and key trace gases (CO, CO2, and CH4) probably shared some of the same emission sources.
Future work is warranted to quantify the emission sources combining modeling and measurements. We suggest conducting in-situ measurements with mobile laboratories to quantify emissions, specifically petrochemical refining emissions. For a better understanding of these source signatures, future studies should also include measurements of CO, CO2, CH4, NO, NO2, and SO2. The measurement of halogen radicals simultaneously with mercury measurements may also lead to a better understanding of GEM oxidation to GOM in a coastal environment.

Author Contributions

Conceptualization, T.G., L.L., A.T. and R.W.T.; methodology, T.G., L.L.; software, T.G., L.L.; validation, T.G., L.L., R.W.T. and X.L.; formal analysis, T.G., L.L.; investigation, T.G., L.L.; resources, T.G., L.L. and A.T.; data curation, L.L., A.T., X.L.; writing—original draft preparation, L.L.; writing—review and editing, T.G., L.L. and R.W.T.; visualization, T.G., L.L.; supervision, R.W.T.; project administration, T.G., L.L. and R.W.T.; funding acquisition, R.W.T. All authors have read and agreed to the published version of the manuscript.

Funding

This research received no external funding.

Acknowledgments

The authors would like to thank Patrick Laine, Barry Lefer, James Flynn, and other members in the Institute for Climate and Atmospheric Sciences at University of Houston for their help on the mercury data, meteorology data and key trace gases data measurements.

Conflicts of Interest

The authors declare no conflict of interest.

References

  1. Pirrone, N.; Costa, P.; Pacyna, J.M.; Ferrara, R. Mercury emissions to the atmosphere from natural and anthropogenic sources in the Mediterranean region. Atmos. Environ. 2001, 35, 2997–3006. [Google Scholar] [CrossRef]
  2. Sprovieri, F.; Pirrone, N.; Ebinghaus, R.; Kock, H.; Dommergue, A. A review of worldwide atmospheric mercury measurements. Atmos. Chem. Phys. 2010, 10, 8245–8265. [Google Scholar] [CrossRef] [Green Version]
  3. United States Environmental Protection Agency. Health Effect of Mercury. Available online: http://www.epa.gov/hg/effects.html (accessed on 23 August 2019).
  4. Mao, H.; Talbot, R.; Sigler, J.M.; Sive, B.C.; Hegarty, J.D. Seasonal and diurnal variations of Hg over New England. Atmos. Chem. Phys. 2008, 33, L20808. [Google Scholar] [CrossRef] [Green Version]
  5. Holmes, C.D.; Jacob, D.J.; Yang, X. Global lifetime of elemental mercury against oxidation by atomic bromine in the free troposphere. Geophys. Res. Lett. 2006, 33, L20808. [Google Scholar] [CrossRef] [Green Version]
  6. Skov, H.; Brooks, S.B.; Goodsite, M.E.; Lindberg, S.E.; Meyers, T.P.; Landis, M.S.; Larsen, M.R.B.; Jensen, B.; McConville, G.; Christensen, J. Fluxes of reactive gaseous mercury measured with a newly developed method using relaxed eddy accumulation. Atmos. Environ. 2006, 40, 5452–5463. [Google Scholar] [CrossRef]
  7. Schroeder, W.H.; Munthe, J. Atmospheric mercury—An overview. Atmos. Environ. 1998, 5, 809–822. [Google Scholar] [CrossRef]
  8. Gabriela, M.C.; Williamsona, D.G.; Brooks, S.; Lindberg, S. Atmospheric speciation of mercury in two contrasting Southeastern US airsheds. Atmos. Environ. 2005, 39, 4947–4958. [Google Scholar] [CrossRef]
  9. Laurier, F.J.; Mason, R.P.; Whalin, L.; Kato, S. Reactive gaseous mercury formation in the North Pacific Ocean’s marine boundary layer: A potential role of halogen chemistry. J. Geophys. Res. 2003. [Google Scholar] [CrossRef]
  10. Nair, U.S.; Wu, Y.; Walters, J.; Jansen, J.; Edgerton, E.S. Diurnal and seasonal variation of mercury species at coastal-suburban, urban, and rural sites in the southeastern United States. Atmos. Environ. 2011, 47, 499–508. [Google Scholar] [CrossRef]
  11. Duan, L.; Wang, X.; Wang, D.; Duan, Y.; Cheng, N.; Xiu, G. Atmospheric mercury speciation in Shanghai, China. Sci. Total Environ. 2017, 578, 460–468. [Google Scholar] [CrossRef]
  12. Schmidt, J.A.; Jacob, D.J.; Horowitz, H.M.; Hu, L.; Sherwen, T.; Evans, M.J. Modeling the observed tropospheric BrO background: Importance of multiphase chemistry and implications for ozone, OH, and mercury. J. Geophys. Res. 2015. [Google Scholar] [CrossRef] [Green Version]
  13. Valente, R.J.; Shea, C. Atmospheric mercury in the Great Smoky Mountains compared to regional and global levels. Atmos. Environ. 2007, 41, 1861–1873. [Google Scholar] [CrossRef]
  14. Lan, X.; Talbot, R.; Laine, P.; Lefer, B.; Flynn, J.; Sun, Z.; Torres, A. Seasonal and diurnal variations of total gaseous mercury in urban Houston, Texas (USA). Atmosphere 2014, 5, 399–419. [Google Scholar] [CrossRef] [Green Version]
  15. Cheng, I.; Zhang, L.; Mao, H.; Blanchard, P.; Tordon, R.; Dalziel, J. Seasonal and diurnal patterns of speciated atmospheric mercury at a coastal-rural and a coastal-urban site. Atmos. Environ. 2014, 82, 193–205. [Google Scholar] [CrossRef]
  16. Rutter, A.P.; Snyder, D.C.; Stone, E.A.; Schauer, J.J. In situ measurements of speciated atmospheric mercury and the identification of source regions in the Mexico City Metropolitan Area. Atmos. Chem. Phys. 2007, 9, 207–220. [Google Scholar] [CrossRef] [Green Version]
  17. Mao, H.; Talbot, R. Speciated mercury at marine, coastal, and inland sites in New England—Part 1: Temporal variability. Atmos. Chem. Phys. 2012, 12, 5099–5112. [Google Scholar] [CrossRef] [Green Version]
  18. Lan, X.; Talbot, R.; Castro, M.; Perry, K.; Luke, W. Seasonal and diurnal variations of atmospheric mercury across the US determined from AMNet monitoring data. Atmos. Chem. Phys. 2012, 12, 10569–10582. [Google Scholar] [CrossRef] [Green Version]
  19. Engle, M.A.; Tate, M.T.; Krabbenhoft, D.P.; Schauer, J.J.; Kolker, A.; Shanley, J.B.; Bothner, M.H. Comparison of atmospheric mercury speciation and deposition at nine sites across central and eastern North America. J. Geophys. Res. 2010, 115, D18306. [Google Scholar] [CrossRef]
  20. Malcolm, E.G.; Keeler, G.J.; Landis, M.S. The effects of the coastal environment on the atmospheric mercury cycle. J. Geophys. Res. 2003. [Google Scholar] [CrossRef] [Green Version]
  21. Liu, L.; Talbot, R.; Lan, X. Influence of Climate Change and Meteorological Factors on Houston’s Air Pollution: Ozone a Case Study. Atmosphere 2015, 6, 623–640. [Google Scholar] [CrossRef] [Green Version]
  22. Banta, R.M.; Senff, C.J.; Gammon, J.N.; Darby, L.S.; Ryerson, T.B.; Alvarez, R.J.; Sandberg, S.P.; Williams, E.J.; Trainer, M. A bad air day in Houston. Bull. Am. Meteorol. Soc. 2005, 86, 657–669. [Google Scholar] [CrossRef]
  23. Brooks, S.; Luke, W.; Cohen, M.; Kelly, P.; Lefer, B.; Rappengluck, B. Mercury species measured atop the Moody Tower TRAMP site, Houston, Texas. Atmos. Environ. 2010, 44, 4045–4055. [Google Scholar] [CrossRef]
  24. Ren, X.; Luke, W.; Kelley, P.; Cohen, M.; Ngan, F.; Artz, R.; Walker, J.; Brooks, S.; Moore, C.; Swartzendruber, P.; et al. Mercury Speciation at a Coastal Site in the Northern Gulf of Mexico: Results from the Grand Bay Intensive Studies in Summer 2010 and Spring 2011. Atmosphere 2014, 5, 230–251. [Google Scholar] [CrossRef] [Green Version]
  25. Sigler, J.M.; Mao, H.; Sive, B.C.; Talbot, R. Oceanic influence on atmospheric mercury at coastal and inland sites: A springtime noreaster in New England. Atmos. Chem. Phys. 2009, 9, 4023–4030. [Google Scholar] [CrossRef] [Green Version]
  26. Gratz, L.; Keeler, G.; Marsik, F.; Barres, J.; Dvonch, J. Atmospheric transport of speciated mercury across southern Lake Michigan: Influence from emission sources in the Chicago/Gary urban area. Sci. Total Environ. 2013, 448, 84–95. [Google Scholar] [CrossRef] [PubMed]
  27. Obrist, D.; Tas, E.; Peleg, M.; Matveev, V.; Faïn, X.; Asaf, D.; Luria, M. Bromine-induced oxidation of mercury in the mid-latitude atmosphere. Nat. Geosci. 2011, 4, 22–26. [Google Scholar] [CrossRef]
  28. Liu, B.; Keeler, G.J.; Dvonch, J.T.; Barres, J.A.; Lynam, M.M.; Marsik, F.J.; Morgan, T.J. Temporal variability of mercury speciation in urban air. Atmos. Environ. 2007, 10, 063. [Google Scholar] [CrossRef]
  29. Zhu, J.L.; Wang, T.; Talbot, R.; Mao, H. Characteristics of atmospheric Total Gaseous Mercury (TGM) observed in urban Nanjing, China. Atmos. Chem. Phys. 2012, 12, 12103–12118. [Google Scholar] [CrossRef] [Green Version]
  30. Yang, Y.; Chen, H.; Wang, D. Spatial and temporal distribution of gaseous elemental mercury in Chongqing, China. Environ. Monit. Assess. 2009, 156, 479–489. [Google Scholar] [CrossRef]
  31. Liu, B.; Keeler, G.; Timothy Dvonch, J.; Barres, J.; Lynam, M.; Marsik, F.; Morgan, J. Urban–rural differences in atmospheric mercury speciation. Atmos. Environ. 2010, 44, 2013–2023. [Google Scholar] [CrossRef]
  32. Lefer, B.; Rappenglück, B.; Flynn, J.; Haman, C. Photochemical and meteorological relationships during the Texas-II Radical and Aerosol Measurement Project (TRAMP). Atmos. Environ. 2010, 44, 4005–4013. [Google Scholar] [CrossRef]
  33. Ryerson, T.B.; Trainer, M.; Angevine, W.M.; Brock, C.A.; Dissly, R.W.; Fehsenfeld, F.C.; Frost, G.J.; Goldan, P.D.; Holloway, J.S.; Hubler, G.; et al. Effect of petrochemical industrial emissions of reactive alkenes and NOx on tropospheric ozone formation in Houston, Texas. J. Geophys. Res. 2003, 108, 4249. [Google Scholar] [CrossRef] [Green Version]
Figure 1. Major mercury emission sources in southeastern Texas according to the 2017 National Emission Inventory (NEI). Graduated symbols represent the emission source amount. The red star represents the University of Houston Moody Tower (UH_MT) site and the blue star represents the University of Houston Coastal Center (UH_CC) site.
Atmosphere 11 00073 g001
Figure 2. The complete time series of gaseous elemental mercury (GEM), gaseous oxidized mercury (GOM) and particulate bound mercury (PBM) at the University of Houston Moody Tower (UH_MT) (a) and the University of Houston Coastal Center (UH_CC) (b) sites. The time resolution of GEM data is 5 min, GOM and PBM data time resolution is 2 h.
Atmosphere 11 00073 g002
Figure 3. Monthly median values of gaseous elemental mercury (GEM), gaseous oxidized mercury (GOM), and particulate bound mercury (PBM) at the University of Houston Moody Tower (UH_MT) and the University of Houston Coastal Center (UH_CC) sites.
Atmosphere 11 00073 g003
Figure 4. (a) 5 min resolution diurnal variations of gaseous elemental mercury (GEM), gaseous oxidized mercury (GOM), and particulate bound mercury (PBM) at the University of Houston Moody Tower (UH_MT); (b) Averaged 1 h resolution diurnal variations of GEM, GOM, and PBM at UH_MT; (c) 5-min resolution diurnal variations of GEM, GOM and PBM at the University of Houston Coastal Center (UH_CC); (d) Averaged 1 h resolution diurnal variations of GEM, GOM, and PBM at UH_CC.
Atmosphere 11 00073 g004
Figure 5. Seasonal diurnal variations of gaseous elemental mercury (GEM) 5 min average, gaseous oxidized mercury (GOM) and particulate bound mercury (PBM) 1 h averages at the University of Houston Moody Tower (UH_MT) and the University of Houston Coastal Center (UH_CC) sites. Figure (a,c,e) represent GEM, GOM and PBM at UH_MT and figure (b,d,f) represent GEM, GOM and PBM at UH_CC respectively.
Atmosphere 11 00073 g005
Figure 6. 5 min averaged diurnal variations of gaseous elemental mercury (GEM) versus meteorological parameters at the University of Houston Moody Tower (UH_MT) site for seasons (a) Spring 2012 (b) Summer 2012 (c) Fall 2012 (d) Winter 2012 and (e) Spring 2013. Figure (f) displays the anti-correlation between planetary boundary layer (PBL) height and the GEM mixing ratio at UH_MT.
Atmosphere 11 00073 g006
Figure 7. Wind rose plots for analysis of the relationship between gaseous elemental mercury (GEM), gaseous oxidized mercury (GOM), particulate bound mercury (PBM) and wind speed/wind direction at the University of Houston Moody Tower (UH_MT) and the University of Houston Coastal Center (UH_CC) sites. Figure (a,c,e) represent GEM, GOM and PBM at UH_MT and figure (b,d,f) represent GEM, GOM and PBM at UH_CC respectively.
Atmosphere 11 00073 g007
Figure 8. Wind rose for the low gaseous elemental mercury (GEM) period, April 2013 (a) and high GEM period, September 2012 (b) at the University of Houston Coastal Center (UH_CC) site.
Atmosphere 11 00073 g008
Figure 9. Diurnal variations of gaseous elemental mercury (GEM) and other trace gases mixing ratios measured at the University of Houston (UH_MT) for seasons (a) Spring 2012 (b) Summer 2012 (c) Fall 2012 (d) Winter 2012 and (e) Spring 2013. Figure (f) shows the trace gas data for the University of Houston Coastal Center (UH_CC) site during Summer 2012.
Atmosphere 11 00073 g009
Figure 10. Case study of high mercury mixing ratio events: (a) high gaseous elemental mercury (GEM) mixing ratio monitored during 2 April 2013 00:00–5 April 2013 00:00 UTC at the University of Houston Coastal Center (UH_CC) site with basic meteorological parameters measurements; (b) high GEM mixing ratio monitored during 5 April 2013 00:00~7 April 2013 00:00 UTC at the University of Houston Moody Tower (UH_MT) site with basic meteorological parameters measurements; (c) high GEM mixing ratio monitored during 5 April 2013 00:00~7 April 2013 00:00 UTC at UH_MT site with other trace gases measurements.
Atmosphere 11 00073 g010
Table 1. Statistical summary of gaseous elemental mercury (GEM), gaseous oxidized mercury (GOM) and particulate bound mercury (PBM) measurements at the University of Houston Moody Tower (UH_MT) and University of Houston Coastal Center (UH_CC) sites. * indicates a lack of data.
Moody Tower (UH_MT) Coastal Center (UH_CC)
Mean ± StdMedianRangeNMean ± StdMedianRangeN
GEM (ppqv)
2012 spring182 ± 1718081~9737796****
2012 summer189 ± 1517994~110011,483179 ± 3617611~4985137
2012 fall183 ± 26172113~27,30010,690197 ± 2917311~223012,559
2012 winter182 ± 18179112~269011,405174 ± 2417012~75410,164
2013 spring184 ± 2318096~463010,348113 ± 1912412~282011,297
Total184 ± 3017881~27,30051,723164 ± 3416211~282039,160
GOM (ppqv)
2012 spring1.09 ± 0.50.640.10~12.39590****
2012 summer0.88 ± 0.30.420.18~26.048740.46 ± 0.40.260.15~3.15407
2012 fall0.66 ± 0.10.470.21~9.239440.69 ± 1.10.180.1~10.711042
2012 winter0.51 ± 1.60.290.19~11.118110.66 ± 0.70.030.1~8.52842
2013 spring0.48 ± 1.20.170.14~11.577561.09 ± 2.10.890.1~10.76790
Total0.72 ± 0.90.390.10~26.0438560.75 ± 0.30.230.1~10.763082
PBM (ppqv)
2012 spring0.47 ± 1.90.410.18~6.01661****
2012 summer0.45 ± 1.30.290.11~5.538800.19 ± 0.20.120.12~4.69407
2012 fall0.47 ± 1.60.360.15~6.739550.59 ± 0.90.260.14~7.551042
2012 winter0.57 ± 0.80.410.21~4.868360.67 ± 1.10.210.11~7.27842
2013 spring0.57 ± 1.00.310.17~17.655230.67 ± 0.80.550.16~5.96790
Total0.71 ± 0.10.380.10~17.6539760.58 ± 1.60.240.10~7.553082

