Monitoring Dust Events Using Doppler Lidar and Ceilometer in Iceland
Abstract
:1. Introduction
2. Research Sites, and Data Processing
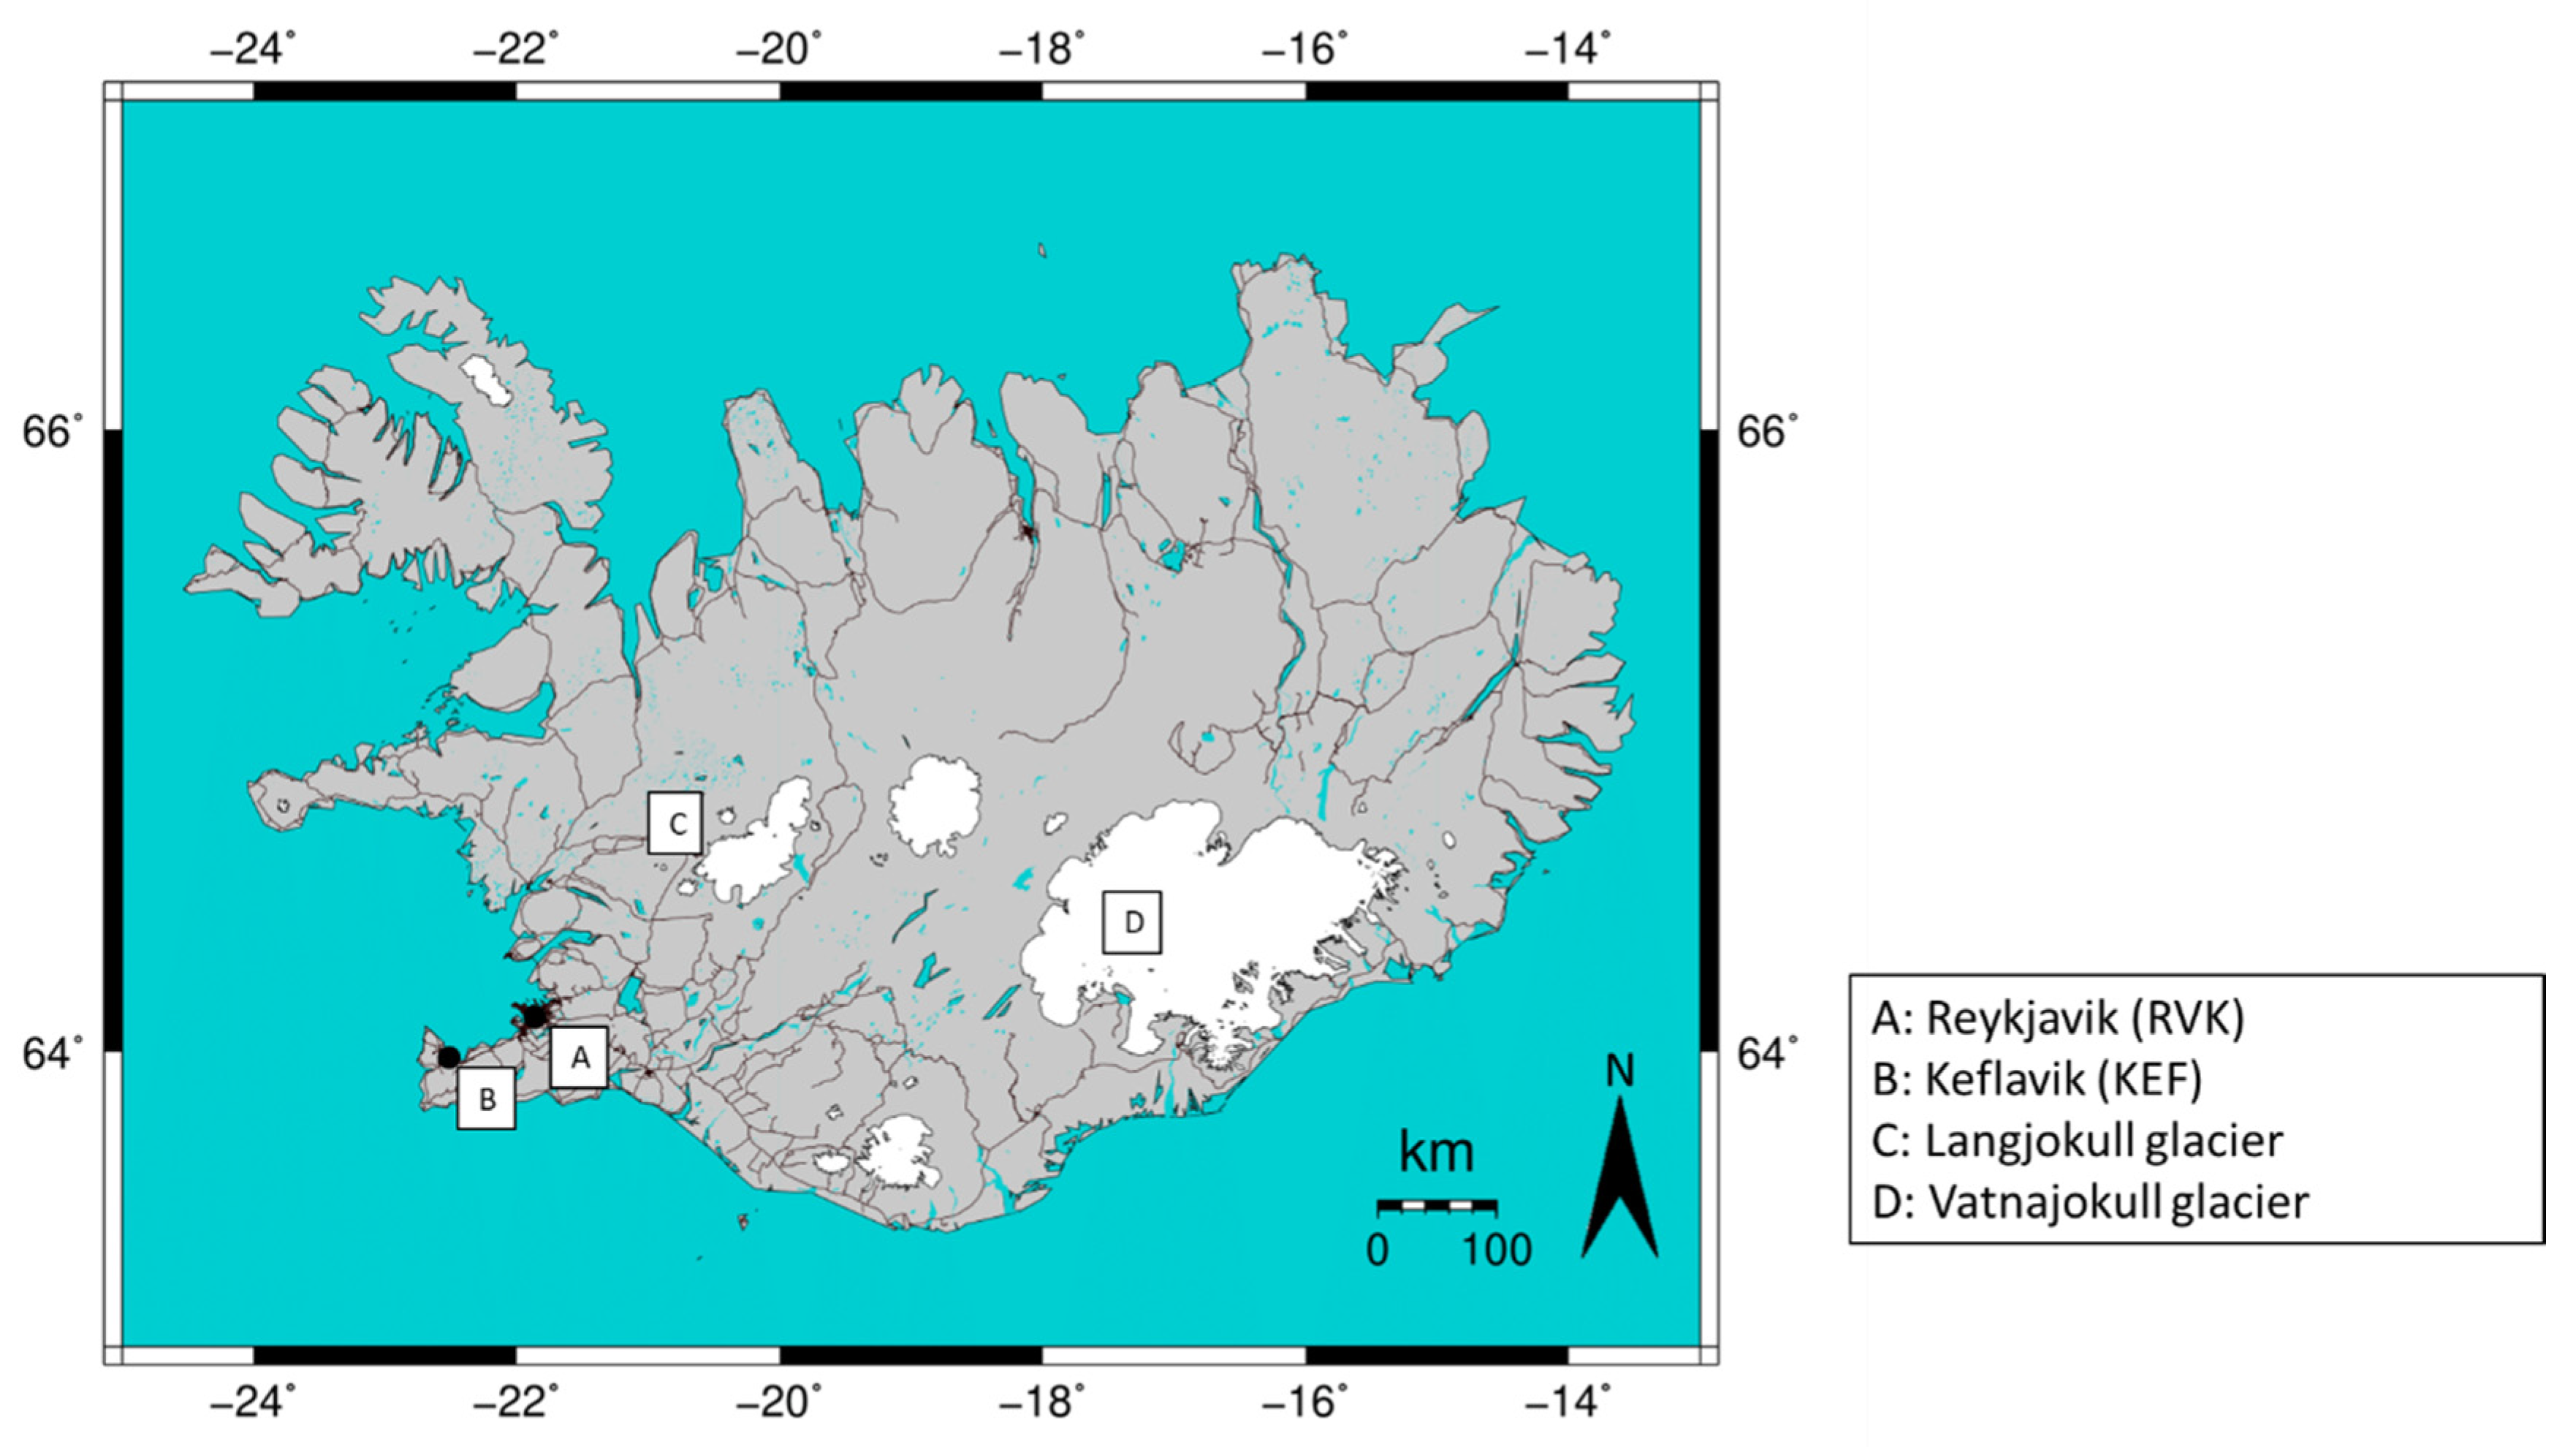
2.1. Observation Sites and Dust Events
2.2. Instruments
2.3. Lidar and Ceilometer Data Processing
2.3.1. Lidar Data Processing: Backscatter Coefficient
2.3.2. Lidar Data Processing: Depolarization Ratio
2.3.3. Ceilometer Data Processing
3. Results
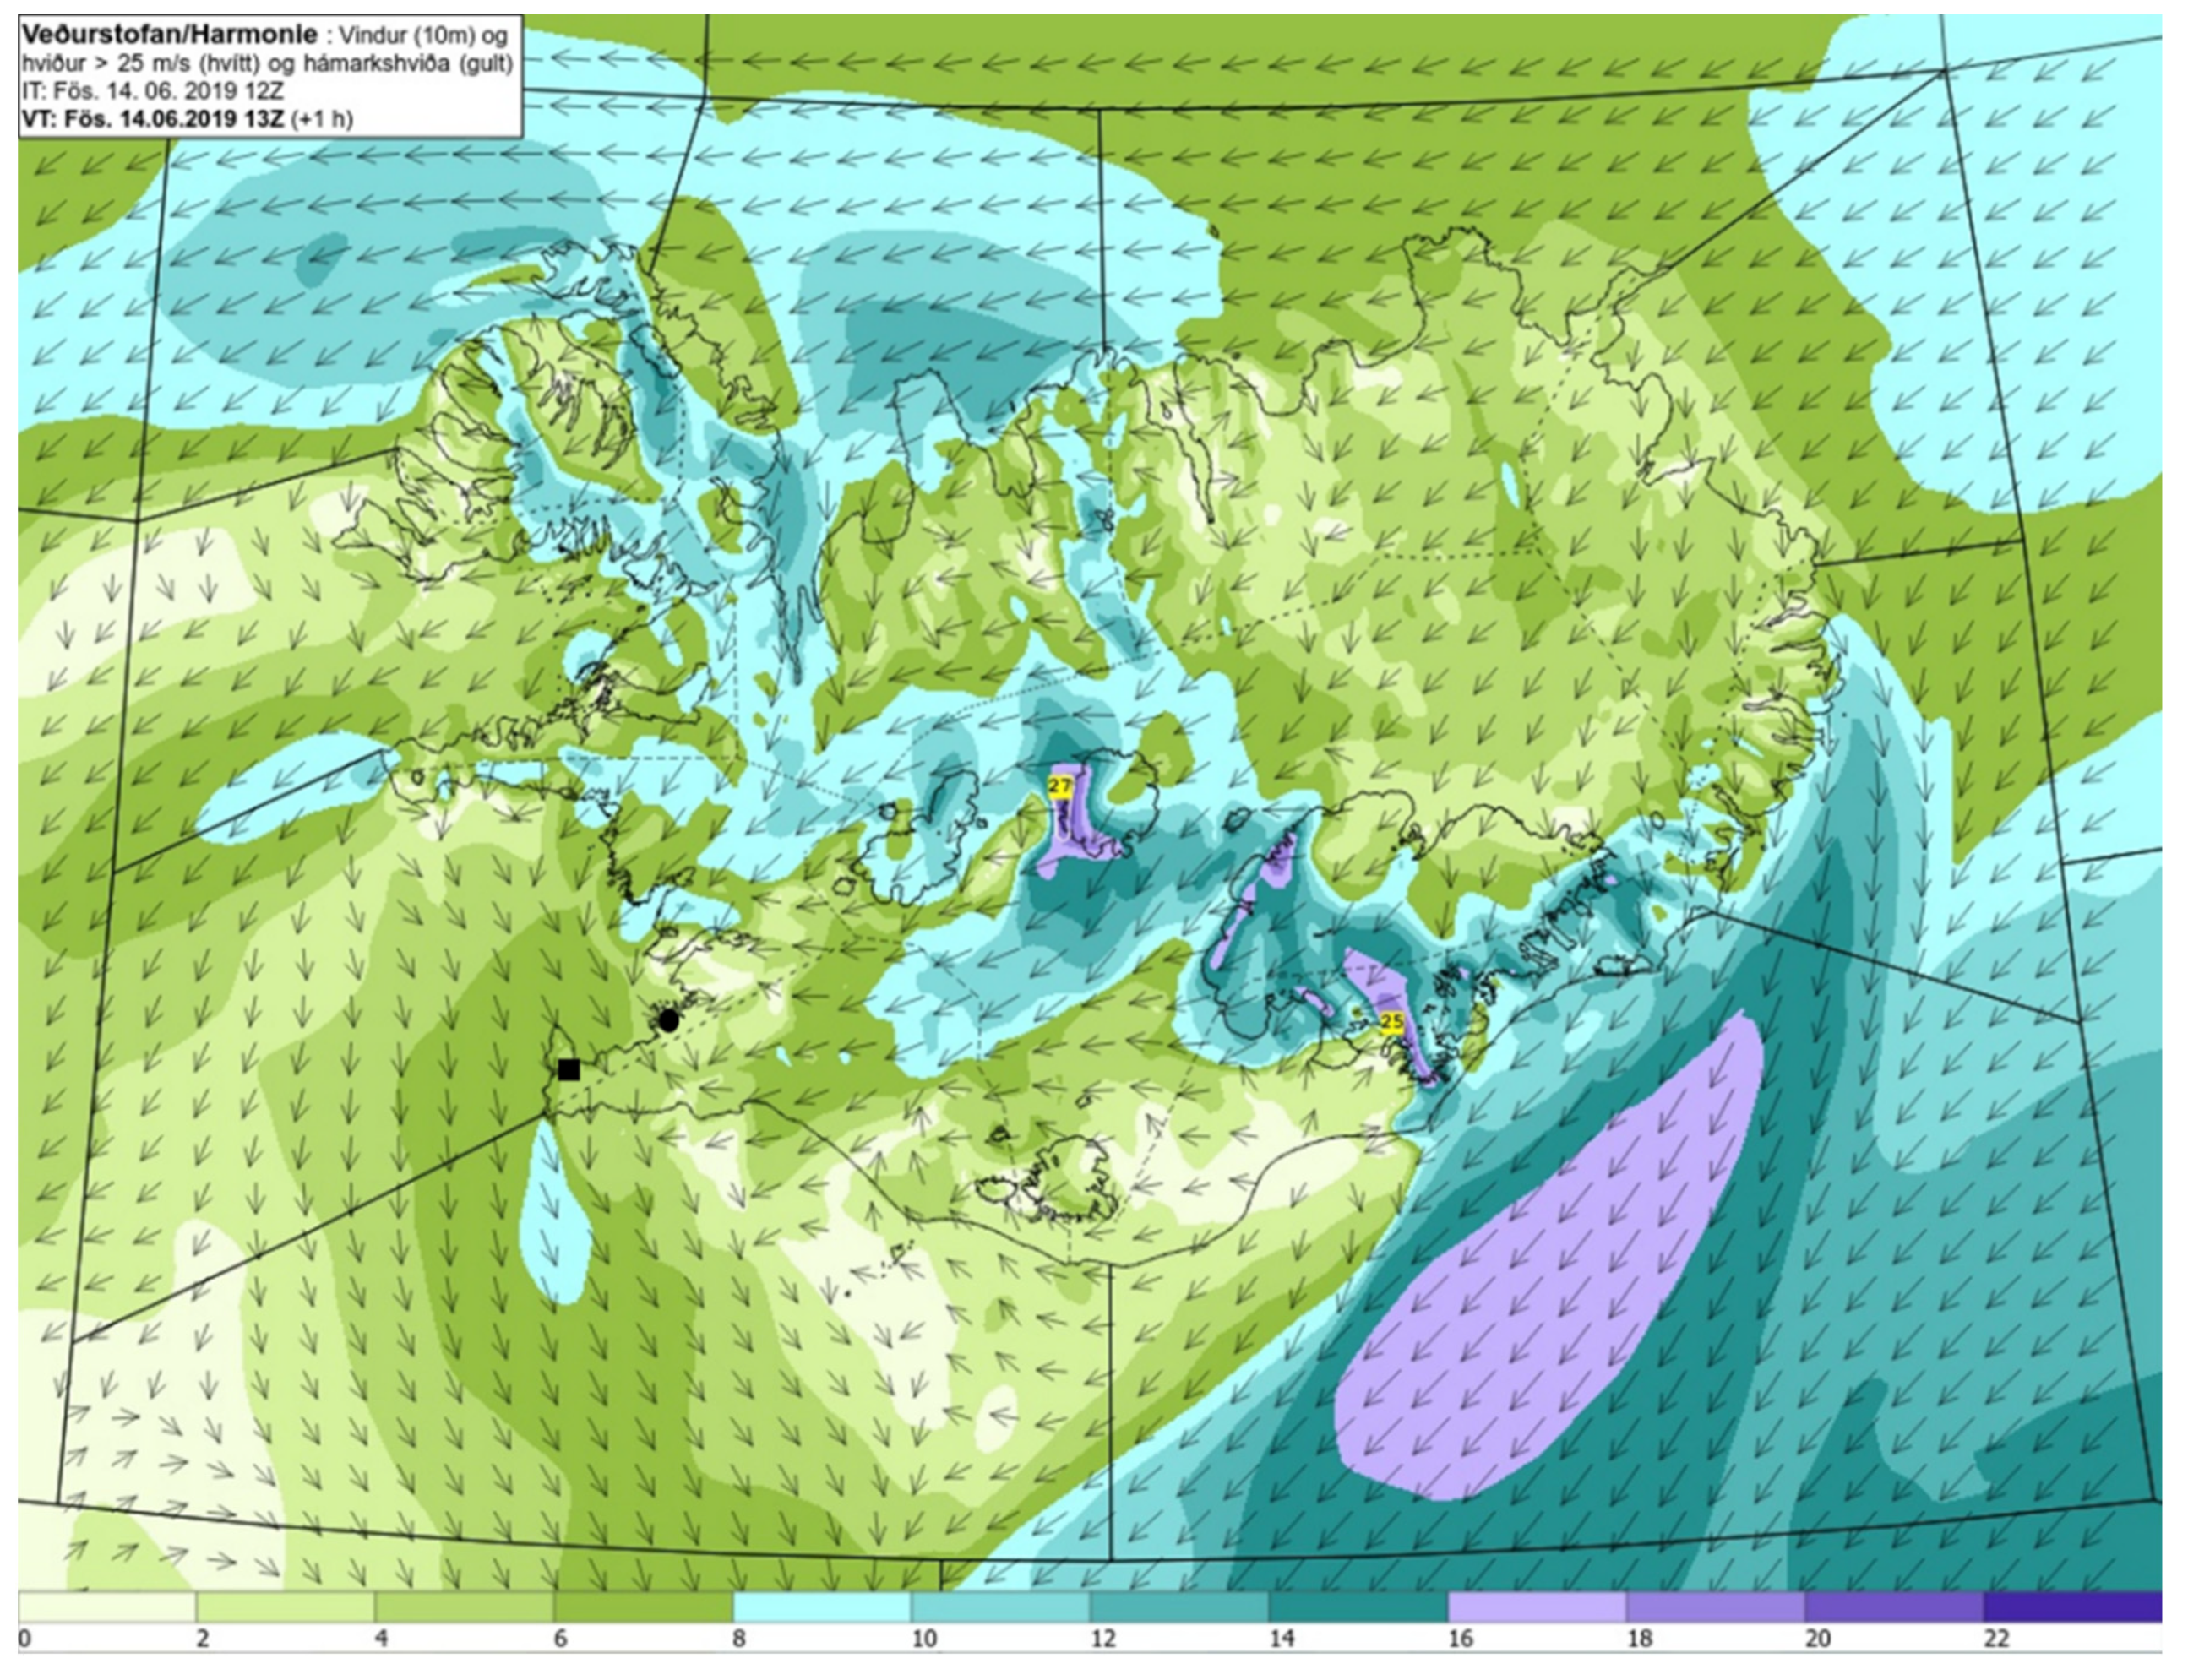
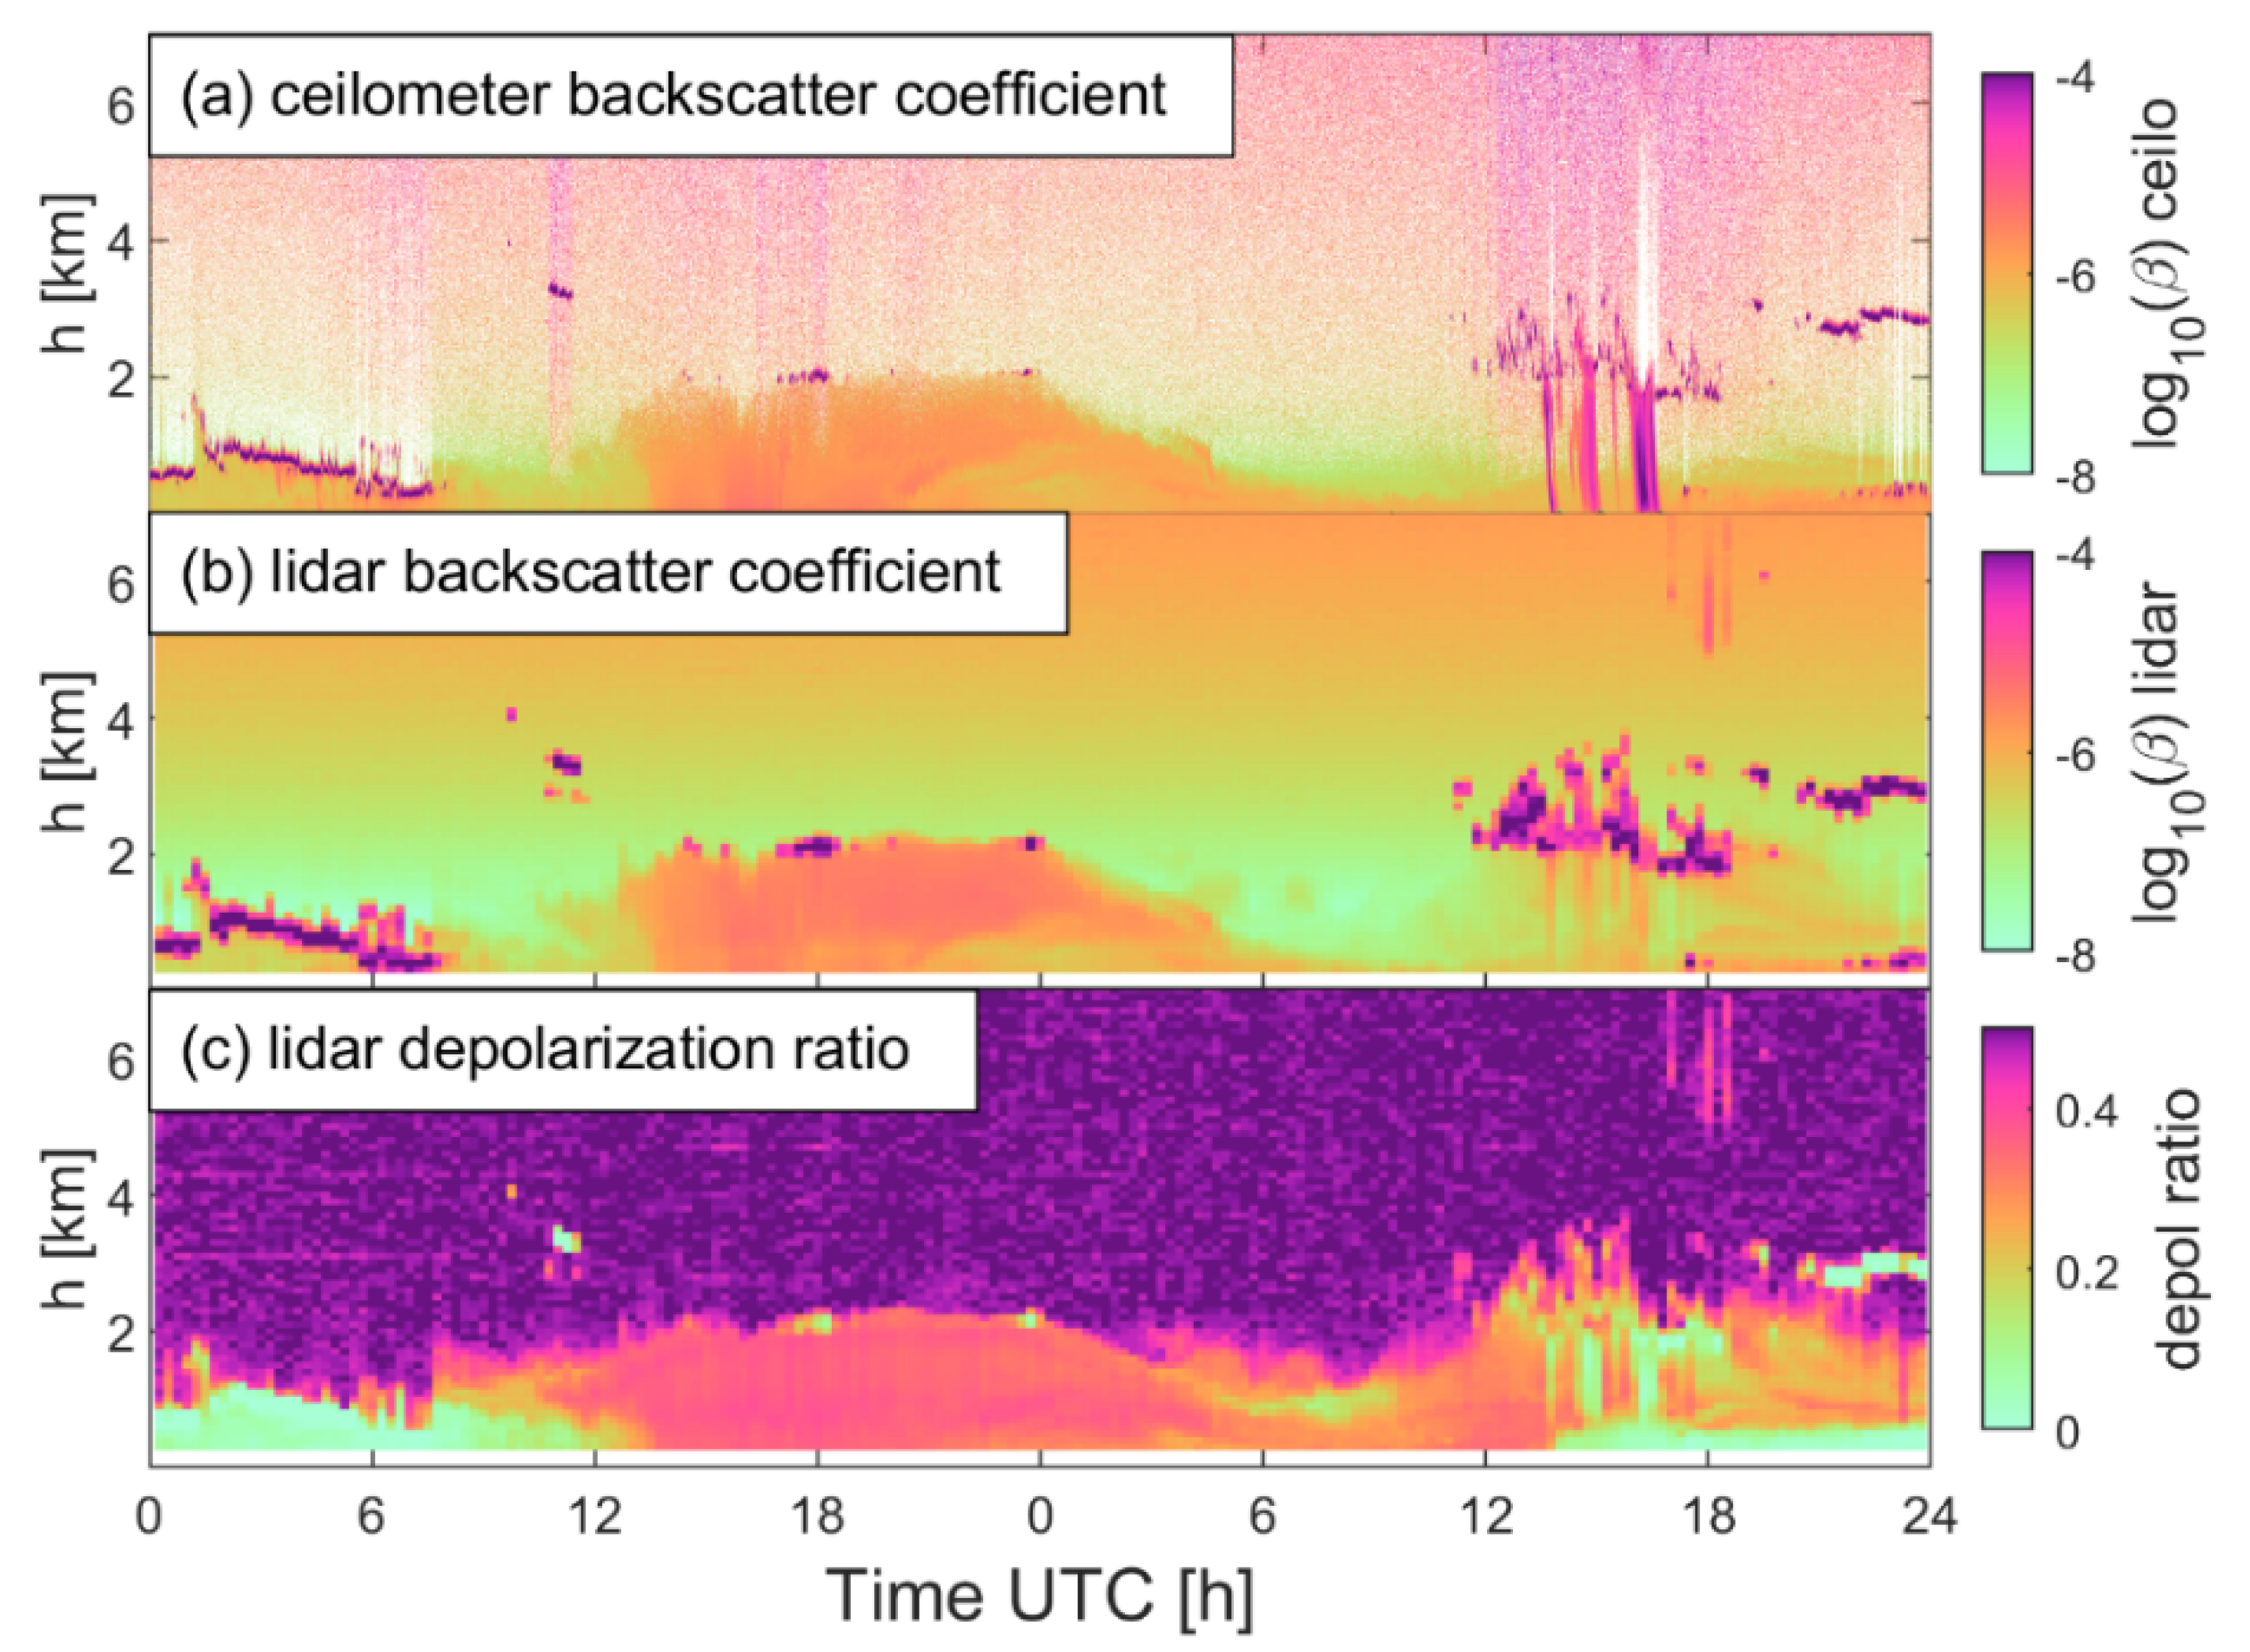
3.1. The June Case (14 June and 15 June)
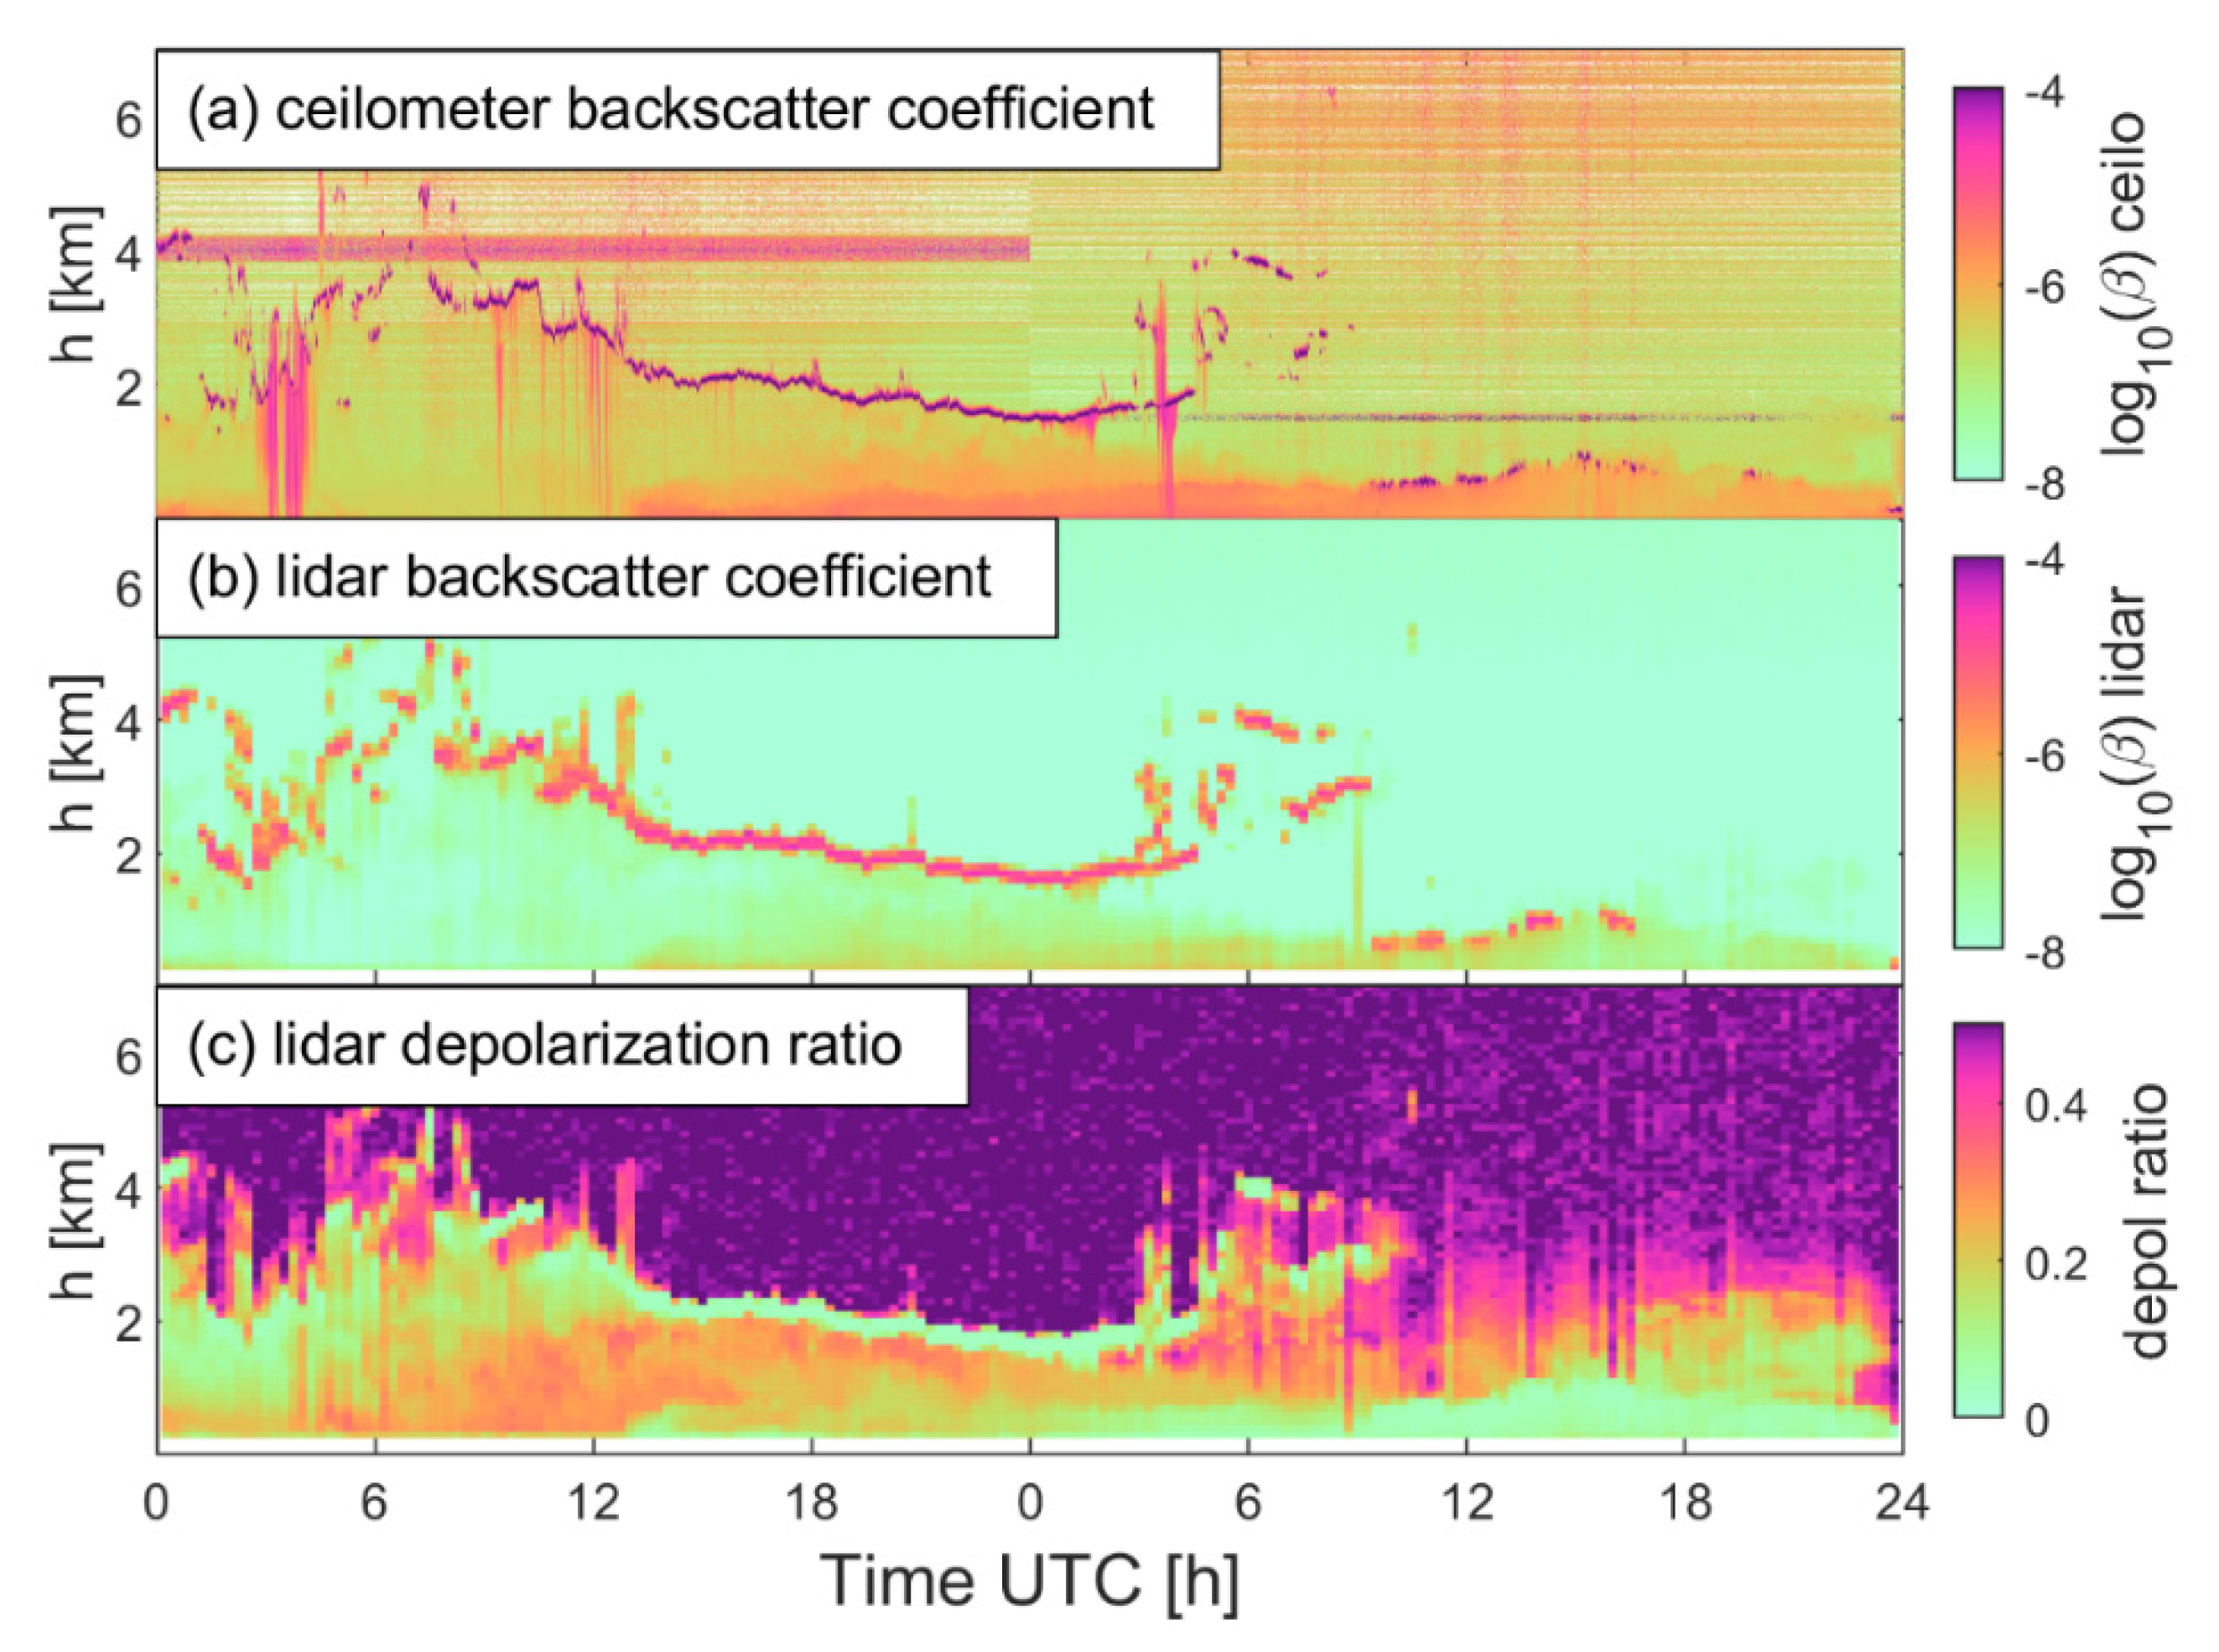
3.2. July Case (31 July and 1 August)
4. Discussion
4.1. The Difference Between June and July Case
4.2. The Difference Between Lidar and Ceilometer Measurements
5. Conclusions
- (1)
- The two instruments consistently reveal similar vertical distributions of aerosols during both dust events. However, the absolute backscatter coefficient profiles are challenging to derive and compare, due to the different nature of the two instruments. Nevertheless, spatial and temporal distributions observed in lidar and ceilometer data are confirmed by observations from other measurements like PM concentration.
- (2)
- During the processing of lidar and ceilometer data, unrealistic signals have been identified. The factor as an empirical constant has been introduced to correct the unrealistic ceilometer data, which could also be a key source of uncertainty. With the backward Klett inversion method, the particle backscatter coefficients can be retrieved from ceilometer measurements. The lidar data has been calibrated for the focal effect to retrieve the correct relative backscatter coefficient profiles. The difference between lidar and ceilometer can be explained as (i) differences in calibration and data processing procedure, and (ii) different laser wavelengths.
- (3)
- Distinct differences between two dust events have been identified: during the June case, the lidar backscatter coefficient was larger while the ceilometer derived backscatter coefficient was larger during the July case. Particle size distribution retrieved from the sun-photometer revealed that the particle size was larger in the June case, which explains why lidar backscatter coefficients were larger than ceilometers’ in the June case, since the wavelength of Doppler lidar is longer.
- (4)
- Dust particles are expected to be non-spherical, with the detection of high depolarization ratio and high backscatter coefficients during a dust event. The depolarization ratio observed in this study is distinctively different during the two dust events. In the June case, the depolarization ratio revealed a similar temporal and vertical distribution as the backscatter coefficient, as expected. In the July case, depolarization ratio was high in the morning of 31 July while the backscatter coefficients were relatively low. The backscatter coefficients increased from the afternoon of 31 July but the depolarization ratio was, on the contrary, relatively low. The backscatter coefficients are directly related to the aerosols concentration while the depolarization ratio is less dependent on aerosol concentration. It is determined by the shape of the scatterers, which can be affected by relative humidity. The air remained dry in the June case and both backscatter coefficient and depolarization ratio measurements show a similar pattern. In the July case, relative humidity varied a lot during the two-day observation period. Consequently, we can conclude that when the air is dry and the particle concentration relatively high, the dust can be observed from both backscatter coefficient and depolarization ratio measurements; when the air is dry but particle concentration is low, the aerosols layer may be observed by depolarization ratio but not backscatter coefficients; when air is humid and the particles condense, the aerosols are more obvious from backscatter coefficient compared to depolarization ratio measurements. In general, the relative humidity may have a significant impact on lidar measurements, including backscatter coefficients, depolarization ratio, and also extinction coefficients, which is critical to aviation meteorology [14].
Supplementary Materials
Author Contributions
Funding
Acknowledgments
Conflicts of Interest
References
- Gao, H.; Cheng, B.; Wang, J.; Li, K.; Zhao, J.; Li, D. Object Classification Using CNN-Based Fusion of Vision and LIDAR in Autonomous Vehicle Environment. IEEE Trans. Ind. Inform. 2018, 14, 4224–4231. [Google Scholar] [CrossRef]
- Brook, A.; Ben-Dor, E.; Richter, R. Fusion of hyperspectral images and LiDAR data for civil engineering structure monitoring. In Proceedings of the 2010 2nd Workshop on Hyperspectral Image and Signal Processing: Evolution in Remote Sensing, Reykjavik, Iceland, 14–16 June 2010; pp. 1–5. [Google Scholar]
- Bilbro, J.; Fichtl, G.; Fitzjarrald, D.; Krause, M.; Lee, R. Airborne Doppler Lidar Wind Field Measurements. Bull. Am. Meteorol. Soc. 1984, 65, 348–359. [Google Scholar] [CrossRef] [Green Version]
- Chan, P.W. Application of LIDAR-based F-factor in windshear alerting. Meteorol. Z. 2012, 21, 193–204. [Google Scholar] [CrossRef]
- Gryning, S.-E.; Mikkelsen, T.; Baehr, C.; Dabas, A.; Gómez, P.; O’Connor, E.; Rottner, L.; Sjöholm, M.; Suomi, I.; Vasiljević, N. Measurement methodologies for wind energy based on ground-level remote sensing. In Renewable Energy Forecasting; Elsevier: Cambridge, UK, 2017; pp. 29–56. ISBN 978-0-08-100504-0. [Google Scholar]
- Yang, S.; Petersen, G.N.; von Löwis, S.; Preißler, J.; Finger, D.C. Determination of eddy dissipation rate by Doppler lidar in Reykjavik, Iceland. Meteorol. Appl. 2020, 27, e1951. [Google Scholar] [CrossRef]
- Ansmann, A.; Müller, D. Lidar and Atmospheric Aerosol Particles. In Lidar: Range-Resolved Optical Remote Sensing of the Atmosphere; Weitkamp, C., Ed.; Springer Series in Optical Sciences; Springer: New York, NY, USA, 2005; pp. 105–141. ISBN 978-0-387-25101-1. [Google Scholar]
- Burton, S.P.; Ferrare, R.A.; Hostetler, C.A.; Hair, J.W.; Rogers, R.R.; Obland, M.D.; Butler, C.F.; Cook, A.L.; Harper, D.B.; Froyd, K.D. Aerosol classification using airborne High Spectral Resolution Lidar measurements – methodology and examples. Atmospheric Meas. Tech. 2012, 5, 73–98. [Google Scholar] [CrossRef] [Green Version]
- Sassen, K. Polarization in Lidar. In Lidar; Weitkamp, C., Ed.; Springer: New York, NY, USA, 2005; Volume 102, pp. 19–42. ISBN 978-0-387-40075-4. [Google Scholar]
- Groß, S.; Freudenthaler, V.; Wiegner, M.; Gasteiger, J.; Geiß, A.; Schnell, F. Dual-wavelength linear depolarization ratio of volcanic aerosols: Lidar measurements of the Eyjafjallajökull plume over Maisach, Germany. Atmos. Environ. 2012, 48, 85–96. [Google Scholar] [CrossRef] [Green Version]
- Tuononen, M.; O’Connor, E.J.; Sinclair, V.A.; Vakkari, V. Low-Level Jets over Utö, Finland, Based on Doppler Lidar Observations. J. Appl. Meteorol. Climatol. 2017, 56, 2577–2594. [Google Scholar] [CrossRef]
- Banakh, V.A.; Smalikho, I.; Köpp, F.; Werner, C. Measurements of Turbulent Energy Dissipation Rate with a CW Doppler Lidar in the Atmospheric Boundary Layer. J. Atmospheric Ocean. Technol. 1999, 16, 1044–1061. [Google Scholar] [CrossRef]
- Chan, P.W.; Lee, Y.F. Performance of LIDAR- and radar-based turbulence intensity measurement in comparison with anemometer-based turbulence intensity estimation based on aircraft data for a typical case of terrain-induced turbulence in association with a typhoon. J. Zhejiang Univ. Sci. A 2013, 14, 469–481. [Google Scholar] [CrossRef] [Green Version]
- Gultepe, I.; Sharman, R.; Williams, P.; Zhou, B.; Ellrod, G.; Minnis, P.; Trier, S.; Griffin, S.; Yum, S.S.; Gharabaghi, B.; et al. A review of high impact weather for aviation meteorology. Pure Appl. Geophys. 2019, 176, 1869–1921. [Google Scholar] [CrossRef]
- Thobois, L.; Cariou, J.P.; Gultepe, I. Review of Lidar-Based Applications for Aviation Weather. Pure Appl. Geophys. 2019, 176, 1959–1976. [Google Scholar] [CrossRef]
- Münkel, C.; Eresmaa, N.; Räsänen, J.; Karppinen, A. Retrieval of mixing height and dust concentration with lidar ceilometer. Bound.-Layer Meteorol. 2007, 124, 117–128. [Google Scholar] [CrossRef]
- Wiegner, M.; Madonna, F.; Binietoglou, I.; Forkel, R.; Gasteiger, J.; Geiß, A.; Pappalardo, G.; Schäfer, K.; Thomas, W. What is the benefit of ceilometers for aerosol remote sensing? An answer from EARLINET. Atmospheric Meas. Tech. 2014, 7, 1979–1997. [Google Scholar] [CrossRef] [Green Version]
- Arnalds, O.; Dagsson-Waldhauserova, P.; Olafsson, H. The Icelandic volcanic aeolian environment: Processes and impacts—A review. Aeolian Res. 2016, 20, 176–195. [Google Scholar] [CrossRef] [Green Version]
- Ólafsson, H.; Furger, M.; Brümmer, B. The weather and climate of Iceland. Meteorol. Z. 2007, 16, 5–8. [Google Scholar] [CrossRef]
- Thordarson, T.; Larsen, G. Volcanism in Iceland in historical time: Volcano types, eruption styles and eruptive history-ScienceDirect. J. Geodyn. 2007, 43, 118–152. [Google Scholar] [CrossRef]
- Budd, L.; Griggs, S.; Howarth, D.; Ison, S. A Fiasco of Volcanic Proportions? Eyjafjallajökull and the Closure of European Airspace. Mobilities 2011, 6, 31–40. [Google Scholar] [CrossRef]
- Carlsen, H.K.; Gislason, T.; Forsberg, B.; Meister, K.; Thorsteinsson, T.; Jóhannsson, T.; Finnbjornsdottir, R.; Oudin, A. Emergency Hospital Visits in Association with Volcanic Ash, Dust Storms and Other Sources of Ambient Particles: A Time-Series Study in Reykjavík, Iceland. Int. J. Environ. Res. Public. Health 2015, 12, 4047–4059. [Google Scholar] [CrossRef] [Green Version]
- Goudie, A.S. Desert dust and human health disorders. Environ. Int. 2014, 63, 101–113. [Google Scholar] [CrossRef]
- Gústafsson, L.E.; Steinecke, K. Airborne contaminants and their impact on the city of Reykjavi’k, Iceland. Sci. Total Environ. 1995, 160–161, 363–372. [Google Scholar] [CrossRef]
- Saidou Chaibou, A.A.; Ma, X.; Sha, T. Dust radiative forcing and its impact on surface energy budget over West Africa. Sci. Rep. 2020, 10, 12236. [Google Scholar] [CrossRef] [PubMed]
- Wittmann, M.; Groot Zwaaftink, C.D.; Steffensen Schmidt, L.; Guðmundsson, S.; Pálsson, F.; Arnalds, O.; Björnsson, H.; Thorsteinsson, T.; Stohl, A. Impact of dust deposition on the albedo of Vatnajökull ice cap, Iceland. The Cryosphere 2017, 11, 741–754. [Google Scholar] [CrossRef] [Green Version]
- Dagsson-Waldhauserova, P.; Arnalds, O.; Olafsson, H. Long-term variability of dust events in Iceland (1949–2011). Atmospheric Chem. Phys. 2014, 14, 13411–13422. [Google Scholar] [CrossRef] [Green Version]
- Gudmundsson, M.T.; Pedersen, R.; Vogfjörd, K.; Thorbjarnardóttir, B.; Jakobsdóttir, S.; Roberts, M.J. Eruptions of Eyjafjallajökull Volcano, Iceland. Eos Trans. Am. Geophys. Union 2010, 91, 190–191. [Google Scholar] [CrossRef]
- Petersen, G.N.; Bjornsson, H.; Arason, P. The impact of the atmosphere on the Eyjafjallajökull 2010 eruption plume. J. Geophys. Res. Atmospheres 2012, 117. [Google Scholar] [CrossRef]
- Rix, M.; Valks, P.; Hao, N.; Loyola, D.; Schlager, H.; Huntrieser, H.; Flemming, J.; Koehler, U.; Schumann, U.; Inness, A. Volcanic SO2, BrO and plume height estimations using GOME-2 satellite measurements during the eruption of Eyjafjallajökull in May 2010. J. Geophys. Res. Atmospheres 2012, 117. [Google Scholar] [CrossRef] [Green Version]
- Chazette, P.; Dabas, A.; Sanak, J.; Lardier, M.; Royer, P. French airborne lidar measurements for Eyjafjallajökull ash plume survey. Atmospheric Chem. Phys. 2012, 12, 7059–7072. [Google Scholar] [CrossRef] [Green Version]
- Ansmann, A.; Tesche, M.; Groß, S.; Freudenthaler, V.; Seifert, P.; Hiebsch, A.; Schmidt, J.; Wandinger, U.; Mattis, I.; Müller, D.; et al. The 16 April 2010 major volcanic ash plume over central Europe: EARLINET lidar and AERONET photometer observations at Leipzig and Munich, Germany. Geophys. Res. Lett. 2010, 37. [Google Scholar] [CrossRef] [Green Version]
- Sicard, M.; Guerrero-Rascado, J.L.; Navas-Guzmán, F.; Preißler, J.; Molero, F.; Tomás, S.; Bravo-Aranda, J.A.; Comerón, A.; Rocadenbosch, F.; Wagner, F.; et al. Monitoring of the Eyjafjallajökull volcanic aerosol plume over the Iberian Peninsula by means of four EARLINET lidar stations. Atmospheric Chem. Phys. 2012, 12, 3115–3130. [Google Scholar] [CrossRef] [Green Version]
- Wiegner, M.; Gasteiger, J.; Groß, S.; Schnell, F.; Freudenthaler, V.; Forkel, R. Characterization of the Eyjafjallajökull ash-plume: Potential of lidar remote sensing. Phys. Chem. Earth Parts ABC 2012, 45–46, 79–86. [Google Scholar] [CrossRef]
- Prospero, J.M.; Bullard, J.E.; Hodgkins, R. High-Latitude Dust Over the North Atlantic: Inputs from Icelandic Proglacial Dust Storms. Science 2012, 335, 1078–1082. [Google Scholar] [CrossRef] [PubMed]
- Dagsson-Waldhauserova, P.; Renard, J.-B.; Olafsson, H.; Vignelles, D.; Berthet, G.; Verdier, N. Duverger Vertical distribution of aerosols in dust storms during the Arctic winter. Sci. Rep. 2019, 9, 1–11. [Google Scholar] [CrossRef] [PubMed]
- Liao, H.; Jing, H.; Ma, C.; Tao, Q.; Li, Z. Field measurement study on turbulence field by wind tower and Windcube Lidar in mountain valley. J. Wind Eng. Ind. Aerodyn. 2020, 197, 104090. [Google Scholar] [CrossRef]
- Stephan, A.; Wildmann, N.; Smalikho, I.N. Effectiveness of the MFAS Method for Determining the Wind Velocity Vector from Windcube 200s Lidar Measurements. Atmospheric Ocean. Opt. 2019, 32, 555–563. [Google Scholar] [CrossRef]
- Statistics Iceland Population by Municipality, Sex, Citizenship and Quarters 2010–2020. Available online: http://px.hagstofa.is/pxis/pxweb/is/Ibuar/Ibuar__mannfjoldi__1_yfirlit__arsfjordungstolur/MAN10001.px/table/tableViewLayout1/?rxid=c9d9c074-79f2-40c2-8a30-5479757324ba (accessed on 5 October 2020).
- IMO Tíðarfar í (Monthly Report of) September 2019. Available online: https://www.vedur.is/um-vi/frettir/tidarfar-i-september-2019#sumar (accessed on 1 October 2020).
- Stein, A.F.; Draxler, R.R.; Rolph, G.D.; Stunder, B.J.B.; Cohen, M.D.; Ngan, F. NOAA’s HYSPLIT Atmospheric Transport and Dispersion Modeling System. Bull. Am. Meteorol. Soc. 2015, 96, 2059–2077. [Google Scholar] [CrossRef]
- Boquet, M.; Royer, P.; Cariou, J.-P.; Machta, M.; Valla, M. Simulation of Doppler Lidar Measurement Range and Data Availability. J. Atmospheric Ocean. Technol. 2016, 33, 977–987. [Google Scholar] [CrossRef]
- Preißler, J.; Leosphere Inc., Saclay, France. Personal communication, 2020.
- Freudenthaler, V.; Esselborn, M.; Wiegner, M.; Heese, B.; Tesche, M.; Ansmann, A.; MüLLER, D.; Althausen, D.; Wirth, M.; Fix, A.; et al. Depolarization ratio profiling at several wavelengths in pure Saharan dust during SAMUM 2006. Tellus B Chem. Phys. Meteorol. 2009, 61, 165–179. [Google Scholar] [CrossRef] [Green Version]
- Ansmann, A.; Seifert, P.; Tesche, M.; Wandinger, U. Profiling of fine and coarse particle mass: Case studies of Saharan dust and Eyjafjallajökull/Grimsvötn volcanic plumes. Atmospheric Chem. Phys. 2012, 12, 9399–9415. [Google Scholar] [CrossRef] [Green Version]
- Groß, S.; Tesche, M.; Freudenthaler, V.; Toledano, C.; Wiegner, M.; Ansmann, A.; Althausen, D.; Seefeldner, M. Characterization of Saharan dust, marine aerosols and mixtures of biomass-burning aerosols and dust by means of multi-wavelength depolarization and Raman lidar measurements during SAMUM 2. Tellus B Chem. Phys. Meteorol. 2011, 63, 706–724. [Google Scholar] [CrossRef]
- Royer, P.; Boquet, M.; Cariou, J.-P.; Sauvage, L.; Parmentier, R. Aerosol/Cloud Measurements Using Coherent Wind Doppler Lidars. EPJ Web Conf. 2016, 119, 11002. [Google Scholar] [CrossRef] [Green Version]
- Haarig, M.; Ansmann, A.; Gasteiger, J.; Kandler, K.; Althausen, D.; Baars, H.; Radenz, M.; Farrell, D.A. Dry versus wet marine particle optical properties: RH dependence of depolarization ratio, backscatter, and extinction from multiwavelength lidar measurements during SALTRACE. Atmospheric Chem. Phys. 2017, 17, 14199–14217. [Google Scholar] [CrossRef] [Green Version]
- Sakai, T.; Shibata, T.; Kwon, S.-A.; Kim, Y.-S.; Tamura, K.; Iwasaka, Y. Free tropospheric aerosol backscatter, depolarization ratio, and relative humidity measured with the Raman lidar at Nagoya in 1994–1997: Contributions of aerosols from the Asian Continent and the Pacific Ocean. Atmos. Environ. 2000, 34, 431–442. [Google Scholar] [CrossRef]
- Gultepe, I.; Fernando, H.J.S.; Pardyjak, E.R.; Hoch, S.W.; Silver, Z.; Creegan, E.; Leo, L.S.; Pu, Z.; De Wekker, S.F.J.; Hang, C. An Overview of the MATERHORN Fog Project: Observations and Predictability. Pure Appl. Geophys. 2016, 173, 2983–3010. [Google Scholar] [CrossRef]
- Vaisala Oyj. Vaisala Ceilometer CL31 User’s Guide 2004; Vaisala Oyj: Helsinki, Finland, 2004. [Google Scholar]
- Kotthaus, S.; O’Connor, E.; Münkel, C.; Charlton-Perez, C.; Haeffelin, M.; Gabey, A.M.; Grimmond, C.S.B. Recommendations for processing atmospheric attenuated backscatter profiles from Vaisala CL31 ceilometers. Atmospheric Meas. Tech. 2016, 9, 3769–3791. [Google Scholar] [CrossRef] [Green Version]
- Klett, J.D. Lidar inversion with variable backscatter/extinction ratios. Appl. Opt. 1985, 24, 1638–1643. [Google Scholar] [CrossRef]
- Wiegner, M.; Geiß, A. Aerosol profiling with the Jenoptik ceilometer CHM15kx. Atmospheric Meas. Tech. 2012, 5, 1953–1964. [Google Scholar] [CrossRef] [Green Version]
- Butwin, M.K.; Pfeffer, M.A.; von Löwis, S.; Støren, E.W.N.; Bali, E.; Thorsteinsson, T. Properties of dust source material and volcanic ash in Iceland. Sedimentology 2020, 67, 3067–3087. [Google Scholar] [CrossRef]
- Navas-Guzmán, F.; Martucci, G.; Collaud Coen, M.; Granados-Muñoz, M.J.; Hervo, M.; Sicard, M.; Haefele, A. Characterization of aerosol hygroscopicity using Raman lidar measurements at the EARLINET station of Payerne. Atmospheric Chem. Phys. 2019, 19, 11651–11668. [Google Scholar] [CrossRef] [Green Version]


| Start Date | End Date | Location | Latitude (°N) | Longitude (°W) | Lidar | Ceilometer | Other Measurements |
|---|---|---|---|---|---|---|---|
| 2019-06-14 | 2019-06-15 | RVK | 64.1275 | 21.9027 | WindCube | CL31 | PM10, sun-photometer, |
| 2019-07-31 | 2019-08-01 | RVK | 64.1275 | 21.9027 | WindCube | CL31 | PM10, sun-photometer |
| KEF | 63.9829 | 22.6005 | WindCube | CL51 | Radio sounding |
| Feature | Lidar | Ceilometer | |
|---|---|---|---|
| Model | Windcube 200S | CL31 | CL51 |
| Manufacturer | Leosphere | Vaisala | Vaisala |
| Wavelength (μm) | 1.54 | 0.91 | 0.91 |
| Maximum detection range (km) | 14 | 7.6 | 15 |
| Range resolution (m) | 100 | 10 | 10 |
| Elevation angle (°) | −10–90 | 90 | 90 |
| Azimuth angle (°) | 0–360 | N/A | N/A |
Publisher’s Note: MDPI stays neutral with regard to jurisdictional claims in published maps and institutional affiliations. |
© 2020 by the authors. Licensee MDPI, Basel, Switzerland. This article is an open access article distributed under the terms and conditions of the Creative Commons Attribution (CC BY) license (http://creativecommons.org/licenses/by/4.0/).
Share and Cite
Yang, S.; Preißler, J.; Wiegner, M.; von Löwis, S.; Petersen, G.N.; Parks, M.M.; Finger, D.C. Monitoring Dust Events Using Doppler Lidar and Ceilometer in Iceland. Atmosphere 2020, 11, 1294. https://doi.org/10.3390/atmos11121294
Yang S, Preißler J, Wiegner M, von Löwis S, Petersen GN, Parks MM, Finger DC. Monitoring Dust Events Using Doppler Lidar and Ceilometer in Iceland. Atmosphere. 2020; 11(12):1294. https://doi.org/10.3390/atmos11121294
Chicago/Turabian StyleYang, Shu, Jana Preißler, Matthias Wiegner, Sibylle von Löwis, Guðrún Nína Petersen, Michelle Maree Parks, and David Christian Finger. 2020. "Monitoring Dust Events Using Doppler Lidar and Ceilometer in Iceland" Atmosphere 11, no. 12: 1294. https://doi.org/10.3390/atmos11121294
APA StyleYang, S., Preißler, J., Wiegner, M., von Löwis, S., Petersen, G. N., Parks, M. M., & Finger, D. C. (2020). Monitoring Dust Events Using Doppler Lidar and Ceilometer in Iceland. Atmosphere, 11(12), 1294. https://doi.org/10.3390/atmos11121294


