Article

Monitoring Chlorofluorocarbons in Potential Source Regions in Eastern China

1
School of Environmental Science and Engineering, Shandong University, Qingdao 266237, China
2
Shandong Provincial Eco-environment Monitoring Center, Jinan 250101, China
*
Authors to whom correspondence should be addressed.
Atmosphere 2020, 11(12), 1299; https://doi.org/10.3390/atmos11121299
Submission received: 24 October 2020 / Revised: 28 November 2020 / Accepted: 28 November 2020 / Published: 30 November 2020
(This article belongs to the Section Meteorology)

Abstract

:
Recent studies have indicated that Eastern China might be a potential source region of increased atmospheric chlorofluorocarbons (CFCs). To investigate this possibility, a field measurement was carried out from October to December 2017 for identifying the ambient concentration levels of representative trichlorofluoromethane (CFC-11), dichlorodifluoromethane (CFC-12), trifluorotrichloroethane (CFC-113), and tetrafluorodichloroethane (CFC-114) at the residential and municipal solid waste (MSW) landfills and industrial sites in Eastern China. The ambient mixing ratios of CFCs at residential sites were almost within 20% enhancements of the global background sites. The highest levels of CFCs were observed at the MSW landfill sites. Moreover, CFC-11 and CFC-113 concentrations at MSW landfill, which was in service, were two times higher than that at completed MSW landfill. Mean concentrations of 322 pptv for CFC-11, 791 pptv for CFC-12, 91 pptv for CFC-113, and 16 pptv for CFC-114 at various industrial sites were higher than those at residential sites, but they were obviously lower than that at MSW landfill in use. A poor intercorrelation between the CFCs indicated that they did not come from the same source. Higher concentrations measured in this study compared with background sites indicates that MSW landfills could be an unintentional emission source and there are still substantial amounts of CFCs being stored in banks that may discharge CFCs into the atmosphere in Eastern China.

1. Introduction

Chlorofluorocarbons (CFCs) are very stable anthropogenic compounds which contribute greatly to the stratospheric ozone depletion, becoming a global environmental concern [1]. After being released into the troposphere, CFCs can reach the stratosphere because of their long atmospheric lifetimes and thus cause destruction of stratosphere ozone [2,3,4]. The Montreal Protocol (MP), aiming at avoiding further damage to the ozone layer, involves strict control regulations of Ozone-Depleting Substances (ODSs) [5]. Under the control of MP and its amendments, large and significant reductions in CFC emissions have been achieved. At the same time, the recovery of the ozone layer is also accelerated [6].
However, a rebound of Antarctic ozone hole was found in recent years [7]. The slowdown in the reduction of global trichlorofluoromethane (CFC-11) concentration after 2012 was also discovered with the reduction rate changing from −2.1 ± 0.3 ppt·year−1 to −1.0 ± 0.2 ppt·year−1 [8]. However, this transition differs from the possible changes in the release of CFC-11 from the reservoirs remaining in existing equipment and products (CFC “banks”) [8]. In addition to CFC-11, tetrafluorodichloroethane (CFC-114) and pentafluoromonochloroethane (CFC-115) also showed the same global growth trend as CFC-11, posing an increasing threat to ozone recovery [9,10,11,12,13]. Moreover, recent measurements and modelling studies pointed to a significant increase in CFC-11 emissions in East Asia and especially in Eastern China, including Shandong and Hebei provinces [4,14,15]. Later on, a high level of CFC-11, about 30 pptv above the global background values, was observed in China [16,17], which further indicated its unexpected emissions in some regions.
However, uncertainty occurred in the model simulation. Via model simulation, it pointed out that 7000 t of CFC-11 were produced in China after 2012 and proposed that the increasing emissions of some halogenated hydrocarbons in China could be equal to the inferred global emission increase. However, the Chinese government acknowledged that the illegal production of CFC-11 had occurred since 2012 and seized 114 t of illegally produced CFC-11 [18], which was quite different from the amount obtained through the model simulation. A point that the stratosphere may be responsible for the slower decline of CFC-11 concentration in recent years was also proposed [19]. Although it can explain the tropospheric CFC-11 emission change through the dynamical changes, it has large uncertainty [19]. Therefore, the existence of new production and use of CFC-11 in China is questionable, and the cause of the change in CFC-11 level is still unclear.
Until now, most studies of CFC changes are based on model simulations, which sometimes show large differences in the results among each other and with observations. Furthermore, the CFC monitoring network does not have high enough spatial resolution currently, so that the observational data used in models has to come from monitoring stations in adjacent regions or countries [8,14,20]. Therefore, the conclusion of increasing CFCs emissions in Eastern China remains uncertain and lacks further solid evidence from field measurements [20]. In this study, field samples at urban and rural residential sites, industrial areas, and municipal solid waste (MSW) landfills were collected in Shandong Province of the Eastern China, where densely industrial estates are distributed, during the period of October–December, 2017. Concentrations and intercorrelations of four CFCs (CFC-11; dichlorodifluoromethane, CFC-12; trifluorotrichloroethane, CFC-113; CFC-114) were then analyzed and compared. This work can help us to improve our understanding of the current situation of CFCs in Eastern China and manifesting the accuracy of model simulations.

2. Methods

2.1. Sampling Sites

CFC samples were collected at 6 sites (Figure 1) located in Shandong Province in Eastern China, which represent residential (Tai’an, TA; Jinan, JN; Guangrao, GR), industrial (Weifang, WF), and MSW landfill (Liaocheng, LC; Jiyang, JY) environments. TA, an important open tourism city in Eastern China, is at the foot of Mount Tai. As the capital of the Shandong Province, JN is a densely populated urban city in northern China. GR, a rural site, is away from the urban area and non-intensive industrial pollution sources, making it less susceptible to industrial activities. WF is an industrial city with mixed chemical factories, including Chlor-alkali industry, hazardous waste landfill, and other chemical reagent productions. There were MSW landfills in JY and LC, respectively. The MSW landfill in JY was responsible to the disposal of garbage from JN. In 2009, the plant had reached its expected lifespan and the landfill was completed during the sampling campaign. The MSW landfill in LC was still in use during the sampling period.

2.2. Sampling and Analysis

This study used the determination method of volatile organic compounds in ambient air (TO-14 and TO-15) recommended by USEPA [21]. The 3.2 L silica-lined stainless-steel vacuum canisters (SUMMA) manufactured by ENTECH were used for sampling. The sampling system included a sampling canister and a flow-limiting valve. The SUMMA containers were evacuated to below 100 mTorr and pressurized to 20 psi for three cycles with high-purity nitrogen to remove all the compounds before sampling. No samples were sampled on rainy days, and the targeted CFC compounds had a recovery rate of >90% over 30 d.
In this study, a three-stage cold-trap pre-concentrator and gas chromatography-mass spectrometry (GC-MS) system (Agilent 7890B-5977A) were used to analyze the CFCs with the internal standard method in the atmosphere. Bromochloromethane was added to samples as the internal standard substance to quantify the targeted CFCs before analyzing. Through the usage of an HP-1 chromatographic column (60 m × 320 µm × 1 µm) at a flow rate of 1.5 mL/min, 200 mL of each sample were concentrated and analyzed by the GC-MS, and then again from 150 °C to 220 °C over the course of 3 min (rate = 15 °C /min). The targeted CFC species were CFC-11, CFC-12, CFC-113, and CFC-114. The relative standard deviations for the 4 CFCs were 0.9, 1.3, 0.49, and 0.7, respectively. Detailed information about sampling and analysis was described in our previously published research [17].

2.3. Linear Correlation Analysis

This process assesses the strength of the relationship with the available data. The Pearson correlation coefficient is one of the most common correlation analysis methods. It can detect the linear relationships between two variables, and the coefficient can show the degree to which variables are related [22]. In this study, a linear correlation analysis performed by SPSS (Statistical Product and Service Solutions) was used to identify the intercorrelations between CFCs.

3. Results and Discussion

3.1. CFCs in Residential Sites

The concentrations of CFCs in TA, GR, and JN are shown in Table 1. Mean concentrations of CFCs in the touristy city TA were 279 pptv, 590 pptv, 75 pptv, and 13 pptv for CFC-11, CFC-12, CFC-113, and CFC-114, respectively, with ranges of 213–347, 481–680, 56–121, and 12–15 pptv correspondingly. Similar mean concentrations and ranges were found at the rural site GR. The mean concentrations of CFCs in GR were 267 pptv, 563 pptv, 97 pptv, and 14 pptv for CFC-11, CFC-12, CFC-113, and CFC-114, respectively. CFC-11 concentrations varied from 256 pptv to 316 pptv, and CFC-12 concentrations were between 531 pptv and 583 pptv. CFC-113 exhibited a maximum and a minimum of 107 pptv and 91 pptv, respectively, while CFC-114 remained in the range of 13–19 pptv. The overall concentrations of CFCs in TA were higher than that in GR, which could be related to their differences in industry, population, and economic conditions.
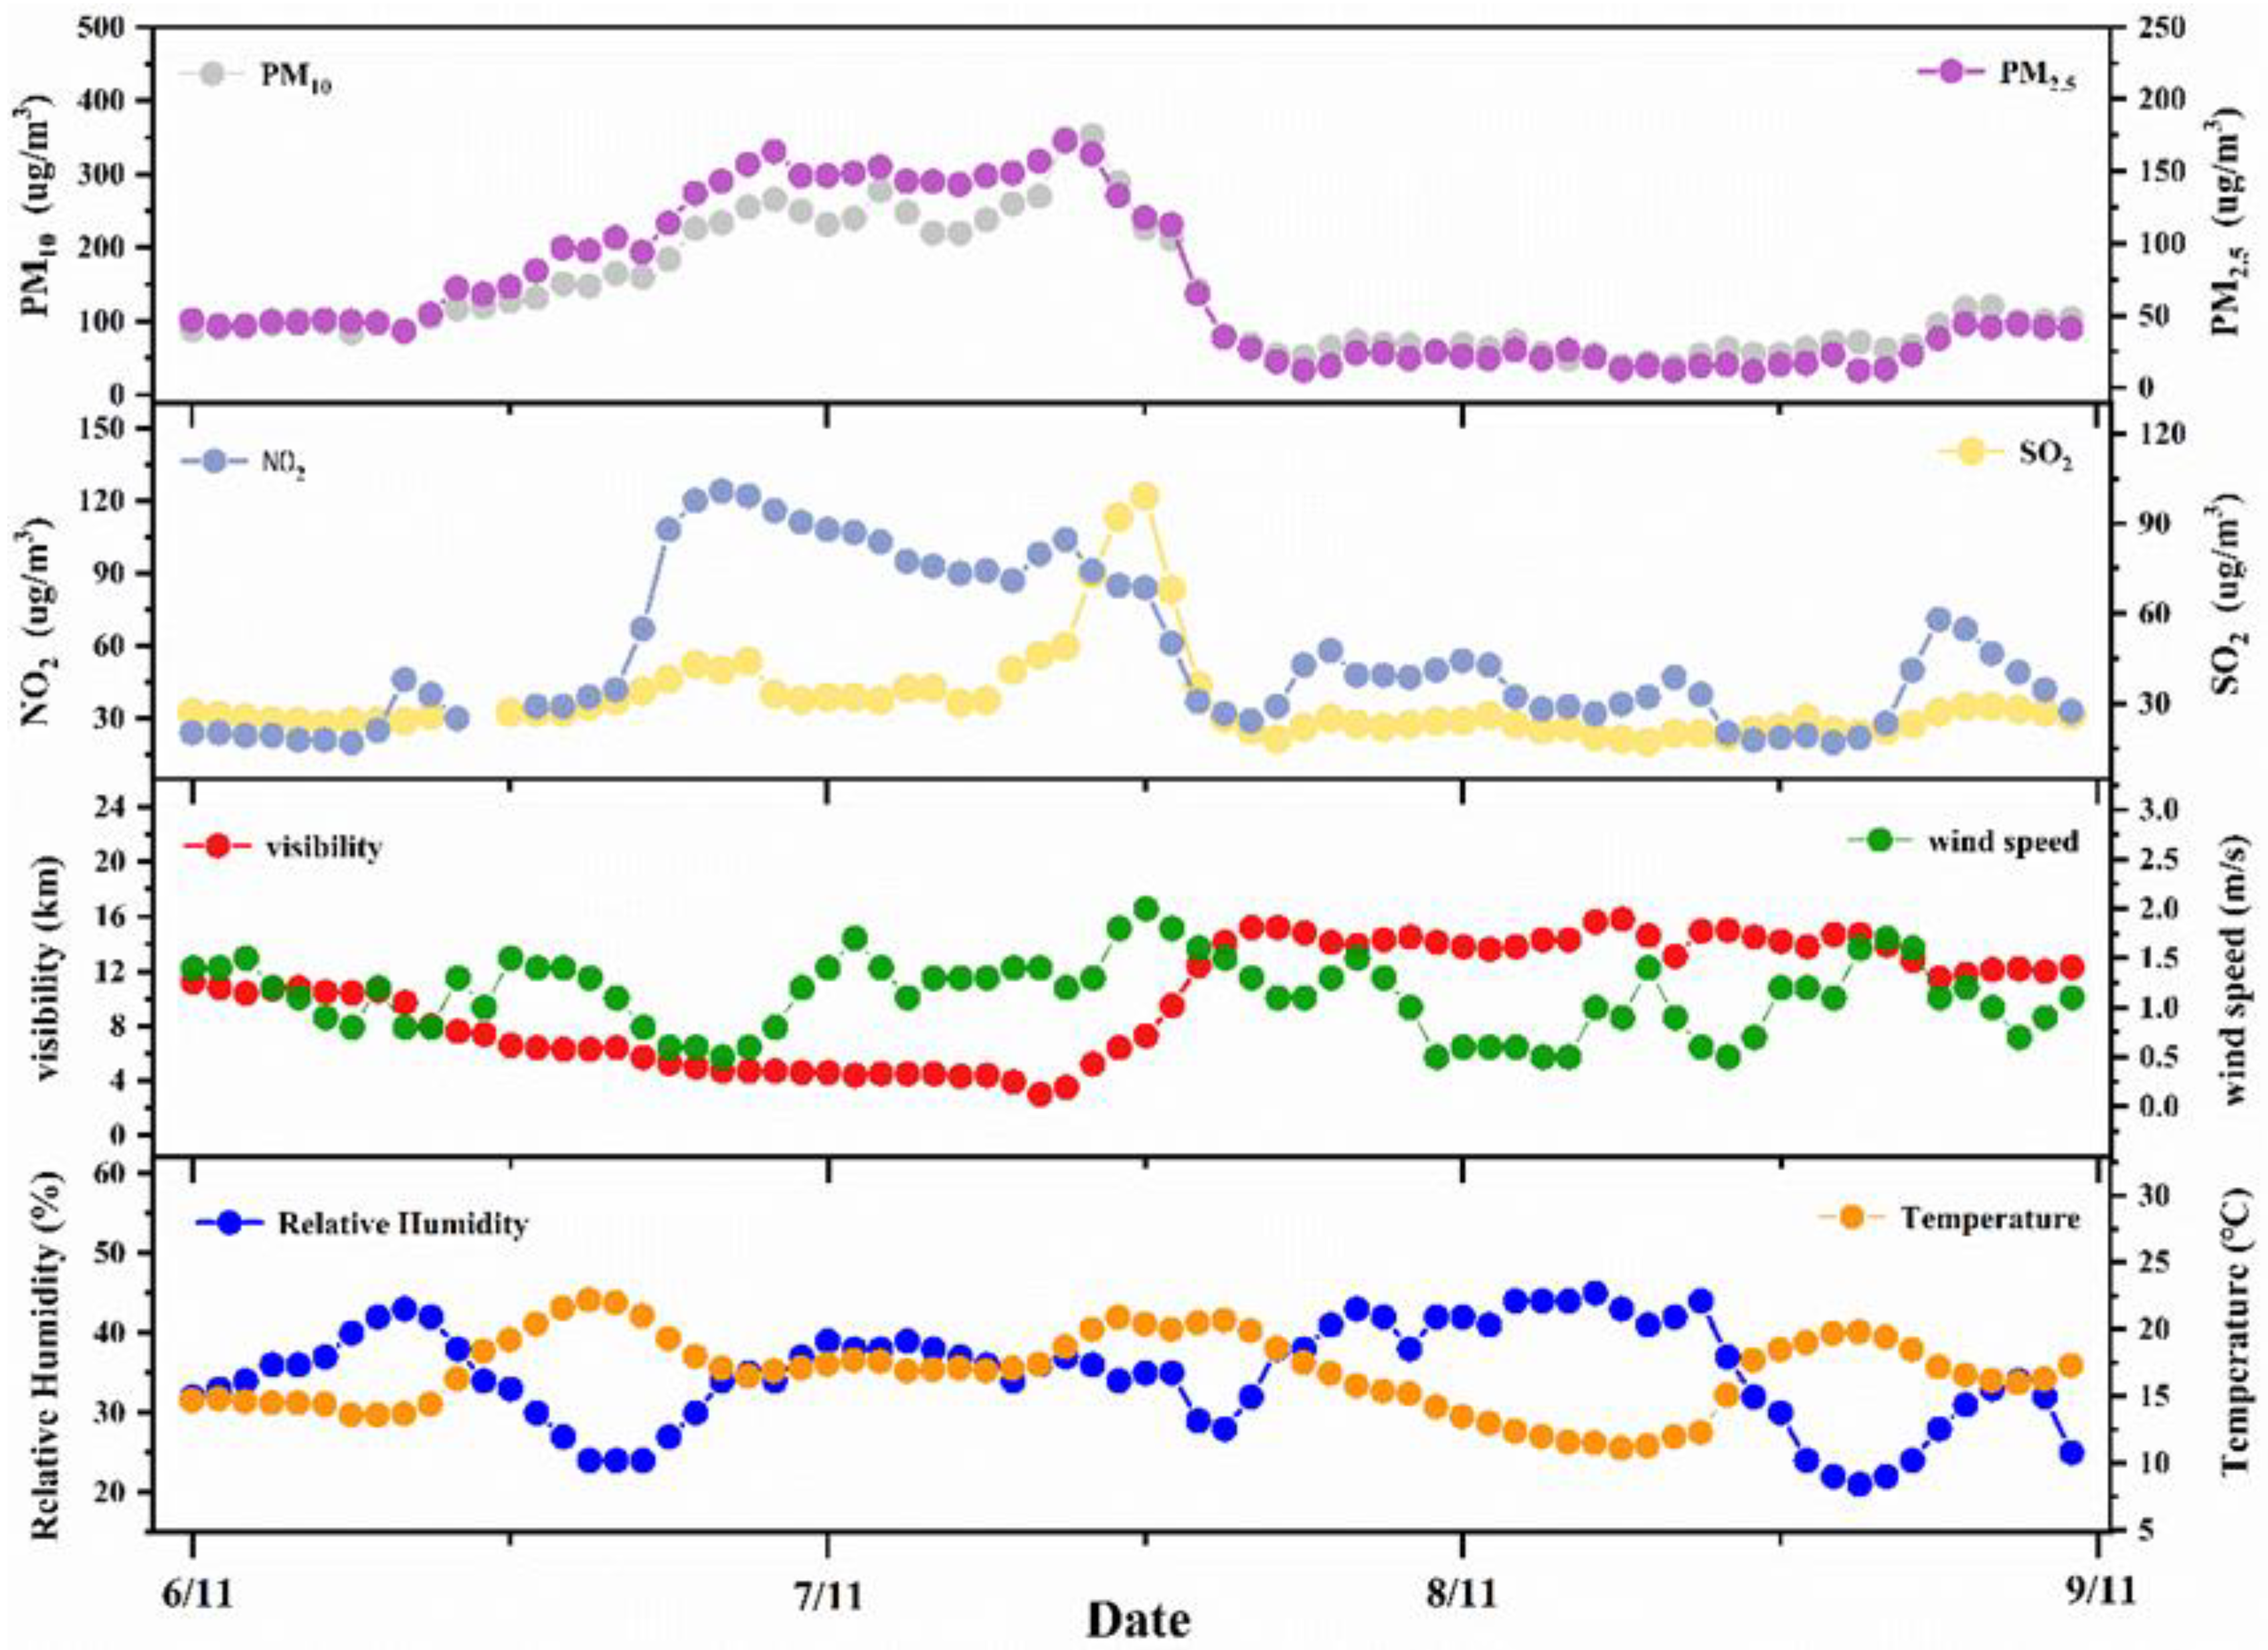
CFC mixing ratios in the urban JN were 296 pptv, 564 pptv, 79 pptv, and 13 pptv for CFC-11, CFC-12, CFC-113, and CFC-114, respectively. Measurements at JN were carried out from October to December 2017 within the heating period in Northern China. Intensive coal combustion for heating can easily lead to the accumulation of air pollutants and frequent formation of haze. When a haze event happens, the near-surface atmosphere generally becomes more stable under inversion weather conditions, and the spread of CFCs can be hindered [23]. For example, a haze event occurred on 6 and 7 December 2017, during which CFC samples were collected in this study (Figure 2). In the haze event, environmental monitoring indicators such as PM2.5 and NO2 were observed to rise rapidly in concentrations when the sample was collected, which were the characteristic indicators of haze pollution [23,24]. Meanwhile, the average relative humidity, visibility, and wind speed during the haze event were 36.7%, 5.65 km, and 1.1 m/s, respectively.
As shown in Figure 3, mean CFC concentrations during the haze period were 351 pptv, 542 pptv, 86 pptv, and 14 pptv for CFC-11, CFC-12, CFC-113, and CFC-114, respectively; however, after the haze dissipated, the concentrations decreased to 296 pptv, 543 pptv, 87 pptv, and 13 pptv, respectively. Except for CFC-11, the concentrations of the other CFCs changed very little during the haze event. This phenomenon indicated that there were no emissions of CFC-12, CFC-113, and CFC-114, but CFC-11 might have unknown emissions. Given its long lifetime and the possibility that furniture such as old refrigerators could still be used, CFC-11 may be accidentally emitted from a CFC-11 bank.
Compared to the global background CFCs observed in Gosan (GSN), the Samoa Observatory (SMO), and Mace Head (MHD), all CFC concentrations except for CFC-114 in TA, GR, and JN were obviously in the different degrees of being above the global background CFCs. We then compared CFC-11 and CFC-12 measurements with the Asia background GSN site, which had the highest CFC concentrations among the three global background sites. The CFC-11 concentrations in TA, JN, and GR were 18.7%, 26%, and 13.6% enhancements of the GSN values. The enhancements mentioned above are used to measure the time it would take for the concentration of the CFC to decrease to the background value [25]. While the CFC-12 concentrations at TA, JN, and GR were within 20% (13.2%, 8%, and 8.1%, respectively) higher than GSN, indicating CFC-12 may level off to the global background level more quickly than CFC-11.
The concentrations of the three residential sites in this study were relatively higher when compared with the background sites in China. For example, Shangdianzi (SDZ), which represents concentrations of the North China Plain, was a background station away from Beijing and the concentrations monitored in SDZ of CFC-11, CFC-12, and CFC-113 were 254 pptv, 554 pptv, and 77 pptv, respectively [26]. The three CFC concentrations observed in Lan, which represents the regional background in the Yangtze River Delta (YRD), were 257 pptv, 555 pptv, and 79 pptv, respectively [26]. Values of CFCs in TA, JN, and GR were higher than those of the both background sites.
In addition to comparisons with global and Chinese background sites, comparisons have also been made with other Chinese cities. In 2010, concentrations of CFC-11 and CFC-12 monitored in Beijing were 377 pptv and 649 pptv, respectively [25], while the concentration of CFC-11 continuously measured online in Beijing during 2016 was 590 pptv [27]. Compared with Beijing, the concentration of CFC-11 in TA, JN, and GR was significantly lower. As shown in Table 1, the CFC-11 concentrations of this study were lower than those of previous studies, such as Xi’an and Wangdu [29,30]. Four CFC concentrations measured in Xi’an in 2018 were significantly high, which were 1330 pptv, 630 pptv, 100 pptv, and 30 pptv for CFC-11, CFC-12, CFC-113, and CFC-114, respectively. CFC-11 concentration in Wangdu was as high as 610 pptv. In contrast, concentration levels of CFC-12, CFC-113, and CFC-114 in TA, JN, and GR were higher than those monitored at Mount Tai, which is located in Shandong Province [17]. Combined with other cities mentioned above, although the CFC concentrations at residential sites in this study were higher than those at Mount Tai, they were much lower than those in other Chinese cities.
Overall, the levels of CFCs measured at residential sites were similar to each other. CFC-113 and CFC-114 measured in three residential sites were consistent with the background sites [31]. However, relatively higher levels of CFC-11 and CFC-12 were found. Although CFC-11 and CFC-12 concentrations monitored at TA, JN, and GR were found to be at a lower level in comparison with other Chinese cities, they were still higher than that at background sites and Mount Tai. Actually, China had already phased out CFCs production in 2008. However, based on the observations, the emissions of CFC-11 and CFC-12 in China were calculated to be 7.1 Gg/year and 13.1 Gg/year during 2010–2011, respectively [32]. These emissions indicated that CFC-11 and CFC-12 were leaking from old appliances which were still in service. A weak correlation (R2 < 0.10) between them was found, proving that they came from different sources [33]. According to our observation, no new emission sources were found in TA, JN, and GR, but the possible release of CFCs from CFC banks leading to high levels of CFCs should not be ruled out [34,35].

3.2. CFCs at MSW Landfill Sites

CFCs had been used as blowing agents for foam insulation in electrical and building industries, but they were finally disposed of in landfills once out of use [36,37]. Moreover, most household refrigerators, air conditioners, and other damaged appliances will also be placed in landfills after the end of their useful life. Due to their low diffusion rate and long half-life, which were about 100 years or more depending on the product and the manufacturing process, CFCs can still be continuously released from disused polyurethane foams [35]. Even being buried in the landfill, CFCs can evaporate into the atmosphere if the wastes are not properly sealed and degraded. Therefore, although the production of CFCs for refrigerants and foaming agents had been banned under the MP, MSW could be an unintentional emission source of CFCs [35,36].
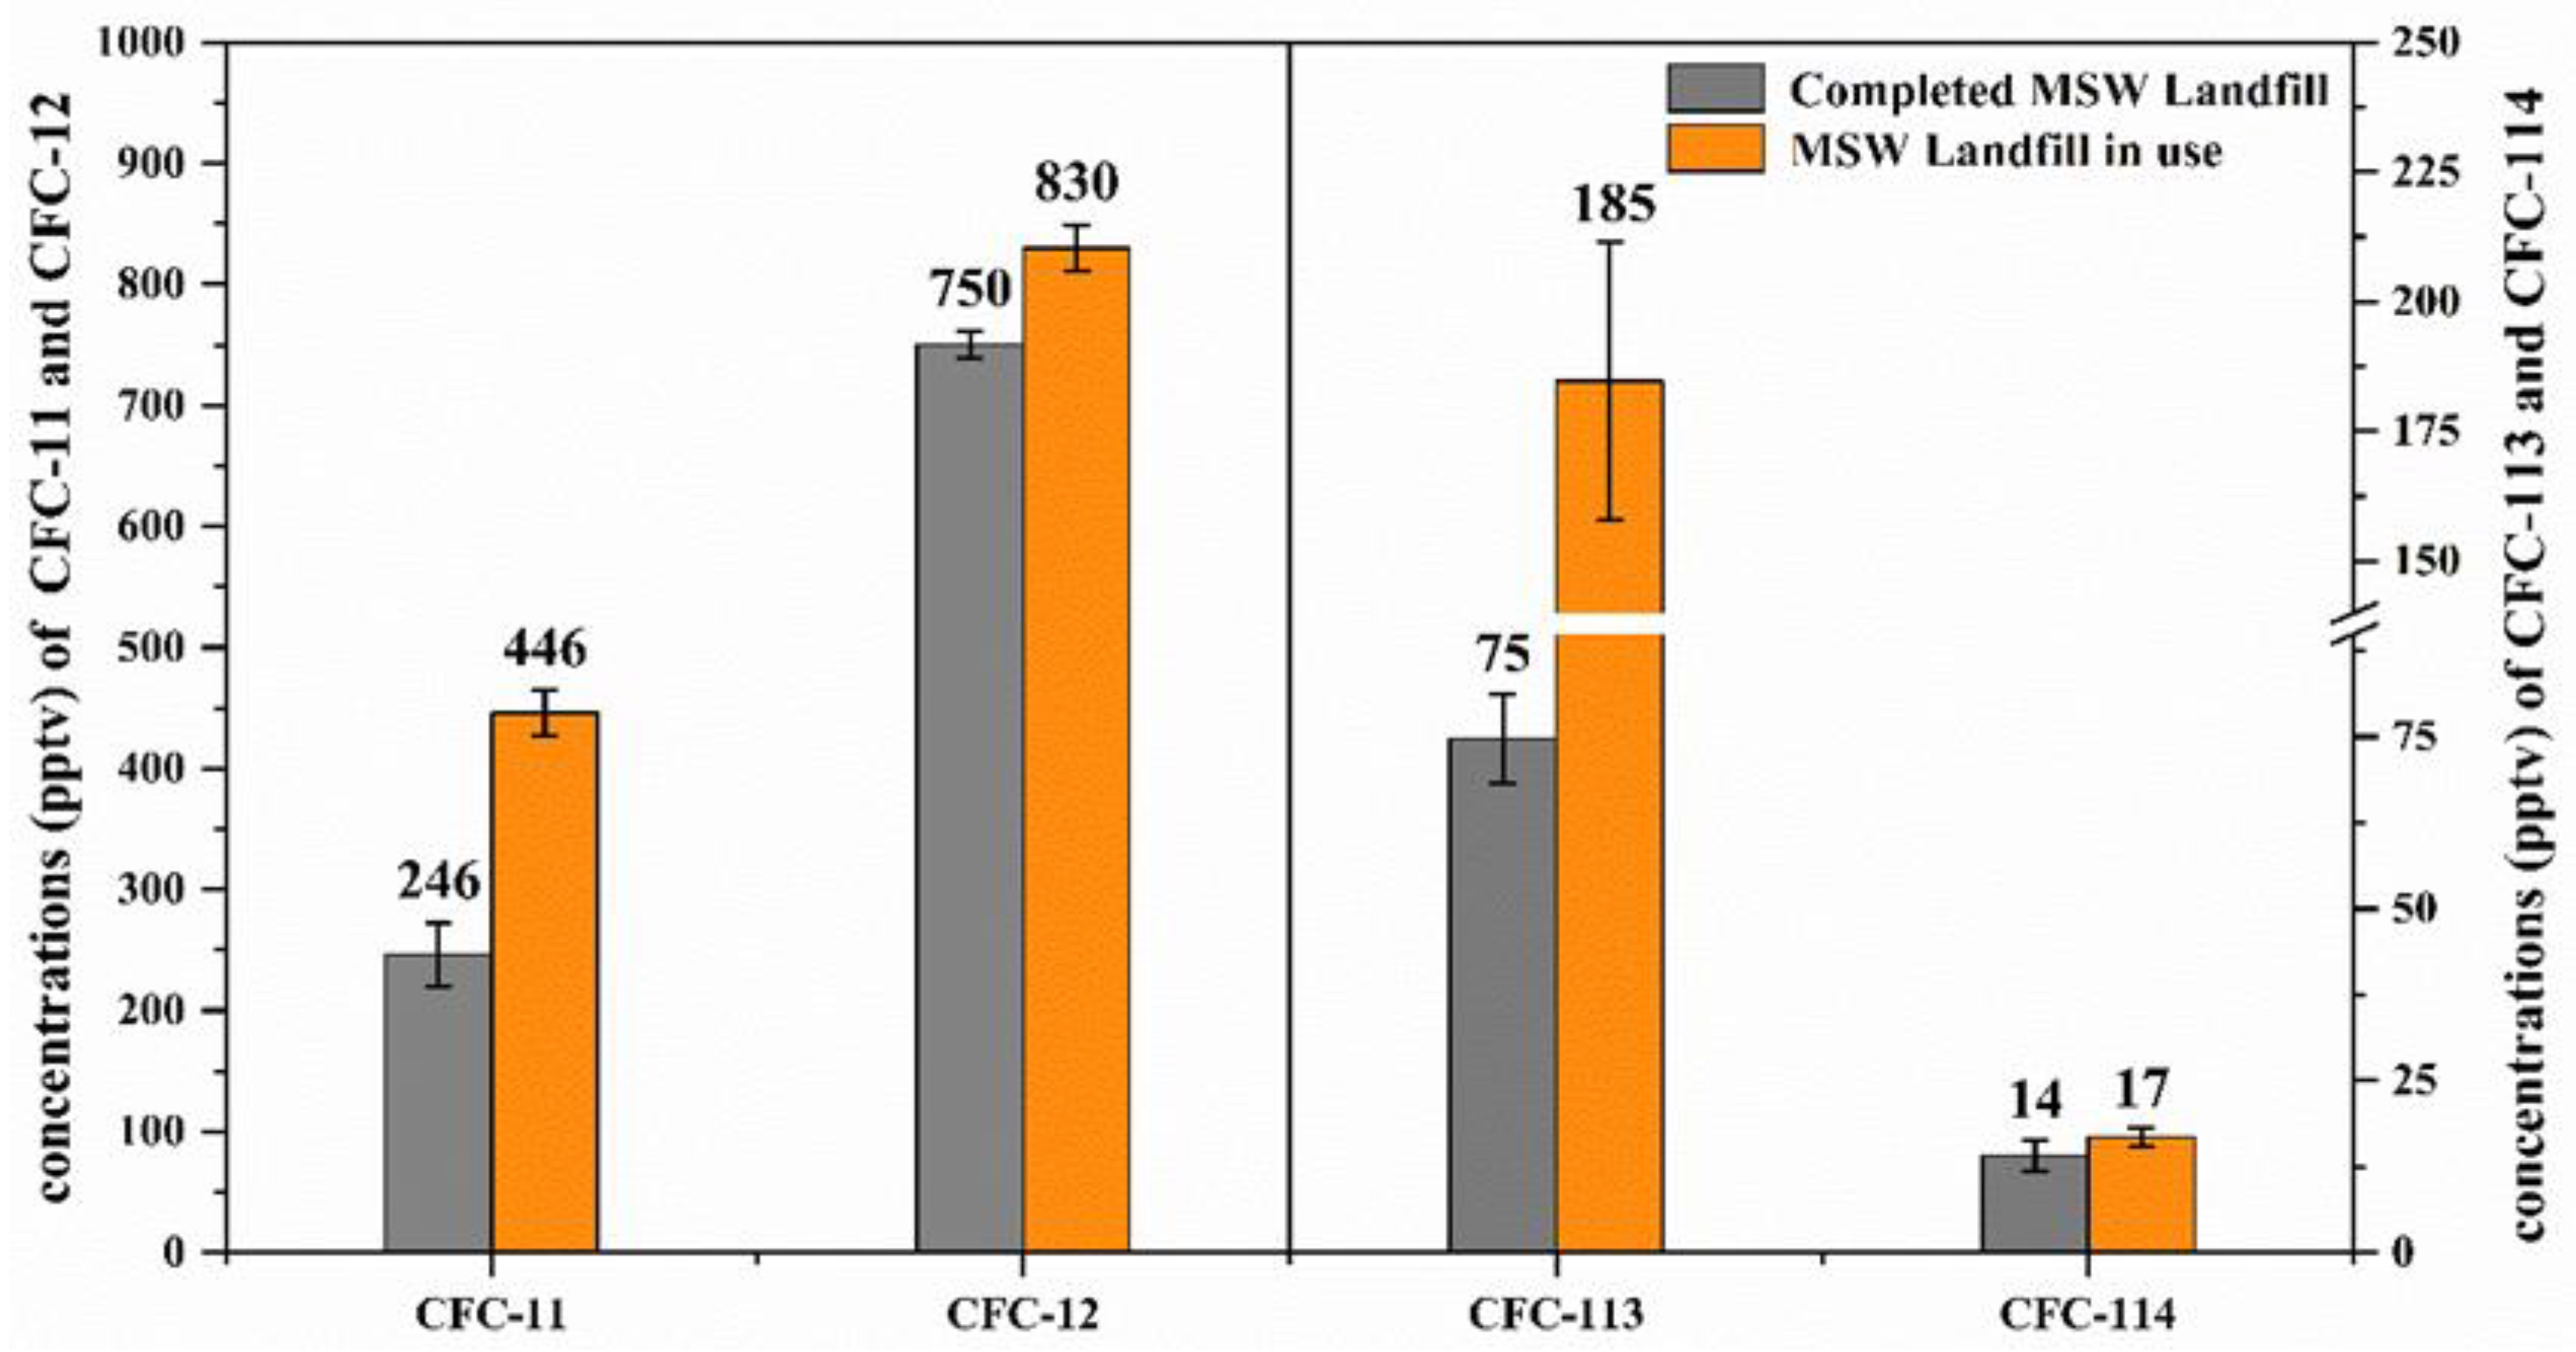
In this study, CFCs were measured at two MSW landfills, JY and LC. As shown in Figure 4, all four CFCs in JY were clearly in lower concentrations than in LC. The average concentrations of CFC-11, CFC-12, CFC-113, and CFC-114 in JY were 246 pptv, 750 pptv, 75 pptv, and 14 pptv, respectively. Except for the much abundant CFC-12, all the other CFC concentrations in JY were comparable to the background values. Meanwhile, the concentrations reached 446 pptv, 830 pptv, 185 pptv, and 17 pptv for CFC-11, CFC-12, CFC-113, and CFC-114 in LC, respectively, which were the highest values measured among the six sites in this study and significantly higher than the background values. However, our measured CFC concentrations at the two landfills were much lower than the MSW landfill measurements in Seoul in 2011, which showed 8210 pptv of CFC-11 and 3340 pptv of CFC-113 [38]. It may be related to China’s controls on waste and proves that China’s recycling and reuse of large household appliances have made a contribution to the reduced CFC burden [39].
Importantly, the clearly higher CFC concentrations in LC than JY could be much relevant to the service status of MSW landfills since the JY landfill was completed in 2011 while the LC landfill has been in service until now. For the JY completed landfill, CFC concentrations behaved lower and more uniform, which could be barely affected by meteorological factors such as wind vector. For instance, the concentration of CFC-11 at the completed landfill varied from 204 pptv to 272 pptv, the CFC-12 concentration fluctuated between a maximum of 766 pptv and a minimum of 734 pptv, and the level of CFC-113 ranged between 65 pptv and 87 pptv. In contrast, all four CFCs, especially the CFC-11 and CFC-113, at the LC landfill in use, exhibited much higher and relatively more variable concentrations. Furthermore, the correlation between CFC-11 and CFC-12 in LC (R2 = 0.34) was more significant than that in JY (R2 = 0.05), indicating that there might exist common emissions of CFC-11 and CFC-12 in LC. It is likely ascribed to the easier leakage of CFCs from the landfill during service with the incessant flow of discarded household appliances, and also demonstrates that the seal of completed landfills has suppressed well the evaporation and spread of the air contaminants such as CFCs. However, here in both landfills, we still observed notably high CFC-12 that was used in the refrigeration system of household refrigerators from which CFCs were usually released during electrical failures [40]. Since CFC-12 has a long lifetime, damaged appliances and foams gathering in MSW landfills would become a considerable source of CFC-12 under present sealing conditions.
Even though the production and consumption of CFCs have been strictly and effectively controlled under the MP, the long lifetimes of CFCs have kept them in the atmosphere for a long period time. Therefore, timely disposal and reuse of the wastes, such as household appliances and foam, will significantly contribute to the decline of CFCs [41].

3.3. Concentrations and Interspecies Correlations of CFCs in Industrial Estates.

WF is an industrial city with many industrial estates. Although many studies have been conducted on measuring the concentration of halohydrocarbons in recent years, little research on CFCs at centralized industrial parks has been reported. In this study, the average concentrations of the four CFCs in WF were 322 pptv, 791 pptv, 91 pptv, and 16 pptv for CFC-11, CFC-12, CFC-113, and CFC-114, respectively. These concentrations of industrial estates related to CFC-11 and CFC-12 were obviously higher than those at residential sites and a completed MSW landfill, but lower than the LC landfill in service that may be a potential CFC emission source area.
Figure 5 shows the four CFC concentrations for selected samples in WF using sequence numbers from S1 to S26 which represent different types of industry. The total concentration of CFCs fluctuated around 1200 pptv with a median value of 1242 pptv. Three types of industry can roughly be divided into. For S1 and S2, samples were collected around the hazardous waste treatment plant. The plant is mainly responsible for the collection, storage, treatment, and disposal of hazardous waste containing medical waste and production, as well as for processing and recycling of electronic products. Samples S3–S16 were collected near biochemical factories, which produce various kinds of chemical and medical reagents, including pesticides. Other samples S17–S26 were obtained from Chlor-alkali plants. Clearly, concentrations of the total CFCs, CFC-11, and CFC-12 near hazardous waste treatment plants were the highest (1364–1450 pptv, 417–497 pptv, and 838–843 pptv, respectively), followed by biochemical factories (1182–1347 pptv, 283–406 pptv, 776–861 pptv). High concentrations of these samples are likely ascribed to the disposal of hazardous wastes and production of chemical and medical reagents, during which processes CFCs may be discharged unintentionally. Chlor-alkali plant samples showed the lowest concentrations of CFCs among them. It implies that the usage and emission of CFCs in Chlor-alkali plants have been phased out.
China had banned CFC usage since 2007. However, Harris et al. [42] suggested that the source of the sudden global explosion of CFC-11 was derived in Eastern China, and the most likely source, they suspected, was the production of foaming agents. As CFC-11 and CFC-12 had been used in the production of refrigerants, foaming agents, solvents, and pesticides, the correlation between the two substances was analyzed given their relatively higher concentration level observed in WF. The results showed a weak correlation between them with a coefficient of 0.12. In addition, the correlation of the four CFCs was analyzed and their correlation coefficients were between 0.01 and 0.2, indicating that the 4 CFCs were not from the same source [33]. From all above, the relatively high CFCs in WF are likely to originate from the CFC banks rather than new industrial emissions.

4. Conclusions

Field samples were collected and analyzed in Eastern China, the potential CFC areas suggested by recent simulation studies. Typical areas with different functions were selected in this study. The lowest concentrations of CFCs were found in the residential site, but they were still higher than those of global background sites. In contrast to the completed MSW landfill that had much lower CFCs concentrations, the landfill in service could be a potential emission source of CFCs due to the highest concentrations there. As to industrial sites, the CFCs concentration level stood between the residential sites and landfill in service. Among three types of industry, the hazardous waste treatment plant showed the most abundant CFCs probably due to their unintentional discharge from disposing of hazardous waste. In addition, poor correlations for CFCs at the residential and industrial sites indicated that they should have different sources, whereas a relatively stronger correlation was found at the MSW landfill in service. We can modestly conclude that the reported increase in CFC emissions in Eastern China is not due to industrial production, but likely from waste treatment and CFC banks.
Our study found no significant increase in CFC levels in Eastern China, but this region used to be a major source of CFC production. There are still substantial amounts of CFCs being stored in banks that could constantly and slowly discharge CFCs into the atmosphere. Also, the MSW landfill will release CFCs if not sealed well. Therefore, CFC concentration levels in China are not likely to decrease in a short term. More efforts on managing CFC banks and improving MSW landfill sealing technology are necessary and further field measurements are needed to identify whether new CFCs emissions exist in China.

Author Contributions

Conceptualization: J.Z. (Jiebo Zhen), M.Y., Y.W.; data curation: J.Z. (Jiebo Zhen), J.Z. (Jie Zhou); formal analysis: J.Z. (Jiebo Zhen), M.Y., H.L., X.N.; investigation: J.Z. (Jiebo Zhen), M.Y., F.Y., H.L., F.C., X.N., P.L.; methodology: J.Z. (Jiebo Zhen), M.Y., F.Y., Y.W.; writing—original draft: J.Z. (Jiebo Zhen); software: F.Y., F.C., H.L., P.L.; funding acquisition: Y.W., T.L.; supervision: Y.W., T.L.; writing—review and editing: Y.W., T.L.; resources: J.Z. (Jie Zhou). All authors have read and agreed to the published version of the manuscript.

Funding

This work was supported by the Key R&D Project of Shandong Province (2019GSF109086), and the China Postdoctoral Science Foundation (No. 2019TQ0185 and 2019M662330).

Conflicts of Interest

The authors declare no conflict of interest.

References

  1. Molina, M.J.; Rowland, F.S. Stratospheric sink for chlorofluoromethanes: Chlorine atom-catalysed destruction of ozone. Nature 1974, 249, 810. [Google Scholar] [CrossRef]
  2. Chan, L.Y.; Chu, K.W. Halocarbons in the atmosphere of the industrial-related Pearl River Delta region of China. J. Geophys. Res. 2007, 112, D04305. [Google Scholar] [CrossRef] [Green Version]
  3. Farman, J.C.; Gardiner, B.G.; Shanklin, J.D. Large losses of total ozone in Antarctica reveal seasonal ClOx/NOx interaction. Nature 1985, 315, 207–210. [Google Scholar] [CrossRef]
  4. Chipperfield, M.P.; Hossaini, R.; Montzka, S.A.; Reimann, S.; Sherry, D.; Tegtmeier, S. Renewed and emerging concerns over the production and emission of ozone-depleting substances. Nat. Rev. Earth Environ. 2020, 1, 251–263. [Google Scholar] [CrossRef]
  5. Fang, X.; Pyle, J.A.; Chipperfield, M.P.; Daniel, J.S.; Park, S.; Prinn, R.G. Challenges for the recovery of the ozone layer. Nat. Geosci. 2019, 12, 592–596. [Google Scholar] [CrossRef]
  6. WMO. Scientific Assessment of Ozone Depletion: 2014. Available online: https://csl.noaa.gov/assessments/ozone/2014/adm/ (accessed on 30 November 2020).
  7. Salby, M.; Titova, E.; Deschamps, L. Rebound of Antarctic ozone. Geophys. Res. Lett. 2011, 38, 1–4. [Google Scholar] [CrossRef]
  8. Montzka, S.A.; Dutton, G.S.; Yu, P.; Ray, E.; Portmann, R.W.; Daniel, J.S.; Kuijpers, L.; Hall, B.D.; Mondeel, D.; Siso, C.; et al. An unexpected and persistent increase in global emissions of ozone-depleting CFC-11. Nature 2018, 557, 413–417. [Google Scholar] [CrossRef]
  9. Hossaini, R.; Chipperfield, M.P.; Montzka, S.A.; Leeson, A.A.; Dhomse, S.S.; Pyle, J.A. The increasing threat to stratospheric ozone from dichloromethane. Nat. Commun. 2017, 8, 15962. [Google Scholar] [CrossRef]
  10. Fang, X.; Park, S.; Saito, T.; Tunnicliffe, R.; Ganesan, A.L.; Rigby, M.; Li, S.; Yokouchi, Y.; Fraser, P.J.; Harth, C.M.; et al. Rapid increase in ozone-depleting chloroform emissions from China. Nat. Geosci. 2018, 12, 89–93. [Google Scholar] [CrossRef]
  11. Lunt, M.F.; Park, S.; Li, S.; Henne, S.; Manning, A.J.; Ganesan, A.L.; Simpson, I.J.; Blake, D.R.; Liang, Q.; O’Doherty, S.; et al. Continued Emissions of the Ozone-Depleting Substance Carbon Tetrachloride From Eastern Asia. Geophys. Res. Lett. 2018, 45, 11423–11430. [Google Scholar] [CrossRef] [Green Version]
  12. Adcock, K.E.; Reeves, C.E.; Gooch, L.J.; Leedham Elvidge, E.C.; Ashfold, M.J.; Brenninkmeijer, C.A.M.; Chou, C.; Fraser, P.J.; Langenfelds, R.L.; Mohd Hanif, N.; et al. Continued increase of CFC-113a (CCl3CF3) mixing ratios in the global atmosphere: Emissions, occurrence and potential sources. Atmos. Chem. Phys. 2018, 18, 4737–4751. [Google Scholar] [CrossRef] [Green Version]
  13. Dhomse, S.S.; Feng, W.; Montzka, S.A.; Hossaini, R.; Keeble, J.; Pyle, J.A.; Daniel, J.S.; Chipperfield, M.P. Delay in recovery of the Antarctic ozone hole from unexpected CFC-11 emissions. Nat. Commun. 2019, 10, 5781. [Google Scholar] [CrossRef] [PubMed] [Green Version]
  14. Rigby, M.; Park, S.; Saito, T.; Western, L.M.; Redington, A.L.; Fang, X.; Henne, S.; Manning, A.J.; Prinn, R.G.; Dutton, G.S.; et al. Increase in CFC-11 emissions from eastern China based on atmospheric observations. Nature 2019, 569, 546–550. [Google Scholar] [CrossRef]
  15. WMO. Scientific Assessment of Ozone Depletion: 2018. Available online: https://csl.noaa.gov/assessments/ozone/2018/ (accessed on 30 November 2020).
  16. Lin, Y.; Gong, D.; Lv, S.; Ding, Y.; Wu, G.; Wang, H.; Li, Y.; Wang, Y.; Zhou, L.; Wang, B. Observations of High Levels of Ozone-Depleting CFC-11 at a Remote Mountain-Top Site in Southern China. Environ. Sci. Technol. Lett. 2019, 6, 114–118. [Google Scholar] [CrossRef]
  17. Yang, M.; Yang, F.; Li, H.; Li, T.; Cao, F.; Nie, X.; Zhen, J.; Li, P.; Wang, Y. CFCs measurements at high altitudes in northern China during 2017–2018: Concentrations and potential emission source regions. Sci. Total Environ. 2020, 754, 142290. [Google Scholar] [CrossRef]
  18. Cyranoski, D. China feels the heat over rogue CFC emissions. Nature 2019, 571, 309–310. [Google Scholar] [CrossRef] [PubMed]
  19. Laube, J.C.; Elvidge, E.C.L.; Adcock, K.E.; Baier, B.; Brenninkmeijer, C.A.M.; Chen, H.; Droste, E.S.; Grooß, J.-U.; Heikkinen, P.; Hind, A.J.; et al. Investigating stratospheric changes between 2009 and 2018 with halogenated trace gas data from aircraft, AirCores, and a global model focusing on CFC-11. Atmos. Chem. Phys. 2020, 20, 9771–9782. [Google Scholar] [CrossRef]
  20. Adcock, K.E.; Ashfold, M.J.; Chou, C.C.; Gooch, L.J.; Mohd Hanif, N.; Laube, J.C.; Oram, D.E.; Ou-Yang, C.F.; Panagi, M.; Sturges, W.T.; et al. Investigation of East Asian Emissions of CFC-11 Using Atmospheric Observations in Taiwan. Environ. Sci. Technol. 2020, 54, 3814–3822. [Google Scholar] [CrossRef]
  21. Manning, J.; Burckle, J.; Hedges, S.; McElroy, F. Compendium Method TO-14A: Determination of Volatile Organic Compounds (VOCs) in Ambient Air Using Specially Prepared Canisters with Subsequent Analysis by Gas Chromatography. In Compendium of Methods for the Determination of Toxic Organic Compounds in Ambient Air; Center for Environmental Research InformationOffice of Research and DevelopmentU.S. Environmental Protection Agency: Cincinnati, OH, USA, 1999. Available online: https://www3.epa.gov/ttnamti1/files/ambient/airtox/to-14ar.pdf (accessed on 30 November 2019).
  22. Zhang, Y.; Liu, T.; Li, K.; Zhang, J. Improved visual correlation analysis for multidimensional data. J. Vis. Lang. Comput. 2017, 41, 121–132. [Google Scholar] [CrossRef]
  23. Zeng, W.; Liu, T.; Du, Q.; Li, J.; Xiao, J.; Guo, L.; Li, X.; Xu, Y.; Xu, X.; Wan, D.; et al. The interplay of haze characteristics on mortality in the Pearl River Delta of China. Environ. Res. 2020, 184, 109279. [Google Scholar] [CrossRef] [PubMed]
  24. Liu, T.; Zhang, Y.H.; Xu, Y.J.; Lin, H.L.; Xu, X.J.; Luo, Y.; Xiao, J.; Zeng, W.L.; Zhang, W.F.; Chu, C.; et al. The effects of dust-haze on mortality are modified by seasons and individual characteristics in Guangzhou, China. Environ. Pollut. 2014, 187, 116–123. [Google Scholar] [CrossRef] [PubMed]
  25. Fang, X.; Wu, J.; Xu, J.; Huang, D.; Shi, Y.; Wan, D.; Wu, H.; Shao, M.; Hu, J. Ambient mixing ratios of chlorofluorocarbons, hydrochlorofluorocarbons and hydrofluorocarbons in 46 Chinese cities. Atmos. Environ. 2012, 54, 387–392. [Google Scholar] [CrossRef]
  26. Zhang, G.; Yao, B.; Vollmer, M.K.; Montzka, S.A.; Mühle, J.; Weiss, R.F.; O’Doherty, S.; Li, Y.; Fang, S.; Reimann, S. Ambient mixing ratios of atmospheric halogenated compounds at five background stations in China. Atmos. Environ. 2017, 160, 55–69. [Google Scholar] [CrossRef]
  27. Liu, Y.; Song, M.; Liu, X.; Zhang, Y.; Hui, L.; Kong, L.; Zhang, Y.; Zhang, C.; Qu, Y.; An, J.; et al. Characterization and sources of volatile organic compounds (VOCs) and their related changes during ozone pollution days in 2016 in Beijing, China. Environ. Pollut. 2020, 257, 113599. [Google Scholar] [CrossRef]
  28. Gu, Y.; Li, Q.; Wei, D.; Gao, L.; Tan, L.; Su, G.; Liu, G.; Liu, W.; Li, C.; Wang, Q. Emission characteristics of 99 NMVOCs in different seasonal days and the relationship with air quality parameters in Beijing, China. Ecotoxicol. Environ. Saf. 2019, 169, 797–806. [Google Scholar] [CrossRef]
  29. Sun, J.; Shen, Z.; Zhang, Y.; Zhang, Z.; Zhang, Q.; Zhang, T.; Niu, X.; Huang, Y.; Cui, L.; Xu, H.; et al. Urban VOC profiles, possible sources, and its role in ozone formation for a summer campaign over Xi’an, China. Environ. Sci. Pollut. Res. Int. 2019, 26, 27769–27782. [Google Scholar] [CrossRef]
  30. Zhang, F.; Shang, X.; Chen, H.; Xie, G.; Fu, Y.; Wu, D.; Sun, W.; Liu, P.; Zhang, C.; Mu, Y.; et al. Significant impact of coal combustion on VOCs emissions in winter in a North China rural site. Sci. Total Environ. 2020, 720, 137617. [Google Scholar] [CrossRef]
  31. Wan, D.; Xu, J.; Zhang, J.; Tong, X.; Hu, J. Historical and projected emissions of major halocarbons in China. Atmos. Environ. 2009, 43, 5822–5829. [Google Scholar] [CrossRef]
  32. Wang, C.; Shao, M.; Huang, D.; Lu, S.; Zeng, L.; Hu, M.; Zhang, Q. Estimating halocarbon emissions using measured ratio relative to tracers in China. Atmos. Environ. 2014, 89, 816–826. [Google Scholar] [CrossRef]
  33. Li, S.; Kim, J.; Kim, K.R.; Muhle, J.; Kim, S.K.; Park, M.K.; Stohl, A.; Kang, D.J.; Arnold, T.; Harth, C.M.; et al. Emissions of halogenated compounds in East Asia determined from measurements at Jeju Island, Korea. Environ. Sci. Technol. 2011, 45, 5668–5675. [Google Scholar] [CrossRef] [PubMed]
  34. Wu, H.; Chen, H.; Wang, Y.; Ding, A.; Chen, J. The changing ambient mixing ratios of long-lived halocarbons under Montreal Protocol in China. J. Clean. Prod. 2018, 188, 774–785. [Google Scholar] [CrossRef]
  35. Yazici, B.; Can, Z.S.; Calli, B. Prediction of future disposal of end-of-life refrigerators containing CFC-11. Waste Manag. 2014, 34, 162–166. [Google Scholar] [CrossRef] [PubMed]
  36. Scheutz, C.; Dote, Y.; Fredenslund, A.M.; Mosbæk, H.; Kjeldsen, P. Attenuation of fluorocarbons released from foam insulation in landfills. Environ. Sci. Technol. 2007, 41, 7714–7722. [Google Scholar] [CrossRef] [PubMed]
  37. Zhang, Y.; Wang, X.; Simpson, I.J.; Barletta, B.; Blake, D.R.; Meinardi, S.; Louie, P.K.; Zhao, X.; Shao, M.; Zhong, L. Ambient CFCs and HCFC-22 observed concurrently at 84 sites in the Pearl River Delta region during the 2008–2009 grid studies. J. Geophys. Res. Atmos. 2014, 119, 7699–7717. [Google Scholar] [CrossRef] [Green Version]
  38. Kim, K.H.; Pandey, S.K.; Jo, H.J.; Jeon, E.C. Characteristics of chlorofluorocarbons (CFCs) emitted from a municipal waste treatment facility. Chemosphere 2012, 89, 1384–1389. [Google Scholar] [CrossRef] [PubMed]
  39. Lu, C.; Zhang, L.; Zhong, Y.; Ren, W.; Tobias, M.; Mu, Z.; Ma, Z.; Geng, Y.; Xue, B. An overview of e-waste management in China. J. Mater. Cycles Waste Manag. 2015, 17, 1–12. [Google Scholar] [CrossRef]
  40. McCulloch, A.; Midgley, P.M.; Ashford, P. Releases of refrigerant gases (CFC-12, HCFC-22 and HFC-134a) to the atmosphere. Atmos. Environ. 2003, 37, 889–902. [Google Scholar] [CrossRef]
  41. Slack, R.; Gronow, J.; Voulvoulis, N. Hazardous Components of Household Waste. Crit. Rev. Environ. Sci. Technol. 2004, 34, 419–445. [Google Scholar] [CrossRef]
  42. Harris, N.R.; Montzka, S.A.; Newman, P.A. Report on the international symposium of the unexpected increase in emissions of ozone-depleting CFC-11. Sparc Newsl. 2019, 53, 9–18. [Google Scholar]
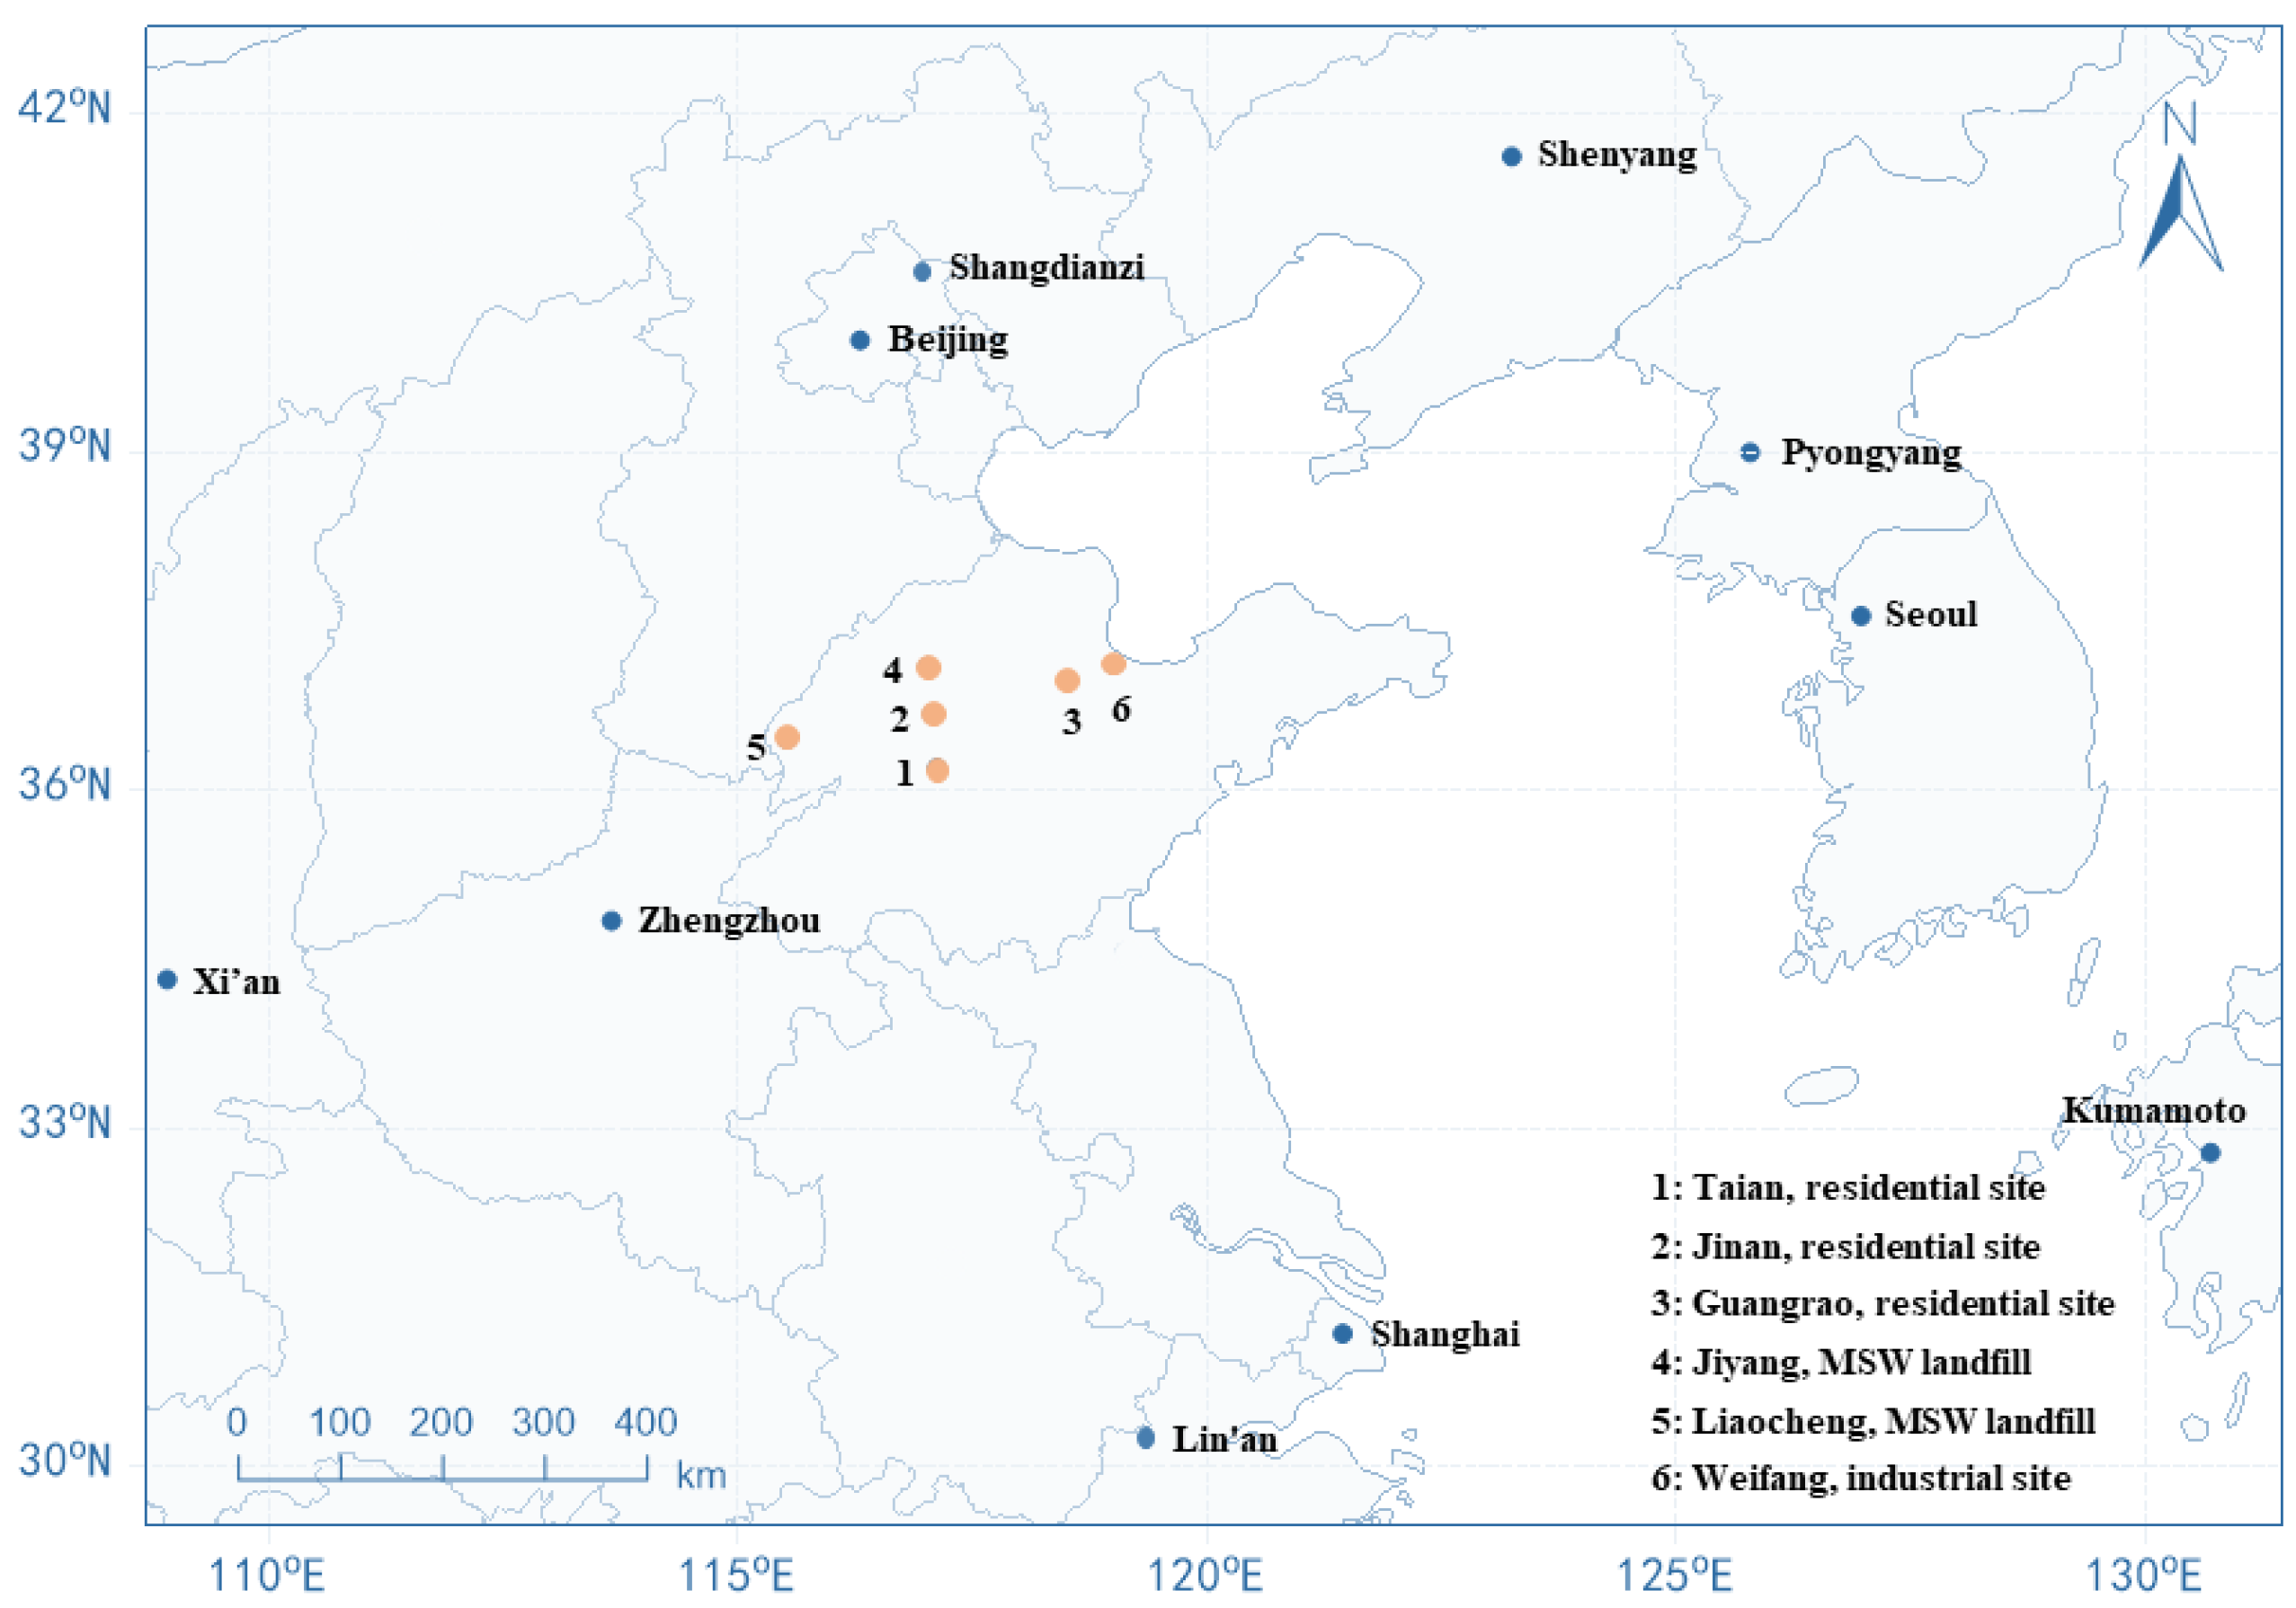
Figure 1. The specific sampling locations in Eastern China.
Atmosphere 11 01299 g001
Figure 2. Meteorological conditions before, during haze, and after haze event. Meteorological conditions were monitored at Jinan Monitoring Station (117.02° E, 36.67° N; Jinan) and Quancheng Plaza (115.75° E, 36.55° N; Jinan). Data for air pollutants was obtained from Jinan Monitoring Station.
Atmosphere 11 01299 g002
Figure 3. Chlorofluorocarbon (CFC) concentrations during and after haze event in urban Jinan (JN).
Atmosphere 11 01299 g003
Figure 4. Mean concentrations of CFCs at municipal solid waste (MSW) landfills in Jiyang (JY) (completed) and Liaocheng (LC) (in use).
Atmosphere 11 01299 g004
Figure 5. CFC concentrations of samples collected in Weifang (WF).
Atmosphere 11 01299 g005
Table 1. Comparison of the mean concentrations for CFCs measured in this study and background sites.
SiteLongitudeLatitudeMean (pptv)Time PeriodTypeReferences
CFC-11CFC-12CFC-113CFC-114
TA117.12° E36.20° N279590751310/2017–12/2017tourist city, n = 116This study
JN117.07° E36.68° N296564791310/2017–12/2017provincial capital, n = 68
GR118.51° E36.98° N267563971411/2017Rural, n = 32
WF119.00° E37.12° N322791911610/2017–11/2017Industrial, n = 120
JY117.02° E37.10° N246750751410/2017MSW, n = 44
LC115.52° E36.46° N4468301851711/2017MSW, n = 44
Beijing116.40° E39.96° N590-70102016urban, China[27]
116.40° E40.00° N316-721012/2015–1/2016residential, China[28]
116.30° E40.00° N377649991810/2010–11/2010residential, China[25]
Xi’an108.85° E34.37° N1330630100307/2018urban, China[29]
Wangdu115.25° E38.67° N610-703011/2017–1/2018rural, China[30]
Mount Tai117.1° E36.27° N25757780182017–2018high elevation site, China[17]
SDZ117.12° E40.65° N25455477-1/2011–12/2011background, China[26]
Lan 1119.73° E30.3° N25755579-1/2012–12/2012background, China[26]
GSN 2126.17° E33.28° N23552173162017background, AsiaWDCGG
SMO 2170.6° E14.30° S22850872162017background, AmericaWDCGG
MHD 298.99° E53.32° N23051471162017background, EuropeWDCGG
1: Lan: Lin’an (30.3°N, 119.73°E, 138.6 m), background site in Yangtze River Delta, China; 2: The global background CFC data were derived from the World Data Centre for Greenhouse Gases (WDCGG). GSN: Gosan (72 m), Republic of Korea; an average in 2017. SMO: Samoa Observatory (77 m) in the Northern Hemisphere; an average of SMO in 2017. MHD: Mace Head, Ireland (5 m); an average of MHD in 2017.
Publisher’s Note: MDPI stays neutral with regard to jurisdictional claims in published maps and institutional affiliations.