Monitoring Chlorofluorocarbons in Potential Source Regions in Eastern China

Abstract
:1. Introduction
2. Methods
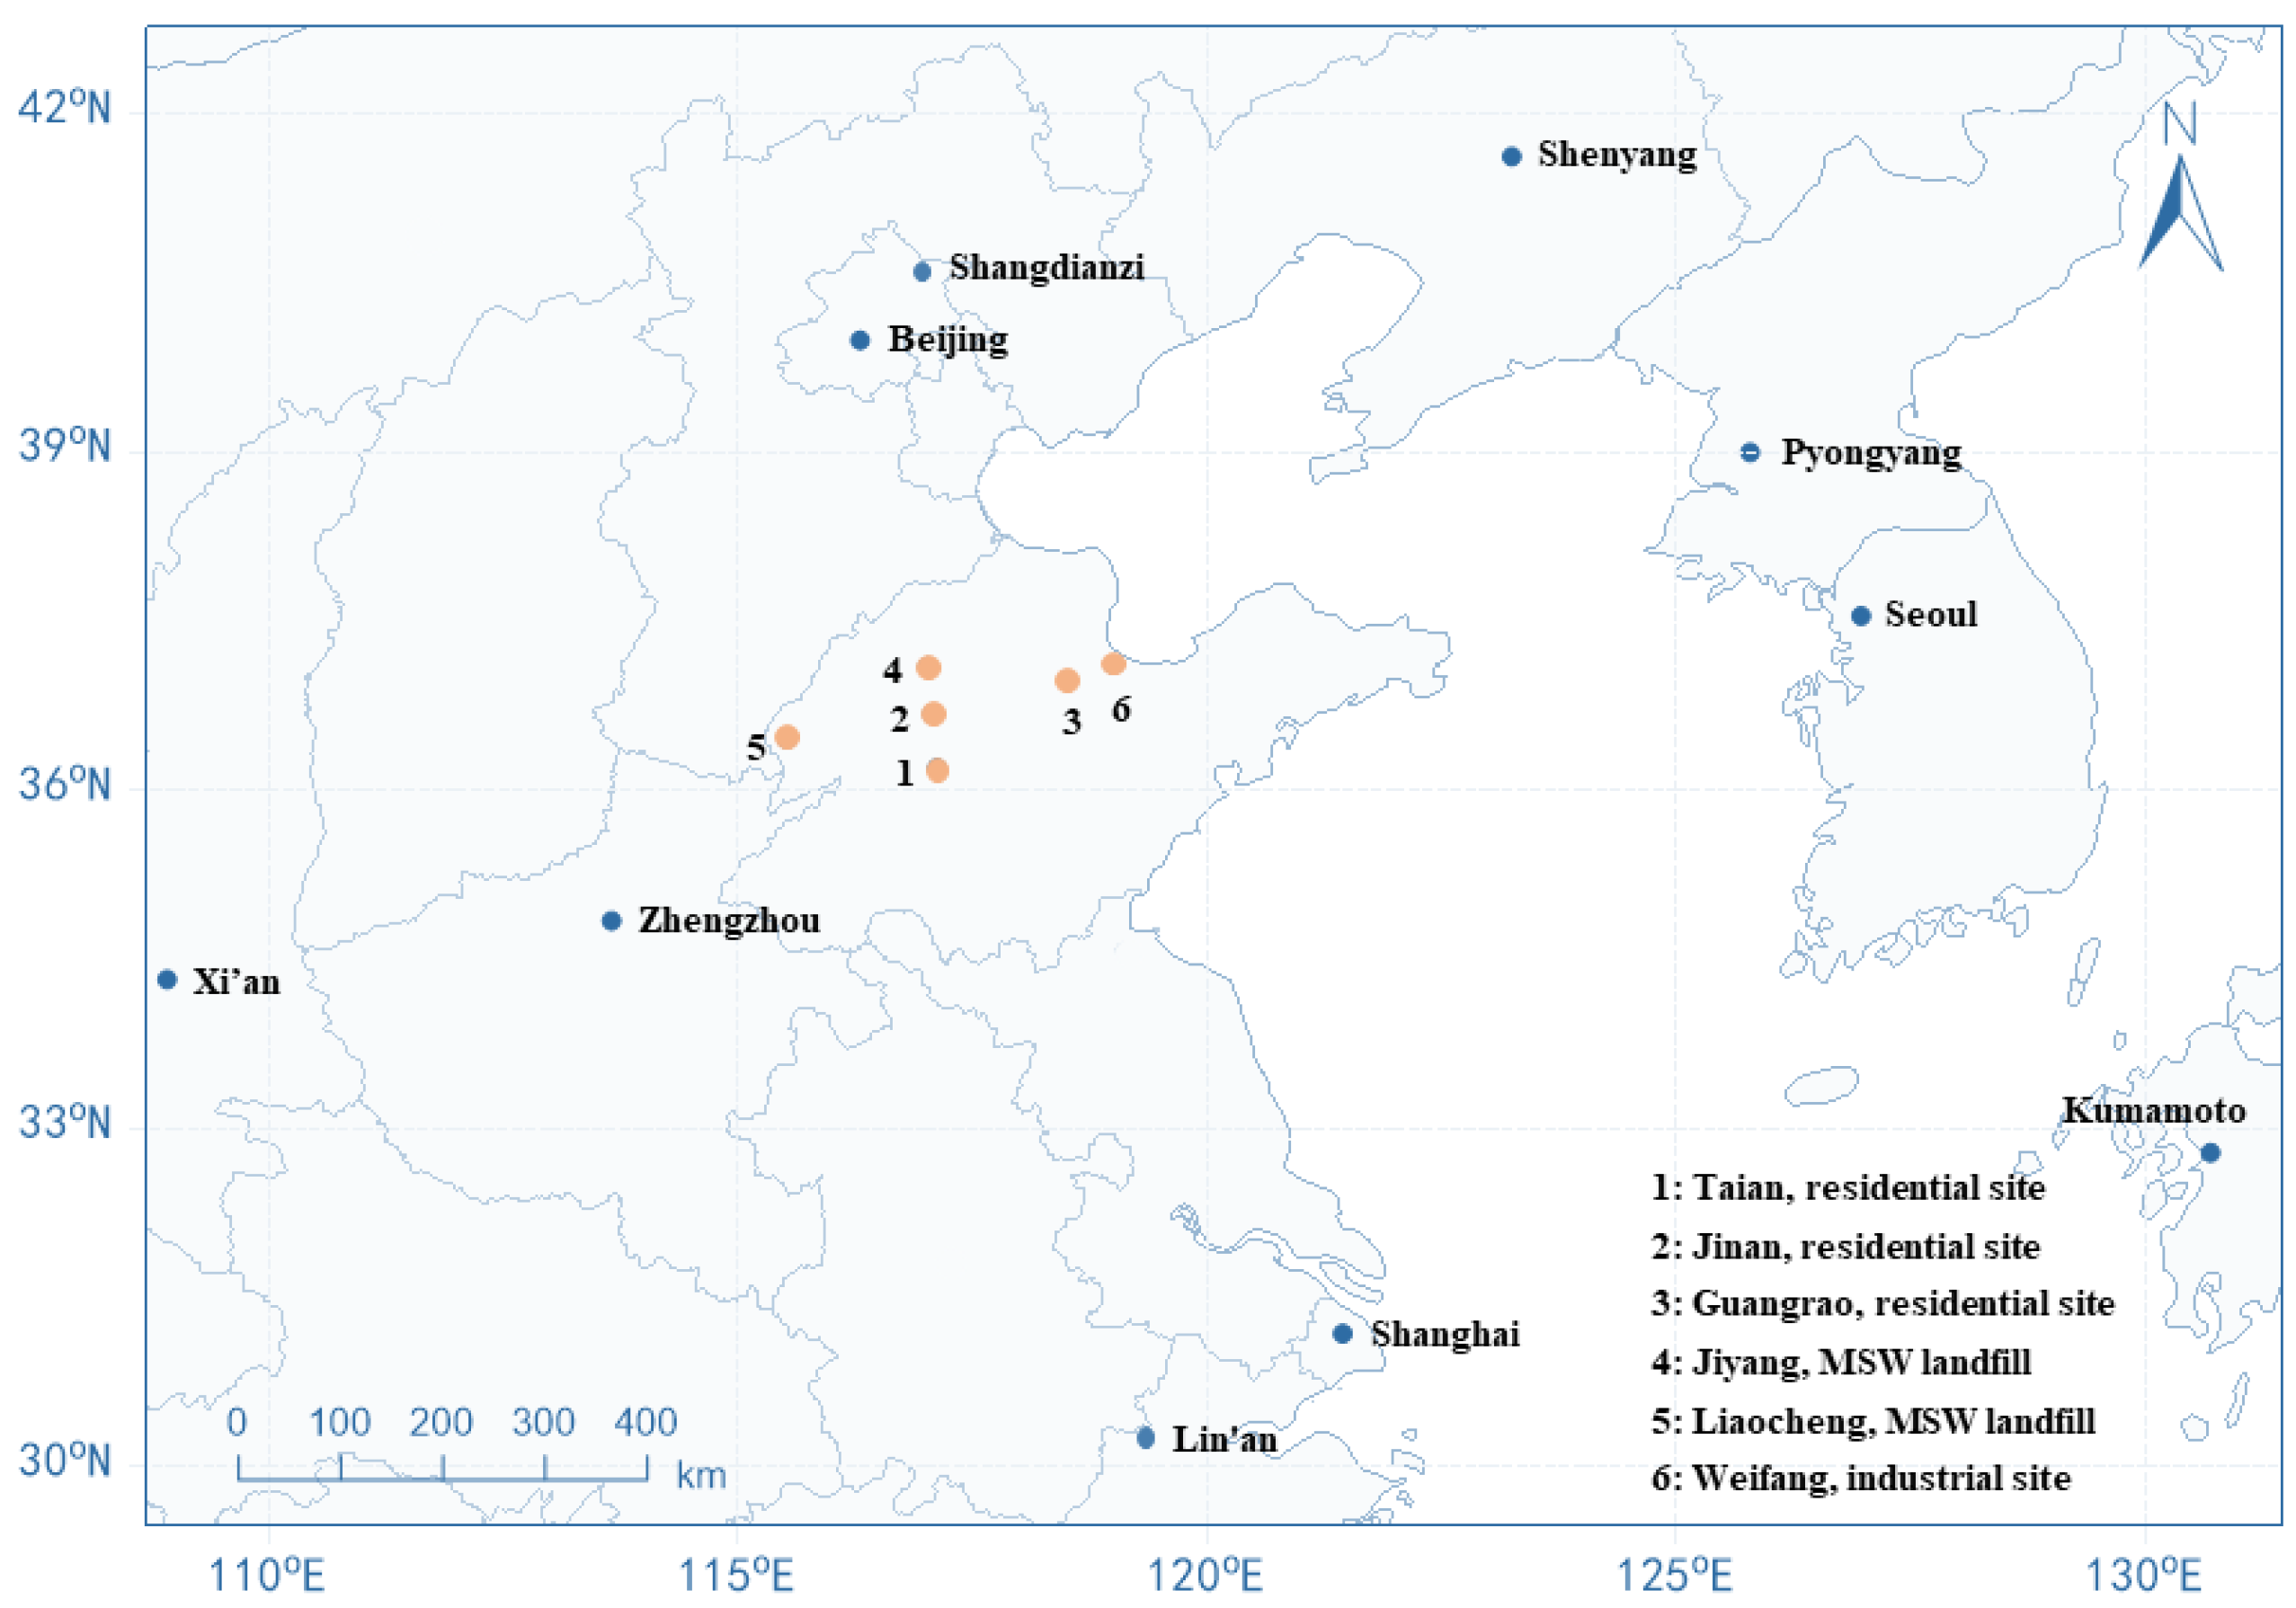
2.1. Sampling Sites
2.2. Sampling and Analysis
2.3. Linear Correlation Analysis
3. Results and Discussion
3.1. CFCs in Residential Sites
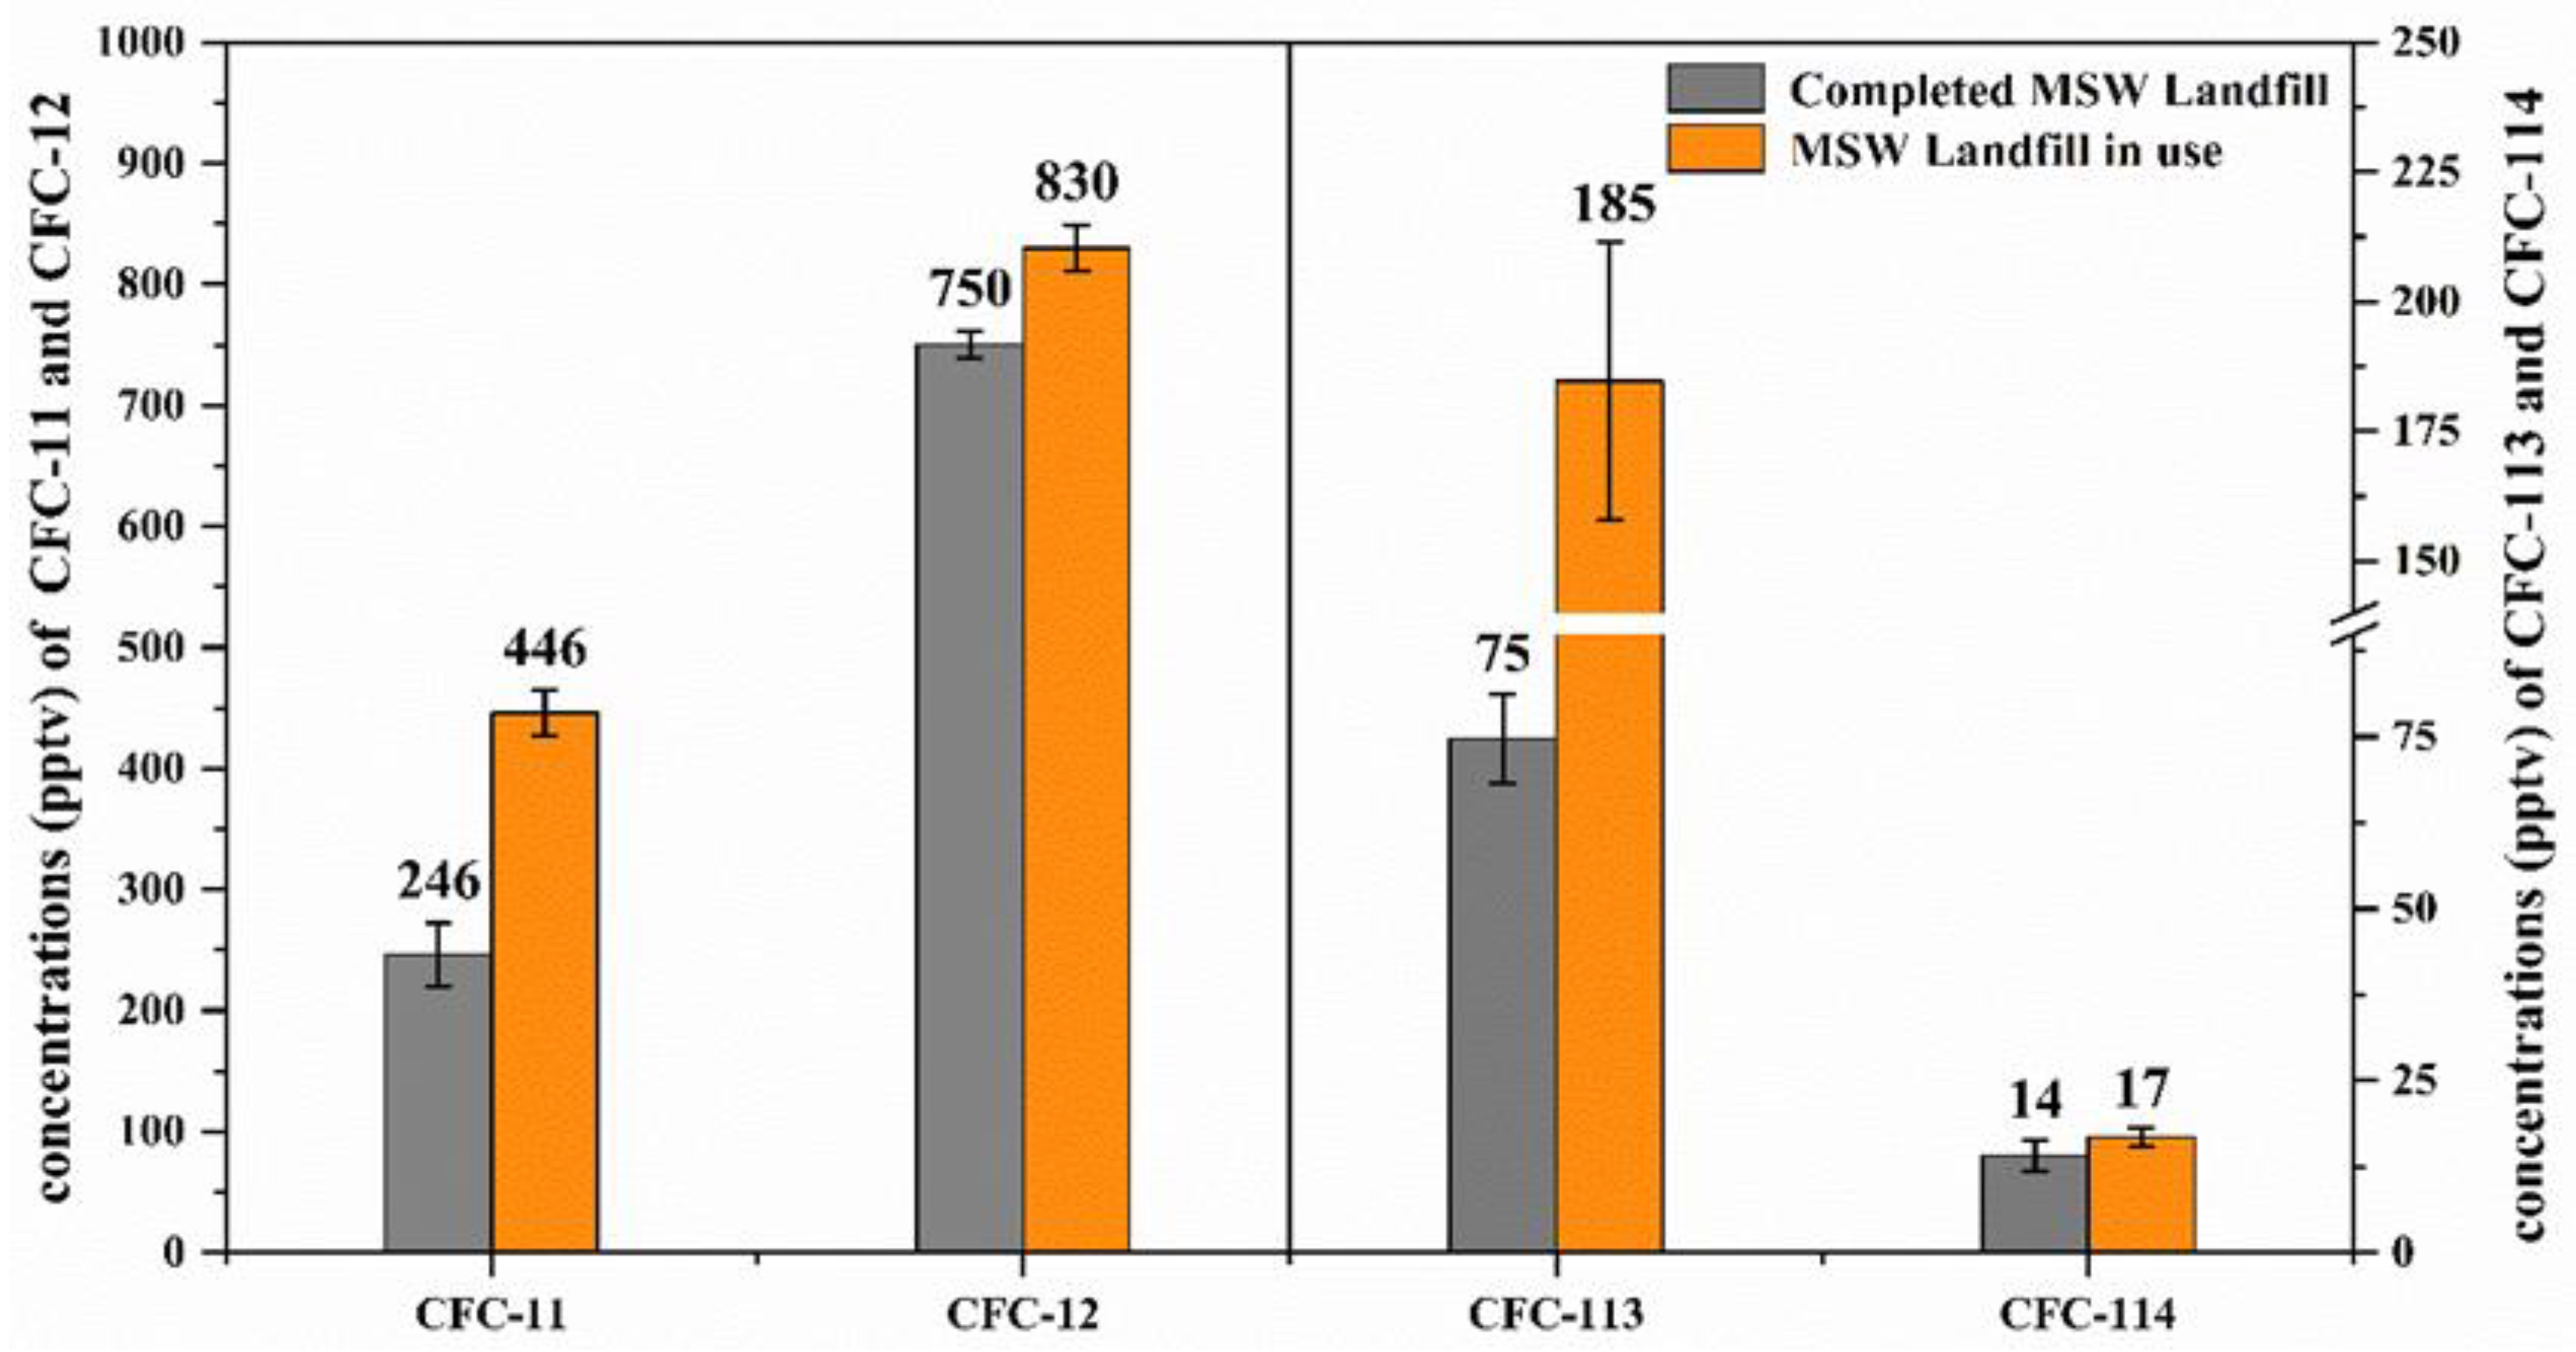
3.2. CFCs at MSW Landfill Sites
3.3. Concentrations and Interspecies Correlations of CFCs in Industrial Estates.
4. Conclusions
Author Contributions
Funding
Conflicts of Interest
References
- Molina, M.J.; Rowland, F.S. Stratospheric sink for chlorofluoromethanes: Chlorine atom-catalysed destruction of ozone. Nature 1974, 249, 810. [Google Scholar] [CrossRef]
- Chan, L.Y.; Chu, K.W. Halocarbons in the atmosphere of the industrial-related Pearl River Delta region of China. J. Geophys. Res. 2007, 112, D04305. [Google Scholar] [CrossRef] [Green Version]
- Farman, J.C.; Gardiner, B.G.; Shanklin, J.D. Large losses of total ozone in Antarctica reveal seasonal ClOx/NOx interaction. Nature 1985, 315, 207–210. [Google Scholar] [CrossRef]
- Chipperfield, M.P.; Hossaini, R.; Montzka, S.A.; Reimann, S.; Sherry, D.; Tegtmeier, S. Renewed and emerging concerns over the production and emission of ozone-depleting substances. Nat. Rev. Earth Environ. 2020, 1, 251–263. [Google Scholar] [CrossRef]
- Fang, X.; Pyle, J.A.; Chipperfield, M.P.; Daniel, J.S.; Park, S.; Prinn, R.G. Challenges for the recovery of the ozone layer. Nat. Geosci. 2019, 12, 592–596. [Google Scholar] [CrossRef]
- WMO. Scientific Assessment of Ozone Depletion: 2014. Available online: https://csl.noaa.gov/assessments/ozone/2014/adm/ (accessed on 30 November 2020).
- Salby, M.; Titova, E.; Deschamps, L. Rebound of Antarctic ozone. Geophys. Res. Lett. 2011, 38, 1–4. [Google Scholar] [CrossRef]
- Montzka, S.A.; Dutton, G.S.; Yu, P.; Ray, E.; Portmann, R.W.; Daniel, J.S.; Kuijpers, L.; Hall, B.D.; Mondeel, D.; Siso, C.; et al. An unexpected and persistent increase in global emissions of ozone-depleting CFC-11. Nature 2018, 557, 413–417. [Google Scholar] [CrossRef]
- Hossaini, R.; Chipperfield, M.P.; Montzka, S.A.; Leeson, A.A.; Dhomse, S.S.; Pyle, J.A. The increasing threat to stratospheric ozone from dichloromethane. Nat. Commun. 2017, 8, 15962. [Google Scholar] [CrossRef]
- Fang, X.; Park, S.; Saito, T.; Tunnicliffe, R.; Ganesan, A.L.; Rigby, M.; Li, S.; Yokouchi, Y.; Fraser, P.J.; Harth, C.M.; et al. Rapid increase in ozone-depleting chloroform emissions from China. Nat. Geosci. 2018, 12, 89–93. [Google Scholar] [CrossRef]
- Lunt, M.F.; Park, S.; Li, S.; Henne, S.; Manning, A.J.; Ganesan, A.L.; Simpson, I.J.; Blake, D.R.; Liang, Q.; O’Doherty, S.; et al. Continued Emissions of the Ozone-Depleting Substance Carbon Tetrachloride From Eastern Asia. Geophys. Res. Lett. 2018, 45, 11423–11430. [Google Scholar] [CrossRef] [Green Version]
- Adcock, K.E.; Reeves, C.E.; Gooch, L.J.; Leedham Elvidge, E.C.; Ashfold, M.J.; Brenninkmeijer, C.A.M.; Chou, C.; Fraser, P.J.; Langenfelds, R.L.; Mohd Hanif, N.; et al. Continued increase of CFC-113a (CCl3CF3) mixing ratios in the global atmosphere: Emissions, occurrence and potential sources. Atmos. Chem. Phys. 2018, 18, 4737–4751. [Google Scholar] [CrossRef] [Green Version]
- Dhomse, S.S.; Feng, W.; Montzka, S.A.; Hossaini, R.; Keeble, J.; Pyle, J.A.; Daniel, J.S.; Chipperfield, M.P. Delay in recovery of the Antarctic ozone hole from unexpected CFC-11 emissions. Nat. Commun. 2019, 10, 5781. [Google Scholar] [CrossRef] [PubMed] [Green Version]
- Rigby, M.; Park, S.; Saito, T.; Western, L.M.; Redington, A.L.; Fang, X.; Henne, S.; Manning, A.J.; Prinn, R.G.; Dutton, G.S.; et al. Increase in CFC-11 emissions from eastern China based on atmospheric observations. Nature 2019, 569, 546–550. [Google Scholar] [CrossRef]
- WMO. Scientific Assessment of Ozone Depletion: 2018. Available online: https://csl.noaa.gov/assessments/ozone/2018/ (accessed on 30 November 2020).
- Lin, Y.; Gong, D.; Lv, S.; Ding, Y.; Wu, G.; Wang, H.; Li, Y.; Wang, Y.; Zhou, L.; Wang, B. Observations of High Levels of Ozone-Depleting CFC-11 at a Remote Mountain-Top Site in Southern China. Environ. Sci. Technol. Lett. 2019, 6, 114–118. [Google Scholar] [CrossRef]
- Yang, M.; Yang, F.; Li, H.; Li, T.; Cao, F.; Nie, X.; Zhen, J.; Li, P.; Wang, Y. CFCs measurements at high altitudes in northern China during 2017–2018: Concentrations and potential emission source regions. Sci. Total Environ. 2020, 754, 142290. [Google Scholar] [CrossRef]
- Cyranoski, D. China feels the heat over rogue CFC emissions. Nature 2019, 571, 309–310. [Google Scholar] [CrossRef] [PubMed]
- Laube, J.C.; Elvidge, E.C.L.; Adcock, K.E.; Baier, B.; Brenninkmeijer, C.A.M.; Chen, H.; Droste, E.S.; Grooß, J.-U.; Heikkinen, P.; Hind, A.J.; et al. Investigating stratospheric changes between 2009 and 2018 with halogenated trace gas data from aircraft, AirCores, and a global model focusing on CFC-11. Atmos. Chem. Phys. 2020, 20, 9771–9782. [Google Scholar] [CrossRef]
- Adcock, K.E.; Ashfold, M.J.; Chou, C.C.; Gooch, L.J.; Mohd Hanif, N.; Laube, J.C.; Oram, D.E.; Ou-Yang, C.F.; Panagi, M.; Sturges, W.T.; et al. Investigation of East Asian Emissions of CFC-11 Using Atmospheric Observations in Taiwan. Environ. Sci. Technol. 2020, 54, 3814–3822. [Google Scholar] [CrossRef]
- Manning, J.; Burckle, J.; Hedges, S.; McElroy, F. Compendium Method TO-14A: Determination of Volatile Organic Compounds (VOCs) in Ambient Air Using Specially Prepared Canisters with Subsequent Analysis by Gas Chromatography. In Compendium of Methods for the Determination of Toxic Organic Compounds in Ambient Air; Center for Environmental Research InformationOffice of Research and DevelopmentU.S. Environmental Protection Agency: Cincinnati, OH, USA, 1999. Available online: https://www3.epa.gov/ttnamti1/files/ambient/airtox/to-14ar.pdf (accessed on 30 November 2019).
- Zhang, Y.; Liu, T.; Li, K.; Zhang, J. Improved visual correlation analysis for multidimensional data. J. Vis. Lang. Comput. 2017, 41, 121–132. [Google Scholar] [CrossRef]
- Zeng, W.; Liu, T.; Du, Q.; Li, J.; Xiao, J.; Guo, L.; Li, X.; Xu, Y.; Xu, X.; Wan, D.; et al. The interplay of haze characteristics on mortality in the Pearl River Delta of China. Environ. Res. 2020, 184, 109279. [Google Scholar] [CrossRef] [PubMed]
- Liu, T.; Zhang, Y.H.; Xu, Y.J.; Lin, H.L.; Xu, X.J.; Luo, Y.; Xiao, J.; Zeng, W.L.; Zhang, W.F.; Chu, C.; et al. The effects of dust-haze on mortality are modified by seasons and individual characteristics in Guangzhou, China. Environ. Pollut. 2014, 187, 116–123. [Google Scholar] [CrossRef] [PubMed]
- Fang, X.; Wu, J.; Xu, J.; Huang, D.; Shi, Y.; Wan, D.; Wu, H.; Shao, M.; Hu, J. Ambient mixing ratios of chlorofluorocarbons, hydrochlorofluorocarbons and hydrofluorocarbons in 46 Chinese cities. Atmos. Environ. 2012, 54, 387–392. [Google Scholar] [CrossRef]
- Zhang, G.; Yao, B.; Vollmer, M.K.; Montzka, S.A.; Mühle, J.; Weiss, R.F.; O’Doherty, S.; Li, Y.; Fang, S.; Reimann, S. Ambient mixing ratios of atmospheric halogenated compounds at five background stations in China. Atmos. Environ. 2017, 160, 55–69. [Google Scholar] [CrossRef]
- Liu, Y.; Song, M.; Liu, X.; Zhang, Y.; Hui, L.; Kong, L.; Zhang, Y.; Zhang, C.; Qu, Y.; An, J.; et al. Characterization and sources of volatile organic compounds (VOCs) and their related changes during ozone pollution days in 2016 in Beijing, China. Environ. Pollut. 2020, 257, 113599. [Google Scholar] [CrossRef]
- Gu, Y.; Li, Q.; Wei, D.; Gao, L.; Tan, L.; Su, G.; Liu, G.; Liu, W.; Li, C.; Wang, Q. Emission characteristics of 99 NMVOCs in different seasonal days and the relationship with air quality parameters in Beijing, China. Ecotoxicol. Environ. Saf. 2019, 169, 797–806. [Google Scholar] [CrossRef]
- Sun, J.; Shen, Z.; Zhang, Y.; Zhang, Z.; Zhang, Q.; Zhang, T.; Niu, X.; Huang, Y.; Cui, L.; Xu, H.; et al. Urban VOC profiles, possible sources, and its role in ozone formation for a summer campaign over Xi’an, China. Environ. Sci. Pollut. Res. Int. 2019, 26, 27769–27782. [Google Scholar] [CrossRef]
- Zhang, F.; Shang, X.; Chen, H.; Xie, G.; Fu, Y.; Wu, D.; Sun, W.; Liu, P.; Zhang, C.; Mu, Y.; et al. Significant impact of coal combustion on VOCs emissions in winter in a North China rural site. Sci. Total Environ. 2020, 720, 137617. [Google Scholar] [CrossRef]
- Wan, D.; Xu, J.; Zhang, J.; Tong, X.; Hu, J. Historical and projected emissions of major halocarbons in China. Atmos. Environ. 2009, 43, 5822–5829. [Google Scholar] [CrossRef]
- Wang, C.; Shao, M.; Huang, D.; Lu, S.; Zeng, L.; Hu, M.; Zhang, Q. Estimating halocarbon emissions using measured ratio relative to tracers in China. Atmos. Environ. 2014, 89, 816–826. [Google Scholar] [CrossRef]
- Li, S.; Kim, J.; Kim, K.R.; Muhle, J.; Kim, S.K.; Park, M.K.; Stohl, A.; Kang, D.J.; Arnold, T.; Harth, C.M.; et al. Emissions of halogenated compounds in East Asia determined from measurements at Jeju Island, Korea. Environ. Sci. Technol. 2011, 45, 5668–5675. [Google Scholar] [CrossRef] [PubMed]
- Wu, H.; Chen, H.; Wang, Y.; Ding, A.; Chen, J. The changing ambient mixing ratios of long-lived halocarbons under Montreal Protocol in China. J. Clean. Prod. 2018, 188, 774–785. [Google Scholar] [CrossRef]
- Yazici, B.; Can, Z.S.; Calli, B. Prediction of future disposal of end-of-life refrigerators containing CFC-11. Waste Manag. 2014, 34, 162–166. [Google Scholar] [CrossRef] [PubMed]
- Scheutz, C.; Dote, Y.; Fredenslund, A.M.; Mosbæk, H.; Kjeldsen, P. Attenuation of fluorocarbons released from foam insulation in landfills. Environ. Sci. Technol. 2007, 41, 7714–7722. [Google Scholar] [CrossRef] [PubMed]
- Zhang, Y.; Wang, X.; Simpson, I.J.; Barletta, B.; Blake, D.R.; Meinardi, S.; Louie, P.K.; Zhao, X.; Shao, M.; Zhong, L. Ambient CFCs and HCFC-22 observed concurrently at 84 sites in the Pearl River Delta region during the 2008–2009 grid studies. J. Geophys. Res. Atmos. 2014, 119, 7699–7717. [Google Scholar] [CrossRef] [Green Version]
- Kim, K.H.; Pandey, S.K.; Jo, H.J.; Jeon, E.C. Characteristics of chlorofluorocarbons (CFCs) emitted from a municipal waste treatment facility. Chemosphere 2012, 89, 1384–1389. [Google Scholar] [CrossRef] [PubMed]
- Lu, C.; Zhang, L.; Zhong, Y.; Ren, W.; Tobias, M.; Mu, Z.; Ma, Z.; Geng, Y.; Xue, B. An overview of e-waste management in China. J. Mater. Cycles Waste Manag. 2015, 17, 1–12. [Google Scholar] [CrossRef]
- McCulloch, A.; Midgley, P.M.; Ashford, P. Releases of refrigerant gases (CFC-12, HCFC-22 and HFC-134a) to the atmosphere. Atmos. Environ. 2003, 37, 889–902. [Google Scholar] [CrossRef]
- Slack, R.; Gronow, J.; Voulvoulis, N. Hazardous Components of Household Waste. Crit. Rev. Environ. Sci. Technol. 2004, 34, 419–445. [Google Scholar] [CrossRef]
- Harris, N.R.; Montzka, S.A.; Newman, P.A. Report on the international symposium of the unexpected increase in emissions of ozone-depleting CFC-11. Sparc Newsl. 2019, 53, 9–18. [Google Scholar]


| Site | Longitude | Latitude | Mean (pptv) | Time Period | Type | References | |||
|---|---|---|---|---|---|---|---|---|---|
| CFC-11 | CFC-12 | CFC-113 | CFC-114 | ||||||
| TA | 117.12° E | 36.20° N | 279 | 590 | 75 | 13 | 10/2017–12/2017 | tourist city, n = 116 | This study |
| JN | 117.07° E | 36.68° N | 296 | 564 | 79 | 13 | 10/2017–12/2017 | provincial capital, n = 68 | |
| GR | 118.51° E | 36.98° N | 267 | 563 | 97 | 14 | 11/2017 | Rural, n = 32 | |
| WF | 119.00° E | 37.12° N | 322 | 791 | 91 | 16 | 10/2017–11/2017 | Industrial, n = 120 | |
| JY | 117.02° E | 37.10° N | 246 | 750 | 75 | 14 | 10/2017 | MSW, n = 44 | |
| LC | 115.52° E | 36.46° N | 446 | 830 | 185 | 17 | 11/2017 | MSW, n = 44 | |
| Beijing | 116.40° E | 39.96° N | 590 | - | 70 | 10 | 2016 | urban, China | [27] |
| 116.40° E | 40.00° N | 316 | - | 72 | 10 | 12/2015–1/2016 | residential, China | [28] | |
| 116.30° E | 40.00° N | 377 | 649 | 99 | 18 | 10/2010–11/2010 | residential, China | [25] | |
| Xi’an | 108.85° E | 34.37° N | 1330 | 630 | 100 | 30 | 7/2018 | urban, China | [29] |
| Wangdu | 115.25° E | 38.67° N | 610 | - | 70 | 30 | 11/2017–1/2018 | rural, China | [30] |
| Mount Tai | 117.1° E | 36.27° N | 257 | 577 | 80 | 18 | 2017–2018 | high elevation site, China | [17] |
| SDZ | 117.12° E | 40.65° N | 254 | 554 | 77 | - | 1/2011–12/2011 | background, China | [26] |
| Lan 1 | 119.73° E | 30.3° N | 257 | 555 | 79 | - | 1/2012–12/2012 | background, China | [26] |
| GSN 2 | 126.17° E | 33.28° N | 235 | 521 | 73 | 16 | 2017 | background, Asia | WDCGG |
| SMO 2 | 170.6° E | 14.30° S | 228 | 508 | 72 | 16 | 2017 | background, America | WDCGG |
| MHD 2 | 98.99° E | 53.32° N | 230 | 514 | 71 | 16 | 2017 | background, Europe | WDCGG |
Publisher’s Note: MDPI stays neutral with regard to jurisdictional claims in published maps and institutional affiliations. |
© 2020 by the authors. Licensee MDPI, Basel, Switzerland. This article is an open access article distributed under the terms and conditions of the Creative Commons Attribution (CC BY) license (http://creativecommons.org/licenses/by/4.0/).
Share and Cite
Zhen, J.; Yang, M.; Zhou, J.; Yang, F.; Li, T.; Li, H.; Cao, F.; Nie, X.; Li, P.; Wang, Y. Monitoring Chlorofluorocarbons in Potential Source Regions in Eastern China. Atmosphere 2020, 11, 1299. https://doi.org/10.3390/atmos11121299
Zhen J, Yang M, Zhou J, Yang F, Li T, Li H, Cao F, Nie X, Li P, Wang Y. Monitoring Chlorofluorocarbons in Potential Source Regions in Eastern China. Atmosphere. 2020; 11(12):1299. https://doi.org/10.3390/atmos11121299
Chicago/Turabian StyleZhen, Jiebo, Minmin Yang, Jie Zhou, Fengchun Yang, Tao Li, Hongli Li, Fangfang Cao, Xiaoling Nie, Panyan Li, and Yan Wang. 2020. "Monitoring Chlorofluorocarbons in Potential Source Regions in Eastern China" Atmosphere 11, no. 12: 1299. https://doi.org/10.3390/atmos11121299