Article

Evaluating Satellite Sounding Temperature Observations for Cold Air Aloft Detection

Science and Technology Corporation, 10015 Old Columbia Rd STE 250E, Columbia, MD 21046, USA
*
Author to whom correspondence should be addressed.
Atmosphere 2020, 11(12), 1360; https://doi.org/10.3390/atmos11121360
Submission received: 20 November 2020 / Revised: 10 December 2020 / Accepted: 12 December 2020 / Published: 15 December 2020
(This article belongs to the Special Issue Weather and Aviation Safety)

Abstract

:
Cold Air Aloft (CAA) can impact commercial flights when cold air descends below 12,192 m (40,000 ft) and temperatures drop dramatically. A CAA event is identified when air temperature falls below −65 °C, which decreases fuel efficiency and poses a safety hazard. This manuscript assesses the performance of the National Oceanic and Atmospheric Administration Unique Combined Atmospheric Processing System (NUCAPS) in detecting CAA events using sounders on polar-orbiting satellites. We compare NUCAPS air temperature profiles with those from Constellation Observing System for Meteorology, Ionosphere, and Climate (COSMIC) for January–March 2018. Of 1311 collocated profiles, 236 detected CAA. Our results showed that NUCAPS correctly detects CAA in 48.1% of profiles, while 17.2% are false positives and 34.7% are false negatives. To identify the reason for these detection states, we used a logistic regression trained on NUCAPS diagnostic parameters. We found that cloud cover can impact the skill even at higher vertical levels. This work indicates that a CAA-specific quality flag is feasible and may be useful to help forecasters to diagnose NUCAPS in real-time. Furthermore, the inclusion of an additional sounder data source (e.g., NOAA-20) may increase CAA forecast accuracy. Cloud scenes change rapidly, so additional observations provide more opportunities for correct detection.

1. Introduction

Over 14,000 flights crossed into the Arctic Circle since the 2000s. By crossing the arctic, a typical flight from New York to Hong Kong can save 16 kL of fuel and 2 h of time [1]. However, opening polar routes to large commercial aircraft has led to unique safety challenges. Jet fuel can gel when the aircraft is exposed to air temperatures below 208 K (−65 °C) for extended periods of time, which typically reduces fuel efficiency and could, in theory, cause crashes. The tropopause height is lowest near the poles, so cold air can descend below 12 km (~40,000 ft) and into the cruising altitudes of polar crossing flights (Figure 1a) [2]. These events, known as Cold Air Aloft (CAA), are a particular aviation concern during the boreal winter.
To detect CAA, National Weather Service (NWS) forecasters in Alaska use in situ measurements, Numerical Weather Prediction (NWP) models, and satellite soundings to issue warnings to pilots and air traffic control operators [3]. One such set of satellite observations that forecasters have turned to in recent years is the National Oceanic and Atmospheric Administration Unique Combined Atmospheric Processing System (NUCAPS) that retrieves real-time, high-quality, profiles of temperature from nadir-looking microwave (MW) and infrared (IR) instruments [4,5,6]. Forecasters started using NUCAPS in 2017 to detect CAA events because its retrieved soundings (1) fill observational gaps between sparse radiosonde launches with multiple orbits and 2200 km wide swaths, (2) span across international flight zones, (3) are independent of forecast models, and thus useful as comparison, and (4) are available in real-time as a skew-T diagrams and pressure-dependent gridded 2-D maps [7] in the operational forecasting tool, AWIPS (Advanced Weather Interactive Processing System). NUCAPS has value beyond detecting CAA events and specifically for hazardous weather forecasting, as was demonstrated through the Joint Polar Satellite System (JPSS) Proving Ground and Risk Reduction (PGRR) Program [8]. The PGRR program fosters interaction between NUCAPS developers and forecasters to identify new applications, improve understanding and facilitate the value of satellite soundings in operations.
In their a PGRR study [3], Weaver et al. explored the value of NUCAPS from the forecaster’s perspective for the Anchorage Center Weather Service Unit (CWSU), which provides aviation forecasts for Alaska and regions North and to the West, including the North Pole, Russia, and Japan. They evaluated NUCAPS success in detecting CAA by comparing NUCAPS to Meteorological Impact Statements (MIS), pilot responses, and other data for the boreal winters in 2016–2017 and 2017–2018. Their work describes how the partnership between developers and forecasters helped to fine-tune NUCAPS for use in an operational forecast setting. Our objective in this paper is to (1) quantitatively evaluate the skill of NUCAPS to detect CAA, (2) investigate some of the CAA observational errors by evaluating diagnostic parameters and measures of information content in the algorithm, and (3) discuss a pathway to improve the utility of NUCAPS for operational CAA detection. As an operational product at NOAA, NUCAPS is routinely validated with conventional in situ observations and during field campaigns [9,10]. In general, validation is used to rigorously determine if NUCAPS meets global statistical requirements. In contrast, this study seeks to specifically evaluate NUCAPS temperature retrievals with respect to detecting CAA, an operational application with regional scope and specific forecaster requirements.

2. Data and Methods

This study examines the 2018 northern winter season, from January to March, over a domain that includes Alaska (40–80° N, 169° E–131° W). This time and domain overlaps with the [3] study. MIS detail weather conditions expected to adversely impact air traffic flow. During the 2017–2018 winter season, [3] noted that MIS were issued for CAA for an average for 55% of the time. February 2018 was the most active month of that season, with MIS in effect for 23 days and is thus the focus of our case study presented in Section 3.
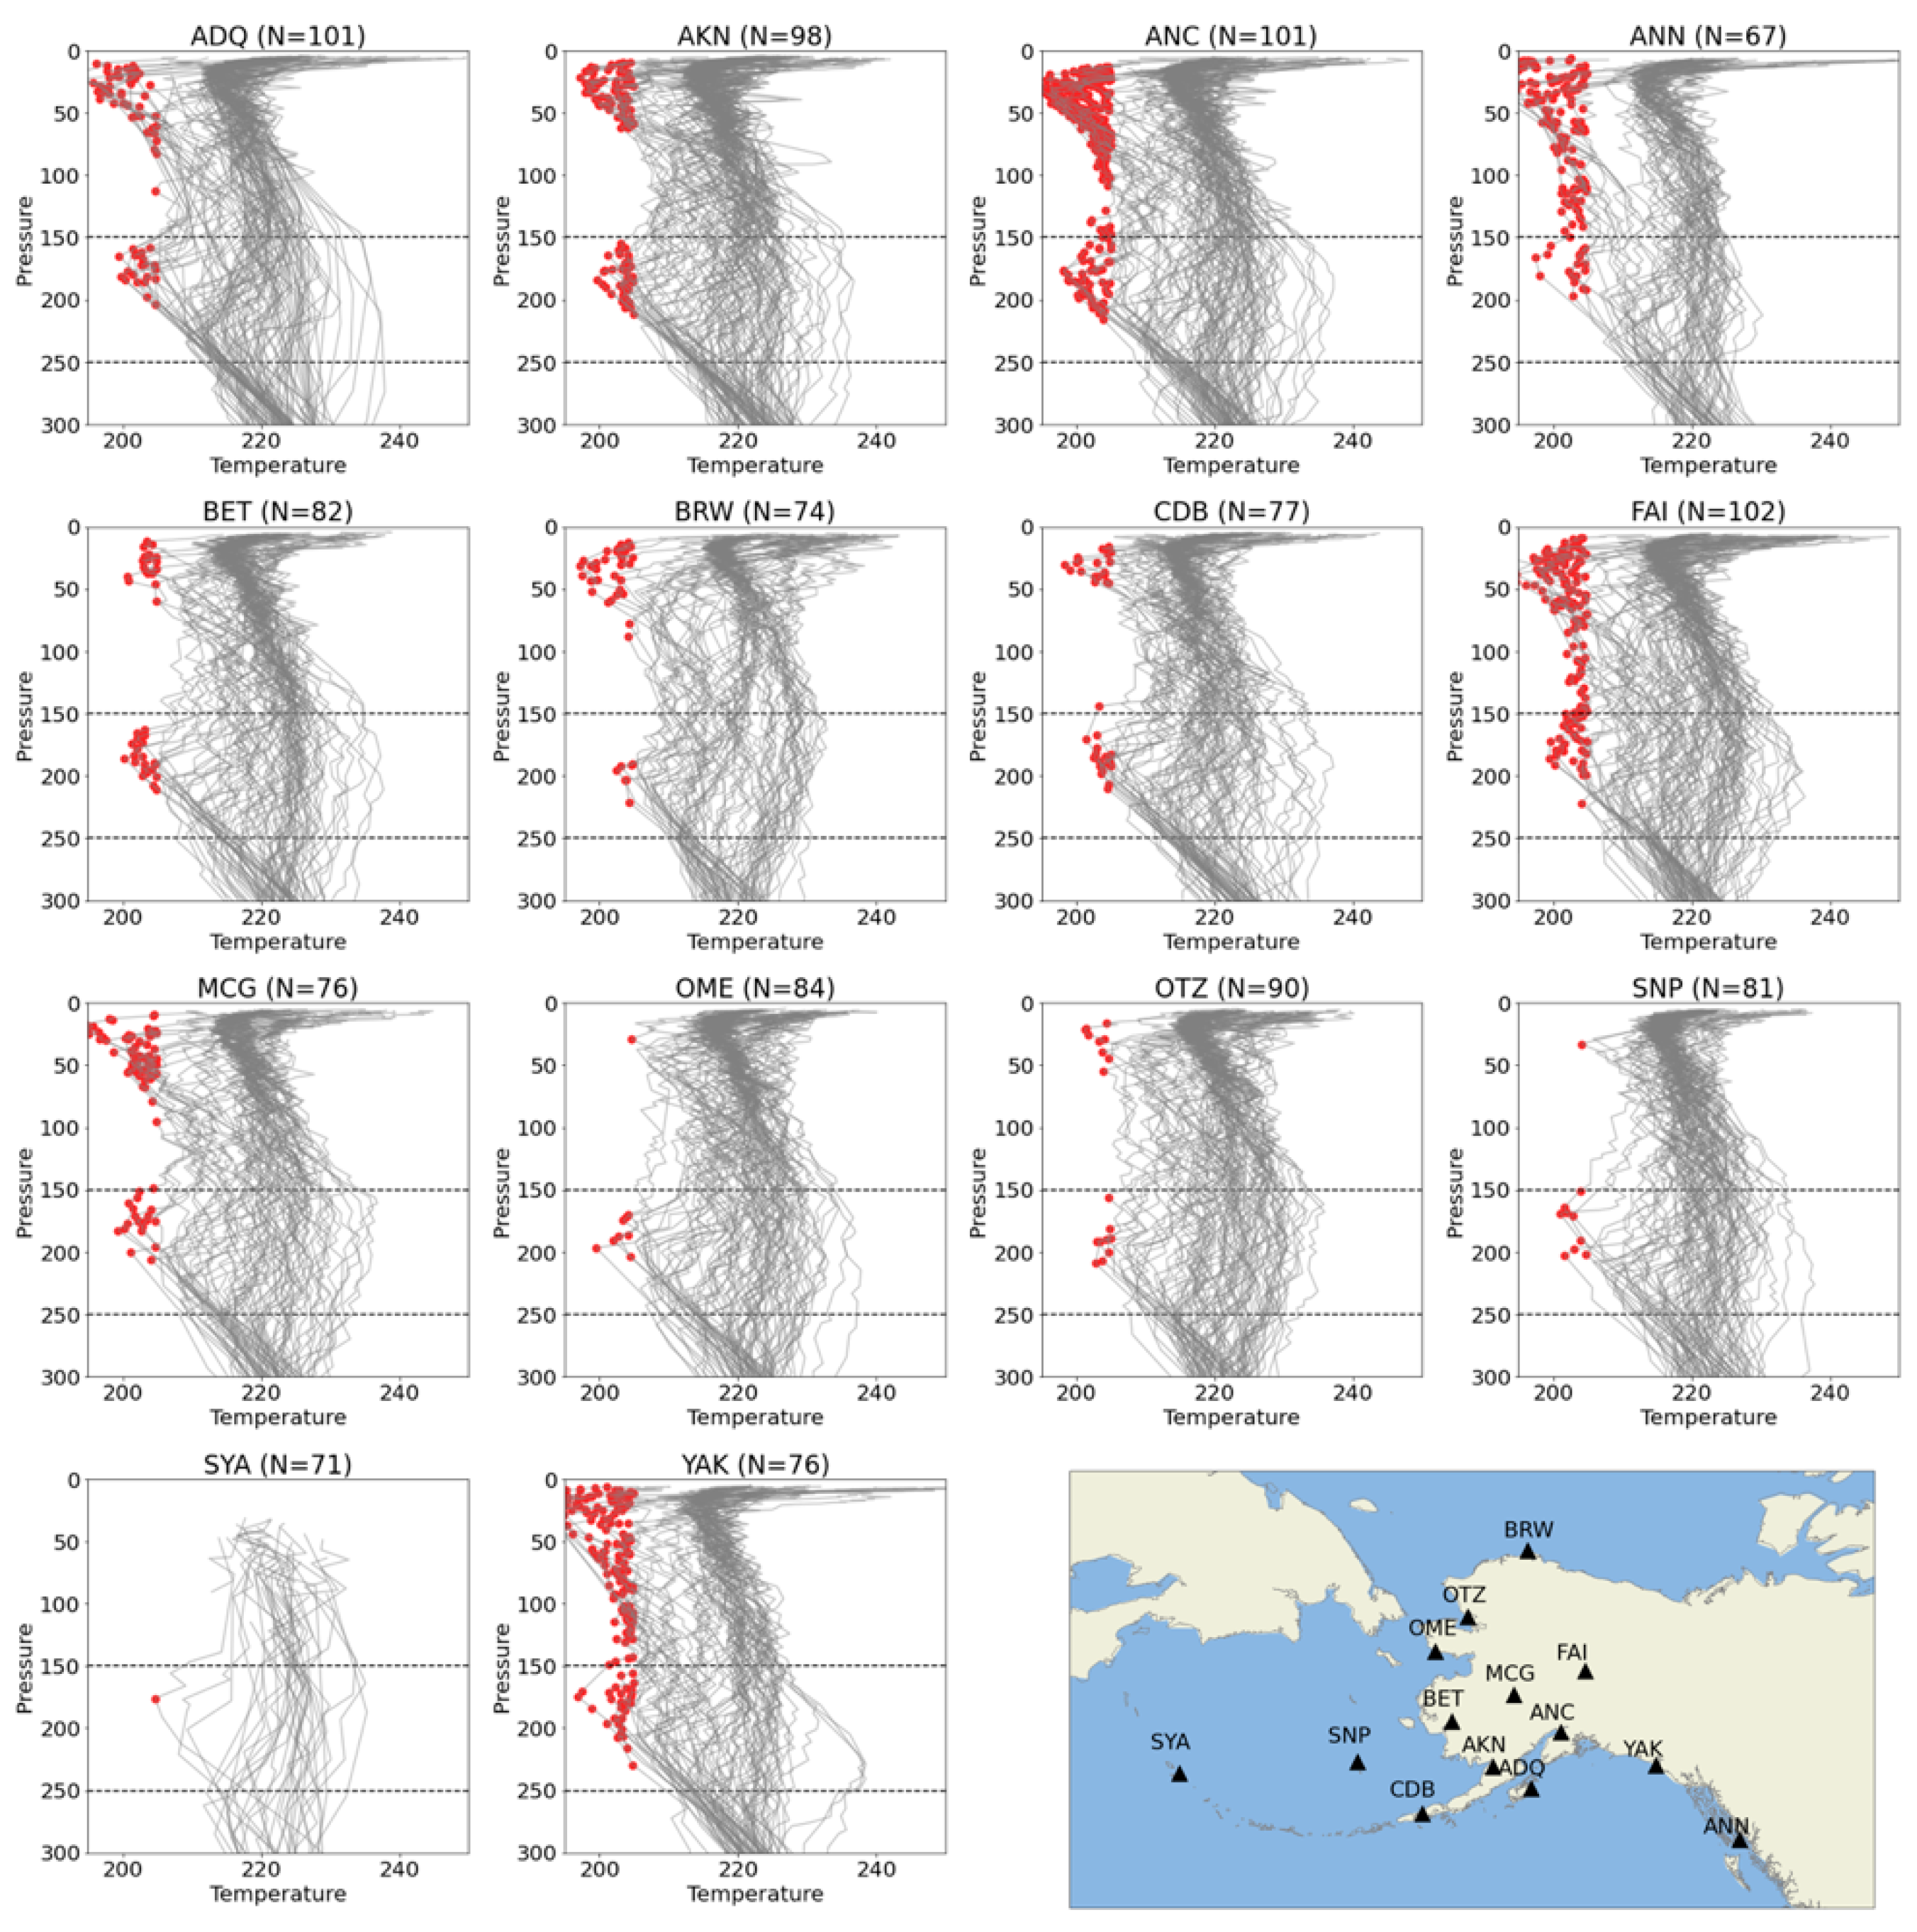
In addition to NUCAPS, conventional radiosondes and Aircraft Meteorological Data Relay (AMDAR) data are often examined alongside NWP models for forecasting CAA [11,12]. Radiosondes vertically sample the atmosphere every 30 m (a pressure layer thickness of less than 10 hPa) up to 30 km in the atmosphere, depending on local weather conditions. While the vertical resolution exceeds most, if not all, other in situ observing systems, radiosondes are only available over land and do not readily span international borders or flight zones. Furthermore, radiosondes are only routinely launched twice daily at 00 UTC and 12 UTC, although special launches occur in cases of severe weather [13]. In Alaska, radiosondes are launched from 14 sites that are shown in the lower right map in Figure 2. The remainder of the plots show temperature profiles from radiosondes (light grey solid lines) from February to March 2018, where red dots indicate temperatures below 208 K (65 °C) and therefore indicate CAA events. The data were obtained from [12]. While radiosondes can accurately detect CAA at a specific point in time and space, they are limited in their ability to characterize the spatial extent of CAA events and their launches may not always take place for reasons such as staffing shortage, equipment malfunction, or network outages. While some sites like Anchorage (ANC) have higher launch counts (N = 101, including both 00 UTC and 12 UTC), radiosondes from remote sites like Shemya Island (SYA) can be affected by frost formation upon passing through stratus clouds which cause balloons to burst at lower altitudes (N = 71) [14].
CAA can also be detected using AMDAR data, which is a collection of measured and derived meteorological parameters (including air temperature) from aircraft sensors. When available, AMDAR data are useful for determining the horizontal extent of CAA. However, the data are irregular because flights do not necessarily follow a consistent schedule. Furthermore, while AMDAR data samples along the flight path of the airplane, and thus provides a greater variety of scenes than radiosondes, AMDAR data still does not adequately cover the 6.2 × 10⁸ km2 domain that makes up the whole Anchorage CWSU domain [3]. In contrast, the high orbit frequency, and wide swaths of NUCAPS soundings make it valuable for determining the vertical and spatial extent of CAA events, which make them ideal for augmenting observations from radiosondes and AMDAR data.

2.1. NUCAPS Technical Description

NUCAPS is a system that retrieves temperature, water vapor, and trace gases from both microwave and infrared sounders on low earth orbiting (LEO) satellites. For this paper, we only examine the NUCAPS temperature profiles as other retrieved products are not relevant to CAA forecasting. To evaluate the skill in detecting CAA and rather than focus on algorithm improvements, we will only use those profiles where both the combined infrared and microwave retrieval have passed NUCAPS quality control [6,15]. NUCAPS also retrieves temperature from water vapor from microwave-only channels. However, we will not examine microwave-only profiles because they have not yet been evaluated for use in NWS operation.
For a complete discussion of the NUCAPS algorithm, see [4,5,6,9,10]. Apart from quality control flags, NUCAPS has two retrieval metrics that can be useful for evaluating NUCAPS temperature retrieval skill, namely uncertainty due to clouds and retrieval information content. NUCAPS employs a technique known as “cloud clearing” that removes the radiative effects of clouds from top of atmosphere instrument measurements to enable retrievals in partly cloudy scenes. Cloud clearing ingests the measured IR spectra from each 3 × 3 array of IR sounder fields of view (FOV; ~14 km at nadir) and derives a single cloud-free spectrum for this aggregate spatial footprint, also known as field of regard (FOR; ~50 km at nadir). NUCAPS retrieves soundings from cloud cleared spectra, which means that within each FOR footprint, a NUCAPS temperature profile depicts the clear state around clouds, not through clouds. This is an important distinction, especially when comparing against radiosondes that measure the atmosphere inside clouds. Cloud clearing is a robust, linear technique that is advantageous in operational, global sounding systems because it (1) does not require any prior knowledge of cloud types or their microphysical properties, and (2) does not require complex cloud radiative transfer calculations, which can be computationally expensive and significantly increase data latency [4]. NUCAPS produces several diagnostic parameters alongside its retrievals to help evaluate the uncertainty cloud clearing introduces. We will describe these parameters further in Section 3.2.
Like all sounding retrieval algorithms, NUCAPS solves an inverse problem to derive a dependent variable (e.g., air temperature as a function of pressure) from an independent variable (radiances). NUCAPS utilizes the Bayesian Optimal-Estimation technique [16] to retrieve atmospheric state variables that meets NOAA operational requirements [17]. The Bayesian retrieval method combines an a priori estimate (a reasonable first guess of the atmospheric state variable) with the observed radiances into the final retrieval. The degree to which the observed radiance can improve upon the a priori is represented by the averaging kernel matrix (AKM). An AKM quantifies the degree to which the observed state (retrieval) relates to the “true” state (as embedded in the measured radiances). The AKM is calculated as a function of the covariances of the signal and the noise and thus varies from scene to scene as described in [16]. Inside the AKM, values range between 0 and 1. In practice, averaging kernel values are always less than 1 because retrieval noise is never zero, while they can approximate 0 where the measured radiances have very little sensitivity to the variable in question, in which case the retrieval will approximate the a priori estimate. In NUCAPS, the a priori for temperature is a regression retrieval that uses coefficients calculated as the covariance between ECMWF and observed radiances from four global focus days. The regression uses four global days to capture sufficient diurnal and seasonal variability of IR and MW spectral combinations for the state variable [6]. Since NUCAPS is a global product, the regression was designed to not be regional or application specific.
The Trace of the AKM returns the degrees of freedom (DOF) of the signal, which is the number of independent quantities measured from the subset of channels for the retrieved variable and using the internal signal-to-noise estimates. For sounding retrievals, the DOFs correspond to the vertical resolution of the retrieved variable [18,19]. For NUCAPS temperature, the DOFs typically have a maximum of 6.0 in the boreal winter in the subarctic and Arctic [20].
As discussed in the introduction, NUCAPS can retrieve temperature from sounders on several platforms that have MW and IR sounders (e.g., Suomi National-Polar-orbiting Partnership (Suomi NPP), NOAA-20, MetOp-A/-B/-C, and soon, Aqua), which each provide roughly 4–6 daily overpasses between 45–75° N and up to 15 overpasses over the pole. For the present study, we examine NUCAPS from Suomi NPP, which was the only product available to NWS forecasters through the Satellite Broadcast Network (SBN) from 2014–2019. NUCAPS from Suomi NPP was replaced by NOAA-20 in the SBN beginning July 2019. Both NUCAPS from Suomi NPP and NOAA-20 are operational products, but only the NOAA-20 product is now available to NWS forecasters due to limitations in the SBN bandwidth. The NUCAPS data in this study was obtained from a historical archive on NOAA’s Comprehensive Large Array-data Stewardship System (CLASS; www.class.noaa.gov).

2.2. COSMIC GPS-RO Technical Description

The distribution of radiosonde launch sites in Figure 2 shows that while radiosondes provide high quality measurements, their value is primarily over land. Instead, we perform comparisons with Constellation Observing System for Meteorology, Ionosphere, and Climate (COSMIC) mission, which provides roughly 2000 temperature soundings per day using radio occultation (RO) from global positioning system (GPS) satellites [21,22,23]. While still spatially limited, COSMIC profiles are somewhat randomly distributed and thus provide greater variety in scenes than radiosondes. The COSMIC data used in this study was obtained from UCAR’s COSMIC Data Analysis and Archival Center [24].
For this study, we examine the COSMIC dry temperature profiles (that have filenames beginning with atmPrf*). The dry temperature profiles are calculated from the observed refractivity assuming the water vapor contribution to the density is zero. The atmosphere typically has very little water vapor in the upper troposphere and stratosphere, so the dry temperature profile is appropriate for examining the upper troposphere and lower stratosphere. While studies have shown that there may be a high signal-to-noise ratio for occultations closer to the surface, roughly 90% of occultations reach above 5 km, well within commercial flight zones. To control for failed retrievals, we only used profiles that passed quality control (where the “bad” flag is 0 in the profile metadata). Previously, [25] used COSMIC air temperature retrievals alongside those from sounding datasets to monitor CAA. The authors compared both COSMIC and sounding datasets with NWP models and radiosondes and found low bias and RMS for both datasets, thus demonstrating utility for CAA detection. While COSMIC has scientific value for detecting CAA, COSMIC is not available to operational NWS forecasters in real-time or via the SBN. In contrast, NUCAPS is operationally available. So, for this study, we will take advantage of COSMIC’s higher vertical resolution (0.1–1 km) to evaluate NUCAPS (1–3 km).

2.3. Matchup Criteria

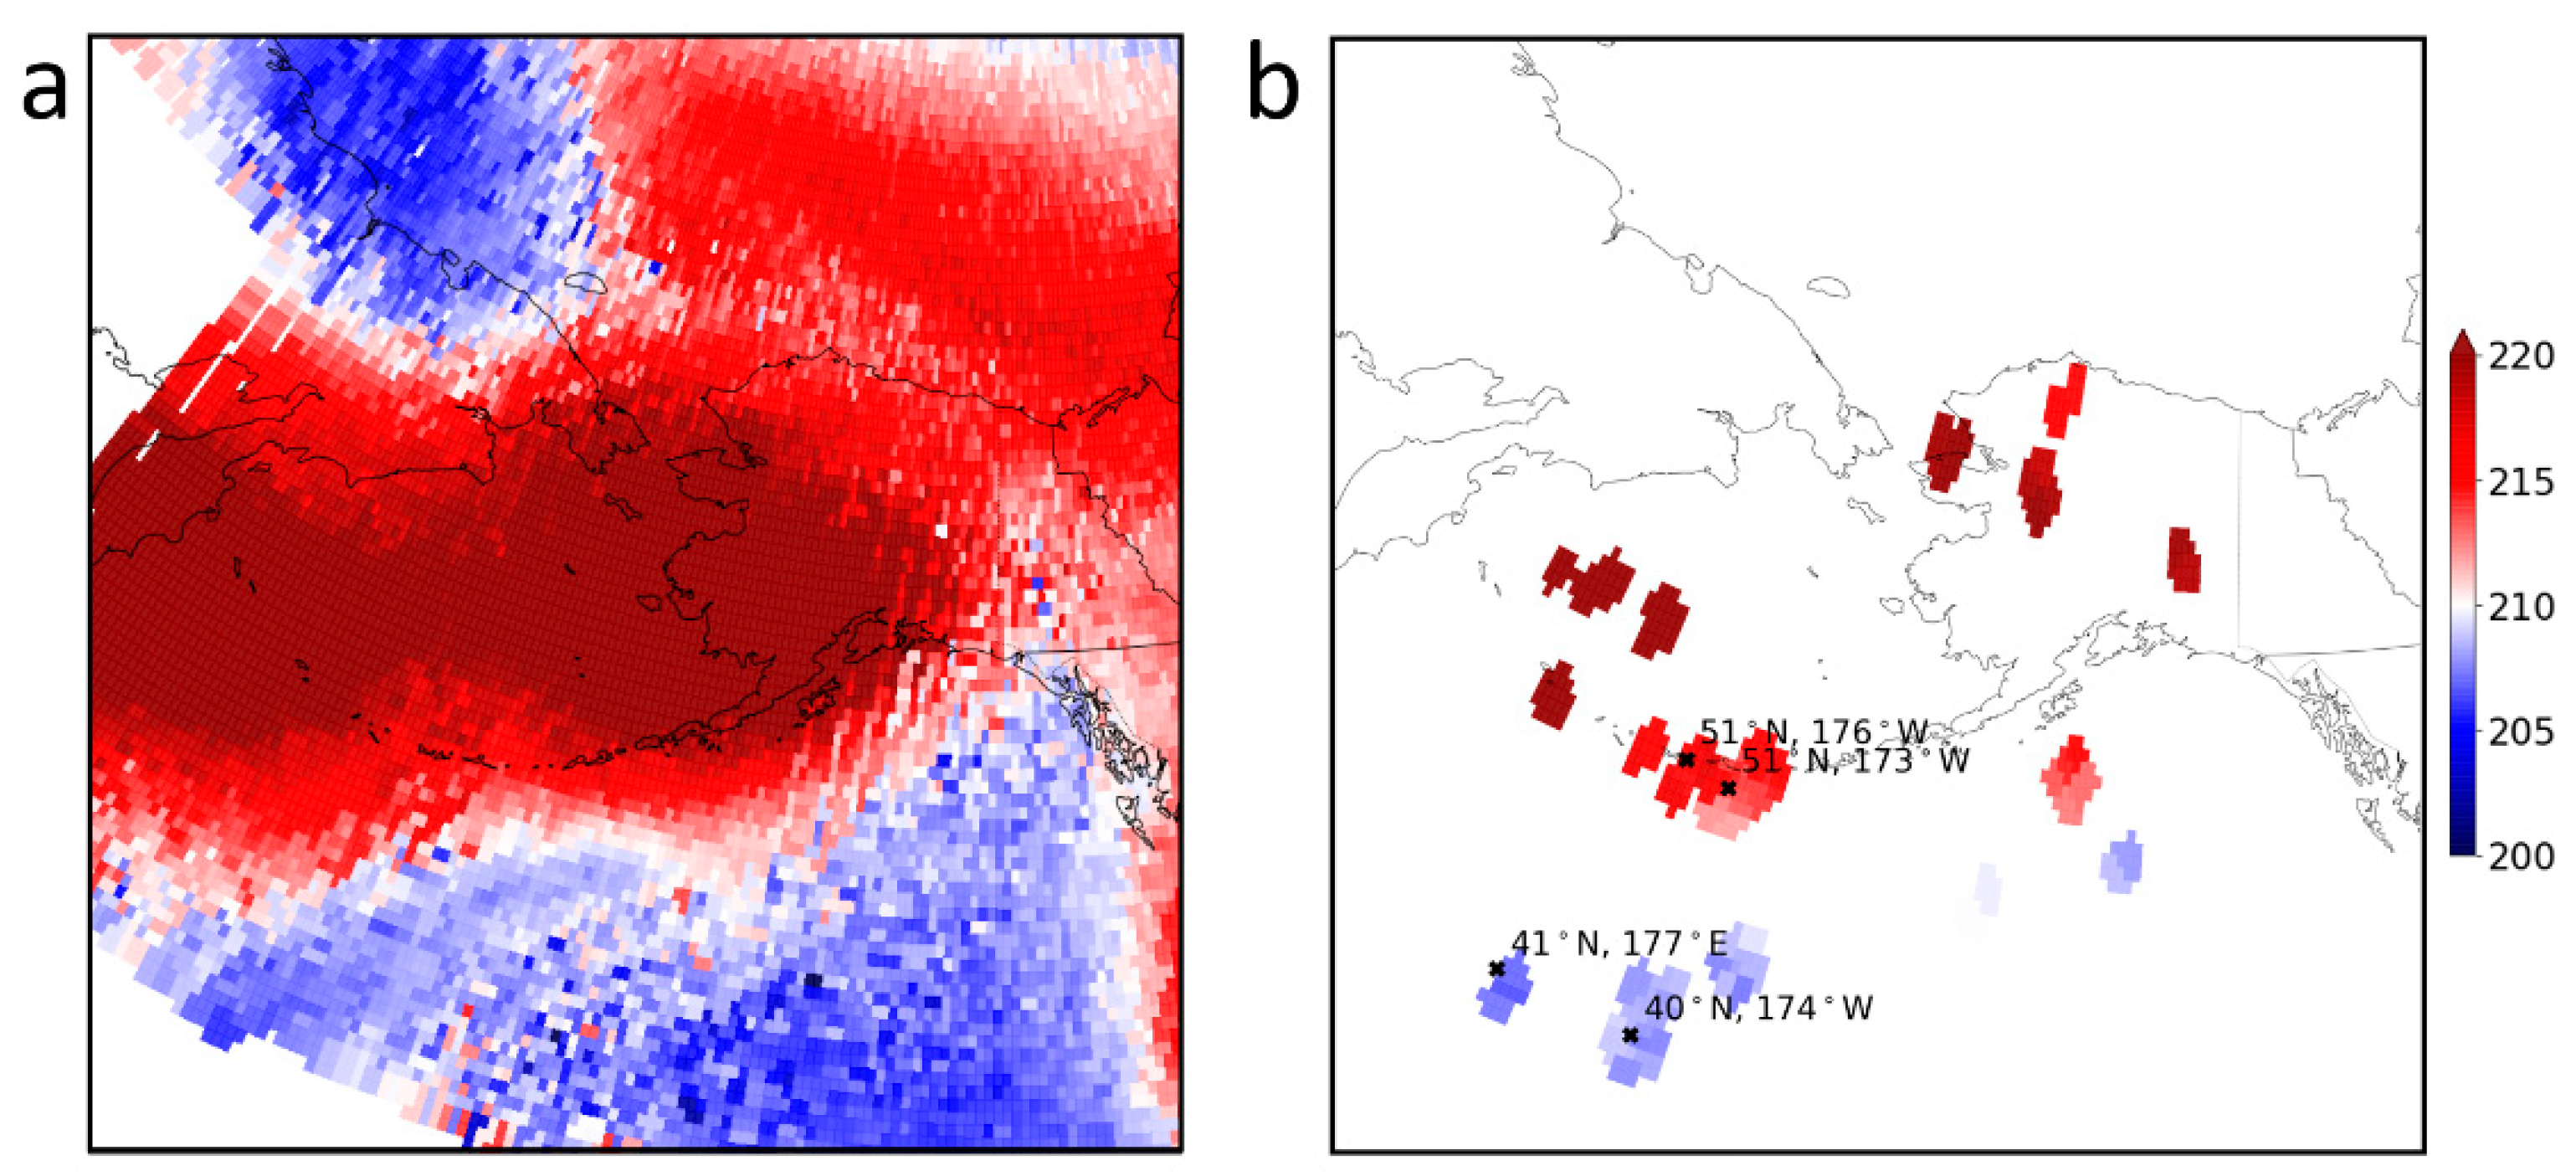
In this section, we describe how profiles were collocated in time and space (matchups) in a way that temperature profiles from NUCAPS and COSMIC are comparable. We examine all NUCAPS profiles within 150 km of the retrieved COSMIC. This radius was selected to represent the maximum FOR diameter of NUCAPS, which is ~150 km at the scan edge and ~50 km at nadir in the Tropics. As a result, there will be more matches profiles at the smaller scan angles. The study performed by [26] shows relative insensitivity in the bias and root mean square error between sounding and COSMIC temperature retrievals when compared using a variety of horizontal matching techniques. CAA events can last from hours to days [3], so we matched all profiles retrieved within the same calendar day. Figure 3a shows an example of NUCAPS temperature retrievals along the 200 hPa isobar on 26 February 2018 over the study domain (40–80° N, 169° E–131° W). For clarity, these temperature values were projected onto a 0.5° × 0.5° grid in this figure. Blue coloring shows where the air temperature is below 208 K and indicates the presence of CAA, which can extend for thousands of square kilometers. These isobaric slices are displayed using the same procedure as Gridded NUCAPS [7], which is the primary visualization for CAA in AWIPS during operational forecasting. Figure 3b is the same as Figure 3a, but only showing the matchups between NUCAPS and COSMIC that meet the criteria that we defined for this study.

3. Results

3.1. Evaluating NUCAPS Skill in Detecting CAA

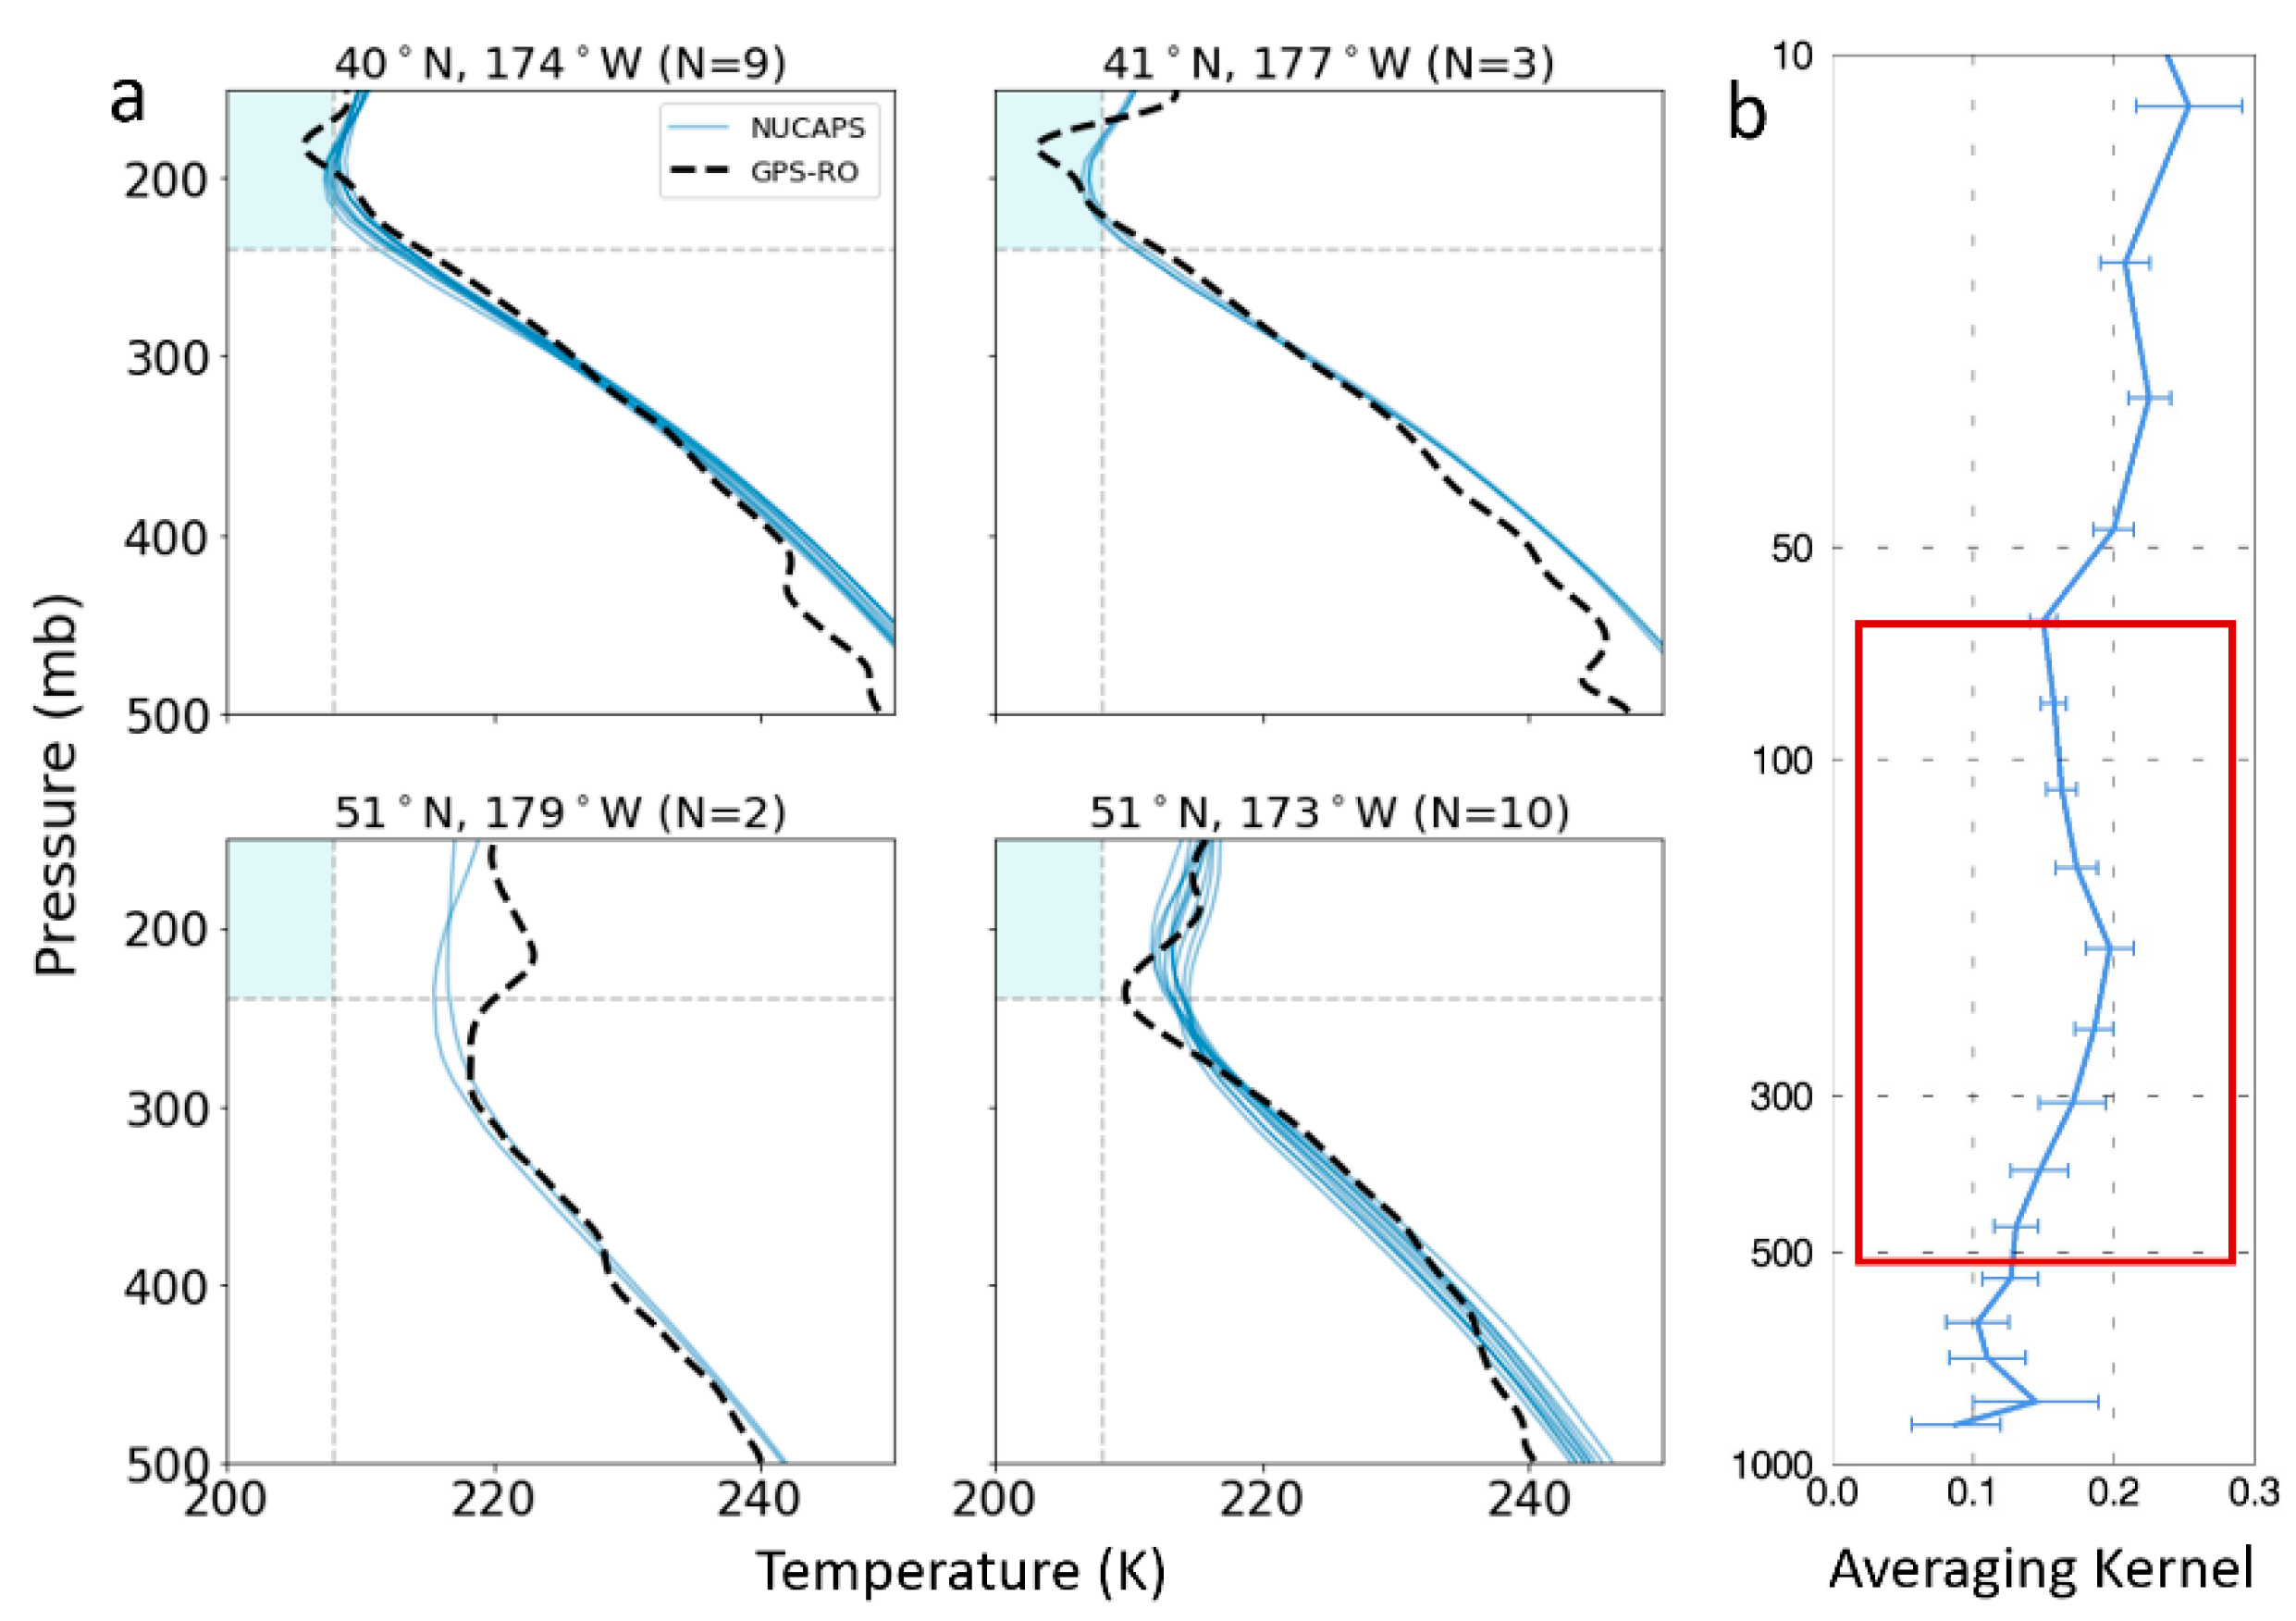
Figure 4a shows four profiles from the 19 matchups between COSMIC (black dashed line) and NUCAPS (solid blue lines) from 26 February 2018. When compared to Figure 2, COSMIC and NUCAPS temperature profiles are much smoother than radiosondes since both products have a lower vertical resolution. The shaded blue box in Figure 4a indicates the temperature and pressure criteria for CAA. If either the COSMIC profile or any one of the NUCAPS profiles enters the blue box, then CAA is detected. The top two panels show profiles where CAA is detected in both COSMIC and NUCAPS while the bottom two show where CAA is not present in either product. In this study, we examined 1311 NUCAPS and COSMIC matchups, of which 236 COSMIC profiles detected CAA. NUCAPS profile matchup counts vary due to quality control and scan angle, since we only use profiles where the combined infrared and microwave retrievals was successful and there are more potential NUCAPS matches at nadir than at the scan edge (see Section 2.1).
It is helpful to understand NUCAPS skill in retrieving air temperature as a function of pressure. As described in Section 2.1, the unitless AKMs help diagnose how much information is contributed to the retrieved variable from the observed radiances. As noted above, low AKM values indicate that the retrieved variable will more closely resemble the a priori. In contrast, higher AKM values indicate vertical levels where the radiances more significantly contribute to the retrieved value. Figure 4b shows the air temperature mean of the AKM diagonal as a function of pressure in the study region on 26 February 2018, which was displayed from an offline calculation of NUCAPS. Through the entire column, NUCAPS has some skill in measuring air temperature. Within the solid red box (500 to 150 hPa), the AKM ranges from 0.15 to 0.20. Note that while AKMs are always calculated in NUCAPS, they are not routinely written to the operational NUCAPS product and are thus not available for use in forecasting. In Section 3.2, we will instead examine the degrees of freedom of the signal, the Trace of the AKM for the entire profile, which is available within the operational NUCAPS product.
NUCAPS’ skill was assessed using 236 COSMIC profiles that detected CAA using 90 days of matchups from January to March 2018. Table 1 shows the four possible states: True positive, true negative, false positive, and false negative. The first two “true” states indicate successful detection while the second two “false” states indicate failed detection. Our criteria “detected” was met if the NUCAPS air temperature fell below 208 K in any matchup profile for at least one pressure level between 500 hPa and 75 hPa. The pressure range is broader than commercial flight zones to account for daily variability in the tropopause height. COSMIC detected CAA if the air temperature fell below 208 K for at least one vertical level in the same pressure range. If all air temperatures were above 208 K between 500 hPa and 75 hPa, the profile is classified as “Not Detected.”
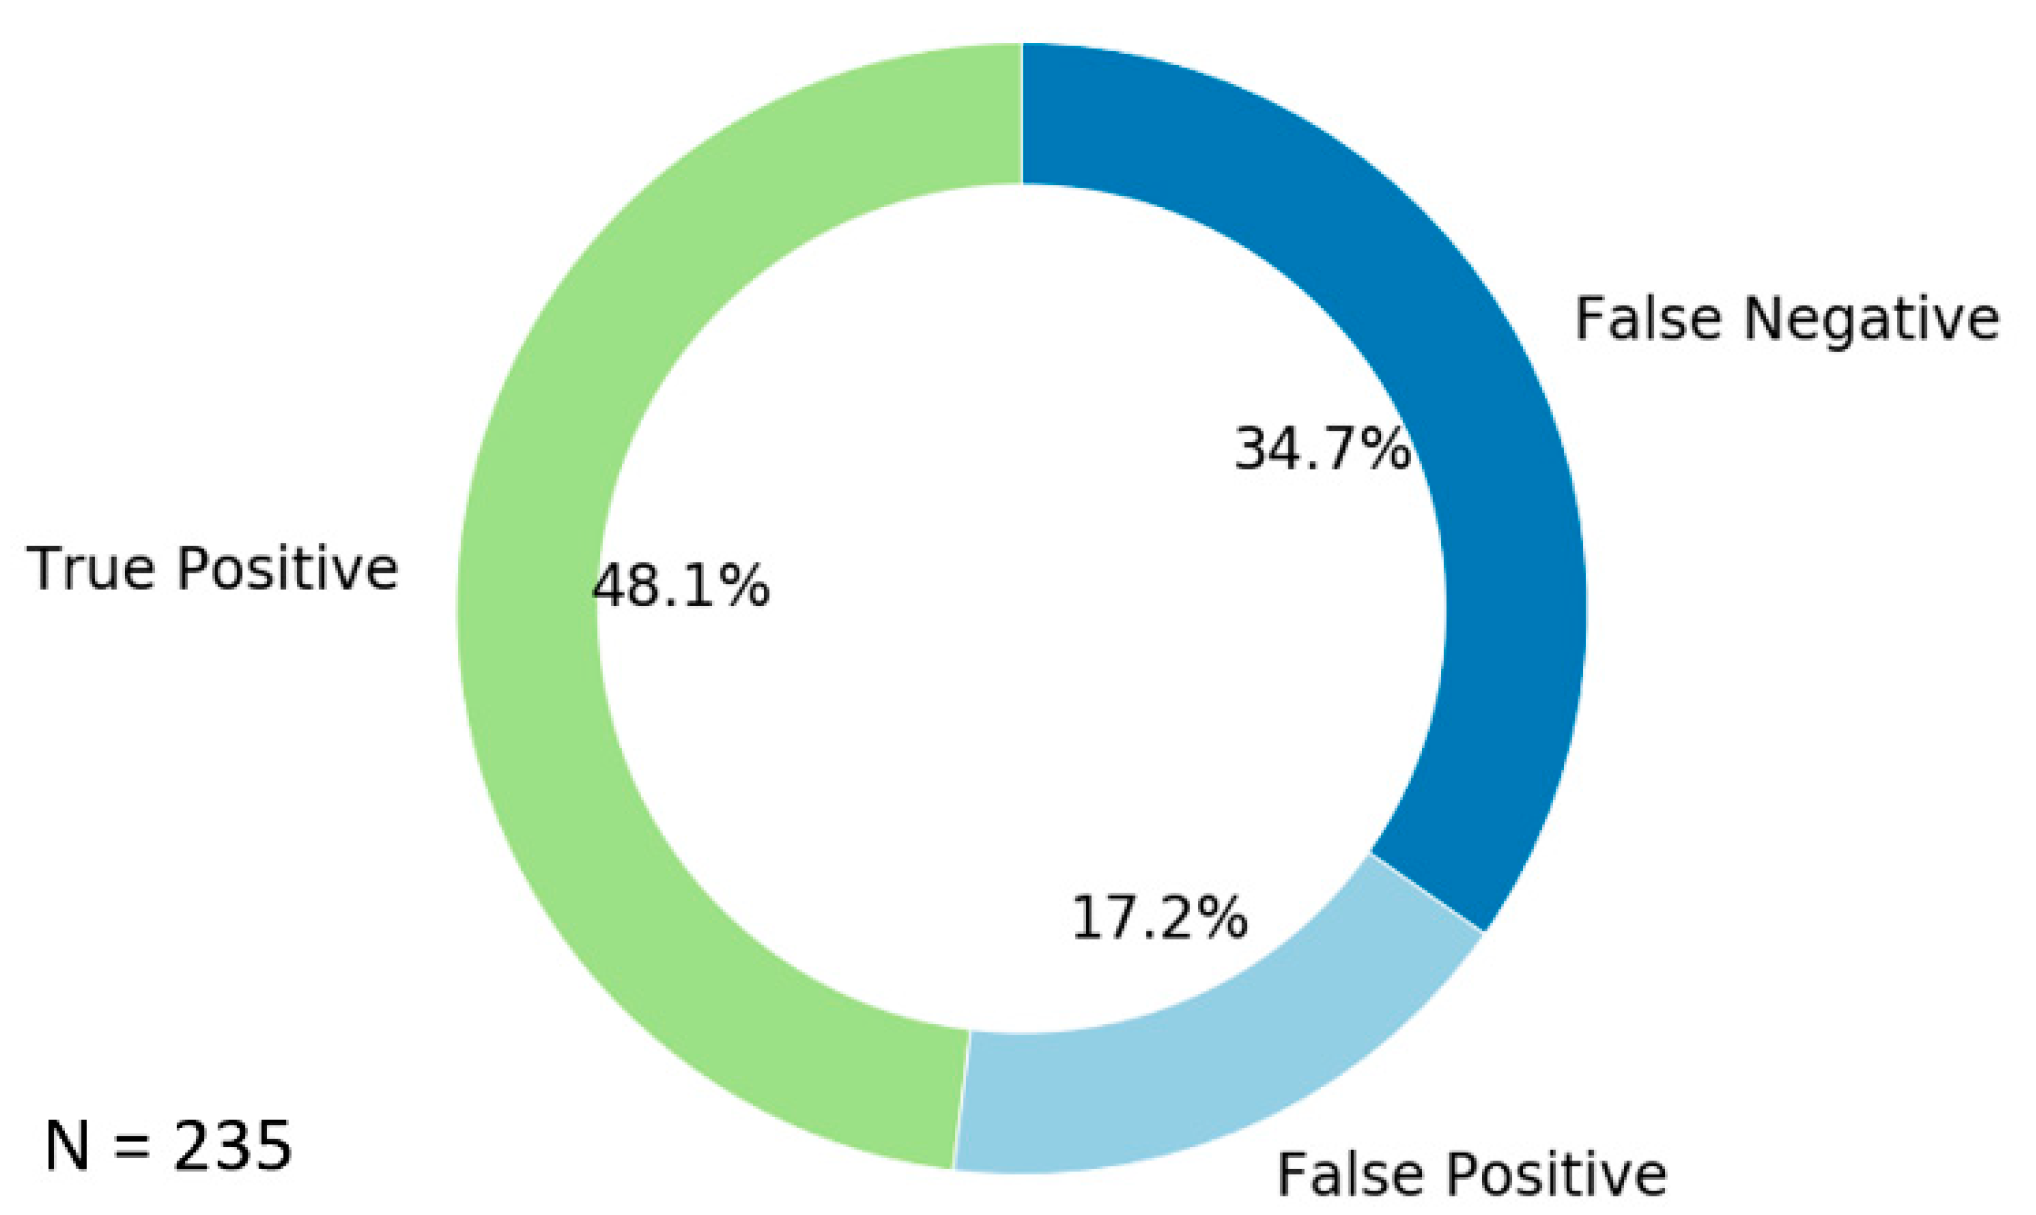
Figure 5 shows NUCAPS correctly detected CAA 48.1% (true positive) of the time, incorrectly detected CAA 17.2% of the time (false positive), and incorrectly missed the CAA 34.7% (false negative). Most matchups are true negatives but are not included in the figure to better focus on the states that detect CAA. The approximately ~50% true positive rate means that NUCAPS has reasonable skill in detecting CAA for the study period. In the next section, we describe the causal relationship between CAA detection and the environmental factors that can impact NUCAPS retrieval quality.

3.2. Diagnosing Causes for True and False CAA Detection

We evaluate diagnostic metrics within NUCAPS to better explain why NUCAPS may succeed or fail to detect a CAA event. As mentioned in Section 2.1, NUCAPS generates diagnostic retrieval metrics that quantify information content and cloud clearing uncertainty [4]. These include:
  • “Degrees of freedom of temperature” (dof_temp): The Trace of the AKM helps to diagnose the vertical resolution of the temperature retrieval. High values indicate high vertical resolution and may better capture CAA events, particularly when cold air layers are not very thick. Low values of dof_temp indicate a lower vertical resolution and the resulting profiles may smooth the small-scale features in the temperature profile. While DOFs are useful diagnostic metrics, DOFs are total column values and do not describe the vertical resolution at specific pressure levels (e.g., between 250 and 100 hPa).
  • “Lapse Rate”: The lapse rate is the change in temperature with height in the atmosphere. In general, NUCAPS has larger uncertainty when the lapse rates are small. We categorize lapse rate into two pressure ranges that we identified as contributing to CAA detection, one between 250–100 hPa (lr250–100) and 500–250 hPa (lr500–250). Lr250–100 captures the atmospheric layer that typically contains the CAA, while lr500-250 is the “background” state and can influence the higher-level retrieval.
  • “Cloud fraction” (cloud_frac): NUCAPS retrieves Cloud fraction (with values ranging from 0 as ‘cloud free” to 1.0 as “full cloud cover”) for each FOV from cloudy radiance measurements, then adds the 3 × 3 FOV fractions into a total cloud fraction for the FOR. As mentioned in Section 2.1, NUCAPS employs cloud clearing to retrieve temperature soundings for each FOR, which is successful in clear to partly cloudy scenes. To ensure confidence in the final retrieval, NUCAPS quantifies and propagates all known sources of uncertainty, which includes uncertainty due to clouds. Under some conditions, however, cloud uncertainty can be difficult to quantify and the retrieved temperature profile becomes cloud contaminated such that the portion of the profile underneath the cloud is cooler than it should be. Cloud fraction, alone, is not an indicator of cloud uncertainty or contamination. For instance, the quality of temperature profiles can be very good even in 85% cloudy FORs. We use cloud fraction in this study to improve our situational awareness of the atmospheric at the scenes in question and not as a measure of retrieval quality.
  • “Chi-squared of cloud clearing” (eta_rej). For all channels used in the retrieved variable, eta_rej is the sum of the error in the cloud clearing radiance. Eta_rej is a function of the inverse of the derivative of the plank function for the channel as well as the difference between the estimated clear-sky radiance and the radiance that is calculated after the final cloud clearing step in NUCAPS. For scenes with high sensitivity (where dof_temp is high), smaller eta_rej values indicate that the cloud cleared radiance spectrum closely matches the estimated clear sky one and therefore likely has low cloud contamination (i.e., the radiative effects of clouds were accurately identified and removed). Values of eta_rej are high when NUCAPS fails to accurately detect and remove clouds during cloud clearing so the retrieved profiles become cloud contaminated. Cloud contamination often happens over cold scenes where the radiance signal is low and has weak sensitivity to temperature at multiple layers. Cloud contamination also can occur where the temperature difference between cloud tops and the snow-covered Earth surface are equivalent and hamper cloud detection. NUCAPS uses a threshold of 3.0 K for eta_rej as one of the metrics that informs its retrieval quality flag.
The above diagnostic metrics are objectively evaluated against the four possible detection states (true positive, true negative, false positive, false negative) using a logistic regression, which is given by
log ( p 1 p ) = β 0 + β 1 x 1 + β 2 x 2 + + β n x n
where p is the probability, βi is the regression coefficient, and xi are the are diagnostic parameters. While useful for fitting data to binary outcomes, the resulting coefficients (β0, β1, β2−) from the logistic regression describe the log of the odds ratio (p/(1 − p)), which is difficult to interpret. Thus, we exponentiated all terms to obtain the odds ratios:
P 1 p = exp ( β 0 + β 1 x 1 + β 2 x 2 + + β n x n )
The odds ratio in Equation (2) can be interpreted as “the probability of success to the probability of failure”. Exponential coefficients show the percent increase in the odds of the state being true. So, if an exponential coefficient is greater than one, that variable will “increase” the odds, whereas exponential coefficients less than one “decrease” the odds of the state being true. For cases where the exponential coefficient is equal to one, there is little impact on the odds of state occurring. To simplify our discussion, we will describe our results in terms of how diagnostic metrics increase the odds of the state being true. The exponential coefficients were tested for statistical significance (<0.05 of the null hypothesis) using the z score. We use the statistically significant exponential coefficients to examine the relationship between NUCAPS diagnostic metrics and CAA detection states.
Figure 6 shows the results of the multinomial logistic regression for the true positive, true negative, false positive, and false negative detection states. The true positive (top left, N = 137) state is more likely for profiles with lower values of eta_rej. As described earlier, lower values of eta_rej indicate lower systematic uncertainty due to clouds, which in turn appears to improve NUCAPS’ detection of CAA. Larger lapse rate values (lr250–100 and lr500–200) also increase the odds of the true positive state. This is expected since measurement errors are lower when lapse rates are higher. Finally, low values of dof_temp increase the odds of the true positive state. However, DOF is a full column metric so it is not possible to determine which pressure levels in the column experience a decrease in the vertical resolution. For instance, there could be a decrease in the vertical resolution below 500 hPa, which would not impact CAA detection. So, while the relationship is statistically significant, it is not possible determine why this association is present without examining the full AKM, which is not available in the operational product.
Most matchups (N = 1026) fall into the true negative state (top right). Since this is most cases, the true negative state is useful for examining what these diagnostic metrics typically look like for successful retrievals in study region. Increases in the dof_temp metric strongly influences the true negative state. We can in general say that true negative profiles have higher information content than the other states.
The next two “false” states are cases where NUCAPS failed to accurately detect CAA. High cloud_frac values have roughly a 280% increase on the odds ratio of the false negative state (bottom left, N = 99). However, the odds ratio for the false negative state also increases when eta_rej values are smaller. Thus, high cloud_frac values may impact the upper level detection of air temperature in NUCAPS, even when uncertainty due to the clouds (eta_rej) is low.
Finally, the false positive (bottom right) state included 49 matchups, the smallest sample of the four states. Lower dof_temp values increased the odds of false positive state by ~60%, while higher eta_rej values increased the odds of falsely detecting CAA by ~150%. This can mean that the false positive state is a result of a poor cloud clearing fit. eta_rej values can be large because of instrument noise, a poor a priori, or from undetected clouds. Instrument noise can potentially be ruled out because the lapse rates appear to have little impact on the false positive odds ratio. The odds of the false positive state increases with both low information content (from low dof_temp) and a lower presence of clouds (low cloud_frac), so a poor a priori may be the cause of false positives. However, it is also possible that there is cloud contamination (leading a low cloud_frac), thereby increasing eta_rej for the case. In either case, the salient feature of the false positive state is a high eta_rej and a low cloud_frac.
In contrast to the true detection states, the two false detection states have prominent features. The odds of the false negative state are strongly increased for cases with a high cloud_frac and low eta_rej, while the converse is true for the false positive. The odds of both false states increase with lower dof_temp values, especially for the false positive state. In summary, each detection state has a very different relationship with the diagnostic parameters that are available in operational NUCAPS. In the next section, we will discuss some ways that this information can be useful in operational forecasting of CAA.

4. Discussion

It can be challenging to effectively communicate what, when, and where observations have skill to forecasters [27,28,29]. For developers, NUCAPS provides a series of metrics to understand the sources in their uncertainty and diagnose which algorithm steps did not pass QC. A simplified NUCAPS quality control flag was developed for the NWS, which identifies where the combined IR and MW retrieval passed, where the MW-only passed, or where neither passed [15]. This quality control is assigned to the full profile, but primary degradation will occur because of clouds, and thus have a greater impact on the lower troposphere (below 500 hPa). The assessment of CAA may require a different quality indicator altogether, as CAA occurs in the upper troposphere and lower stratosphere (above 500 hPa). From Figure 6 and the corresponding discussion in Section 3, the diagnostic metrics are very different for the CAA detection states and are, in theory, potentially useful for diagnosing the retrieval quality. However, in operations, forecasters do not have time to perform a complex assessment of these diagnostic parameters. Instead, we recommend the development of a simplified quality control for CAA based on the parameters evaluated in this study.
More orbits may improve both the data quality and utility for forecasters: When combined, the true positive and false positive made up 65.3% of matchups examined. The occurrence of false negative cases (the remaining 34.7%) can be mitigated by including more satellites. For example, if underlying cloud scene changes between overpasses, the retrieval skill may improve and provide updated guidance to forecasters on CAA detection. High latitude regions get more frequent LEO satellite overpasses than midlatitudes, so even one additional satellite will produce significantly more observations to detect CAA [30]. At present, there are web-based tools that blend all available sounders to monitor CAA [31] whereas only a single satellite (Suomi NPP priori to March 2019 and NOAA-20 since August 2019) is available NWS forecasters through the SBN.
There are some caveats to the analysis presented in this paper. The COSMIC data that is used as truth may not be directly comparable to NUCAPS. For instance, in the tropics, COSMIC measurements are limb views and average over ~200 km while the sounder FOR is between 50 and 150 km. Spatial mismatches can produce biases of 1 K between COSMIC and sounder datasets in high latitudes [26]. Furthermore, not all instances of CAA pose an aviation hazard. For example, if the layer of cold air is thin, it poses little risk to aircraft and would be below the detection capabilities of NUCAPS, which has 1–3 km vertical resolution depending on the pressure layer. Furthermore, diagnostics in this study were performed on pressure levels, not flight altitude. The cold air may have existed outside of the commercial flight zone. Nonetheless, 8 out of 18 CWSU forecasters who visually inspected NWP model and in situ data said they had high confidence in NUCAPS for CAA detection [3]. While our evaluation criteria may not exactly match those used in operational forecasting, the ~50% correct detection rate in this study is consistent with forecaster evaluation and they found value in using NUCAPS for CAA detection.

5. Summary and Conclusions

NUCAPS globally retrieves temperature, water vapor, and trace gas profiles for operational weather forecasting. Through developer and user partnerships, new and innovative uses of the data have been discovered, such as CAA detection in aviation weather. NUCAPS has minimal reliance on non-sounder data sources and, as a result, retrievals are independent of NWP models. Thus, it is feasible for forecasters use NUCAPS, alongside traditional observations such as radiosondes and AMDAR, to compare with NWP model forecasts to monitor CAA. NUCAPS was designed to be globally relevant and not tailored for specific applications, so it is important to evaluate NUCAPS skill for specific phenomena like CAA detection for aviation forecasts.
In this study, we compared NUCAPS with COSMIC profiles from January to March 2018 to see if CAA was detected in either profile. Four detection states (true positive, true negative, false positive, and false negative) were used to categorize the collocated profiles. When compared with COSMIC data, we found NUCAPS successfully detected CAA for 48.2% of profiles (true positive), false detected CAA for 17.2% of profiles (false positive) and did not capture CAA for 34.7% of profiles (false negative). These results were consistent with forecaster inspection of the data over the same time period.
To determine some of the underlying conditions that led to these outcomes, we examined several diagnostic metrics produced in the operational NUCAPS file (the degrees of freedom of temperature, cloud fraction, chi squared of cloud clearing, and lapse rates) using a multinomial logistic regression. We found that diagnostic metrics that indicated successful cloud clearing (where the radiative effects of clouds are removed) increased the odds of the true positive and false negative states, whereas diagnostics that lead to failed cloud clearing and low information content may contribute to an increase in false positive cases.
As the false positive cases represented the fewest matchups, including more sounder orbits may help improve situational awareness of CAA. Between satellite overpasses, the underlying conditions may change rapidly and become more favorable to the retrieval. While up to five additional satellites could be utilized for CAA monitoring, only one satellite is presently available in the SBN, which is the primary means of data access for the NWS. For severe weather forecasting, 60% of forecasters requested more satellite sounders to improve situations [8]. So, increasing sounding availability can support other NWS needs.
Finally, our results show that the diagnostics metrics were different for each for the four detection states. We propose that in the future, NUCAPS developers collaborate with forecasters to develop a CAA-specific quality control flag. While the diagnostic metrics shown in this study are useful for developers, NWS forecasters work in a fast-paced environment and do not have time to perform a complex assessments of data quality. A simplified quality control flag can increase the utility of NUCAPS for CAA detection and can help increase forecaster confidence in the product. The results in this study suggest that a simplified quality control flag is feasible and is an example of how developers can refine data products to meet aviation forecaster needs.

Author Contributions

Conceptualization, R.E., N.S., and M.S.; methodology, R.E. and M.S.; software, R.E.; writing—original draft preparation, R.E., N.S., and C.B.; writing—review and editing, R.E., N.S., C.B., and M.S.; visualization, R.E.; supervision, N.S.; project administration, N.S.; funding acquisition, M.S. and C.B. All authors have read and agreed to the published version of the manuscript.

Funding

This research was funded through the Joint Polar Satellite System (JPSS) Proving Ground and Risk Reduction Program (PGRR) and by the United States Air Force. The publication costs were paid for by Science and Technology Corp.

Acknowledgments

The authors would like to thank JPSS Sounding Initiative for fostering collaboration between product developers and data users to improve the research-to-operations feedback loop. In addition, we thank Science and Technology Corp for funding publication costs, thereby supporting open-access to scientific research.

Conflicts of Interest

The authors declare no conflict of interest.

References

  1. Nav Canada. Polar Routes—Past, Present and Future. Available online: https://blog.navcanada.ca/polar-routes-past-present-future/ (accessed on 15 April 2019).
  2. Hoinka, K.P. Statistics of the Global Tropopause Pressure. Mon. Weather Rev. 1998, 126, 3303–3325. [Google Scholar] [CrossRef]
  3. Weaver, G.M.; Smith, N.; Berndt, E.B.; White, K.D.; Dostalek, J.F.; Zavodsky, B.T. Addressing the Cold Air Aloft Aviation Challenge with Satellite Sounding Observations. J. Oper. Meteorol. 2019, 138–152. [Google Scholar] [CrossRef]
  4. Susskind, J.; Barnet, C.D.; Blaisdell, J.M. Retrieval of atmospheric and surface parameters from AIRS/AMSU/HSB data in the presence of clouds. IEEE Trans. Geosci. Remote Sens. 2003, 41, 390–409. [Google Scholar] [CrossRef]
  5. Gambacorta, A.; Barnet, C.D. Methodology and Information Content of the NOAA NESDIS Operational Channel Selection for the Cross-Track Infrared Sounder (CrIS). IEEE Trans. Geosci. Remote Sens. 2012, 51, 3207–3216. [Google Scholar] [CrossRef]
  6. Gambacorta, A.; Nalli, N.R.; Barnet, C.D.; Tan, C.; Iturbide-Sanchez, F.; Zhang, K. The NOAA Unique Combined Atmospheric Processing System (NUCAPS) Algorithm Theoretical Basis Document. 2017. Available online: https://www.star.nesdis.noaa.gov/jpss/documents/ATBD/ATBD_NUCAPS_v2.0.pdf (accessed on 14 December 2020).
  7. Berndt, E.; Smith, N.; Burks, J.; White, K.; Esmaili, R.; Kuciauskas, A.; Duran, E.; Allen, R.; LaFontaine, F.; Szkodzinski, J. Gridded Satellite Sounding Retrievals in Operational Weather Forecasting: Product Description and Emerging Applications. Remote Sens. 2020, 12, 3311. [Google Scholar] [CrossRef]
  8. Esmaili, R.B.; Smith, N.; Berndt, E.B.; Dostalek, J.F.; Kahn, B.H.; White, K.; Barnet, C.D.; Sjoberg, W.; Goldberg, M. Adapting Satellite Soundings for Operational Forecasting within the Hazardous Weather Testbed. Remote Sens. 2020, 12, 886. [Google Scholar] [CrossRef] [Green Version]
  9. Nalli, N.R.; Gambacorta, A.; Liu, Q.; Barnet, C.D.; Tan, C.; Iturbide-Sanchez, F.; Reale, T.; Sun, B.; Wilson, M.; Borg, L.; et al. Validation of Atmospheric Profile Retrievals from the SNPP NOAA-Unique Combined Atmospheric Processing System. Part 1: Temperature and Moisture. IEEE Trans. Geosci. Remote Sens. 2018, 56, 180–190. [Google Scholar] [CrossRef]
  10. Sun, B.; Reale, A.; Tilley, F.H.; Pettey, M.E.; Nalli, N.R.; Barnet, C.D. Assessment of NUCAPS S-NPP CrIS/ATMS Sounding Products Using Reference and Conventional Radiosonde Observations. IEEE J. Sel. Top. Appl. Earth Obs. Remote Sens. 2017, 10, 2499–2509. [Google Scholar] [CrossRef]
  11. World Meteorological Organization (WMO). Guide to Aircraft-Based Observations, 2017th ed.; WMO: Geneva, Switzerland, 2017; ISBN 978-92-63-11200-2. [Google Scholar]
  12. NOAA. Soundings from ESRL/GSD. Available online: https://rucsoundings.noaa.gov/ (accessed on 7 November 2020).
  13. NOAA Radiosonde Observation. Available online: https://www.weather.gov/upperair/factsheet (accessed on 7 November 2020).
  14. Fett, R.W.; Englebretson, R.E.; Perryman, D.C. Forecasters Handbook for the Bering Sea, Aleutian Islands, and Gulf of Alaska; Defense Technical Information Center: Fort Belvoir, VA, USA, 1993. [Google Scholar]
  15. Esmaili, R. NUCAPS Quality Flag Quick Guide. Available online: https://weather.msfc.nasa.gov/nucaps/qg/NUCAPS-QF-quick-guide.pdf (accessed on 3 November 2020).
  16. Rodgers, C.D. Inverse Methods for Atmospheric Sounding: Theory and Practice; Series on Atmospheric Oceanic and Planetary Physics; Reprinted; World Scientific: Singapore, 2004; ISBN 978-981-02-2740-1. [Google Scholar]
  17. NOAA/STAR. Validated Maturity Science Review For NOAA-20 NUCAPS Algorithm. 2019. Available online: https://www.star.nesdis.noaa.gov/jpss/documents/AMM/N20/NUCAPS_Validated_CH4_Provisional.pdf (accessed on 14 December 2020).
  18. Smith, N.; Barnet, C.D. Uncertainty Characterization and Propagation in the Community Long-Term Infrared Microwave Combined Atmospheric Product System (CLIMCAPS). Remote Sens. 2019, 11, 1227. [Google Scholar] [CrossRef] [Green Version]
  19. Smith, N.; Barnet, C.D. CLIMCAPS Observing Capability for Temperature, Moisture and Trace Gases from AIRS/AMSU and CrIS/ATMS. Atmos. Meas. Tech. Discuss. 2020, 1–33. [Google Scholar] [CrossRef] [Green Version]
  20. Iturbide-Sanchez, F.; Liu, Q.; Gambacorta, A.; Barnet, C.; Nalli, N.R.; Tan, C.; Santos da Silva, S.R. Using averaging kernels to study the vertical resolution of nucaps temperature and water vapor. In Proceedings of the 2017 IEEE International Geoscience and Remote Sensing Symposium (IGARSS), Fort Worth, TX, USA, 23–28 July 2017; pp. 33–35. [Google Scholar]
  21. Ho, S.; Anthes, R.A.; Ao, C.O.; Healy, S.; Horanyi, A.; Hunt, D.; Mannucci, A.J.; Pedatella, N.; Randel, W.J.; Simmons, A.; et al. The COSMIC/FORMOSAT-3 Radio Occultation Mission after 12 Years: Accomplishments, Remaining Challenges, and Potential Impacts of COSMIC-2. Bull. Am. Meteorol. Soc. 2020, 101, E1107–E1136. [Google Scholar] [CrossRef] [Green Version]
  22. Anthes, R.A.; Bernhardt, P.A.; Chen, Y.; Cucurull, L.; Dymond, K.F.; Ector, D.; Healy, S.B.; Ho, S.-P.; Hunt, D.C.; Kuo, Y.-H.; et al. THE COSMIC/FORMOSAT-3 MISSION: Early Results. Bull. Am. Meteorol. Soc. 2008, 89, 313–333. [Google Scholar] [CrossRef]
  23. Schreiner, W.; Rocken, C.; Sokolovskiy, S.; Syndergaard, S.; Hunt, D. Estimates of the precision of GPS radio occultations from the COSMIC/FORMOSAT-3 mission. Geophys. Res. Lett. 2007, 34. [Google Scholar] [CrossRef] [Green Version]
  24. UCAR. CDAAC: COSMIC Data Analysis and Archive Center—Data Products. Available online: https://cdaac-www.cosmic.ucar.edu/cdaac/products.html (accessed on 17 November 2020).
  25. Feltz, M.L.; Knuteson, R.; Weisz, E.; Smith, N.; Feltz, W.; Ackerman, S.A. Towards Aiding Aviation Safety: Detection of Cold Air Aloft Using COSMIC RO and AIRS Hyperspectral IR Sounder (96th American Meteorological Society Annual Meeting). In Proceedings of the 12th Annual Symposium on New Generation Operational Environmental Satellite Systems, New Orleans, LA, USA, 10–14 January 2016. [Google Scholar]
  26. Feltz, M.; Knuteson, R.O.; Revercomb, H.E.; Tobin, D.C. A methodology for the validation of temperature profiles from hyperspectral infrared sounders using GPS radio occultation: Experience with AIRS and COSMIC. J. Geophys. Res. Atmos. 2014, 119, 1680–1691. [Google Scholar] [CrossRef]
  27. Morss, R.E.; Demuth, J.L.; Lazo, J.K. Communicating Uncertainty in Weather Forecasts: A Survey of the U.S. Public Weather Forecast. 2008, 23, 974–991. [Google Scholar] [CrossRef]
  28. Hirschberg, P.A.; Abrams, E.; Bleistein, A.; Bua, W.; Monache, L.D.; Dulong, T.W.; Gaynor, J.E.; Glahn, B.; Hamill, T.M.; Hansen, J.A.; et al. A Weather and Climate Enterprise Strategic Implementation Plan for Generating and Communicating Forecast Uncertainty Information. Bull. Am. Meteorol. Soc. 2011, 92, 1651–1666. [Google Scholar] [CrossRef] [Green Version]
  29. Smith, N.; Shontz, K.; Barnet, C.D. What is a Satellite Measurement? Communicating Abstract Satellite Science Concepts to the World; AMS: Austin, TX, USA, 2018. [Google Scholar]
  30. SSEC Data Center Polar Orbit Tracks. Available online: https://www.ssec.wisc.edu/datacenter/orbit_tracks.html (accessed on 9 December 2020).
  31. CIRA. RAMMB: RAMSDIS Online—Cold Air Aloft. Available online: http://rammb.cira.colostate.edu/ramsdis/online/cold_air_aloft.asp (accessed on 3 November 2020).
Figure 1. (a) Illustration of how the tropopause height is lower in the poles. (b) Flights are often diverted when widespread Cold Air Aloft (CAA) is present in the upper troposphere and lower stratosphere, which coincides with commercial flight zones in high latitudes. Air temperatures below −65 °C can cause water within the jet fuel to freeze and common fuels begins to form wax crystals, which can reduce fuel efficiency or pose a safety hazard.
Atmosphere 11 01360 g001
Figure 2. Radiosonde temperature profiles from 14 Alaskan sites for February through March 2018. A total of 1180 profiles are shown. Radiosondes are released twice daily at 00 UTC and 12 UTC. Red points indicate where CAA is detected. The vertical layer between the two dashed lines in each plot shows the typical transpolar flight cruising altitudes, assuming a standard atmosphere.
Atmosphere 11 01360 g002
Figure 3. A National Oceanic and Atmospheric Administration Unique Combined Atmospheric Processing System (NUCAPS) horizontal slice along the 200 hPa isobar on 26 February 2018 over the study domain, 40–80° N, 169° E–131° W. (a) Several combined overpasses between 1100 and 1700 UTC and (b) matchups between with Constellation Observing System for Meteorology, Ionosphere, and Climate (COSMIC) profiles within 150 km for the same time period. Blue coloring indicates where the air temperature is below 208 K (−65 °C) to distinguish the presence of a CAA event. Profiles annotated in (b) are shown in Figure 4.
Atmosphere 11 01360 g003
Figure 4. (a) NUCAPS profiles showing the matchups between COSMIC (black dashed line) and NUCAPS (blue solid lines), where the shaded blue box indicates the temperature and pressure criteria for CAA. The profile locations are annotated in Figure 3. (b) The mean (solid line) and standard deviation (error bars) of the averaging kernel matrix (AKM) diagonal vectors are a function of pressure in the study domain on 26 February 2018.
Atmosphere 11 01360 g004
Figure 5. Percentage of matchup profiles between January and March 2018 for the true positive, false positive, and false negative CAA detection states that are summarized in Table 1. Profiles categorized as true negative are the most numerous (N = 1026) but for clarity, are not shown.
Atmosphere 11 01360 g005
Figure 6. Results for a logistic regression on diagnostic parameters for the four CAA detection states described in Table 1. X indicates diagnostic parameters that do not meet statistical significance requirements.
Atmosphere 11 01360 g006
Table 1. A summary of detection states. “Detected” indicates that a temperature of 208 K was detected within the profile for the listed product. COSMIC is the observational “truth” in this study.
StateNUCAPSCOSMIC
True PositiveDetectedDetected
True NegativeNot DetectedNot Detected
False NegativeNot DetectedDetected
False PositiveDetectedNot Detected
Publisher’s Note: MDPI stays neutral with regard to jurisdictional claims in published maps and institutional affiliations.